schedule xoxo - upv universitat politècnica de valència 2003 vsm for the lean office... ·...
TRANSCRIPT

Current State Future State
Date originated
Champion
Team
1st 2nd 3rd 4thLead Time Total CycleTime Kaizen Proposal
Metrics
Base Proposed Base Proposed Base Proposed Base Proposed Base Proposed Base Proposed
Started
Complete
Past Due
Value Stream Runnerroute
Mailshipment
Material push
Customer or supplier
QueueTime
Cart ExceptionDedicatedprocess
box
Sharedprocess
box
Manualinformation
flow
Super-market
Physicalmaterial
pull
Database Worker U-shapedcell
Kanban Safety resources
SS
BB
Buffer resources
FIFO lane
Max = XX
Supermarketparts
XOXO
Heijunkaleveling
Kaizen focus
1
1
2
3
4
6
6
7
1. Commit to Lean2. Choose the Value Stream3. Learn about Lean4. Map the Current State
5. Identify Lean Metrics6. Map the Future State7. Create Kaizen Plans8. Implement Kaizen Plans
85
Electronicinformation
flow
Pitch BoardSchedulebox
Schedule

Building a storyboard follows the 8-step Value Stream Management process.
Step 1: Commit to Lean
Enter the following information in the boxes provided in the upper left corner of the storyboard:
1. Start date of the project.
2. Name of champion.
3. Names of core implementation team members.
Step 2: Choose the Value Stream
Enter the name of the target value stream in the box provided (next to date).
Step 3: Learn about Lean
Review current obstacles to achieving a Lean state. Enter these items in the boxes above the ate map.
Step 4: Map the Current State
Post your current-state map in the appropriate box on the left side of the storyboard.
Step 5: Identify Lean Metrics
On the left side of the storyboard, below the current-state map, post the Lean metrics you will use, thebaseline measures, and the proposed six-month targets. You may want to use charts or graphs.
Step 6: Map the Future State
Post your future-state map in the appropriate box on the right side of the storyboard. In the area above
Step 7: Create a Kaizen Plan
Post your monthly kaizen plan on the right side of the storyboard—below the future-state map.
Value Stream Management Storyboard Worksheet
current-st
it, enter the lean tools/approaches you plan to use.
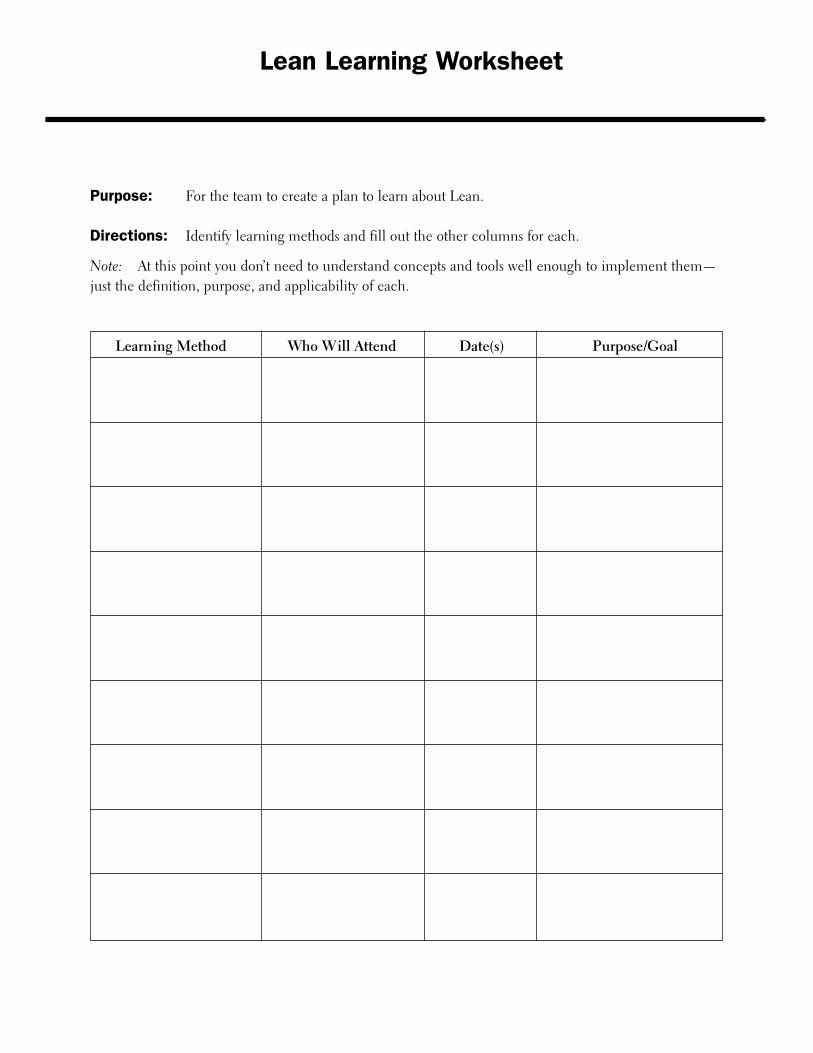
Purpose: For the team to create a plan to learn about Lean.
Directions: Identify learning methods and fill out the other columns for each.
Note: At this point you don’t need to understand concepts and tools well enough to implement them—just the definition, purpose, and applicability of each.
Lean Learning Worksheet
Learning Method Who Will Attend Date(s) Purpose/Goal

Purpose: To provide step-by-step guidelines during the mapping process.
Directions: Review these value stream guidelines before mapping the current state.
Before You Leave the Meeting Room• Gather as much data as possible before you start• Review and sketch the basic process steps before going to the work area• Communicate to all areas the purpose and activities of the team
Lean Attributes Reference Guide• Cycle times • Total time per workday • Planned downtime• Work disruptions/exceptions • Number of shifts • Quantity of work performed• Number of workers • Delivery schedules • Queue times
In the Work Area• Gather data at the source — at the work area (not from memory)• Introduce yourself to workers, show them what you are doing, ask them questions, and get
them involved• If you need to time a process, explain why you are doing this• Use as much “real” data as possible, or use an average from the last three months• Everyone should map the process or take notes while at the work area• Always draw the customer icon first, then the supplier icon, then the process.• Identify attributes for each operation or function and show them on the map• Draw both material and information flow• Think in terms of upstream and downstream flow
Back in the Meeting Room• Use a white board to create your drawing; when it’s complete, transfer it to paper• Draw in pencil• Select a scribe and combine your drawings• List and discuss the problems and wastes you detect• Try to discuss the situation in terms of demand, flow, and leveling• Be ready to make a 10-minute presentation to management if required
Mapping Guidelines—The Current State

These are icons you will need to create your current-st ate map.
Value Stream Icons for the Current-State Map
Meaning of Icon Icon
Customer or Supplier
Shared Process Box
Mail Delivery
Dedicated Process Box
Queue Time
Database (Excel, Access, etc.)
Electronic Information Flow
Manual Information Flow
Worker
Schedule
Exceptions or Disruptions
Push
Schedule

In addition to the icons already presented in Step 3: Mapping the Current State, you will needthese icons to map your demand focus.
Demand Phase Questions and Icons
Purpose Icon
Buffer Resources
Safety Resources
Kaizen Focus(Improvement activity)
BB
SS
Cart
Demand Phase Questions
• What is the demand? In other words, what is the takt time?
• Are you overproducing, underproducing, or meeting demand?
• Can you meet takt time (or pitch) with current administrative capabilities?
• Do you need administrative buffer resources? Where?
• Do you need administrative safety resources? Where?
• What problems need to be solved right now?
• Where does your office need organization, ordering, and cleaning? To what degree?
Demand Phase Icons

Note: This checklist is for Step 1: Commit to Lean. However, it can be used at any time. Add items tothe checklist if they will help you gauge the degree of management commitment to the project.
Rating system: 1 = Condition does not exist or exists to a low degree.2 = Condition exists somewhat.3 = Condition exists to a high degree.
Rating Condition
__________ Training. Time and resources have been allocated for training.
__________ Accountability. Responsibility and timing have been assigned.
__________ Incentives. An incentive program for success is in place.
__________ Vision. A clear vision has been articulated.
__________ Goals. Clear goals have been articulated.
__________ Process. Value Stream Management has been articulated.
__________ Budget. A budget has been assigned to the project.
__________ Visibility. Senior management is visibly in support of the project.
__________ ________________________________________________________
__________ ________________________________________________________
__________ ________________________________________________________
__________ ________________________________________________________
__________ ________________________________________________________
__________ ________________________________________________________
Management Commitment Checklist

Purpose: Determine a value stream with a variety of complex processes and work units.
Directions: 1. List types of work units and/or customers on the left axis.2. Record the volume of work performed for each in the column to the left.3. List downstream processes and activities on the bottom axis in the sequence in which
they occur.4. Indicate the processes that each type of work unit requires, and mark them in the appropriate
column(s).
5. Group together the work-unit types that share common processes.
Sequenced by Volume
Work-Unit Routing Analysis Worksheet
Work-Unit VolumeType
�
Process Flow:
Processes

Purpose: To help you plan for a benchmarking visit at another site.
Directions: If you use benchmarking you should follow the guidelines listed below.
Benchmarking Guidelines
• Be specific. Be specific in defining what you want to improve. You may want to improve your entire administrative operation, but you also may want to see specifically how a company uses supermarket concepts and kanbans.
• Be willing to share. Identify an area you think may be world class in your organization, if you can, and present that to the potential benchmark site as something you are willing to share with them.
• Make a win-win. Attempt to make it a win-win experience. Identify what’s in it for them! Offer something. Let them know that you are sincere.
’
• Know the site. Ensure that the benchmark team is familiar with some aspects of the company you will benchmark (what it produces or sells, size, etc.).
• Send questions. Fax or e-mail specific questions in advance to the benchmark company’s point person.
• Don’t go alone. Do not benchmark in isolation. It is always better to have a minimum of two memberson the benchmarking team.
• Document. Document and take notes as needed.
• Respect privacy. If some information is proprietary and cannot be released, respect that and move on.
• Dress appropriately. Be sure to discuss attire prior to the visit. Many companies have a “businesscasual” dress code, but make sure you never underdress.
• You can call. Consider conference calling if an on-site visit is not practical.
• Say “thanks”—a lot. Show appreciation to the benchmarking site host. Consider giving some company t-shirts, hats, or golf balls to the people you will be visiting.
• Follow up. Follow up with a letter to the host facility detailing what you found helpful. Again, offer tobe a benchmark site for them at any time in the future.
Benchmarking Worksheet

Continuous Flow Phase Questions and Icons
Purpose Icon
Kanban
Supermarket
U-Shaped Work Area (Cell)
Data Base Interaction
Physical Work-Unit Pull
FIFO
Continuous Flow Phase Questions
• Where can you apply continuous flow?
• What level of flow do you need?— One work unit?— Small lots of work units?
• What type and shape of cell design will you use?
• How will you control upstream work?
• Will you use kanban?
• Will you have in-process supermarkets?
• Will you apply FIFO?
• What other improvement methods will help to achieve continuous flow?
Continuous Flow-Phase IconsIn addition to the icons already presented in Step 3: Mapping the Current State and Step 6–Phase 1: Customer Demand, you will need these icons to map your focus on continuous flow.
Max = XX

Leveling Phase Questions and Icons
Purpose Icon
Heijunka BoxVolume/ Variety
Runner Route
Leveling Phase Questions
• How will work units be grouped to move through the value stream in a way that:---— Best represents customer demand?— Provides for process flexibility?
• How will kanban cards be distributed to ensure that integrity is maintained throughout the value stream?
• Where in the process will you schedule work requirements?
• What other improvement methods will help you achieve leveling?
In addition to the icons you used in Steps 4 and 6 to map the current state and the customer demand andcontinuous flow phases of the future state, you will need the following icons to complete the leveling phaseof your future-state map.
Pitch Board
XOXO
Leveling Phase Icons

Lean Questions
Demand Phase Questions
• What is the demand? In other words, what is the takt time?
• Are you overproducing, underproducing, or meeting demand?
• Can you meet takt time (or pitch) with current administrative capabilities?
• Do you need administrative buffer resources? Where?
• Do you need administrative safety resources? Where?
• What problems need to be solved right now?
• Where does your office need organization, ordering, and cleaning? To what degree?
Continuous Flow Phase Questions
• Where can you apply continuous flow?
• What level of flow do you need?— One work unit?— Small lots of work units?
• What type and shape of cell design will you use?
• How will you control upstream work?
• Will you use kanban?
• Will you have in process supermarkets?
• Will you apply FIFO?
• What other improvement methods will help to achieve continuous flow?
Leveling Phase Questions
• How will work units be grouped to move through the value stream in a way that:---— Best represents customer demand?— Provides for process flexibility?
• How will kanban cards be distributed to ensure that integrity is maintained throughout the value stream?
• Where in the process will you schedule work requirements?
• What other improvement methods will help you achieve leveling?

Value Stream Mapping Icons
Customer or Supplier Shared Process Box Mail Delivery Dedicated Process Box
Queue Time Database (Excel, Access, etc.)
Electronic Information Flow
Manual Information Flow
Worker
Schedule Exceptions or Disruptions Push
Schedule
Buffer Resources Safety Resources
Kaizen Focus(Improvement activity)
BB
SS
CartKanban Supermarket U-Shaped Work Area (Cell)
Physical Work-Unit Pull FIFO
Max = XX
Heijunka BoxVolume/ Variety
Runner Route Pitch Board
XOXO
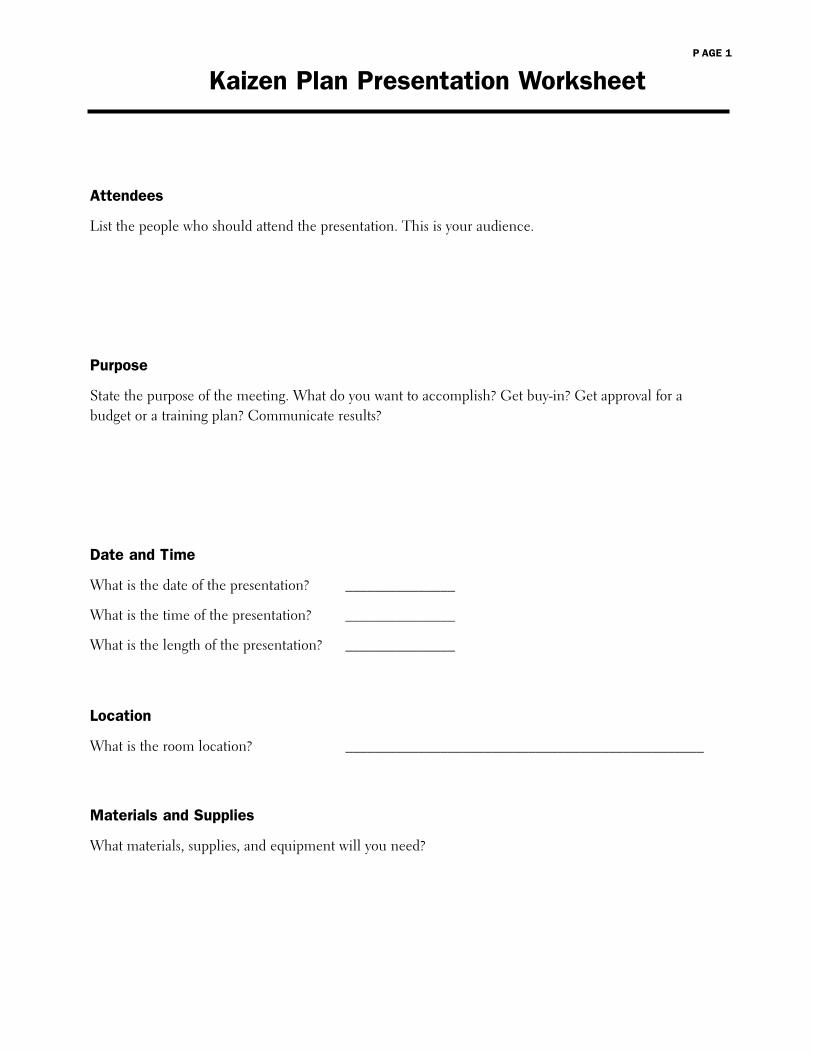
Attendees
List the people who should attend the presentation. This is your audience.
Purpose
State the purpose of the meeting. What do you want to accomplish? Get buy-in? Get approval for a budget or a training plan? Communicate results?
Date and Time
What is the date of the presentation? _______________
What is the time of the presentation? _______________
What is the length of the presentation? _______________
Location
What is the room location? _________________________________________________
Materials and Supplies
What materials, supplies, and equipment will you need?
Kaizen Plan Presentation WorksheetP AGE 1
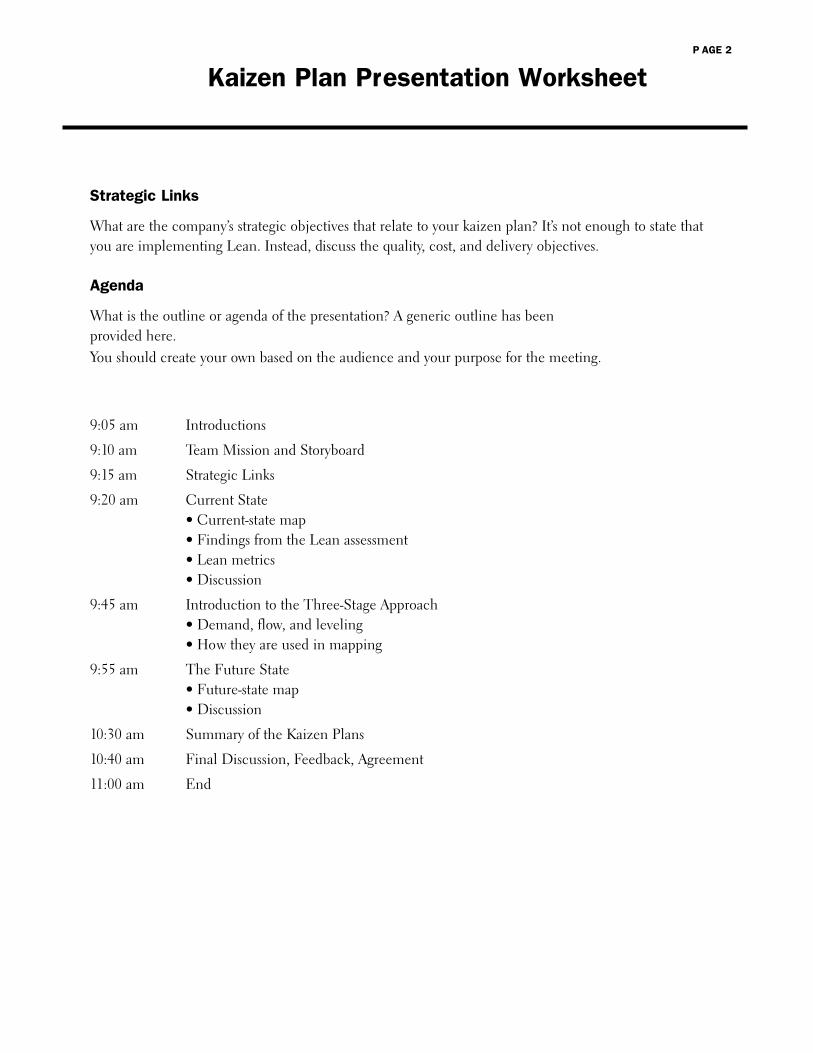
Strategic Links
What are the company’s strategic objectives that relate to your kaizen plan? It’s not enough to state thatyou are implementing Lean. Instead, discuss the quality, cost, and delivery objectives.
Agenda
What is the outline or agenda of the presentation? A generic outline has beenprovided here. You should create your own based on the audience and your purpose for the meeting.
9:05 am Introductions
9:10 am Team Mission and Storyboard
9:15 am Strategic Links
9:20 am Current State• Current-state map• Findings from the Lean assessment• Lean metrics• Discussion
9:45 am Introduction to the Three-Stage Approach• Demand, flow, and leveling• How they are used in mapping
9:55 am The Future State• Future-state map• Discussion
10:30 am Summary of the Kaizen Plans
10:40 am Final Discussion, Feedback, Agreement
11:00 am End
Kaizen Plan Presentation WorksheetP AGE 2
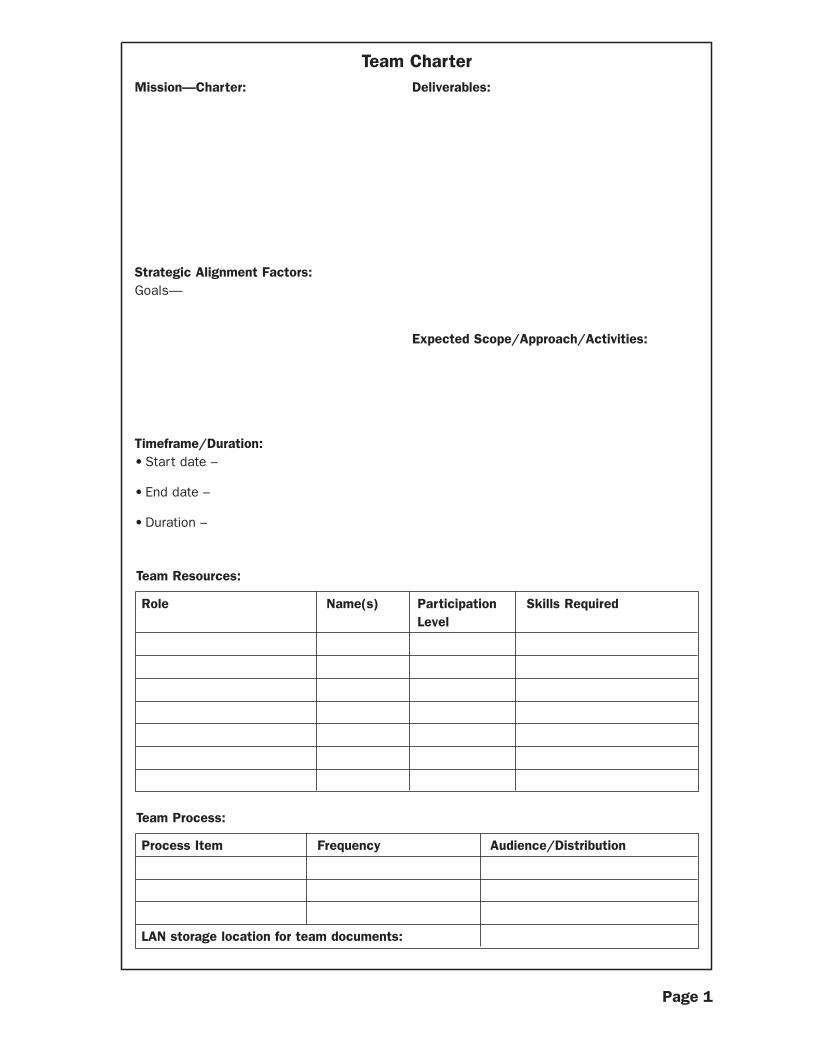
Team Charter
Team Resources:
Team Process:
Mission—Charter:
Strategic Alignment Factors:Goals—
Timeframe/Duration:• Start date –
• End date –
• Duration –
Deliverables:
Expected Scope/Approach/Activities:
Role Name(s) Participation Skills RequiredLevel
Process Item Frequency Audience/Distribution
LAN storage location for team documents:
Page 1

Team Charter, continuedExpected Results:
Key Customers and Suppliers:
Benefits Metrics (What results will be gained?) (How will the results be measured?)
1. 1.
2. 2.
3. 3.
4. 4.
5. 5.
6. 6.
Company Name (Ext.)Relationship Level
Reviewer(s)orFunctional Area (Int.) Customer Supplier Economic Operational User/Tech Names
External
Internal
Assumptions:
Risks:
Internal Issues:
External Issues:
Page 2

DISTRIBUTION
Participants Roles FYI (Copies To)
AGENDA
Time Item Who Duration
Additional Information
Meeting Information Form
MEETING:Date:Time: toPlace:Purpose:
Contents:Distribution�Agenda�Minutes�Action Items
MINUTES
Summary
Issues Agreements Reached
1,
2,

Discussion Notes
�Attachments
�
Date: Time: Place:
ACTION ITEMS
No. Action Item Assigned To Opened Due Status 1 2 3 4
Next Meeting
Meeting Information Form, page 2
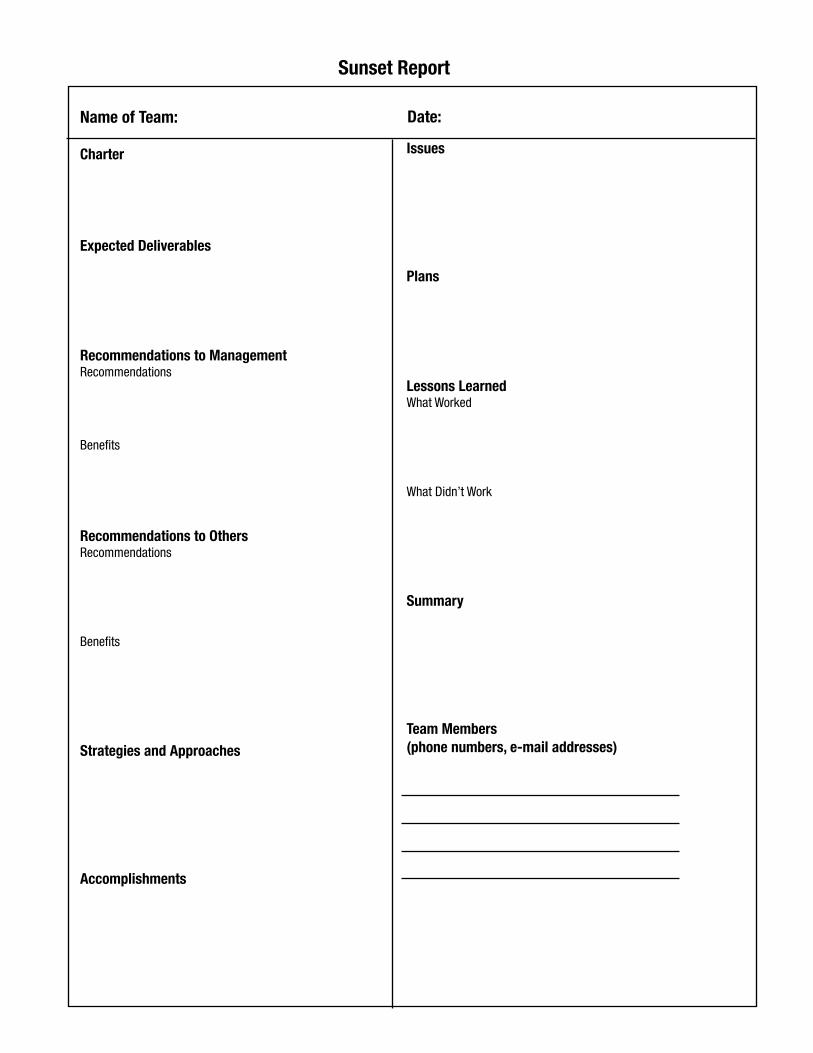
Name of Team:
Charter
�
Expected Deliverables
�
Recommendations to ManagementRecommendations
Benefits
Recommendations to OthersRecommendations
Benefits
Strategies and Approaches
Accomplishments
Issues
Plans
Lessons LearnedWhat Worked
What Didn’t Work
Summary
Team Members �(phone numbers, e-mail addresses)
Sunset Report
Date:
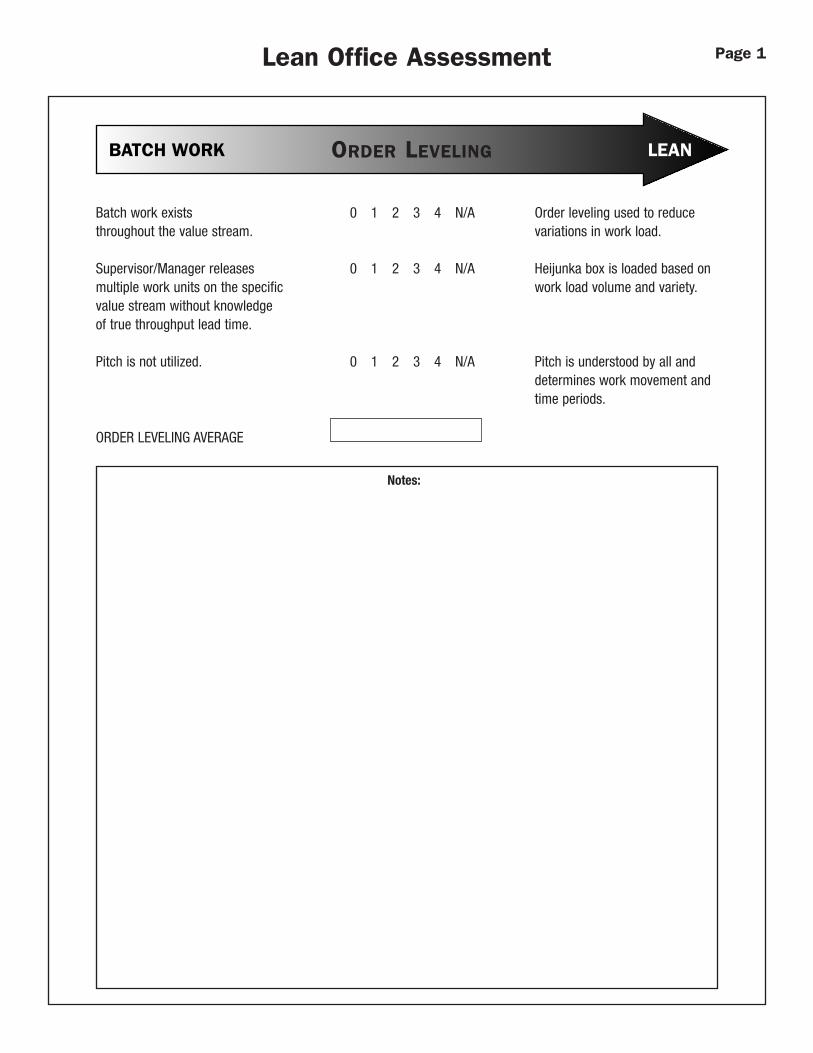
Lean Office Assessment Page 1
BATCH WORK LEANORDER LEVELING
Batch work exists 0 1 2 3 4 N/A Order leveling used to reduce throughout the value stream. variations in work load.
Supervisor/Manager releases 0 1 2 3 4 N/A Heijunka box is loaded based onmultiple work units on the specific work load volume and variety.value stream without knowledgeof true throughput lead time.
Pitch is not utilized. 0 1 2 3 4 N/A Pitch is understood by all anddetermines work movement andtime periods.
ORDER LEVELING AVERAGE
Notes:

Lean Office Assessment Page 2
BATCH WORK LEANWORK UNIT MOVEMENT
Delivery of work units 0 1 2 3 4 N/A Delivery of work units is is not to a schedule. scheduled. On-time delivery
performance is tracked, and isover 98%.
Work units wait an undetermined 0 1 2 3 4 N/A Work units are delivered to the amount of time. point of use.
Office material is stored in 0 1 2 3 4 N/A Office material is stored at mini central stores. stores near point of use.
No organized approach to the 0 1 2 3 4 N/A Work unit delivery throughout movement of work units through the workplace is based on the workplace. pull signals
Pull system is not in use 0 1 2 3 4 N/A Pull system fully implemented,between workers. maintained, and regularly
analyzed for appropriateness.
MATERIAL MOVEMENT AVERAGE
Notes:

Lean Office Assessment Page 3
BATCH WORK LEANCONTINUOUS WORK FLOW
Basic Value Stream concepts are not 0 1 2 3 4 N/A Process Value Stream Diagramsunderstood or in place. are current and reflect existing
process changes. High level ofcontinuous improvement activity.
Work Unit Cycle Time charting 0 1 2 3 4 N/A Documented Work Unit Cycleis not in use. TIme procedure is well
established. It has been reduced50% or more from baseline onspecified value stream.
Office work area set-up in 0 1 2 3 4 N/A Work area layout optimizes functional areas. integrated flow paths.
Standardized worksheets are 0 1 2 3 4 N/A Standardized worksheets are fully not in use. Manpower fixed developed and implemented.regardless of customer demand. Flexible manpower to respond to
changes in customer demand.
Work is pushed through the 0 1 2 3 4 N/A Pull system drives process workplace. outputs. Approaching one piece
work flow, manual transfer andflexible work areas.
WORK FLOW AVERAGE
Notes:

Lean Office Assessment Page 4
BATCH WORK LEANVISUAL CONTROLS
Visual control signals are not 0 1 2 3 4 N/A Visual control signals are standardized throughout the standardized throughout the workplace. workplace.
There is not a common 0 1 2 3 4 N/A There is a common communi-communication system cation system throughout the throughout the workplace. workplace and it affords easy
access to the workforce.
Visual control signals are not 0 1 2 3 4 N/A Visual control signals are very easy to understand and don’t easy to understand and convey convey the proper message. the proper message.
VISUAL CONTROLS AVERAGE
Notes:

Lean Office Assessment Page 5
BATCH WORK LEANQUALITY
The Organization does not have an 0 1 2 3 4 N/A Internal Audits are regularly Internal Audit process. scheduled and documented. The
findings of the audits become apart of the corrective actionsystem. There are follow-upaudits to ensure that thecorrective actions are effective.The organization’s leadershipregularly reviews the results ofInternal Audits.
There is no system for the 0 1 2 3 4 N/A There is a process for recording,handling of customer complaints. communicating, and resolving(Internal or External) customer complaints (Internal or
External). The complaints areentered into the corrective actionsystem, follow-up is conductedand they are reviewed by theorganization’s leadership.
Error proofing techniques are 0 1 2 3 4 N/A Error proofing techniques are not evident in the processes and deployed throughout the work there is no implementation plan area. Key processes demonstrateto utilize error proofing. error proofing or there is
evidence that error proofingwas investigated.
There is no continuous improve- 0 1 2 3 4 N/A Continuous improvement ment process in the workplace. teams are actively studying
and implementing continuousimprovement projects.
QUALITY AVERAGE
Notes:
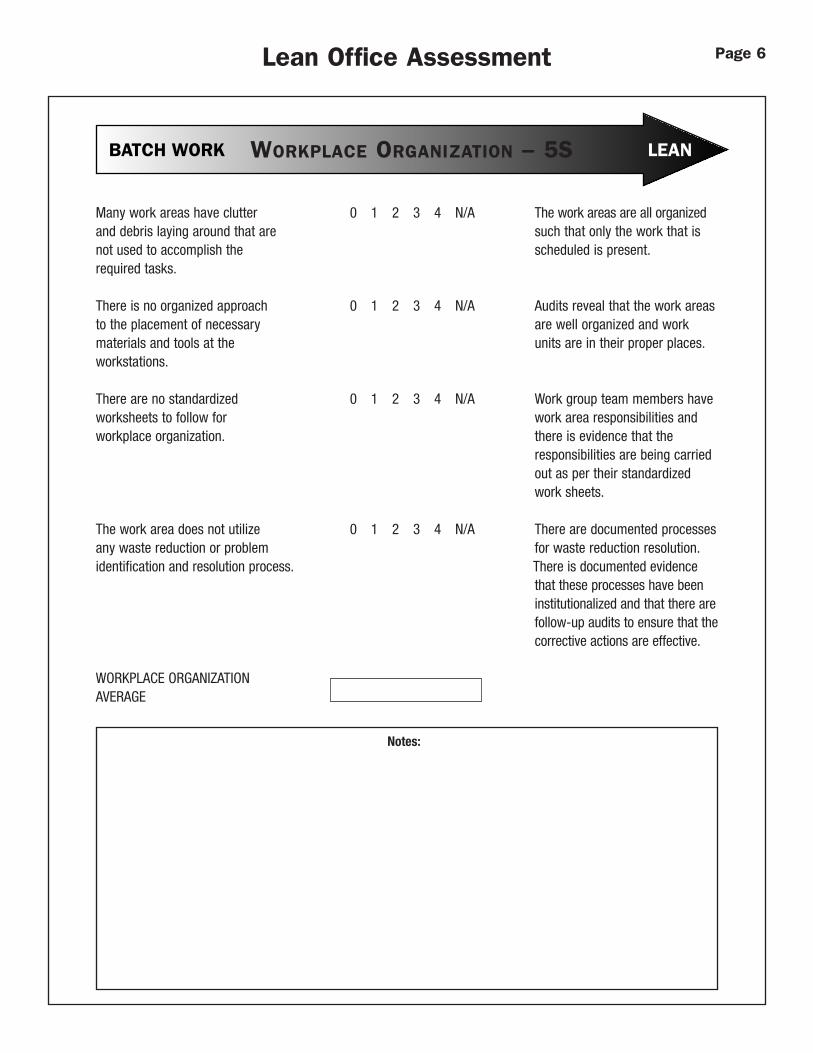
Lean Office Assessment Page 6
BATCH WORK LEANWORKPLACE ORGANIZATION – 5S
Many work areas have clutter 0 1 2 3 4 N/A The work areas are all organized and debris laying around that are such that only the work that isnot used to accomplish the scheduled is present.required tasks.
There is no organized approach 0 1 2 3 4 N/A Audits reveal that the work areas to the placement of necessary are well organized and work materials and tools at the units are in their proper places.workstations.
There are no standardized 0 1 2 3 4 N/A Work group team members haveworksheets to follow for work area responsibilities and workplace organization. there is evidence that the
responsibilities are being carriedout as per their standardizedwork sheets.
The work area does not utilize 0 1 2 3 4 N/A There are documented processes any waste reduction or problem for waste reduction resolution.identification and resolution process. There is documented evidence
that these processes have beeninstitutionalized and that there arefollow-up audits to ensure that thecorrective actions are effective.
WORKPLACE ORGANIZATIONAVERAGE
Notes:
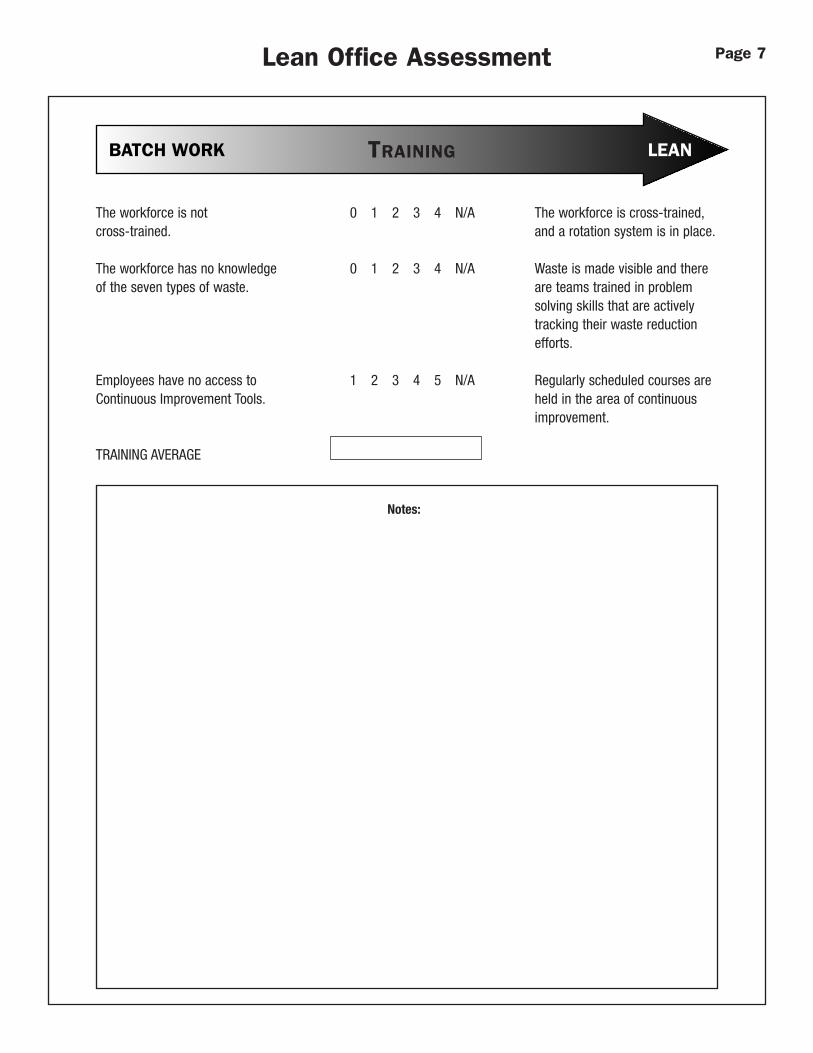
Lean Office Assessment Page 7
BATCH WORK LEANTRAINING
The workforce is not 0 1 2 3 4 N/A The workforce is cross-trained,cross-trained. and a rotation system is in place.
The workforce has no knowledge 0 1 2 3 4 N/A Waste is made visible and there of the seven types of waste. are teams trained in problem
solving skills that are activelytracking their waste reductionefforts.
Employees have no access to 1 2 3 4 5 N/A Regularly scheduled courses are Continuous Improvement Tools. held in the area of continuous
improvement.
TRAINING AVERAGE
Notes:

Lean Office Assessment Page 8
BATCH WORK LEANOVERALL LEAN
Order Leveling 0 1 2 3 4 N/A
Work Unit Movement 0 1 2 3 4 N/A
Continuous Work Flow 0 1 2 3 4 N/A
Visual Controls 0 1 2 3 4 N/A
Quality 0 1 2 3 4 N/A
Work Place Organization – 5S 0 1 2 3 4 N/A
Training 0 1 2 3 4 N/A
Team Member Involvement 0 1 2 3 4 N/A
Notes:

Lean Office Assessment Radar Chart
Order Leveling
Work Unit Movement
Trai
ning
Team
Membe
r Involvement
4
3
2
1
0
4 • 3.6 – 4.0 World-class status3 • 2.6 – 3.5 Results at all levels2 • 1.6 – 2.5 Change becoming visible1 • 0.6 – 1.5 Beginning lean0 • 0.0 – 0.5 No real commitment
Comments:
Total: –––––––––––––
Average: –––––––––––––
5S
Quality
Visual
Contro
ls
Cont
inuo
usFl
ow

10
Date
Work Instruction No.��Page
Step
#
MT AT WT
of
Daily Reqt.Takt Time
Part Name
Manual
WalkingWaiting
Automatic
Operation Time (minutes)(MT = Manual Time, AT = Automatic Time, WT = Walking Time)
Standard Work Combination
5 15 20 25 30 35 40
Operation
Operation
Time
Standardized Work Combination Sheet
Leader Approval:Totals: 23.75 + 0 + 0 =
of

Value Stream:
= Start Date
Date:
D
E
M
A
N
D
F
L
O
W
L
E
V
E
L
PhaseSix-Month Schedule
Specific Event1 2 3 4 5 6
Monthly Kaizen Plan Worksheet
= Planned Completion= Expected Duration

ITEM TASK ASSIGN TO
Value Stream: Value Stream Team Members: Date: Page___ of ___
Kaizen Milestone Worksheet
= Completed= Start Date Past Due ! = Four-Week MonthEstimated
Time to Completion
Month

(Name of Team)(Date)
Accomplishments:
Concerns (Issues):
Plans(How to Resolve Issues):
Project Status Report
Forward to Team Champion/Owner/CEO