ry - university of hawaii€¦ · 3.2 soil column test. 19 3.2.1 r-3water column leaching...
TRANSCRIPT

UNIVERSllY OFHAWAU UBR1\RY
DIVERSITY AND TRANSPORT OF BACTERIA AND VIRUSES IN SOILS
FOLLOWING IRRIGATION WITH RECYCLED WATER
A THESIS SUBMITTED TO THE GRADUATE DIVISION OF THEUNIVERSITY OF HAWAI'I IN PARTIAL FULFILLMENT
OF THE REQUIREMENTS FOR THE DEGREE OF
MASTER OF SCIENCE
IN
CIVIL ENGINEERING
DECEMBER 2003
ByTieshi Huang
Thesis Committee:
Roger Babcock, ChairpersonChittaranjan Ray
Albert Kim

ACKNOWLEDGEMENTS
I would like to express my sincere gratitude to my professors and friends who have
helped me during my study at the University of Hawaii at Manoa. My advisor Dr. Roger
Babcock has given me the detailed instructions and suggestions regarding my thesis
research. Dr. Chittaranjan Ray and Dr. Albert Kim provided very helpful suggestions for
me. I would like to thank Ms. Bunnie Yoneyama for her help in laboratory. The help
from my laboratory mates Sumon Kanpirom is also appreciated.
I would like to give special thanks to my wife Jing Meng and my son Jianxin Huang.
Their love and support are always with me throughout my studies.
iii

ABSTRACT
Field and laboratory analyses were conducted to study bacteria and virus transport and
diversity in surface soils following irrigation with recycled water. Field test plots were
irrigated with R-l (oxidized, filtered, disinfected) water and tap water, and pan lysimeters
were used to collect leachate water samples. R-l, R-2 (oxidized, disinfected), R-3
(oxidized only) and tap water were applied to soil columns. Fecal coliform and coliphage
were only found in the leachate from the R-3 soil column. Polymerase chain reaction
denaturing gradient gel electrophoresis analysis (PCR-DGGE) of 16S rRNA genes was
used to analyze the bacterial population in leachate and soil samples from different
depths. The R-l field test plot had a more diversified bacterial community than a tap
water control plot. Surface soils from field test plots had more bacteria species than that
of bottom soils. Different DGGE banding profiles were found at different depths in R-l,
R-2 and R-3 effluent soil columns. UV dosage did have some effect on soil microbial
diversity.
iv

TABLE OF CONTENTS
ACKNOWLEDGEMENTS .iii
ABSTRACT .iv
TABLE OF CONTENTS v
LIST OF TABLES vii
LIST OF FIGURES viii
LIST OF PHOTOS .ix
CHAPTER 1. INTRODlJCTION 1
1.1 General 1
1.2 Introduction to Denaturing Gradient Gel Electrophoresis (DGGE) .4
1.3 Objectives 5
CHAPTER 2. MATERIALS AND METHODS 7
2.1 Field Study 7
2.2 Laboratory Study 10
2.3 Soil. 10
2.4 Water Samples 11
2.5 Grass Samples 12
2.6 DNA Extraction and PCR Amplification 12
2.7 DGGE Analysis 13
CHAPTER 3. RESlJLTS AND DISCClJSION 15
3.1 Field Study 15
3.1.1 Lysimeter Water Sample Analysis 15
v

3.1.2 DGGE Analysis 17
3.2 Soil Column Test. 19
3.2.1 R-3 Water Column Leaching Experiment.. 19
3.2.2 Tap Water, R-1 Water and R-2 Water Column Leaching Experiment.. 21
3.2.3 DGGE Analysis 23
CHAPTER 4. CONCLUSIONS 27
APPENDIX A. Physical Conditions of Column Leaching Experiment 29
APPENDIX B. Genomic DNA Isolation protocol.. 31
APPENDIX C. DGGE Reagent 32
APPENDIX D. DGGE Operation .35
REFERENCES 39
vi

LIST OF TABLES
Table Page
Table 2.1: Irrigation Rate of Field Test Plots 7
Table 3.1: Average Water Quality Data of R1 Water and Lysimeter Samples 15
Table 3.2: Fecal Coliform, Total Coliform, and Coliphage Concentrations in
Laboratory Soil Column Applied Waters 22
Table A.1: Physical Conditions of Tap Water Column Leaching Experiment. 29
Table A.2: Physical Conditions of R-3 Column Leaching Experiment. .29
Table A.3: Physical Conditions of R-2 Column Leaching Experiment 29
Table A.4: Physical Conditions of R-1-70 Column Leaching Experiment .30
Table A.5: Physical Conditions of R-1-140 Column Leaching Experiment 30
Table A.6: Physical Conditions of R-1-400 Column Leaching Experiment. 30
Table C.1: 40% Acrylamide/Bis (37.5:1) 32
Table C.2: 50x TAB Buffer. 32
Table C.3: Percentage Acrylamidelbis needed for a Particular Size Range 32
Table C.4: 0% Denaturing Solution 33
Table C.5: 100% Denaturing Solution 33
Table C.6: Formamide & Urea Amounts for Denaturing Solutions Less Than 100% 33
Table C.7: 10% Ammonium Persulfate 34
Table C.8: DCode Dye Solution 34
Table C.9: 2x Gel Loading Dye 34
Table C.1O: Ix TAB Running Buffer 34
vii

LIST OF FIGURES
Figure Page
Figure 3.1: Electrophoresis of PCR Products '" 18
Figure 3.2: DGGE Analysis ofPCR Amplified 16S rDNA Fragments Obtained
from Field Test Plot Samples 19
Figure 3.3: Fecal Coliform and Coliphage in the R-3 Water Laboratory Column
Leachate 21
Figure 3.4: Total Coliform in the Leachate from the Tap Water, R-I-70, R-I-140
and R-2 Soil Columns 22
Figure 3.5: DGGE Analysis ofPCR Amplified 16S rDNA Fragments Obtained
from R-l, R-2 and R-3 Laboratory Soil Column Samples 24
Figure 3.6: DGGE Analysis ofPCR Amplified 16S rDNA Fragments Obtained
from Rl Soil Column Samples 25
viii
LIST OF PHOTOS
Figure Page
Photo 2.1: SBWWTP Field Test Plot 8
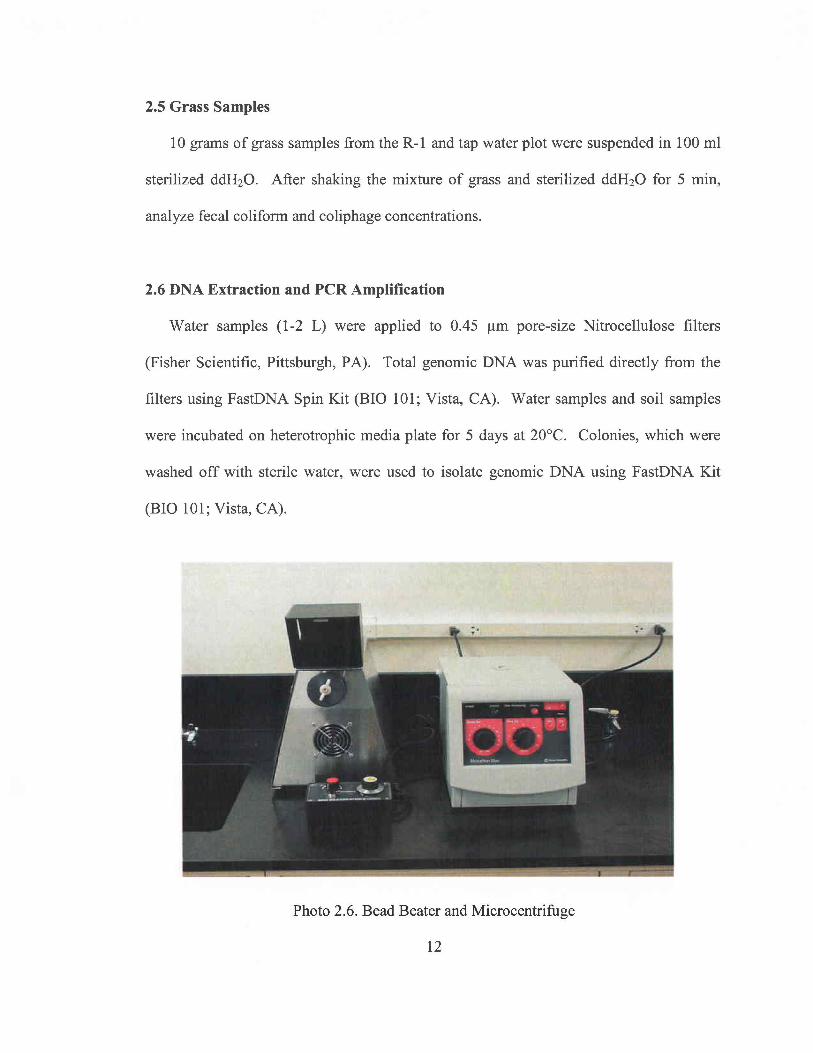
Photo 2.2: Pan Lysimeter 8
Photo 2.3: Sand Filtration 9
Photo 2.4: UV Disinfection System 9
Photo 2.5: Laboratory Soil Column 11
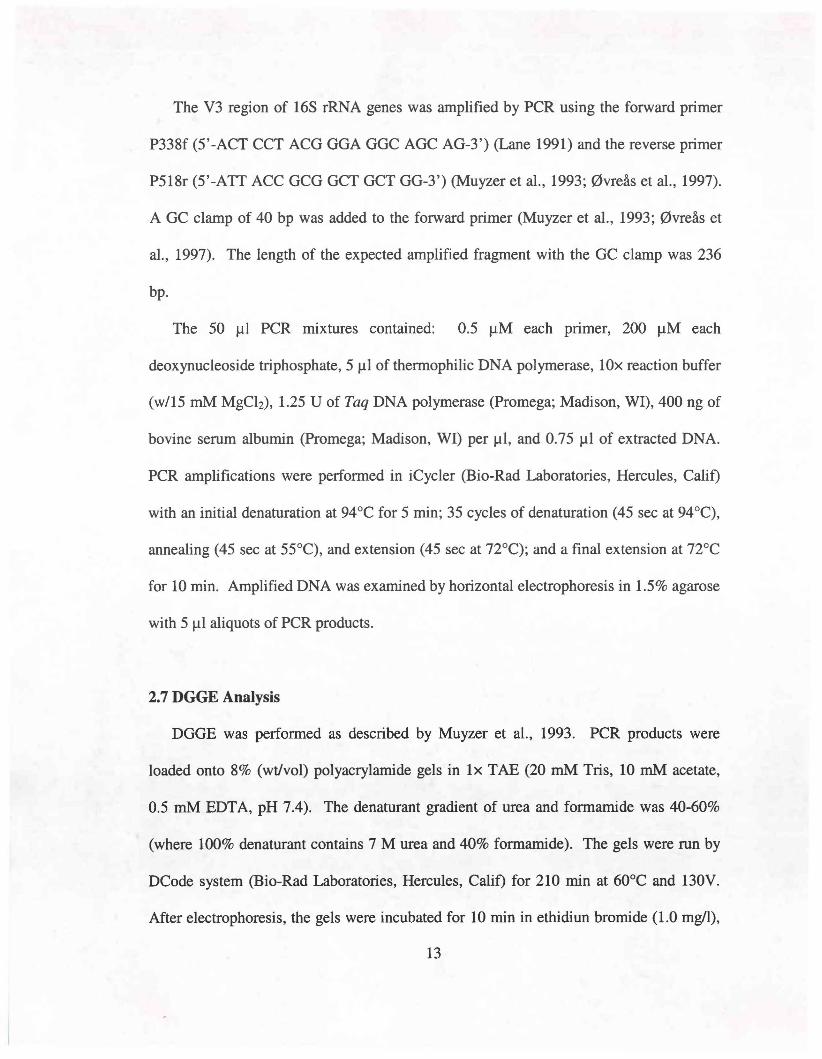
Photo 2.6: Bead Beater and Microcentrifuge 12
Photo 2.7: DCode System for DGGE Analysis, Horizontal Electrophoresis System,
and PCR Instrument 14
Photo 2.8: Gel Documentation System 14
ix
CHAPTER 1. INTRODUCTION
1.1 General
Water is becoming a limited resource in highly populated metropolitan areas. In such
areas, irrigation with recycled water is increasingly attractive as shortages and/or costs of
fresh water increase. Recycled water is primarily used for irrigation of golf courses,
parks and recreation areas. In Hawaii, nearly all of the drinking water supply is obtained
from unconfined groundwater aquifers under each island. On Oahu, with a population of
approximately one million, all of the drinking water supply is obtained from
groundwater. Approximately 100 million gallons per day is withdrawn from the Pearl
Harbor Aquifer, much of which is overlain with prime agricultural land. Oahu also
currently has 35 golf courses in operation. Population expansion has placed pressure on
water supplies such that there is a push (by the State Department of Health, DOH) to
implement large scale recycling of treated wastewater for agricultural and golf course
irrigation on Oahu. The DOH recognizes three types of recycled water; R-3 is
undisinfected secondary effluent, R-2 is disinfected secondary effluent with fecal
coliform < 23 CFU/lOO ml, and R-l is filtered and disinfected secondary effluent with
fecal coliform < 1 CFU/lOO mI.
Application of wastewater to soil could result in the contamination of groundwater
and soil with pathogens. Pathogen exposure is one of the most important concerns
related to the risk of recycled water irrigation (Quanrud et aI., 2003). Pathogens in
secondary effluent include the environmentally resistant oocysts of Crytosporidium
parvum, cysts of Giardia lamblia, and enteric pathogenic bacteria and viruses. Fecal
1

coliform, total coliform, Escherichia coli and enterococci are some commonly used
indicators to detect human pollution (Desmarais et aI., 2002). Coliphage virus is a
commonly occurring virus in wastewater, and is not commonly found as background in
the environment. In general, fecal coliform bacteria and coliphage virus are the most
representative indicators for pathogen presence, and simple standardized methods exist
for their enumeration. However, an absolute relationship between the enumeration of
fecal coliform and other pathogens does not exist.
Soil is an effective filter for pathogen removal. Pathogen removal in soil is mostly
dependent upon the degree of adsorption. Up to 95% of pathogens concentrate near the
soil surface, while most of the remainder concentrates in subsurface soils (Pettygrove and
Asano 1985). There are many field and laboratory studies investigating the mobility and
removal of bacteria and virus in soils, ground waters and soil columns. The studies
indicate that significant reduction in numbers of bacteria and viruses occurs during the
passage of wastewater through the soil and that removal is controlled by several factors.
The factors that influence virus persistence in the subsurface soil are temperature, virus
type, soil type, infiltration rate and microbial activity (Yates et aI., 1985; Nasser and
Oman 1999; Schijven and Hassanizadeh 2000; Nasser et aI., 2002; Quanrud et aI., 2003).
Among these factors, virus type is the most important factor in virus adsorption to soil
(Nasser et aI., 2002). Besides the physical factors, the effect of soil microbial activity on
virus survival is also important. Clay minerals in soil may protect viruses from biological
biodegradation (Lopez-Torres et al., 1987). Antiviral activity in soil attributed to aerobic
microorganisms could result in three fold increases in virus inactivation (Hurst 1988).
Furthermore, it has been demonstrated that bacteria could utilize viruses as growth
2
substrates (Lipson and Stotzky 1985). The factors that influence bacteria removal
include soil type (Yamaura 1989), infiltration rate, and the addition of flocculent and
adsorbing materials (Entry et aI., 2003; Parkpian et al., 2002). Polyacrylamide (PAM) is
an effective flocculent, which could reduce bacteria transport in percolating water. It is
reported that with proper application PAM + A!z(S04)3 and PAM + CaO can reduce total
coliform bacteria and fecal coliform bacteria by up to 50% (Entry et aI., 2003).
Estimates of microbial diversity within an environment include culture-dependent and
culture-independent methods. Culture -dependent methods are tedious and time
consuming due to the need for selective media for all species of interest. It is difficult to
detect more than about 1% of the bacteria species by any conventional cultivation
techniques (Ward et aI., 1990). Recent advances in molecular fingerprinting techniques
have overcome these difficulties. Analysis of total community DNA extracted from an
environment using culture-independent methods permits the detection of uncultured
organisms. Denaturing gradient gel electrophoresis (DGGE) separation of 16S rRNA
gene amplification products is one of the powerful tools to characterize the microbial
community and monitor the dominant population. To date, the16S rRNA genes have
been widely used for microbial diversity analysis of natural environments since the
nucleotide sequences of 16S rRNA genes are very conservative and change much more
slowly than whole genome sequences. The eight variable regions of the16S rRNA gene
are commonly used for microbial diversity analysis at the species scale. DGGE has been
largely used for the description of several environments at the molecular level (Muyzer et
aI., 1993; Juck et aI., 2000; Lapara et aI., 2000). Using DGGE, PCR products of the same
length but with different sequences can be separated. The total number of DGGE bands
3

provides an estimate of the microbial diversity within a given environment (Muyzer et
al.,1993).
The Schofield Army Barracks Wastewater Treatment Plant (SBWWTP) provides
secondary treatment using the conventional activated sludge process and chlorine
disinfection with NaGCl. At present, the treated effluent from SBWWTP is discharged
to an irrigation ditch operated by the Dole Foods Company (OFC). The effluent is mixed
with water drawn from the Wahiawa Reservoir and used for irrigation of diversified
agricultural crops such as coffee, papaya, corn, and macadamia nuts. Prior to this, the
water was used for about 70 years to irrigate sugar cane on the same lands.
1.2 Introduction to Denaturing Gradient Gel Electrophoresis (DGGE)
Denaturing Gradient Gel Electrophoresis (DGGE) is an electrophoretic method to
identify single base changes in a segment of DNA. In a denaturing gradient acrylamide
gel, double-stranded DNA is subjected to an increasing denaturant environment and will
melt in discrete segments called "melting domains". The melting temperature (TnJ of
these domains is sequence-specific. When the Tm of the lowest melting domain is
reached, the DNA reduces its mobility in a polyacrylamide gel. Since the Tm of a
particular melting domain is sequence-specific, the presence of mutation will alter the
melting profile of that DNA when compared to wild-type. DNA containing mutations
will encounter mobility shifts at different positions in the gel than the wild-type. If the
fragment completely denatures, then migration again becomes a function of size.
In DGGE, the denaturing environment is created by a combination of uniform
temperature, typically between 50 and 65°C and a linear denaturant gradient formed with
4

urea and formamide. A solution of 100% chemical denaturant consists of 7 M urea and
40% formamide. The denaturing gradient may be formed perpendicular or parallel to the
direction of electrophoresis. A perpendicular gradient gel, in which the gradient is
perpendicular to the electric field, typically uses a broad denaturing range, such as 0
100% or 20-70%. In parallel DGGE, the denaturing gradient is parallel to the electric
field, and the range of denaturant is narrowed to allow better separation of fragments.
When running a denaturing gradient gel, both the mutant and wild-type DNA
fragments are run on the same gel. This way, mutations are detected by differential
migration of mutant and wild-type DNA. The mutant and wild-type fragments are
typically amplified by the polymerase chain reaction (PCR) to make enough DNA to load
on the gel. Optimal resolution is attained when the molecules do not completely denature
and region screened is in the lowest melting domain. The addition of a 30-40 base pair
GC clamp to one of the PCR primers insures that the region screened is in the lower
melting domain and that the DNA will remain partially double-stranded. The size of the
DNA fragments run on a denaturing gel can be as large as 1 kb in length, but only the
lower melting domains will be available for mutation analysis. For complete analysis of
fragments over 1 kb in length, more than one PCR reaction should be performed.
1.3 Objectives
The objective of this study was to evaluate the potential impacts on the underlying
groundwater of using treated effluent from the SBWWTP for future golf course
irrigation, with an emphasis on evaluating the movement of fecal coliform bacteria and
coliphage virus through the shallow soil layer and deep underlying unsaturated saprolitic
5

layers, and estimating bacterial diversity in surface soils following irrigation with
recycled water. In this study, both a field test and laboratory soil column tests were
operated to evaluate the potential impact of irrigating with SBWWTP effluent. Using
both the traditional plate counting method and DGGE separation of 16S rRNA gene
amplification products, the study emphasized estimating bacterial diversity in surface
soils following irrigation, evaluation of the movement of fecal coliform bacteria and
coliphage virus through the shallow soils, and estimating the ultraviolet radiation (UV)
dosages necessary to reduce the fecal coliform bacteria and coliphage virus counts in the
shallow soils to be irrigated with SBWWTP effluent.
6
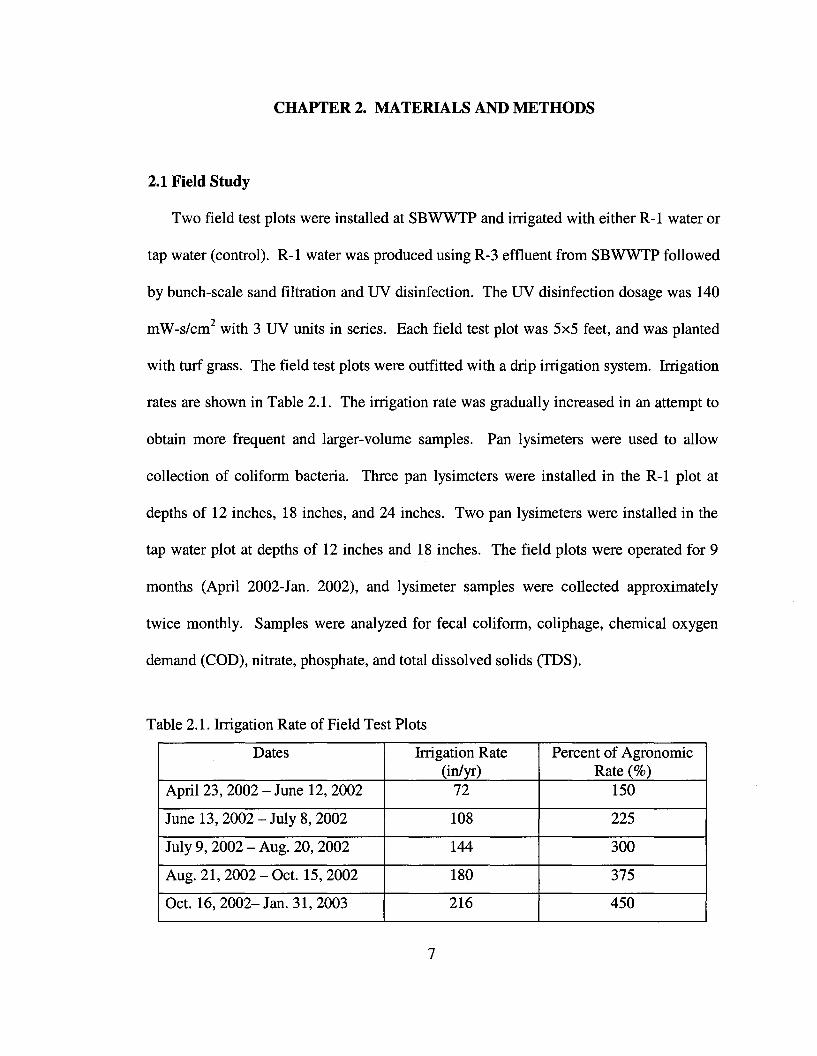
CHAPTER 2. MATERIALS AND METHODS
2.1 Field Study
Two field test plots were installed at SBWWTP and irrigated with either R-l water or
tap water (control). R-l water was produced using R-3 effluent from SBWWTP followed
by bunch-scale sand filtration and UV disinfection. The UV disinfection dosage was 140
mW-s/cm2 with 3 UV units in series. Each field test plot was 5x5 feet, and was planted
with turf grass. The field test plots were outfitted with a drip irrigation system. Irrigation
rates are shown in Table 2.1. The irrigation rate was gradually increased in an attempt to
obtain more frequent and larger-volume samples. Pan lysimeters were used to allow
collection of coliform bacteria. Three pan lysimeters were installed in the R-l plot at
depths of 12 inches, 18 inches, and 24 inches. Two pan lysimeters were installed in the
tap water plot at depths of 12 inches and 18 inches. The field plots were operated for 9
months (April 2002-Jan. 2002), and lysimeter samples were collected approximately
twice monthly. Samples were analyzed for fecal coliform, coliphage, chemical oxygen
demand (COD), nitrate, phosphate, and total dissolved solids (IDS).
Table 2.1. Irrigation Rate of Field Test Plots
Dates Irrigation Rate Percent of Agronomic(in/yr) Rate (%)
April 23, 2002 - June 12,2002 72 150
June 13, 2002 - July 8, 2002 108 225
July 9,2002 - Aug. 20, 2002 144 300
Aug. 21, 2002 - Oct. 15,2002 180 375
Oct. 16,2002- Jan. 31,2003 216 450
7
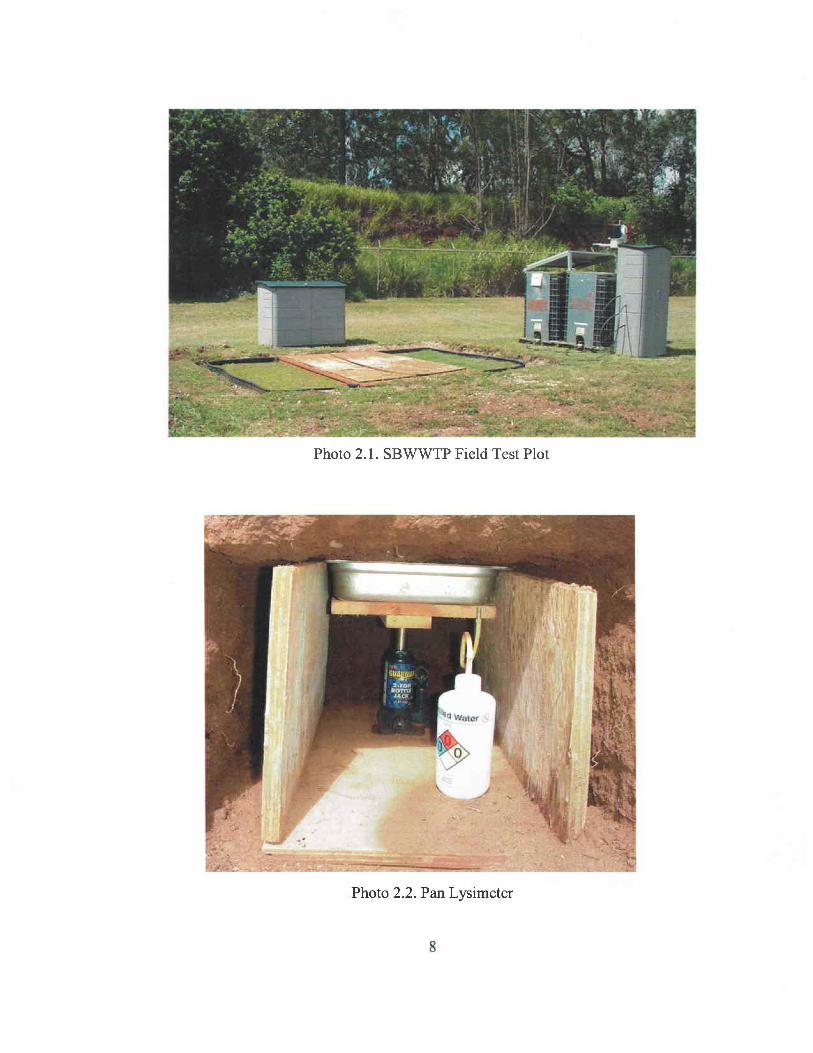
Photo 2.1. SBWWTP Field Test Plot
Photo 2.2. Pan Lysimeter
8

Photo 2.3. Sand Filtration
Photo 2.4. UV Disinfection System
9

2.2 Laboratory Study
Soil column tests were conducted to more accurately evaluate the UV and chlorine
dosages necessary to impact the fecal coliform bacteria and coliphage virus counts in
Oahu soils.
Stainless steel columns, 6 inches in length with an inner diameter of 1.8 inches, were
packed with Wahiawa soil collected from a DFC pineapple field. Each soil column was
packed to a bulk density between 1.01 and 1.03 g1cm3• The porosity of soil columns
were 0.67-0.68. A nylon fabric membrane (Soil Measurement Systems) was placed at the
bottom of the column whereas a #1 filter paper (Whatman) was placed on the top end of
the column. The nylon fabric membrane has no resistance to the flow. It was used to
prevent the soil particles from being washed out of the column cell. The #1 filter paper
was used to distribute the water uniformly over the surface of soil columns. One hundred
pore volumes of tap water, R-l water (with UV doses of either 70, 140 or 400 mW
s/cm2), R-2 water, and R-3 water were applied to the top of soil columns at a rate of 1
mlImin (approximately 40 in/d). Applied water flowed down through the soil columns by
gravity under unsaturated conditions. Leachate samples were collected and analyzed for
fecal coliform, total coliform, coliphage, and PCR-DGGE. Soil samples at depths of 0
inch (top), 3 inches (middle), and 6 inches (bottom) were used for PCR-DGGE.
2.3 Soil
The soil selected for this experiment belongs to the Wahiawa series. It was collected
between depths of 20 to 40 cm from DFC pineapple fields. The Wahiawa soil contained
83% clay, 12% silt, 4.2% sand and 0.8% organic carbon. Based on the results obtained
10

by Miller (Miller 1987), the particle densities of Wahiawa soil samples ranged from 2.78
to 3.23 g/cm3• An average particle density of 3 g/cm3 was used throughout the
experiment to determine the porosity of soil columns (0.67-0.68).
Photo 2.5. Laboratory Soil Column
2.4 Water Samples
Fecal coliform and total coliform were enumerated by the membrane filter technique,
and coliphage was enumerated by the double-layer technique (American Public Health
Association 1998). COD, nitrate, phosphate, and TDS were measured by standard
methods (American Public Health Association 1998).
11
2.5 Grass Samples
10 grams of grass samples from the R-1 and tap water plot were suspended in 100 ml
sterilized ddHzO. After shaking the mixture of grass and sterilized ddHzO for 5 min,
analyze fecal coliform and coliphage concentrations.
2.6 DNA Extraction and peR Amplification
Water samples (1-2 L) were applied to 0.45 Jlm pore-size Nitrocellulose filters
(Fisher Scientific, Pittsburgh, PA). Total genomic DNA was purified directly from the
filters using FastDNA Spin Kit (BIO 101; Vista, CA). Water samples and soil samples
were incubated on heterotrophic media plate for 5 days at 20DC. Colonies, which were
washed off with sterile water, were used to isolate genomic DNA using FastDNA Kit
(BIO 101; Vista, CA).
-.,.
~ - -. ~ . "
'i--~!,:1 r,F~!l. ~ ':: ~ ~ ,
" .- ...............- ~--
Photo 2.6. Bead Beater and Microcentrifuge
12
The V3 region of 165 rRNA genes was amplified by PCR using the forward primer
P338f (5'-ACT CCT ACG GGA GGC AGC AG-3') (Lane 1991) and the reverse primer
P518r (5' -ATT ACC GCG GCT GCT 00-3') (Muyzer et aI., 1993; 0vreas et aI., 1997).
A GC clamp of 40 bp was added to the forward primer (Muyzer et al., 1993; 0vreas et
aI., 1997). The length of the expected amplified fragment with the GC clamp was 236
bp.
The 50 ~l PCR mixtures contained: 0.5 ~M each primer, 200 ~M each
deoxynucleoside triphosphate, 5 ~l of thermophilic DNA polymerase, lOx reaction buffer
(w/15 mM MgC!z), 1.25 U of Taq DNA polymerase (Promega; Madison, WI), 400 ng of
bovine serum albumin (promega; Madison, WI) per ~l, and 0.75 ~l of extracted DNA.
PCR amplifications were performed in iCycler (Bio-Rad Laboratories, Hercules, Calif)
with an initial denaturation at 94°C for 5 min; 35 cycles of denaturation (45 sec at 94°C),
annealing (45 sec at 55°C), and extension (45 sec at 72°C); and a final extension at 72°C
for 10 min. Amplified DNA was examined by horizontal electrophoresis in 1.5% agarose
with 5 ~l aliquots of PCR products.
2.7 DGGE Analysis
DGGE was performed as described by Muyzer et aI., 1993. PCR products were
loaded onto 8% (wtivol) polyacrylamide gels in Ix TAB (20 mM Tris, 10 mM acetate,
0.5 mM EDTA, pH 7.4). The denaturant gradient of urea and formamide was 40-60%
(where 100% denaturant contains 7 M urea and 40% formamide). The gels were run by
DCode system (Bio-Rad Laboratories, Hercules, Calif) for 210 min at 60°C and 130V.
After electrophoresis, the gels were incubated for 10 min in ethidiun bromide (1.0 mgll),
13

rinsed for 10 min in lxTAE buffer, and then documented using Gel Doc 2000 (Bio-Rad
Laboratories, Hercules, Calif). DGGE analyses were used to examine bacterial diversity
in this study, and no attempt was made to identify individual bacteria species.
Photo 2.7. DCode System for DGGE Analysis, Horizontal Electrophoresis System, andPCR Instrument
Photo 2.8. Gel Documentation System
14
CHAPTER 3. RESULTS AND DISCUSSION
3.1 Field Study
3.1.1 Lysimeter Water Sample Analysis
The DOH regulations for R-l water with ultraviolet (UV) disinfection require that the
influent turbidity be less than 2 NTU to maintain disinfection performance. In this study,
the turbidity of R-3 effluent was reduced from 2.3 to 1.6 using sand filtration. Fecal
coliform and coliphage concentrations after sand filtration were approximately 25,000
CFU/lOOmI and 3,000 PFU/lOOml, respectively. However, after UV disinfection no
fecal coliform or colophage were ever detected in the R-l water.
All five pan lysimeters performed well for the duration of experimentation.
Lysimeter sample volume ranged from 40-200 ml. Due to the limited amount of some
lysimeter samples, COD was selected for analysis rather than biochemical oxygen
demand (BOD). Water quality data for applied waters and lysimeter samples, averaged
over the period of experimentation are shown in Table 3.1.
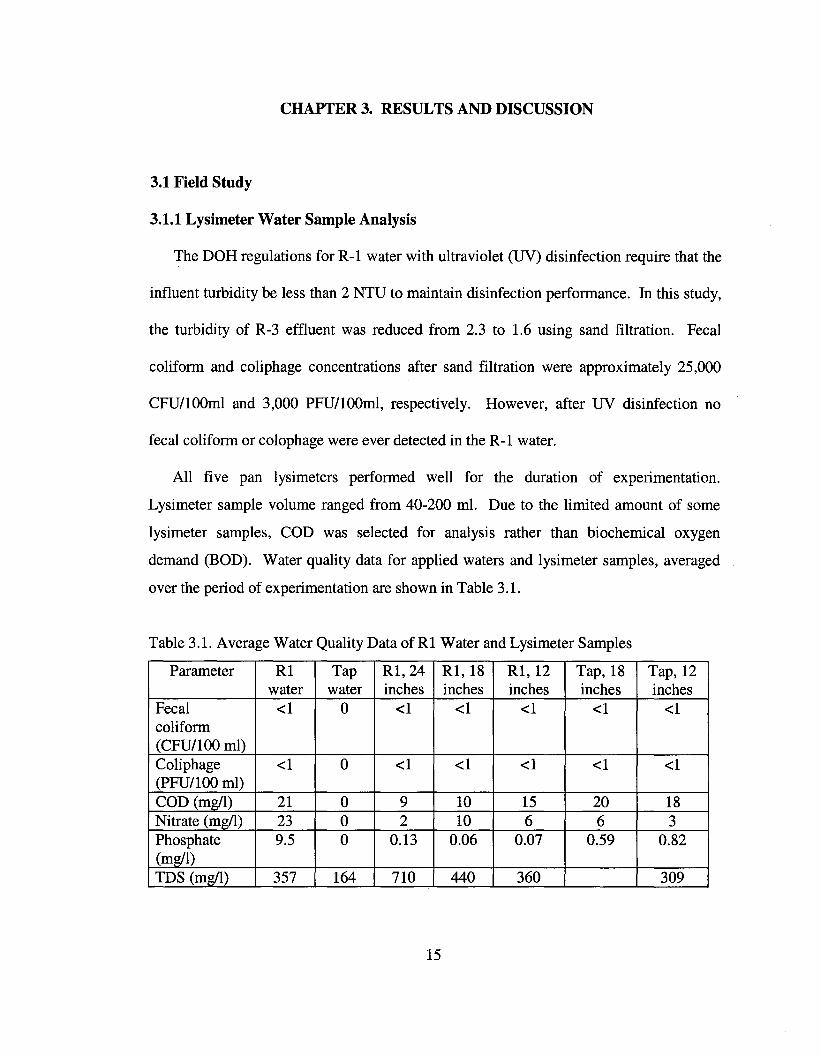
Table 3.1. Average Water Quality Data of Rl Water and Lysimeter Samples
Parameter Rl Tap Rl,24 Rl,18 Rl,12 Tap, 18 Tap, 12water water inches inches inches inches inches
Fecal <1 0 <1 <1 <1 <1 <1coliform(CFU/lOO ml)Coliphage <1 0 <1 <1 <1 <1 <1(PFU/IOO mI)COD (mg/l) 21 0 9 10 15 20 18Nitrate (mg/l) 23 0 2 10 6 6 3Phosphate 9.5 0 0.13 0.06 0.07 0.59 0.82(mg/l)TDS (mg/l) 357 164 710 440 360 309
15
The data in Table 3.1 show that no fecal coliform or coliphage were found in any
lysimeter samples during 9 months of sampling while applying water in excess of
agronomic needs. This seems to indicate little potential exists for transport of fecal
indicators through the deep Vadose Zone (400-600 ft) and into underlying drinking water
on Oahu. However, fecal coliform were found in grass samples from both the R-l and
tap water plots. Coliphage was also found in a grass sample from the R-l plot. The fecal
coliform values for the R-l and tap water plot grass samples were 20 and 6 CPU/IOO ml,
respectively. The coliphage value for the Rl plot grass sample was 200 PPU/IOO mI.
This is consistent with the study that fecal indicator bacteria, which include fecal
coliform, Escherichia coli, and enterococci, are present in natural environments in the
tropics, such as grass, soil, and freshwater streams (Byappanahalli and Fujioka 1998;
Murakami and Ray 2000; Fujioka and Hardina 1995; Lopez-Torres et aI., 1987;
Desmarais et aI., 2002). The tropical soil and grass environment is suitable for the
growth of fecal indicator bacteria. Birds and other animal feces are assumed to be the
sources of these fecal indicator bacteria in the soil and grass samples collected herein.
All the COD values for lysimeter samples were lower than that of the R-l water. The
deeper the field test plot lysimeter depth, the lower the COD values. Most of the organic
matter in the Rl water is expected to be consumed by aerobic bacteria near the soil
surface, thus causing a decrease in COD values. The COD values for the tap water plot
were slightly higher than those for the R-l plot possibly due to leaching of surface soil
COD.
Data obtained for nitrate and phosphate indicate that nitrate in the Rl water was
removed by 50 to 90%, and that about 99% of the phosphate in R-1 effluent was removed
16

in the field site turf grass-soil system. Most of the phosphate is assumed to be removed
by the grass, which was supported by visual observation of better grass growth and
greener hue in the R-l plot. The nitrate values from the tap water plot were about the
same as those of the R-l plot. However, the phosphate values from the Rl plot were only
about one tenth that of the tap water plot. This was possible due to leaching of grass root
of tap water plot.
The TDS values of lysimeter water samples were higher than those of R-l and tap
water. The TDS values increased with increasing lysimeter depth. This was due to the
phenomenon of evapotranspiration.
3.1.2 DGGE Analysis
Samples of soil were obtained from each field test plot. A few grams of soil were
collected at each pan lysimeter location (bottom soil) as well as at the root zone of the
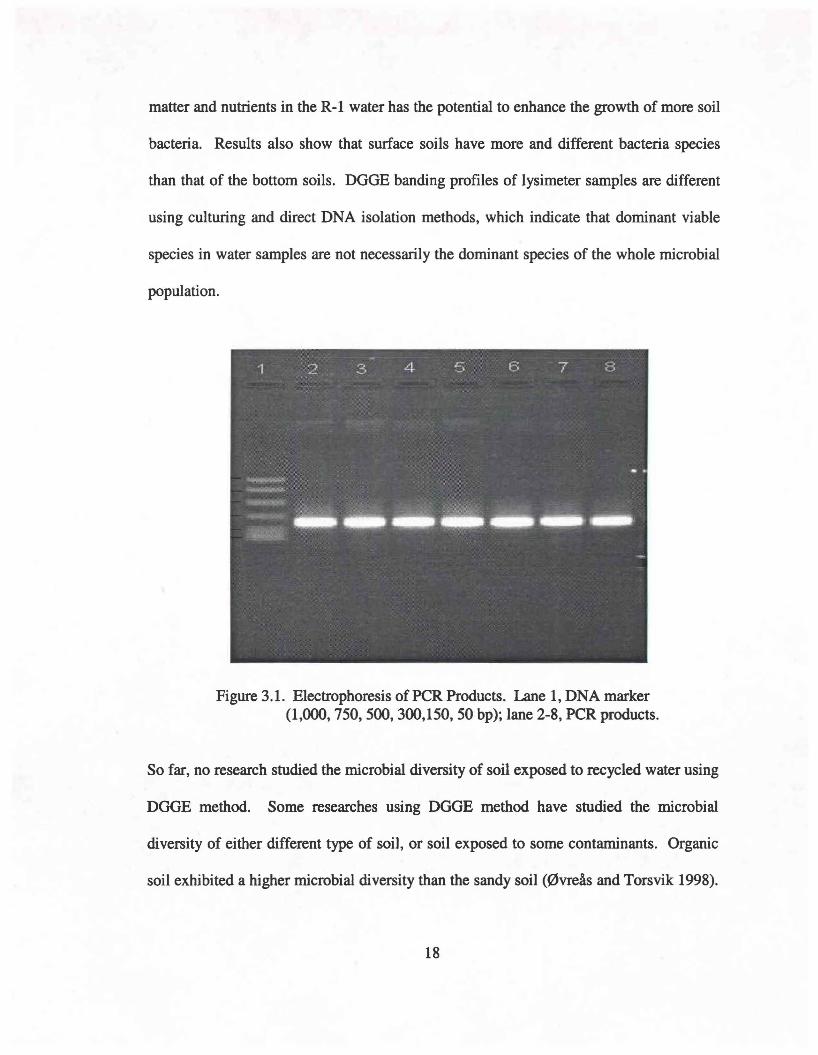
grass (surface soil). Figure 3.1 shows the electrophoresis ofPCR products. All the PCR
products are 236 bp. Figure 3.2 shows the result of the PCR-DGGE analysis of field test
plot lysimeter and soil samples. At least 13 and 12 detectable DGGE bands were
observed for the R-l plot and tap water plot lysimeter samples, respectively, using the
direct DNA isolation method. There are 10 and 6 detectable DGGE bands for R-l and
tap water plot lysimeter samples, respectively, using the culturing DNA isolation method.
There are 6, 13, 10, and 12 detectable DGGE bands for the R-l plot bottom soil, R-l plot
surface soil, tap water plot bottom soil, and tap water plot surface soil, respectively.
These results mostly indicate that the R-l plot has a more diversified microbial
community than that of the tap water plot. This potentially indicates that the organic
17
matter and nutrients in the R-l water has the potential to enhance the growth of more soil
bacteria. Results also show that surface soils have more and different bacteria species
than that of the bottom soils. DGGE banding profiles of lysimeter samples are different
using culturing and direct DNA isolation methods, which indicate that dominant viable
species in water samples are not necessarily the dominant species of the whole microbial
population.
Figure 3.1. Electrophoresis of PCR Products. Lane 1, DNA marker(1,000, 750, 500, 300,150, 50 bp); lane 2-8, PCR products.
So far, no research studied the microbial diversity of soil exposed to recycled water using
DGGE method. Some researches using DGGE method have studied the microbial
diversity of either different type of soil, or soil exposed to some contaminants. Organic
soil exhibited a higher microbial diversity than the sandy soil (0vreas and Torsvik 1998).
18

It is reported that the microbial diversity of petroleum hydrocarbon-contaminated soils
maintained or increased as compared to uncontaminated controls (Juck et al., 2000).
1 2 3 4 5 6 7 8
Figure 3.2. DGGE Analysis of peR Amplified I6S rDNA Fragments Obtained fromField Test Plot Samples. Lane 1, R-I plot lysimeter (0.45 urn membrane);lane 2, tap water plot lysimeter (0.45 urn membrane); lane 3, R-l plotlysimeter(culture); lane 4, tap water plot lysimeter (culture); lane 5, R-Iplot (bottom soil); lane 6, R-l plot (surface soil); lane 7, tap water plot(bottom soil); lane 8, tap water plot (surface soil).
3.2 Soil Column Test
3.2.1 R-3 Water Column Leaching Experiment
19

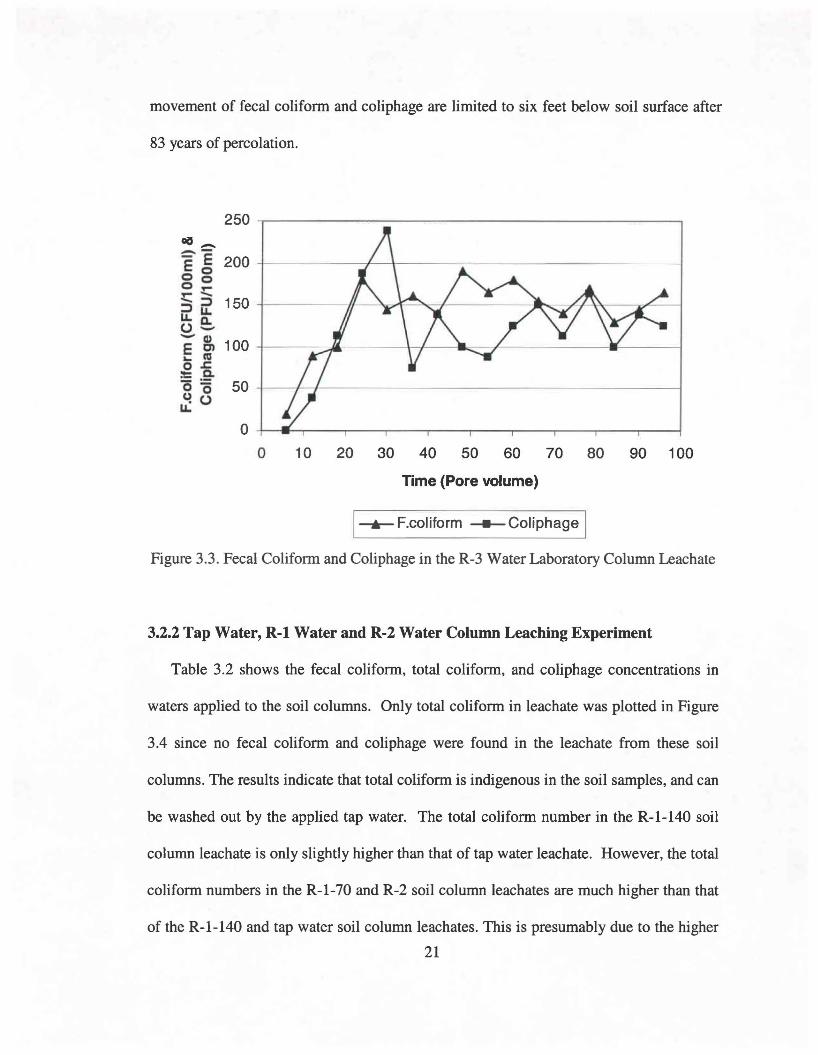
Figure 3.3 shows fecal colifonn and coliphage breakthrough at approximately 5 pore
volumes and the breakthrough curve reached a fonn of equilibrium after about 30 pore
volumes. The fecal colifonn breakthrough curve and the coliphage breakthrough curve
look quite similar. The fecal colifonn and coliphage concentrations in R-3 water were 1.8
x 105 and 2.0 x 10³, respectively. These results indicate that there is much lower removal
efficiency for coliphage than for fecal colifonn. A previous study in the laboratory on
virus transport through sterile Oahu soils showed that a pure culture of MS-2 virus could
not leach all the way through soil columns of the same size containing the same soil
(Wong 2001). However, in the present study coliphage was found in the leachate from
the R-3 soil column. Since the soils in the present study were not sterilized, the soil
environment may have been more conducive to coliphage survival and less conducive to
adsorption. One possible explanation for this difference is that the coliphage viruses can
be transported together with bacteria since viruses have to infect host bacteria to
reproduce. Moreover, the high concentration of clays (83%) in the soil samples may
protect coliphage from biological biodegradation (Gerba 1987), which enhances
coliphage transport.
The transport of fecal colifonn and coliphage through laboratory soil column seems
to indicate the potential contamination of groundwater with pathogens. However, due to
the high porosity (0.67-0.68) of laboratory soil column, the removal efficiency of fecal
colifonn and coliphage in laboratory soil column should be much greater than in field.
The modeling part of this study (data not shown) suggests that the adsorption of fecal
colifonn and coliphage are very high in shallow soils of central Oahu, and that the
20
movement of fecal coliform and coliphage are limited to six feet below soil surface after
83 years of percolation.
250 .,-----------------------,oa_E~ 200 ;------/---+---.,-------------100o~
§ ~ 150 +----------,I/-----'l.0""r.
L&.c.0-CI)E en 100 ;----.Ak-----I-I--IL...... cuoJ::
:!:: a.8 '0 50 -1---1.0
L&.
O+-......-,-----,.--r----.---,-----,.--.,.---r-----.----i
o 10 20 30 40 50 60 70 80 90 100
Time (Pore volume)
1-.-F.coliform~Coliphage IFigure 3.3. Fecal Coliform and Coliphage in the R-3 Water Laboratory Column Leachate
3.2.2 Tap Water, R-l Water and R-2 Water Column Leaching Experiment
Table 3.2 shows the fecal coliform, total coliform, and coliphage concentrations in
waters applied to the soil columns. Only total coliform in leachate was plotted in Figure
3.4 since no fecal coliform and coliphage were found in the leachate from these soil
columns. The results indicate that total coliform is indigenous in the soil samples, and can
be washed out by the applied tap water. The total coliform number in the R-I-140 soil
column leachate is only slightly higher than that of tap water leachate. However, the total
coliform numbers in the R-I-70 and R-2 soil column leachates are much higher than that
of the R-I-140 and tap water soil column leachates. This is presumably due to the higher
21

total coliform number in the R-1-70 and R2 applied waters. The R-1-140 and tap water
column data may represent washout of total coliform from the soil, whereas the R-1-70
and R-2 column data may represent this same washout enhanced by some transport of
applied coliform. Compared to UV-70 and chlorine, UV-140 seems to provide more
protection from coliform leaching since higher UV dosage can inactivate more bacteria
than lower UV dosage.
Table 3.2. Fecal Coliform, Total Coliform, and Coliphage Concentrations in LaboratorySoil Column Applied Waters
Sample Fecal coliform Total coliform Coliphage(CFU/100 mil (CFU/100 ml) (PFU/100 ml)
Tap water 0 0 0
R-1-70 20 300 0
R-1-140 0 100 0
R-2 effluent 0 172 0
_ 120
E8 100'I"'":s 80u.0-E 60....g
40(5u
S 200... 0
0 20 40 60 80 100 120
Time (Pore volume)
I~Tap water -+- R1-70 --- R1-140 .......- R21Figure 3.4. Total Coliform in the Leachate from the Tap Water, R-1-70, R-I-140
and R-2 Soil Columns
22

3.2.3 DGGE Analysis
Figure 3.5 shows the DGGE banding profiles for R-l, R-2, and R-3 soil columns.
The results show that the DGGE banding profiles of the soil columns which received
wastewater are different from that of the control soil, which means the dominant viable
bacteria species of the control soil changed after the application R-l, R-2 and R-3 waters.
R-l soil column had a more diversified microbial population than the R-2 and R-3 soil
columns based on the DGGE banding profiles.
One DGGE band was found in the control soil and the top layer of all soil columns,
which indicates that the microorganism represented by this DGGE band is likely an
aerobic microorganism. Another DGGE band was found in the control soil, the R-l
column and the R-3 column. However, this DGGE band was only found in the bottom
layer of the R-2 soil column. This may be due to presence of chlorine residual in the top
layer of the R-2 column.
Compared to the control soil, the populations change due to recycled water
application. The changes in bacterial populations are dependent upon the type of
treatment performed on the recycled water. The use of chlorine as a disinfectant seems to
reduce bacterial diversity and the use of a high dose of UV disinfectant seems to allow an
increase in bacterial diversity (R-I-140 and R-2 lanes) compared to undisinfected (R-3
lanes). Comparison of lanes 11 and 12 seems to indicate that bacterial
diversity/speciation does not change as a result of water passage through the soil column.
Comparison of lanes 11 and 12 with the other lanes seems to show that the
23

microorganisms that flourish due to wastewater percolation do not come from the applied
water; instead they were already present in the soil perhaps in a dormant state.
1 2 3 4 5 6 7 8 9 10 11 12 13
Figure 3.5. DGGE Analysis of PCR Amplified 16S rDNA Fragments Obtained fromR-l, R-2 and R-3 Laboratory Soil Column Samples. Lane 1, control soil;lane 2, R-I-140 column (top); lane 3, R-I-140 column (middle); lane 4, R1-140 column (bottom); lane 5, R-2 column (top); lane 6, R-2 column(middle); lane 7, R-2 column (bottom); lane 8, R-3 column (top); lane 9,R-3 column (middle); lane 10, R-3 column (bottom); lane 11, R-3 waterapplied; lane 12, R-3 soil column percolate water; lane 13, Control soil
Figure 3.6 shows the DOGE banding profiles of R-I-70, R-I-140, and R-I-400
soil columns. The banding profiles look similar but do have some differences. The
results show that the top layers of each column have more bacteria species, and that the
banding profiles for the R-I-140 and R-I-400 columns are more diverse than the R-I-70
24

column. The results seem to indicate the UV dosage does have some impacts on bacterial
diversity.
1 2 3 4 5 6 7 8 9 10 11
Figure 3.6. DGGE Analysis ofPCR Amplified 16S rDNA Fragments Obtained fromRI Soil Column Samples. Lane I, control soil; lane 2, R-I-70 column(top); lane 3, R-I-70 column (middle); lane 4, R-I-70 column (bottom);lane 5, R-I-140 column (top); lane 6, R-I-140 column (middle); lane 7, R1-140 column (bottom); lane 8, R-I-400 column (top); lane 9, R-I-400column (middle); lane 10, R-I-400 column (bottom); lane 11, Control soil.
PCR-DOGE analysis of PCR products allowed a rapid assessment of bacterial
community change at the species level. By using this approach, we were able to study
the distribution of the microbial community along a depth profile of a field test plot and
25
laboratory soil columns. Although the DGGE band profile represents the complexity of
the microbial community, it does not provide quantitative information about the
individual species in the whole community, and it does not represent the exact total
number of species in the sample. Bands at identical positions in the DGGE profile are
not necessary derived from the same species (Muyzer et aI., 1993; Kurisu et aI., 2002).
To solve this problem, a gel with a narrower gradient can be used to get a high-resolution
DGGE profile of particular sections of the original profile. It is also of note that as more
than one copy of 16S rRNA genes exists in most of the bacteria, a single organism can
produce multiple DGGE bands (Ntibel et aI., 1996; Fogel et al., 1999). However, in
microbial diversity analysis one DGGE band is generally considered as representing one
bacterium species, and in this study, we assume that one DGGE band represents one
microorganism.
26

CHAPTER 4. CONCLUSIONS
Both field and laboratory experiments were conducted to study the diversity and
transport of bacteria and viruses through surface soils following irrigation with recycled
water at SBWWTP on the Island of Ohau. The following conclusions can be drawn:
[1] There was no transport of fecal coliform and coliphage through the top soil layer
(12-24 inches) of a field test plot even during excessive over-irrigation with R-I
recycled water, which contains no fecal coliform or coliphage.
[2] Residual COD in R-I effluent was not effectively removed, but more COD was
removed with increasing depth of transport. Nitrate and phosphate removals in the
R-I test plot were 50-90% and 99%, respectively.
[3] Based on PCR-DGGE analysis, the R-I test plot had a more diversified microbial
community than that of the tap water test plot, and surface soils had more bacteria
species than bottom soils (12-24 inches depth).
[4] Both fecal coliform and coliphage in R-3 water could be transported through a 6
inch recompacted soil column in the laboratory, and fecal coliform removal was
higher (approx. 3-log) than coliphage removal (approx. I-log).
27
[5] Total coliform was indigenous in the tropical soil samples, and could be washed off
by the applied tap water. The total coliform number in R-1-70 and R-2 column
leachates was much higher than that of R-1-140 and tap water column leachates.
[6] Based on PCR-DGGE analysis, the dominant viable bacteria species in the control
soil changed after the application of R-l effluent, R-2 effluent, and R-3 effluent.
Different DGGE banding profiles were observed at different depths in lab soil
columns. UV dosage did have some effects on soil microbial diversity. The
dominant viable species in applied waters did not become dominant in the soil
columns. Also, diversity and speciation in applied waters did not change due to
leaching through the soil columns.
28

Appendix A: Physical Conditions of Column Leaching Experiment
Table AI. Physical Conditions of Tap Water Column Leaching Experiment
Bulk density =0.915 g1cm'J flow rate =1.0 ml/min
porosity =0.685 velocity =3.66 cmlhr
pore volume =188.27 cm3
time for 1 PV =188.27 min
weight of dry soil =251.51 g
Table A2. Physical Conditions of R-3 Column Leaching Experiment
Bulk density =0.970 g1cmj
flow rate =1.0 ml/min
porosity = 0.667 velocity = 3.66 cmlhr
pore volume =183.30 cm3
time for 1 PV =183.30 min
weight of dry soil =265.92 g
Table A3. Physical Conditions of R-2 Column Leaching Experiment
Bulk density =0.948 g1cm'J flow rate =1.0 ml/min
porosity = 0.674 velocity = 3.66 cmlhr
pore volume =185.22 cm3
time for 1 PV =185.22 min
weight of dry soil =260.35 g
29
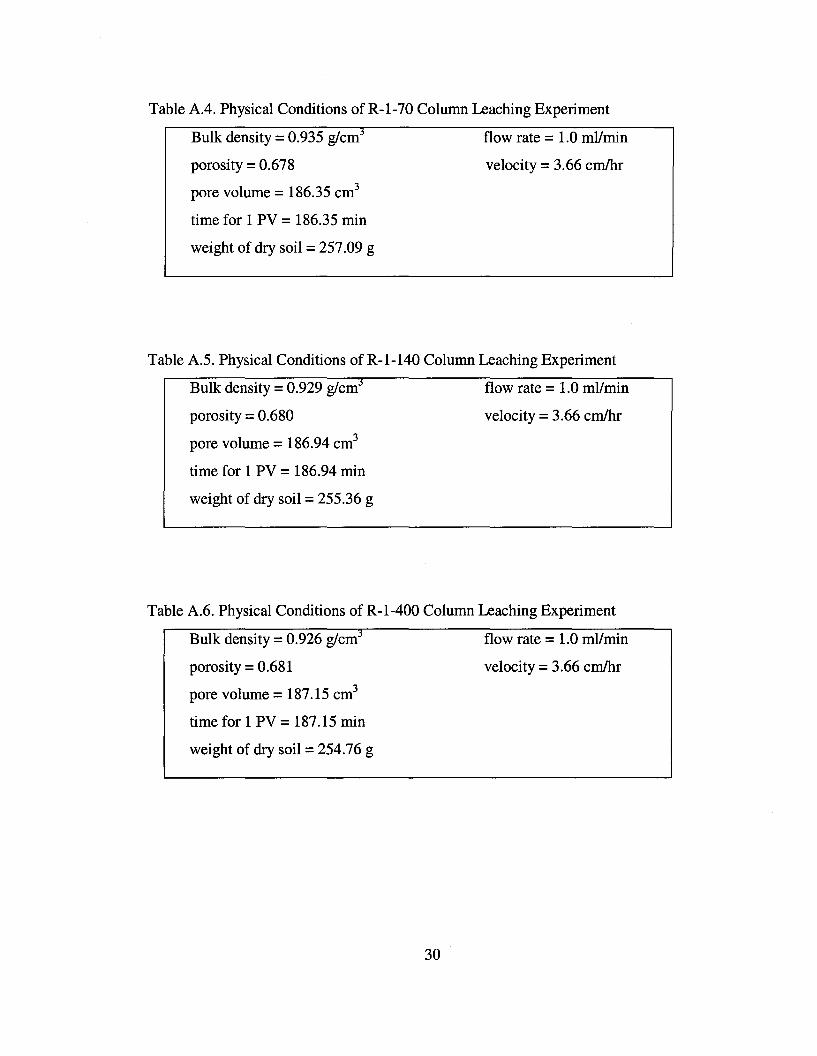
Table A4. Physical Conditions ofR-1-70 Column Leaching Experiment
Bulk density =0.935 glcmj
flow rate =1.0 ml/min
porosity =0.678 velocity =3.66 cm/hr
pore volume =186.35 cm3
time for 1 PV =186.35 min
weight of dry soil =257.09 g
Table A5. Physical Conditions ofR-1-140 Column Leaching Experiment
Bulk density =0.929 glcmj
flow rate =1.0 ml/min
porosity =0.680 velocity =3.66 cm/hr
pore volume =186.94 cm3
time for 1 PV = 186.94 min
weight of dry soil =255.36 g
Table A6. Physical Conditions of R-1-400 Column Leaching Experiment
Bulk density =0.926 glcmj
flow rate =1.0 ml/min
porosity =0.681 velocity =3.66 cm/hr
pore volume =187.15 cm3
time for 1 PV =187.15 min
weight of dry soil =254.76 g
30
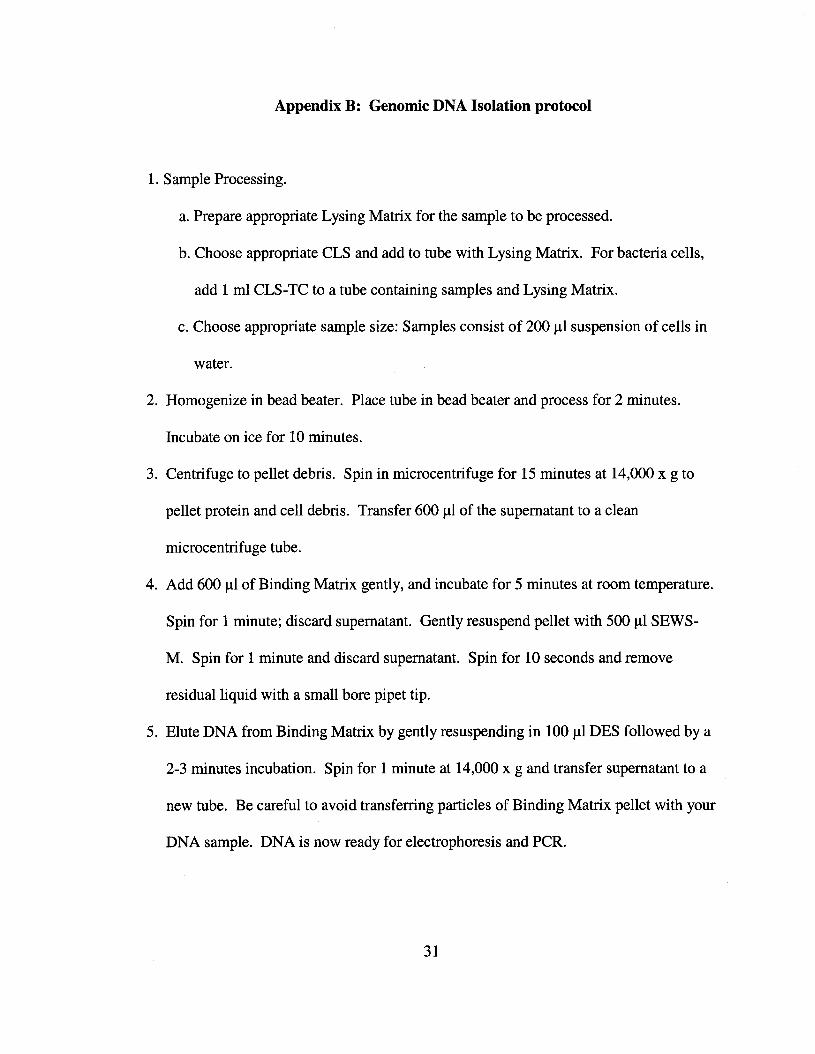
Appendix B: Genomic DNA Isolation protocol
1. Sample Processing.
a. Prepare appropriate Lysing Matrix for the sample to be processed.
b. Choose appropriate CLS and add to tube with Lysing Matrix. For bacteria cells,
add 1 ml CLS-TC to a tube containing samples and Lysing Matrix.
c. Choose appropriate sample size: Samples consist of 200 III suspension of cells in
water.
2. Homogenize in bead beater. Place tube in bead beater and process for 2 minutes.
Incubate on ice for 10 minutes.
3. Centrifuge to pellet debris. Spin in microcentrifuge for 15 minutes at 14,000 x g to
pellet protein and cell debris. Transfer 600 III of the supernatant to a clean
microcentrifuge tube.
4. Add 600 III of Binding Matrix gently, and incubate for 5 minutes at room temperature.
Spin for 1 minute; discard supernatant. Gently resuspend pellet with 500 III SEWS
M. Spin for 1 minute and discard supernatant. Spin for 10 seconds and remove
residual liquid with a small bore pipet tip.
5. Elute DNA from Binding Matrix by gently resuspending in 100 III DES followed by a
2-3 minutes incubation. Spin for 1 minute at 14,000 x g and transfer supernatant to a
new tube. Be careful to avoid transferring particles of Binding Matrix pellet with your
DNA sample. DNA is now ready for electrophoresis and PCR.
31
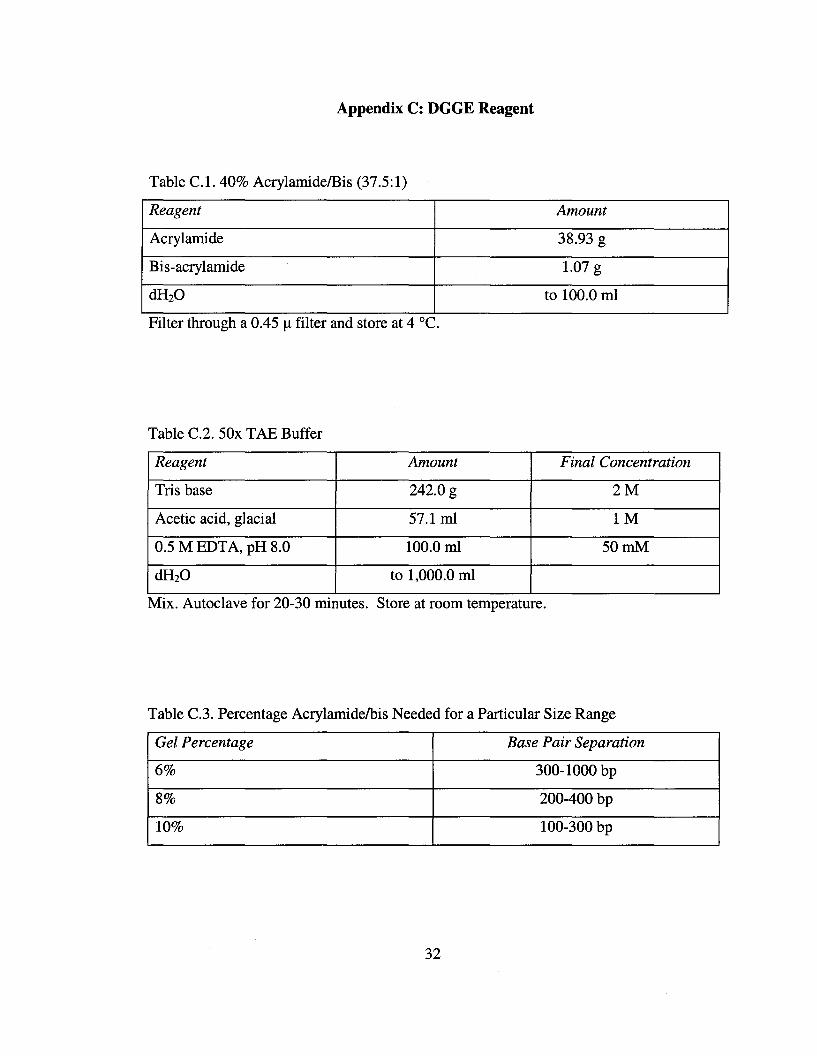
Appendix C: DGGE Reagent
Table C.1. 40% AcrylamidelBis (37.5:1)
Reagent Amount
Acrylamide 38.93 g
Bis-acrylamide 1.07 g
dH20 to 100.0 ml
FIlter through a 0.45 I..l fIlter and store at 4 cC.
Table C.2. 50x TAE Buffer
Reagent Amount Final Concentration
Tris base 242.0 g 2M
Acetic acid, glacial 57.1 ml 1M
0.5 M EDTA, pH 8.0 100.0 ml 50mM
dH20 to 1,000.0 ml
Mix. Autoclave for 20-30 minutes. Store at room temperature.
Table C.3. Percentage Acrylamidelbis Needed for a Particular Size Range
Gel Percentage Base Pair Separation
6% 300-1000 bp
8% 200-400 bp
10% 100-300 bp
32

Table C.4. 0% Denaturing Solution
6% Gel 8% Gel 10% Gel
40 Acrylamide/Bis 15 ml 20ml 25ml
50x TAB buffer 2ml 2ml 2ml
dHzO 83 ml 78ml 73ml
Total volume 100ml 100ml 100ml
Degas for 10-15 minutes. Fillter through a 0.45 f.l filter. Store at 4 °C in a brown bottlefor approximately 1 month.
Table C.5. 100% Denaturing Solution
6% Gel 8% Gel 10% Gel
40 Acrylamide/Bis 15 ml 20ml 25ml
50x TAB buffer 2ml 2ml 2ml
Formamide (deionized) 40ml 40ml 40ml
Urea 42g 42 g 42g
dHzO to 100 ml to 100 ml to 100 ml
Degas for 10-15 minutes. Fillter through a 0.45 f.l fIlter. Store at 4 °C in a brown bottlefor approximately 1 month. A 100% denaturant solution requires re-dissolving afterstorage. Place the bottle in a warm bath and stir for faster results.
Table C.6. Formamide and Urea Amounts for Denaturing Solutions Less Than 100%
Denaturing Solution 10% 20% 30% 40% 50% 60% 70% 80% 90%
Formamide (ml) 4 8 12 16 20 24 28 32 36
Urea (g) 4.2 8.4 12.6 16.8 21 25.2 29.4 33.6 37.8
For denaturing solutions less than 100%, use the volumes for acrylamide, TAB and waterdescribed in the 100% Denaturing Solution. Use the amounts indicated above for ureaand formamide.
33

Table C.7. 10% Ammonium Persulfate
Reagent Amount
Ammonium persulfate 0.1 g
dHzO 1.0 ml
Store at -20°C for about a week.
Table C.8. DCode Dye Solution
Reagent Amount Final Concentration
Bromophenol blue 0.05 g 0.5%
Xylene 0.05 g 0.5%
Ix TAB buffer 10.0 ml Ix
Store at room temperature. ThIS reagent IS suppbed In the DCode electrophoresis reagentkit for DGGE.
Table C.9. 2x Gel Loading Dye
Reagent Amount Final Concentration
2% Bromophenol blue 0.25 m1 0.05%
2% Xylene cyanol 0.25 ml 0.05%
100% Glycerol 7.0ml 70%
dHzO 2.5 ml
Total volume 10.0 ml
Store at room temperature.
Table C.lO. Ix TAB Running Buffer
Reagent Amount
50x TAB buffer 140ml
dHzO 6,860 ml
Total volume 7,000 m1
34

Appendix D: DGGE Operation
Pre-heating the Running Buffer
1. Fill the electrophoresis tank with 7 L of Ix TAE running buffer.
2. Place the temperature control module on top of the electrophoresis tank. Turn the
power, pump, and heater on.
3. Set the temperature controller to the desired temperature with a temperature ramp rate
of 200 °e.
4. Preheat the buffer to the set temperature.
Assembling the Parallel Gradient Gel Sandwich
1. Lay the large rectangular plate down first, and then place the left and right spacers of
equal thickness along the short edges of the larger rectangular plate.
2. Place the short glass plate on top of the spacers so that it is flush with the bottom edge
of the long plate.
3. Loosen the single screw of each sandwich clamp. Place each clamp by the appropriate
side of the gel sandwich with the arrows facing up and toward the glass plates.
4. Guide the left and right clamps onto the sandwich. Tighten the screws.
5. Place the sandwich assembly in the alignment slot of the casting stand with the short
glass plate forward. Loosen the sandwich clamps and insert an alignment card.
6. Align the plates and spacers. Tighten both clamps just enough to hold the sandwich in
place.
7. Remove the alignment card. Remove the sandwich assembly from the casting stand.
35

Casting Parallel Denaturing Gradient Gels
1. Place the gray sponge onto the front casting slot. Place the sandwich assembly on the
sponge with the shorter plate facing you. Press down on the sandwich and tum the
handles of camshaft down so that the cams lock the sandwich in place.
2. Connect one end of 9 cm Tygon tubing to the Y-fitting and connect a luer coupling to
the other end of 9 cm tubing. Connect luer fittings onto the two long pieces of tubing.
Connect the luer fittings to 30 ml syringes.
3. Label one of the syringes LO and one HI. Attach a plunger cap onto each syringe
plunger head. Position the plunger head in the middle of the plunger cap and tighten
enough to hold the plunger in place. Slide each syringe into a syringe sleeve.
4. Rotate the cam wheel counterclockwise to the start position. Set the desired delivery
volume.
5. From the stocks solutions, pipet out the desired amounts of the high and low density
gel solutions into two disposable test tubes.
6. Add the final concentration of 0.09% (v/v) each of ammonium persulfate and TEMED
solutions. Cap and mix. Withdraw all of the high density solution and low density
solution into the HI and LO syringe, respectively.
7. Push the gel solution to the end of the tubing.
8. Place the LO syringe into the LO side of gradient delivery system syringe holder.
Place the HI syringe into the HI side of gradient delivery system syringe holder.
9. Slide the tubing from the LO and HI syringes over two ends on the Y-fitting.
10. Attach a 19 gauge needle to the coupling. Hold the beveled slide of the needle at the
top-center of the gel sandwich and cast.
36

11. Rotate the cam wheel slowly and steadily to deliver the gel solution.
12. Carefully insert the comb. Let the gel polymerize for about 60 minutes.
13. Rinse the tubing and Y-fitting by placing the tubing and needle into a beaker of water
and reversing the cam.
14. After polymerization, remove the comb by pulling it straight up slowly and gently.
Assembling the Upper Buffer Chamber
1. Lay the inner core flat on a bench.
2. Release the gel sandwich from the casting stand.
3. Position the gel sandwich so that the locating pins on the core are fitted into the
grooves on the outside surface of the sandwich clamps.
4. Gently push the gel sandwich down onto the core with one simple motion.
5. Repeat steps 1-4 to attach the second gel sandwich. If only one gel is to be run,
assemble a set of glass plates without the spacers.
6. Pour 350 ml of running buffer into the upper buffer.
7. When the running buffer has reached the desired temperature, tum the system off.
Place the core and attached gel assemblies into the buffer chamber.
8. Tum on the system. Allow the system to reach the set initial temperature before
loading.
Sample Loading
1. Remove the clear loading lid. Wash the wells with running buffer.
2. Load the samples using a pipetman and sequencing lading tip.
37

3. Place the clear loading lid on top of the temperature control module.
Running the Gel
1. Attach the electrical leads to Bio-Rad's Power Pac 300.
2. Run the gel at 130 volts for 210 min.
Removing the gel
1. After electrophoresis is complete, tum the system off and let the heater to cool for 1
min. Remove the temperature control module
2. Gently remove the assembly.
3. Loosen the single screw of each clamp. Carefully pry off the shorter glass plate.
4. Remove the spacers and cut one comer of the gel to distinguish between gels.
Staining and Photographing the Gel
1. Place the gel into a dish containing 250 ml of Ix running buffer and 25 IJI of 10 mg/ml
ethidium bromide. Stain for 10 min.
2. Using 250 ml of Ix running buffer to destain for 5 min.
3. Place the gel on the UV transilluminator of Gel Doc 2000 and photograph.
38
REFERENCES
American Public Health Association. 1998. Standard Methods for the Examination of
Water and Wastewater, 20th Ed. Washington DC: American Public Health Assoc.
Byappanahalli M, Fujioka R. 1998. Evidence that tropical soil can support the growth
of Escherichia coli. Water Sci. Technol., 38:171-174.
Desmarais TR, Solo-Gabriele HM, Palmer CJ. 2002. Influence of soil on fecal indicator
organisms in a tidally influenced subtropical environment. Applied and
Environmental Microbiology, 68(3):1165-1172.
Entry JA, Phillips I, Stratton H, Sojka RE. 2003. Polyacrylamide + A!z(S04)3 and
polyacrylamide + CaO remove coliform bacteria and nutrients from swine
wastewater. Environ Pollut, 121(3):453-62.
Fogel GB, Collins CR, Li J, Brunk CF. 1999. Prokaryotic genome size and SSU
rDNA copy number: estimation of microbial relative abundance from a mixed
population. Microb Ecol, 38(2):93-113.
Fujioka R, Hardina C. 1995. Soil: the environmental source of Escherichia coli
and enterococci in Hawaii's streams. Environ. Toxicol. Water Qual., 6:185-195.
Gerba CPo 1987. Transport and fate of viruses in soils. In: Rao VC, Melnick JL, editors.
Boca Raton, Florida: CRC Press.
Hurst CH. 1988. Influence of aerobic microorganisms upon virus survival in soil. Can J
Microbiol, 34(5):696-9.
39

Juck D, Charles T, Whyte LG, Greer, CWo 2000., Polyphasic microbial community
analysis of petroleum hydrocarbon-contaminated soils from two northern Canadian
communities. Microbiology Ecology, 33:241-249.
Kurisu F, Satoh H, Mino T, Matsuo T. 2002. Microbial community analysis of
thermophilic contact oxidation process by using ribosomal RNA approaches and the
quinine profile method. Water Res, 369(2):429-438.
Lane DJ. 1991. 16S123S rRNA sequencing. In Nucleic acid techniques in bacterial
systematics. E. Stackebrandt, M. Goodfellow (Eds.), New York: John Wiley and
Sons.
Lapara TM, Nakatsu CH, Pantea L, Alleman J. 2000. Phylogenetic analysis of bacterial
communities in mesophilic and thermophilic bioreactors treating pharmaceutical
wastewater. Appl. Environ. Microbiol., 66:3951-3959.
Lipson SM, Stotzky G. 1985. Effect of bacteria on the inactivation and adsorption on
clay minerals of reovirus. Can J Microbiol, 31(8):730-5.
Lopez-Torres AJ, Hazen TC, Toranzos GA. 1987. Distribution and in situ survival and
activity of Klebsiella pneumoniae and Escherichia coli in a tropical rain forest
watershed. Curro Microbiol., 15:213-218.
Miller ME. 1987. Hydrogeologic characteristics of central Oahu subsoil and saprolite:
implications for solute transport. Master's thesis (Geology/Geophysics), University
of Hawaii at Manoa, Honolulu, P231.
Murakami GA, Ray C. 2000. Turf irrigation in Hawaii using R-l effluent: microbial and
chemical effects. J. Environ. Sci. Health, A35(7):957-980.
40

Muyzer G, de Waal EC, Uitterlinden, AG. 1993. Profiling of complex microbial
populations by denaturing gradient gel electrophoresis analysis of polymerase chain
reaction-amplified genes coding for 16S rRNA. Appl. Environ. Microbiol., 59:695
700.
Nasser AM, Glozman R, Nitzan Y. 2002. Contribution of microbial activity to virus
reduction in saturated soil. Water Res, 36:2589-95.
Nasser AM, Oman SD. 1999. Quantitative assessment of the inactivation of pathogenic
and indicator viruses in natural water sources. Water Res, 33:1748-52.
NUbel U, Engelen B, Felske A, Snaidr J, Wieshuber A, Amann RI, Ludwig W, Backhaus
H. 1996. Sequence heterogeneities of genes encoding 16S rRNAs in Paenibacillus
polymyxa detected by temperature gradient gel electrophoresis. J. Bacteriol.,
178(19):5636-5643.
Parkpian P, Leong ST, Laortanakul P, Poonpolwatanaporn P. 2002. Environmental
applicability of chitosan and zeolite for amending sewage sludge. J Environ Sci
Health, A37(10):1855-70.
Pettygrove GS, Asano T (ed.). 1985. Irrigation with reclaimed municipal wastewater-a
guidance manual. Michigan: Lewis Publishers.
Quanrud DM, Carroll SM, Gerba CP, Arnold RG. 2003. Virus removal during
simulated soil aquifer treatment. Water Res, 37:753-762.
Schijven JK, Hassanizadeh SM. 2000. Pemoval of viruses by soil passage: overview of
modeling, processes and parameters. Grit Rev Environ Sci Technol, 30:49-127.
41

Ward DM, Weller R, Bateson MM. 1990. 16S rRNA sequences reveal numerous
uncultured microorganisms in a natural community. Nature, 345:63-65
Wong TP. 2001. Polyacrylamide (PAM) effects on viruses and bacteria transport in an
unsaturated oxisol. Master's thesis (Civil Engineering), University of Hawaii at
Manoa, Honolulu.
Yamaura G. 1989. A laboratory and field study on the disposal of domestic wastewater based on soil permeation. Nippon Eiseigaku Zasshi, 43(6):1075-91.
Yates MV, Gerba CP, KellyLM. 1985. Virus persistence in groundwater. Appl
Environ Microbiol, 49(4):778-781.
0vreas L, Forney L, Daae FL, Torsvik V. 1997. Distribution of bacterioplankton in
meromictic Lake Saelevannet, as determined by denaturing gradient gel
electrophoresis of PCR-amplified gene fragments coding for 16S rRNA. Appl.
Environ. Microbiol., 63:3367-3373.
0vreas L, Torsvik V. 1998. Microbial diversity and commynity structure in two
different agricultural soil communities. Microb Ecol, 36:303-315.
42