risk and safety aspects of risk assessment and mitigation ... · 3/30/2018 · with the...
TRANSCRIPT

Risk and Safety Aspects of
Risk Assessment and Mitigation Phase Report
of Pacific Gas & Electric Company
Investigation 17-11-003
Arthur O’Donnell Edwin A. Charkowicz, CPA
Jeremy Battis Amy Chamarty
Steven Haine, P.E. Fred Hanes, P.E.
Martin Kurtovich, P.E.
March 30, 2018

Page | 2
This page intentionally left blank

Page | 3
EXECUTIVE SUMMARY
The Pacific Gas & Electric Company (PG&E) Risk Assessment and Mitigation Phase (RAMP)
filing is the second of its kind and the first for PG&E, serving as a precursor to the utility’s Test
Year 2020 General Rate Case, which is expected to be filed by September 1, 2018.
The framework and expectations for RAMP filings are guided by decisions in the Risk-Informed
Decision Making for General Rate Cases Rulemaking (D.14-12-025 in R.13-11-006) and in the
subsequent Safety Model Assessment Proceeding (S-MAP) (D.16-08-018 in A.15-05-002, et al.).
The Commission directed Safety and Enforcement Division (SED) Staff to consider the
completeness of the utilities’ report, including consistency and compliance Commission orders,
as well as to determine whether PG&E: a) prioritized its risks, b) ranked its risks, c) described
baseline controls and costs, d) prioritize mitigations, e) risk mitigation plan, and f) examined two
alternatives for each identified risk.
In general, Staff found that PG&E met these RAMP filing criteria with few minor exceptions.
The utility prioritized and ranked 22 risks and provided a description of baseline controls and
costs for each risk. PG&E credibly completed 1-8 of the 10 Cycla steps.
Each risk included a description of mitigation projects and proposed plan that included a set of
mitigations with rationale as to why they best mitigate risk in accordance with PG&E’s goals.
Each risk chapter provided two sets of alternative mitigations with varying degrees of
explanation to rationalize their rejection.
If there is a theme to the PG&E RAMP, it would be “evolution in modeling tools and continual
improvement in approach” as this filing and the process it describes may be characterized as an
advance in many regards. However, this evolution has also brought additional complexity to
PG&E’s risk methodology, including a greater reliance on probabilistic risk assessment, a new
modeling tool, and refined attempts to illustrate how the components of the analysis fit together.
New to this RAMP is PG&E’s methodology for quantifying each risk category’s Multi-Attribute
Risk Score (MARS).
PG&E’s current model is very complex, and it calculates expected value (EV), tail-average (TA)
values for combined MARS which feed into the calculation of the corresponding Risk Spend
Efficiency (RSE) score. While largely positive developments in the evolution of RAMP, these
new aspects raised challenges for Staff evaluation and a consistent set of issues across the rated
Risks that Staff review has not been able to entirely resolve.
Key Areas of Strength:
The model for stand-alone risks consistently produced results in accordance with risk owner
inputs.
The model incorporates probabilistic determinations of risk and risk reduction.

Page | 4
With the cross-cutting model PG&E has made a first attempt at calculating relative risk
scores and risk reduction, which adds to the discussion of what is the best way to approach
functional risks affecting multiple operations across the organization.
This filing builds on lessons learned from the first RAMP filing by the Sempra Utilities.
Though densely packed with information, the opening Chapters A and B provided helpful
information required for understanding the key attributes of its RAMP filing.
Providing Lessons Learned throughout the filing was constructive in understanding the
current state of evolution of its RAMP and potential areas of improvement for future RAMP
filings and in the S-MAP.
Key Areas for Improvement:
PG&E did not provide a MARS or RSE for existing controls because they wanted to focus
the forward looking nature of its programs and to understand the potential risk reduction
associated with new mitigation investments. However, without the relative context provided
by RSEs and MARS for existing controls, it is very difficult to assess the relative benefit
provided by the proposed mitigations. Therefore, Staff strongly recommends that PG&E
provide MARS and RSE for all controls on the same basis developed for mitigations for their
future RAMP filings.
The risk owner and SME inputs should be fully explained throughout the chapters and
model. The outputs of the model reflect these choices and without transparency into these
key inputs the value of the model outputs could be called into question.
A more rigorous review of the data, data sources, and data integrity should be done to
identify and correct any errors and to vet the input data prior to completing the RAMP.
Numerous small errors and data inconsistencies raise concerns over the output of the model.
Without having access to the modeling software it is difficult to see how the results of the
complex model flow throughout the model. Additional sheets in the model should be saved
with the calculation results and output frozen as values that can be tied back to the summary
workbooks.
The cross-cutting model duplicates some risks already addressed in the stand-alone risk
chapters, and there is confusion in defining the risk, risk drivers and how mitigations link to
risk drivers. Because PG&E’s cross-cutting model is novel and has not been vetted in the
S-MAP proceeding, there may be a need for a deeper review and evaluation than can be
provided here. Should the cross-cutting analysis remain among features that parties to the
current S-MAP model settlement negotiations can agree upon for a common approach,
refinement of a methodology for cross-cutting risks should be a priority in the next S-MAP
cycle.
Conclusion:
It is clear based on the level of complexity and the volume of documentation provided that
PG&E and its RAMP team expended considerable effort to complete the RAMP filing.

Page | 5
PG&E also took great pains to meet with CPUC Staff on several occasions as it was developing
the RAMP approach employed here, and was exceptionally responsive to data requests and post-
filing questions about the model.
This RAMP filing incorporates several of the lessons learned from Sempra’s first RAMP filing
(consistently modeled output, models for each chapter provided, overall results accumulated in
one workbook, and providing lessons learned). The Cycla steps 1-8 were met appropriately.
Though there are several issues noted above which could be improved upon, this RAMP
represents and evolved process and has raised the bar for future RAMP filings.
A major issue is the extent to which the assessment of risk-event likelihood is based upon
PG&E’s own data, use of industry-wide statistics, or – when quantification is lacking – mostly
subjective assessments. PG&E has made a major effort to employ better quantification, where
available, and to identify the sources of data used, but this aspect of the risk assessment is not
fully transparent.
A general observation is that risk areas that have greater available data specific to PG&E seem to
provide a far more solid basis for evaluating the proposed mitigations.
In general, Staff found the filing to be in accordance with the Commission directives in D.14-12-
025 in R.13-11-006 and in D.16-08-018 in A.15-05-002, et al.
Because the Commission has not yet adopted a common methodology or risk model for these
proceedings, it would be premature to conclude that PG&E’s current model and outcomes can be
used as the sole basis for determining reasonableness of proposed mitigation activities in the
forthcoming GRC. That is not to denigrate the effort that has been put into this RAMP filing by
PG&E, but a statement of how far the Commission, utilities and intervenors still have to go to
develop a transparent and consistent approach to incorporating risk into rate case decisions.
Staff has done our best to balance the critique of this RAMP filing with our own evolving
understanding of the process. Just as PG&E’s model and assessment is more detailed and
complex, parties might find that Staff’s evaluation of some of the key risk areas has also gotten
more detailed and critical.
We are all learning with each iteration of utility filings.
###

Page | 6
Table of Contents
Executive Summary ....................................................................................................................................... 3
1 Introduction and Background .............................................................................................................. 8
1.1 SED Approach to PG&E’s RAMP Filing ........................................................................................ 11
1.2 Evaluation of PG&E’s 2017 RAMP Using the Cycla 10-step Framework ..................................... 13
1.3 PG&E’s Approach and Risk Model Overview .............................................................................. 19
1.4 Overall Assessment ..................................................................................................................... 19
1.5 Calculating Risk Spend Efficiency ................................................................................................ 25
2 PG&E’s Top Risks Summarized ........................................................................................................... 27
2.1 Transmission Pipeline Rupture with ignition .............................................................................. 33
2.2 Failure to Maintain Capacity for System Demands ..................................................................... 40
2.3 Measurement and Control (M&C) Failure – Release of Gas with Ignition Downstream ............ 47
2.4 Measurement and Control (M&C) Failure – Release of Gas w/ Ignition .................................... 52
2.5 Release of Gas with Ignition on Distribution Facilities – Cross Bore .......................................... 55
2.6 Compression and Processing Failure – Release of Gas with Ignition .......................................... 59
2.7 Release of Gas With Ignition on Distribution Facilities – Non-Cross Bore .................................. 64
2.8 Natural Gas Storage Well Failure – Loss of Containment with Ignition at Storage Facility ........ 67
2.9 Distribution Overhead Conductor Primary ................................................................................. 72
2.10 Transmission Overhead Conductor (TOHC) ................................................................................ 79
2.11 Wildfire........................................................................................................................................ 83
2.12 Nuclear Core Damage ................................................................................................................. 90
2.13 Hydro System Safety - Dams ....................................................................................................... 94
2.14 Contractor Safety ...................................................................................................................... 101
2.15 Employee Safety ....................................................................................................................... 113

Page | 7
2.16 Motor Vehicle Safety ................................................................................................................ 116
2.17 Lack of Fitness for Duty Program Awareness ........................................................................... 121
2.18 Cyber Attack .............................................................................................................................. 126
2.19 Insider Threat ............................................................................................................................ 129
2.20 Records and Information Management (RIM) .......................................................................... 133
2.21 Skilled and Qualified Workforce ............................................................................................... 140
2.22 Climate Resilience ..................................................................................................................... 144
3 Special Sections – Appendices ......................................................................................................... 148
3.1 Risk Assessment for Substations ............................................................................................... 148
4 Conclusion and Recommendations .................................................................................................. 151

Page | 8
1 INTRODUCTION AND BACKGROUND
The Pacific Gas & Electric Company (aka PG&E) Risk Assessment and Mitigation Phase
(RAMP) filing is the second of its kind, following the 2016 RAMP filing from the Sempra
Utilities. This SED Staff evaluation of PG&E’s RAMP report is still considered an evolutionary
step and not a definitive assessment of the utility’s filing. At best, it may provide some objective
analysis and point out some ways to improve subsequent RAMPs.
This staff report is being issued in accordance with the procedures adopted in prior rulemakings
and application proceedings. On November 14, 2013, the Commission issued an Order
Instituting Rulemaking to Develop a Risk-Based Decision-Making Framework to Evaluate
Safety and Reliability Improvements and Revise the Rate Case Plan for Energy Utilities (the
Risk OIR).1 The purpose of this rulemaking was to incorporate a risk-based decision-making
framework into the Rate Case Plan (RCP) for the energy utilities’ General Rate Cases (GRCs).2
Such a framework and associated parameters would assist the utilities, parties, and the
Commission in evaluating how energy utilities assess safety risks, and how they will manage,
mitigate, and minimize such risks.
On December 9, 2014, the Commission issued D.14-12-025 to modify the rate case plan to
incorporate a risk-based decision-making framework into the GRCs for the large energy
utilities.3 While each of the respondent utilities had already begun incorporating elements of the
new framework into the respective GRCs, the current application represents the only the second
GRC to fully fall under the purview of D.14-12-025 and its requirement for a RAMP.
The purpose of the RAMP, as described in the order, is to “provide a transparent process to
ensure that the energy utilities are placing safety of the public, and of their employees, as a top
priority in the GRC proceedings.”4 The decision recommended that the RAMP filing include:
The utility’s prioritization of the risks it believes it is facing and a description of the
methodology used to determine these risks.
A description of the controls currently in place as well as the “baseline” costs associated
with the current controls.
The utility’s prioritization of risk mitigation alternatives, in light of estimated mitigation
costs in relation to risk mitigation benefits (a Risk Mitigated to Cost Ratio).
The utility’s risk mitigation plan, including an explanation of how the plan takes into
account: utility financial constraints; execution feasibility; affordability impacts; and any
other constraints identified by the utility.
1 Rulemaking (R.) 13-11-006
2 In addition, this would apply to PG&E’s Gas Transmission and Storage (GT&S) rate cases. 3 D.14-12-025, Ordering Paragraph 3.
4 Ibid at p.35-36.

Page | 9
For comparison purposes, at least two other alternative mitigation plans the utility
considered and an explanation of why the utility views these plans as inferior to the
proposed plan. 5
The subsequent Commision interim decision in the ongoing Safety Model Assessment
Proceeding (S-MAP)6 adopted guidelines for what the RAMP submissions should include, as
well as a basic evaluation checklist for RAMP submissions. A key element of the risk
assessment models is conformance with the 10-step criteria developed by Cycla Corporation
during PG&E’s Test Year 2016 GRC as the tool to be used for evaluating the maturity,
robustness, and thoroughness of a utility’s risk-based methodology in GRCs.7
Among the directives of the decision that apply to this RAMP:
PG&E was directed to remove shareholders’ financial interests from consideration in
their risk models and decision frameworks used to support rate case expenditure
proposals, especially at the operational level, unless the utility can make a good case for
an exception in its RAMP filing.
RAMP filings by PG&E shall explicitly include calculation of risk reduction and a
ranking of mitigations based on risk reduction per dollar spent.
PG&E shall file a RAMP based on its current risk evaluation and risk-based decision-
making methodologies, and additional requirements as listed in the ten major components
that shall be included in the RAMP filings.
In addition, the Commission in D.16-08-018 included as necessary elements of the utilities’
RAMP filings “a description of safety culture, executive engagement and compensation,” and a
directive that should the utility identify “immediate” safety situations, they should be addressed
in proceedings separate from the GRC.
On September 1, 2017, PG&E requested an investigation to evaluate their respective RAMP
filings.8 On November 17, 2017, the Commission issued an Order Instituting Investigations,
pursuant to a ruling from the assigned Administrative Law Judge (ALJ). On November 30, 2017,
PG&E filed its RAMP report.
The Commission directed the Safety and Enforcement Division (SED) to evaluate the RAMP
submission for consistency and compliance to their respective risk models and to prepare a
report. The Assigned Commissioner’s scoping memo and ruling for OII 17-11-003 issued on
5 Ibid at p.31-32.
6 D. 16-08-018
7 D.16-08-018, Ordering Paragraph 4.
8 I.17-11-003

Page | 10
March 9, 2018, set out the issues to be addressed in the consolidated proceeding related to the
SED report consistent with D.16-08-018 and D.17-05-013.9
The Scoping Memo also provided for a workshop to address SED’s report and to give parties an
opportunity to propose or recommend whether additional workshops are necessary. While there
is no expectation for hearings or a decision/ruling to adopt the SED report, the utilities are
expected to use the evaluation to refine their GRC filings, which are due in September 2018.
The Commission directed SED to determine whether PG&E included the following in its RAMP
filing:10
The utility’s prioritization of the risks it believes it is facing and a description of the
methodology used to determine these risks.
A description of the controls currently in place as well as the “baseline” costs
associated with the current controls.
The utility’s prioritization of risk mitigation alternatives, in light of estimated
mitigation costs in relation to risk mitigation benefits (Risk Mitigated to Cost Ratio).
The utility’s risk mitigation plan, including an explanation of how the plan takes into
account: utility financial constraints; execution feasibility; affordability impacts; and
any other constraints identified by the utility.
For comparison purposes, at least two other alternative mitigation plans the utility
considered and an explanation of why the utility views these plans as inferior to the
proposed plan.
The Commission directed SED’s evaluation to consider the completeness of the utilities’ report,
including consistency and compliance with criteria established in D.16-08-018 and the Scoping
Memo issued March 9, 2018:
Is the proposal complete – i.e., does the utility’s proposal address the top risks as
identified by the utility?
Are there any significant risks that have been missed in the proposal?
Are there reasonable mitigation options that have not been examined?
Is the proposed risk mitigation contained in the proposal an efficient allocation for the
risks that the utility faces? Are there any proposed programs that are clearly dominated
by possible alternative programs in terms of the risk mitigation per dollar spent?
Do the proposed programs and alternatives represent a realistic set of options given the
current condition of the installed assets, best practices for management of those types of
assets, and the identified risks?
9 I.17-11-003, Commissioner’s Scoping Ruling, Pg. 6
10 Scoping Memo and Ruling I.17-11-003, issued March 9, 2018.

Page | 11
Are the proposed risk mitigation programs in line with stakeholder preferences?
The scope of this proceeding shall also include a review of PG&E’s compliance with the
additional requirements ordered in D.17-05-013 (Re PG&E’s 2017 GRC decision) for steady
state replacement and reliability program investments in the RAMP filing.
PG&E should strive for reasonable rates of steady state replacement, consistent with risk-
informed decision making, for crucial operating equipment necessary to provide safe and
reliable service; and
For the Reliability Program investments in its Electric Line of Business, PG&E should
strive to install equipment necessary or useful to providing reliable service consistent
with a holistic and measured approach to system reliability solutions.
1.1 SED APPROACH TO PG&E’S RAMP FILING
In all, PG&E presented 22 risks that were considered significant, using the agreed upon cut-off
for risks that scored 4 or above in terms of potential safety consequence, generally ranked by the
Safety Impact score determined by a Risk Evaluation Tool (RET). Staff agrees that this
approach presented a manageable level of risk analysis for the RAMP, although the Commission
may decide upon a different threshold for inclusion in the future. Also, the methodology for
evaluating the severity and probability of risks may change as a result of more experience and
with determinations made in the S-MAP. Because the model used in the RAMP is supposed to
be developed in accordance with S-MAP guidance, the specific model workings has not been
thoroughly evaluated by SED in its evaluation. Where obvious model issues were identified and
where Staff has confidence in the assessment of the implications, suggestions or
recommendations are offered to help refine the model.
PG&E introduced a new, refined scoring methodology in this RAMP called the Multi-Attribute
Risk Score (MARS), which provides a useful way to breaking the consequences of risk into
seven major elements or attributes. 11
Potentially, MARS may allow for comparison across risk
categories. PG&E acknowledged that the Commisison may, in a future decision, determine that
only a subset of those attributes should be considered, or that the weightings given to each
attribute may be different. Staff accepts this as a “state-of-the-art” approach.
The 22 risks outlined in this RAMP exhibited MARS that ranged from a high score of 824 for
Electric Distribution Overhead Primary (Chapter 9) to a low score of 4.96 for Skilled and
Qualified Workforce (Chapter 21). Each of the 22 risks is examined in its own chapter in the
RAMP filing. As PG&E explains in the report, they identified three risks that are interrelated
with stand-alone risks and sub-drivers of other risks.
11
The MARS are normalized and include all consequence scores for Injury, Fatality, Environmental, Reliability, Compliance, Trust, and Financial.

Page | 12
PG&E separated these three into what are termed “cross-cutting” risks, which attempt to
proportionally represent the drivers attributed to the cross-cutting risks as inputs in the respective
models.12
This report has not tried to exhaustively analyze each of the RAMP risks. Instead, Staff offers a
Summary of the risk chapters in light of their apparent Strengths, Areas in Need of
Improvement, and a Conclusion. Staff also selected a subset of risk chapters for a “deeper
dive” into specifics of the utility’s descriptions and how they attempt to meet the criteria
established by the Commission.
The following chapters were chosen for closer analysis:
Chapter 2- Failure to Maintain Capacity for System Demands
Chapter 3 - Measure and Control Failure – Release of Gas with Ignition
Downstream
Chapter 11 - Wildfire
Chapter 14 - Contractor Safety
Chapter 17 – Lack of Fitness for Duty Program Awareness
Staff may also offer observations and some questions, concerns and recommendations to
enhance clarity. It is hoped that this will provide both the utility and intervenors with a better
understanding how this RAMP was developed, minor and major issues that require further
development or closer examination in the testimony and hearings process for the forthcoming
GRC.
Other Matters
Because of time constraints and the lack of a Commission approved standard for evaluation, this
report does not specifically analyze the “safety culture” aspects of the utilities’ presentations, and
only provides an opinion on a cursory review of the appendix on “Steady State” capital
investments, which is of different character than the Risk chapters.
In appendix 2 of the RAMP filing PG&E addressed the commission ordered requirements for
steady state replacement and reliability program investments in the RAMP filing.
PG&E provided a summary of their approach to steady state investments for each line of
business (LOB) and how it ties to the RAMP filing. Staff reviewed the appendix and found the
summary informative and as expected with general overview of its current, and proposed
programs. The key focus is on their major asset categories, such as compressor unit controls
replacement and storage well refurbishment programs for Gas Operations; distribution line
equipment and distribution overhead conductor progarms for Electric Operations; and water
conveyance and power train for Generation.
12
The three “cross-cutting” risks that PG&E identified are Records and Information Management, Skilled and Qualified Workforce, and Climate Resilience.

Page | 13
Each operational LOB provided a primer on their organization and asset management strategy to
guide the reviewer and give a basic understanding of their approach. Each LOB also discussed
how they use risk assessment to determine which projects to select and help with their decision
making.
The PG&E RAMP has not identified any immediate critical safety situations, although there is a
strong indication that Wildfire risks, in particular, will be subjected to an enhanced set of
mitigations that go beyond what is described here.
In addition, because PG&E acknowledges it does not have a fully mature system, Staff will only
provide general feedback on how closely their model follows the Cycla 10-step model, which
has been adopted as a benchmark for utility risk model maturity in the S-MAP.
Staff also notes its appreciation for the PG&E’s responsiveness to requests for additional
information. Additionally, it appears that in order to fully understand the inputs and rationale
used by SMEs in the development of the MARS and RSE, additional data requests would have
been required to facilitate a more granular understanding of the model input choices and
corresponding outcomes.
1.2 EVALUATION OF PG&E’S 2017 RAMP USING THE CYCLA 10-STEP FRAMEWORK
In decision D.16-08-018 of the S-MAP, the Commission adopted the Cycla 10-step framework
as a common yardstick for evaluating the maturity, robustness, and thoroughness of a utility’s
Risk Assessment and Mitigation Models and risk management framework.13
The Cycla 10-step
framework was originally developed by the Cycla Corporation14
to evaluate PG&E’s Test Year
2014 general rate case application, with a specific focus on safety.
The purpose of the Cycla evaluation was to determine how PG&E’s decision processes explicitly
incorporated an understanding of safety risk in deciding how best to improve the safety of its gas
distribution system.
To evaluate this RAMP, SED more broadly applies the Cycla 10-step framework beyond the
original safety-only focus. This approach to expand beyond safety is consistent with the
evolving understanding in the S-MAP proceeding, where the focus was originally confined to
safety. As the S-MAP workshops progressed, stakeholders increasingly came to recognize that
other attributes also impacted safety and merited consideration in the risk calculation formulas.
Most notably, the reliability component strongly impacts the safety attribute. Other attributes
such as trust, compliance, and financial, as PG&E uses them in its risk evaluation formula in this
RAMP, also play a role in impacting safety. With this shift away from a safety-only focus, the
task at hand is to use the Cycla 10-step framework to evaluate how well PG&E explicitly
13 D.16-08-018, Order Paragraph 4. 14 The Cycla Corporation was engaged by the Safety and Enforcement Division as a consultant to evaluate the gas distribution portion of PG&E’s Test Year 2014 general rate case.

Page | 14
identified risks and provided a structure to devise risk mitigation strategies and decision-making
processes to allocate resources to manage those risks.
Cycla 10-Step Process
1. Identify the threats;
2. Characterize the sources of risk;
3. Characterize the candidate measures for controlling risk;
4. Characterize the effectiveness of the candidate risk control measures (RCMs);
5. Prepare initial estimates of the resources required to implement and maintain candidate RCMs;
6. Select RCMs the operator wishes to implement (based on anticipated effectiveness and costs
associated with candidate RCMs);
7. Determine the total resource requirements for selected RCMs;
8. Adjust the set of selected RCMs based on real‐world constraints such as availability of qualified
people to perform the necessary work;
9. Document and submit the General Rate Case filing, on which the CPUC decides the expenditures
it will allow, and, based on CPUC decision, adjust the operator’s implementation plan;
10. Monitor the effectiveness of the implemented RCMs and, based on lessons learned, begin the
process again.
The flowchart below gives a pictorial representation of the Cycla 10-step process:

Page | 15
PG&E’s approach to incorporate risk-informed decision-making and resource allocation has
evolved and improved greatly since the general rate case in 2012 (A.12-11-009) when the
Commission first required PG&E to explicitly consider safety risks in its application.
The overall approach has gained a great deal more formality and rigor.
1. Identify Threats
PG&E’s risk evaluation process begins at the line of business (LOB) level. For each LOB,
subject matter experts (SMEs) and other key players participate in workshops and brainstorming
sessions to identify “worst case probable events” (loosely described as “P95” events) that would
jeopardize the ability of the line of business to achieve its objectives. PG&E’s application
workpapers suggest that the thought process starts by first identifying a P95 event and then
backing out all possible risk drivers producing the event.
Each risk driver (and the associated P95 event) becomes an entry in the risk register. This
process, though indirect, is satisfactory in helping to identify credible and foreseeable events and
the associated threats.
PG&E uses a two-stage process to identify the top risks for inclusion in this RAMP. First,
PG&E uses the risk evaluation tool (RET) and the 7 x 7 matrix format to identify and evaluate all
risks. The risks with the top overall risk scores using the RET (with emphasis on those that had a
potential safety consequence of causing serious injuries) are included in the RAMP. In PG&E’s
terminology, a “risk” in the RET stage is a combination of these elements: a risk driver (also
referred to as threat cause), an undesirable event precipitated by the risk driver, the frequency at
which this event occurs that is directly attributed to this risk driver, and the 1 to 7 consequence
values for all the consequence attributes at the worst case probable level.
During the transition from the RET to RAMP, significant aggregation of the more granular risks
took place in combining these risks into the much higher-level risks in RAMP. This aggregation
is facilitated by the use of bow tie analyses, which combine exposure, event(s), and multiple risk
drivers into a single risk in RAMP.
After such aggregation, 22 of the top risks are presented in this RAMP.
Evaluation Result: Satisfactory
2. Characterize Sources of Risk
In Stage One of the process to identify and evaluate risks in RET, whole integer scoring of
consequence values on the logarithmic scale across five different attributes are used. Direct
multiplication of the consequence scores and frequency produce the risk scores in RET.
In Stage Two of the process, bow tie analyses are used to connect the identified events to
exposures, risk drivers, frequencies of the risk drivers causing the events. Unlike the evaluation
process in RET, which uses deterministic point values of frequencies and consequence, the risks
in Stage Two are modeled rigorously using discrete distributions such as Poisson or Binomial for

Page | 16
each risk driver to characterize the occurrence of failure events and then using continuous
distributions to model the consequence attributes by Monte Carlo simulations. The Stage Two
risk evaluation in RAMP produces a multi-attribute risk score (MARS) for each risk.
The rigorous State Two process to calculate a MARS is a significant improvement over the
simple RET process that was used in previous PG&E rate cases. One significant enhancement
between the simple P95 concept in RET and the Stage Two process used to calculate a MARS
scores is the use of tail averages that, according to PG&E, are a more stable measure of risk and
are more responsive to subtle (input) changes.
Another refinement used in the MARS model is the use of scaled natural units borrowed from
Joint Intervenors’ model in the S-MAP. Scaling helps to turn disparate natural units into a
uniform linear measure that can be easily understood. This change is a great improvement over
the whole integer scoring method in RET. The resulting MARS score is a linear scale risk score,
compared to the relative risk, logarithmic-scale scores produced by the RET.
The definition of the MARS score involves the weighted sum of tail averages over the five
attribute dimensions. There is still unresolved disagreement between PG&E and intervenor
experts in the S-MAP proceeding concerning whether averages or tail averages are more valid
representations of risk. There is also disagreement between PG&E and intervenor experts in the
S-MAP on whether it is meaningful to sum over tail averages of distribution functions, since
only the true average (mean) of differential distribution functions can be validly summed,
according to the intervenor experts. PG&E chooses the tail average concept to place emphasis
on low frequency, high consequence events.
PG&E also calculates the simple averages of the consequence attributes but the workpapers give
no indication of whether the averages influenced any risk mitigation selection decisions, since
the simple averages are not part of the MARS calculation.
One notable weakness in the MARS evaluation process is the high-level aggregation of
exposures. Although the models account for the granularity of exposures when evaluating
mitigations, they do not generally account for granularity of the exposures other than those
identified by the mitigations when calculating the baseline MARS. As an example, on the
Transmission Pipeline Rupture with Ignition risk, the exposure units are miles of transmission
lines.
In the Monte Carlo simulations on this risk, the transmission lines are only grouped by lines in
either high consequence areas (HCAs) and non-HCAs. Since pipeline diameter and operator
pressure play a significant role in determining the potential consequence of a rupture with
ignition, this level of oversimplification that ignores pipe diameters and pressures will lead to a
great deal of uncertainty in the resulting baseline and post-mitigation MARS values.
Another shortcoming of the risk identification/risk evaluation process is that risks may be
overlooked for one of two reasons. The first potential reason is that since the RET process forms
the basis for determining whether a risk is included in the RAMP, it is conceivable the a priori

Page | 17
ranking of risks using RET and a posterior ranking using MARS would yield different results.
Some risks could have been overlooked if MARS had been applied to the whole population of
risks and some might have been incorrectly included in the RAMP by the RET process.
Additionally, due to the heavy reliance on SMEs in the risk identification process, risks could
also be overlooked in the identification process, particularly if failure drivers are overlooked.
Evaluation Result: Satisfactory.
3. Identify candidate risk control measures (RCMs)
Generally speaking, PG&E’s process for coming up with candidate risk control measures looks
at the risk drivers both separately and holistically within a risk. A risk control measure may be
identified that can address a single risk driver or multiple risk drivers. The process of coming up
with candidate measures relies on looking at existing or historical practices, industry best
practices, regulatory requirements, and Subject Matter Expert (SME) judgment.
New in the selection process for the different risk mitigations is the calculation of risk spend
efficiency (RSE) for each control measure. Mitigations are usually selected based on the highest
risk spend efficiency unless there may be some identified resource constraints, compliance
constraints, or operational constraints that may favor another measure with a lower RSE.
The RAMP calls for providing two alternative risk control measures. Alternatives could be
based on different mitigation techniques, same techniques but on a different scale or executed at
a different pace. Generally speaking, SME judgment was used to select alternatives, with strong
preference for those with the highest RSEs.
Evaluation Result: Satisfactory, but modelling could benefit from increasing granularity.
4. Evaluate the anticipated risk reduction for identified RCMs
In calculating the risk reduction benefits and the RSE of a risk mitigation measure, PG&E limits
the time horizon to only six years. This six-year horizon tends to favor mitigations that have an
immediate risk reduction impact compared to measures that have a longer term or delayed risk
reduction impact. This implies that this RSE calculation methodology favors choosing operation
and maintenance (O&M) spending over capital improvement projects. PG&E recognizes that
their approach to calculate an RSE is an initial attempt and that further refinements in the RSE
formula may be needed in the future. The still on-going S-MAP proceeding may provide
guidance on what form the final RSE formula should take.
One weakness of the risk reduction calculation in both the RET step and the MARS step is that
the risk reductions are ultimately only estimated based on a mitigation’s estimated effects on the
distribution parameters of the frequency distributions and consequence distribution functions.
PG&E’s testimony mentions sensitivity analysis, which can be used to estimate the amount of
uncertainty in the risk reduction estimates, but neither sensitivity analysis nor uncertainty of
estimates was provide with the RAMP filing.

Page | 18
Evaluation Result: Refinements may be needed on the RSE formula to more fully capture the
delayed benefit of capital projects. The S-MAP proceeding may provide guidance on what form
the final RSE formula should take.
5. Determine resource requirements for identified RCMs
Two types of costs are presented in this RAMP. Recorded costs are shown for existing controls.
Estimates are also presented for the proposed mitigations. The workpapers do not go into any
detail as to the methodology used to derive the costs for the proposed mitigations and
alternatives. This issue will be revisited in more detail when the general rate case application is
filed.
Evaluation result: Evaluation for this step will be deferred until the review of PG&E’s GRC.15
6. Select RCMs considering resource requirements and anticipated risk reduction
For this step, an operator must base its justification of the need for an RCM either on a
quantitative comparison to a pre-defined acceptable risk threshold or on movement toward a
desired end state such as adoption of best industry practices. Although PG&E mentions the
concept of risk tolerance in the introductory section of the RAMP application, there is no
evidence PG&E established any explicit internal risk tolerance standard that was applied to this
RAMP.
We find evidence that compliance requirements, industry best practices, and SME judgment
guided the mitigation decisions (with respect to both type and extent of mitigations), which
imply a certain post-mitigation end state for each risk. The post-mitigation tail average MARS
varies widely from risk to risk, indicating that mitigation decisions were not driven by any pre-
determined uniform risk threshold.
Evaluation Result: Improvements needed to formalize a procedure to arrive at some
standardized end state(s) either for individual risks or for the portfolio of risks.
7. Determine total resource requirement for selected RCMs
As stated in Step 4, within each risk mitigations are usually selected based on the highest risk
spend efficiency score unless there may be some identified resource constraints, compliance
constraints, or operational constraints that may favor another candidate measure with a lower
RSE. With the exception of the crosscutting risks, the materials presented in the RAMP look at
the individual risks in isolation in justifying the selected mitigations and alternatives.
A potential pitfall with looking at risks and mitigations in isolation based on the RSE scores is
that the allocation of risk mitigation spending to the different risks may be suboptimal from an
aggregate risk portfolio standpoint.
15
Several of the RAMP Risks relate to natural gas operations, which are subject to a separate Gas Transmission and Storage (GT&S) rate case, A.17-11-009, but are included in this filing. The proposed expenditures for the mitigations are more substantiated in GT&S testimony than the preliminary estimates provided for other RAMP risk mitigation proposals.

Page | 19
PG&E presented documentation for recorded costs for all existing controls, but to thoroughly
apply this step to the evaluation, detailed cost estimation projections and the methodologies to
arrive at those cost projections would have to be examined. For this RAMP, SED did not review
the reasonableness of the projected costs or the methodologies to arrive at those projected costs.
Evaluation Result: SED did not evaluate the reasonableness of the cost estimates. For future
RAMPs and GRCs, PG&E should explore optimization techniques to allocate the mitigation
spending across the different risks.
8. Adjust the set of selected RCMs based on real‐world constraints such as availability of
qualified people to perform the necessary work
To fully satisfy this step, PG&E’s RAMP would need to identify constraints used to justify the
scope, pace, or mix of risk control measures. Although PG&E’s RAMP provided very detailed
description of the individual risks, controls, and mitigations, there is a notable absence of any
detailed discussion of constraints in limiting or altering the scope, pace, or mix of risk control
measures. Such descriptions are vital in providing a full justification of the proposed
mitigations.
Evaluation Result: PG&E should provide full descriptions of how and what real-world
constraints were considered in influencing the final selection of risk mitigation proposals.
9. Steps 9 and 10
The remaining steps 9 and 10 in the Cycla 10-step framework are not sufficiently applicable until
the actual GRC application is filed and the decision in the GRC has been rendered.
1.3 PG&E’S APPROACH AND RISK MODEL OVERVIEW
PG&E provides a good primer on its approach for this RAMP in the Chapters A – Introduction
and Chapter B – Risk Model Overview. Therefore, to avoid needless duplication, refer to
PG&E’s Chapter A and B.
1.4 OVERALL ASSESSMENT
Based on the overall level of maturity of the RAMP filing process, and the fact that only one
RAMP has been filed previously, the PG&E RAMP filing provides several improvements and
evolutionary steps. Nonetheless, there are aspects that may be improved to advance the RAMP
from a required exercise to a tool valued by intervenors and parties for assessing whether the
utility is focused its resources appropriately on safety issues and concerns.
Because Staff at this time does not know the parameters of a potential settlement of modelling
issues being negotiated by Parties to the S-MAP cases, it is uncerain whether PG&E’s particular
approach will undergo minor or extensive changes as a result. In any event, refinement of
RAMP guidance may well be a component of a future S-MAP application cycle (in 2019).

Page | 20
SED has determined in its evaluation of this RAMP filing that PG&E has largely met the
requirements spelled out in the I.17-11-003, D.14-12-025, and D.16-08-018. PG&E’s RAMP
filing is reasonably complete and comprehensive but lacks in details that are necessary to fully
evaluate the assertions and results of its RAMP filing and modeling process.
SED determined that, for the most part, PG&E has assessed its key safety risks, prioritized them,
identified and considered alternative mitigations, and there do not appear to be any significant
gaps in identifying risks and mitigation options.
In general, the RAMP filing was organized in a consistent fashion, which made for easy to
follow chapters, but had a tendency to over-generalize the specifics at times. Each chapter
included an executive summary, a tableau outlining the Risk Name, In Scope, Out of Scope, and
Data Quantification Sources, which provided a short hand snapshot of the risk and provided the
context for each risk, its breath and depth, as well as the potential consequence of failure.
PG&E’s use of the bow tie method shows graphically the interrelationship and the relative
importance of risk drivers, failure events, and outcomes. The distribution parameters are inputs
and outcomes are outputs.16
For the majority of the risks drivers identified, the utility offered a
complete – if sometimes cursory– narrative describing their various risks and drivers, and
included the required elements of the RAMP.
Another potentially useful addition to the bow tie is PG&E’s identification of “Exposure” which
is a way to define the relevant domain of assets (and data sources) affected by the risk event and
drivers. An example would be, for Risk 1 -Transmission Pipeline Rupture with Ignition, the
6,500 miles of transmission pipe on PG&E’s system. Exposure can also be expressed as a
business function, such as company data systems for the 18 - Cyber risk analysis bow tie. In a
cross-cutting risk, such as 22 - Climate Resiliance, the exposure is defined by 11 other risks that
both inform the Climate analysis and/or are magnified by expected Climate Change.
Although the concept underlying Exposure identification is worthwhile for defining the realm of
analysis and data, in this first impression, it is not consistently used, and should be vetted further.
In general, each chapter provided clear descriptions of the risk scenarios, and they provided a
reasonable basis for understanding the intent of the mitigations and how they might be able to
reduce the impact or frequency of the incidents. Yet for several mitigations, there needs to be
more effort in showing the correlation between the risk and the mitigations proposed.
A major issue is the extent to which the assessment of event likelihood is based upon PG&E’s
own data, use of industry-wide statistics, or – when quantification is lacking – mostly subjective
assessments. PG&E has made a major effort to employ better quantification, where available,
and to identify the sources of data used, but this aspect of the assessment is not fully transparent.
16
The drivers were arranged alphabetic order, however, to help better assess the most significant drivers they should be arranged in descending order of significance.

Page | 21
A general observation is that risk areas that have greater available data seem to provide a far
more solid basis for evaluating the proposed mitigations.
Multi-Attribute Risk Score (MARS):
The following list organizes PG&E’s Chapter risks in order of MARS TA Rank:
Table 1 - PG&E Multi-Attribute Risk Score and Risk Rank
These overall total scores do not necessarily correlate to the safety score for each of these risks.
In order to determine how they rank according the safety risk one must further sort on either of
the two components of the safety scores (injuries and fatalities). Because the fatality and injury
scores are Normalized, Weighted and Scaled these scores do not represent the TA in “Natural
Units” derived from the model. The Safety Injury TA Overall Average values are components of
the total TA Overall Average MARS. For example, in Chapter 15 Employee Safety, the model
calculated a Natural Unit (NU) TA Overall Average Safety Injury value of 702.9 and Fatality
value of 2.393, which represents the worst-case numbers for injuries and fatalities for the TA
Chapter # Risk prefix Risk Name
MARS-TA-
Overall
Average-Total
MARS-TA-
Overall
Average-Total-
RANK
9 DIST Distribution OH conductor 824.35 1
22 CR* Climate resilience 665.33 2
2 GSO Maintaining system capacity (GSO) 325.34 3
15 EMPSAFE Employee Safety 263.01 4
11 WILD Wildfire 257.58 5
19 INSIDER Insider Threat 233.79 6
10 TRANS Transmission OH conductor 227.50 7
16 MVS Motor Vehicle Safety 214.30 8
7 DMS Distribution - Non-cross bore 188.84 9
14 CONSAFE Contractor Safety 181.48 10
18 CYB Cyber attack 107.75 11
13 HYD Hydro dam failure 100.89 12
17 FFD Fitness for Duty 50.43 13
6 CPFAC Compression & Processing facility 39.86 14
1 GAS Transmission pipeline 37.62 15
5 DMSCB Distribution - Cross bore 28.46 16
20 ERIM ERIM 19.81 17
4 MCFAC Measurement & Control facility 17.49 18
8 STO Storage - Wells 12.68 19
3 MCDS Measurement & Control downstream 12.07 20
12 NUC Nuclear core damage 6.65 21
21 SQWF Skilled and qualified 4.96 22

Page | 22
using their 10,000 Monte Carlo simulations. After normalizing, weighting, and scaling the NU-
TA Overall Average Safety Injury value becomes MARS-TA of 191.89 and the MARS-TA
Fatality value becomes 65.26 for a MARS-TA total of 257.15, which is used to develop the
MARS and RSE.17
The following table shows how the Natural Units Overall Safety values for injuries and fatalities
can change due to normalizing, weighting and scaling to develop the MARS Overall Average
Safety Total used in the MARS and RSE outputs.
Table 2 – Chapter Risk NU-TA Safety Value, MARS Safety Totals and Rank by MARS and MARS Rank
Table 2 is included to show the complexity of the model affects the MARS score used for
ranking risks and they do not always reflect the MARS Safety ranking. Note that Nuclear Core
Damage risk has no injuries or fatalities risk and that its MARS is comprised of environmental,
trust and financial MARS values. The reason for Nuclear’s small MARS overall score is due to
the very small frequency of occurrence value assigned to the model.
17
NU-TA Injury score of 702.89 times 1/1000 (Normalize) time 0.02727 (Injury weighting) times 10,000 (Scaling Factor) = 191.89 MARS TA Injury total. Adding the MARS TA Overall Average Fatality value of 65.26 that becomes the cumulative MARS TA Overall Average Safety Total of 257.15.
Chapter
# Risk Name
NU-TA-Overall
Average-
Safety_Injury
NU-TA-Overall
Average-
Safety_Fatality
MARS-TA-
Overall
Average-
Safety-Total
MARS-TA-
Overall
Average-
Safety-
Total-
RANK
MARS-TA-
Overall
Average-
Total
MARS-TA-
Overall
Average-
Total-
RANK
9 Distribution OH conductor 11.112 7.073 195.92 2 824.35 1
22 Climate resilience 128.105 3.125 120.19 5 665.33 2
2 Maintaining system capacity (GSO) 0.730 0.252 7.08 12 325.34 3
15 Employee Safety 702.887 2.393 257.15 1 263.01 4
11 Wildfire 5.889 1.780 50.14 8 257.58 5
19 Insider Threat 4.443 0.099 3.91 19 233.79 6
10 Transmission OH conductor 2.971 2.971 81.84 6 227.50 7
16 Motor Vehicle Safety 41.897 4.583 136.41 4 214.30 8
7 Distribution - Non-cross bore 7.324 2.858 79.92 7 188.84 9
14 Contractor Safety 190.224 4.751 181.48 3 181.48 10
18 Cyber attack 0.765 0.038 1.25 21 107.75 11
13 Hydro dam failure 2.374 1.252 34.79 9 100.89 12
17 Fitness for Duty 5.031 1.167 33.19 10 50.43 13
6 Compression & Processing facility 0.128 0.250 6.85 13 39.86 14
1 Transmission pipeline 1.056 0.218 6.22 15 37.62 15
5 Distribution - Cross bore 1.134 0.235 6.72 14 28.46 16
20 ERIM 9.546 0.080 4.78 17 19.81 17
4 Measurement & Control facility 0.184 0.219 6.02 16 17.49 18
8 Storage - Wells 0.173 0.298 8.18 11 12.68 19
3 Measurement & Control downstream 0.658 0.157 4.47 18 12.07 20
12 Nuclear core damage 0.000 0.000 0.00 22 6.65 21
21 Skilled and qualified 0.141 0.052 1.45 20 4.96 22
Natural Units Normalized, Weighted
and Scaled MARS RANK

Page | 23
The review of the model and how it works was provided in the workshop, but as Staff found
during the review process the model is very detailed and complex.
The initial impressions of the model are that it is appears to provide a framework that
consistently calculates the Expected Values, Tail Averages and Risk Reductions. The weakness
of the model is the extensive reliance on SME inputs that are unexplained, unchallenged and
unsupported. Therefore, further evaluation of the model in S-MAP will give parties more
opportunity to ask questions and offer observations.
Financial, Execution and Affordability Constraints:
In some RAMP chapters the financial, execution feasibility, and other constraints were
discussed; however, in the larger context of affordability impacts and utility financial constraints,
the discussion only scratched the surface. Although the original intent of RAMP and S-MAP, as
expressed in D.14-12-025, was to focus solely on Safety risks, it is clear that to do so would
neglect very important inter-relationships, such as that of Safety and Reliability, or the economic
consequences of Safety lapses. PG&E’s use of the multiattribute scoring, via MARS, will serve
for this cycle as a way to incorporate and illustrate those relationships for individual risks.
However, this does not address the larger concern of how to effect a total risk reduction portfolio
in relationship to other, possibly conflicting state policies, or how to accommodate large
incremental expenditures for safety without breaking the bank.
The best place to elucidate, discuss and evaluate affordability and financial constraints would be
in the subsequent GRC filing where the safety risks can be holistically reviewed within the
context of the entire utility’s GRC.
Stand-alone and Cross-cutting Model:
SED appreciates PG&E’s efforts to develop and illustrate their model for calculating the MARS
and RSE. The model incorporates probabilistic calculations for the first time in a RAMP filing
and suggests that PG&E devote further efforts to explain how it works within the S-MAP.
PG&E provided a review of the model and how it works in a workshop following the issuance of
the RAMP, however, even with a subsequent review with PG&E model experts Staff still found
the model to be very detailed, complex and difficult to follow.
The initial impressions of the model are that it works as intended and provides a framework to
consistently calculate the Expected Values, Tail Averages and Risk Reductions.
The weakness of the model is the extensive reliance on SME inputs that are unexplained,
unchallenged and unsupported. Therefore, further evaluation of the model in S-MAP will give
parties more opportunity to ask questions and offer observations.

Page | 24
In some cases, PG&E could improve its description of the correlations between the risk drivers,
risks and the risk mitigations.18
The SMEs should provide sufficient rationale supporting the
assumed level of risk reduction used as inputs to the model.
In many chapters it was asserted that there was not enough data, however, it appeared that it was
not an absence of data, but that the data did not show evidence of incidents that would be used to
calculate a risk reduction. In other cases, a better job identifying metrics, which correlate with
the performance of the respective risk mitigations needs to be done.
PG&E has tried a different approach for evaluating cross-cutting risk, but its development lacks
the specificity and transparency into the impact of the drivers and how they are causally linked to
the risk event. If utilities continue to use this approach, then they need to show greater causal
link and correlation of the drivers to risk events, otherwise, it appears that it might be best to
include the cross-cutting drivers in the appropriate Stand-alone risk chapter to prevent
duplication and better show how these components of risk contribute to the frequency of the risk
event. In that way, it would be more transparent to see how the specific mitigation would impact
risk reduction (even though the cost and implementation of the driver is borne by a shared
service organization).
Proposed Mitigations and Alternatives
In almost every case, PG&E’s set of mitigations alternatives represented a “more of” or “less of”
approach to adjusting its preferred mitigation portfolios, or accelerating/decelerating programs.
Rarely was a true alternative approach suggested as opposed to simply increasing or decreasing
budget expenditures.
Lessons Learned:
PG&E provided a section at the end of Chapter A for lessons learned which highlights key areas
where the RAMP may improve, as well as shows PG&E’s contemplation of the weaknesses
inherent in trying to calculate probabilistic MARS and RSE which could be used to prioritize
resources across its safety risks. In addition, at the end of each risk chapter a section for next
steps was each risk owner’s attempt at highlighting areas for improvement or areas to focus on
going forward with RAMP and/or for mitigating its risks.
The lessons learned are evident in the evolved nature of PG&E’s model and the modification of
consequence attributes used to score their risks. They also appear to incorporate some of the
recommendations made by SED in the Sempra RAMP report.
PG&E’s approach for cross-cutting risks is novel and different from that attempted by Sempra in
its RAMP. The cross-cutting approach has weaknesses with: 1) drivers that do not clearly align
with the risk and causal relationship is often not clear; 2) the mitigation may not clearly explain
how it mitigates the risk driver; and 3) significant reliance on SME assumptions for allocating
risk and risk reduction.
18
The following Chapters 3, 6, 7, 8, 9, 14, 15, 17, 20, & 21 have some aspect of this issue within it.

Page | 25
1.5 CALCULATING RISK SPEND EFFICIENCY
PG&E shows the relative efficiency of risk mitigation funding through its RSE scores and
acknowledge that this is an early stage of development for using RSE’s to risk mitigations across
the RAMP risks. In this early state of RSE development PG&E chose to focus on developing
MARS and RSE’s for mitigations and proposed mitigations, while ignoring the same evaluation
of existing controls.
Therefore, the implied assumptions are that the controls would be held constant and the level of
risks mitigation would also remain constant. Yet not all control spending is held constant, impact
of controls gaining increased traction would not be accounted for, and synergistic impact of new
mitigations acting in concert with existing controls on the same drivers, assuming it could be
measured, would attributed to the new mitigations.
PG&E’s filing improves upon the prior RAMP filing from Sempra, the calculation of RSE is still
not at a state of maturity for use as the sole basis of projecting the efficacy of safety programs,
prioritizing funding of competing safety programs, or determining the related resource
requirements necessary to reduce the identified risks.
One of the primary goals for the RAMP filings is to be able to compare risks against each other
and determine how to prioritize projects in order to get the most risk reduction for money spent
(aka RSE), due to the gaps in developing the RSE in the current RAMP filing SED agrees with
PG&E’s following self-assessment that:
…improvements in the quality and availability of data and a deeper understanding of risk
tolerance are needed before risks and the effectiveness of mitigations truly can be
compared. However, using the RSE metric based on a consistently calculated MARS is a
first step towards comparability across risks and mitigations. 19
Staff found wide variation in the inputs and the application of SME variables in the model which
create increased probability of inconsistencies in the MARS and RSE calculations that confound
the comparability across risks and mitigations and increases the range of uncertainty in the
outcomes.
In order to calculate the RSE, a change in risk (weither likelihood or consequence) must take
place. In this RAMP virtually all the RSE’s were based on a SME based assumption that change
the frequency of drivers or incidents that changed the risk score. Since most of the risks were
framed as a worst case - Tail Average scenario, it is difficult to measure a reduction in
consequence.
As noted by PG&E in Chapter “A” of the RAMP, the level of maturity for this RAMP has not
reached the level where most risks can be evaluated using objective data and probabilistic
methods. PG&E and this RAMP rely extensively on Subject Matter Experts (SME) to determine
19
RAMP-2017_Report_PGE_20171130_431187.docx, pg. A-6.

Page | 26
the level of impact that a given mitigation activity will have on reducing the frequency of risk
drivers and incidents.
Throughout the RAMP chapters, the input of the SME’s is reflected in the initial risk scores and
the evaluation of impact of risk mitigation activities. In several instances in the RAMP chapters,
staff noted the use of objective data to support the RSE calculation, but it was not always clearly
explained or justified well enough to provide the confidence in the resulting RSE score.
Ultimately, the RSE score is a product of SME inputs.
After review of the way the RSE methodology was employed in a discrete manner in each
chapter, Staff agrees with PG&E that in this RAMP it would be inappropriate to compare the
RSEs across chapters.
Although early in its RAMP development, PG&E informed Staff that it was not calculating
MARS or RSE numbers for its existing controls, Staff finds that in practice this resulted in
having little context for comparing expected outcomes for mitigations, making it difficult to
judge effectiveness of proposed measures. In many cases mitigation risk reductions cannot be
separated from the risk reductions resulting from existing controls, and therefore, it appears that
it would be extremely difficult to attribute any measured reduction to the source of the reduction.
SED appreciates PG&E’s efforts to develop and illustrate its RSE process and has asked that
they devote further explanation of how it works in this filing as part of the workshop, especially
how they control the inputs in the model for integrity and consistency. That would give parties
more opportunity to ask questions and offer observations.

Page | 27
2 PG&E’S TOP RISKS SUMMARIZED
The following tables are provided for illustrative purposes. These dollar amounts are for
illustration of how proposed spending might change, given choices made by PG&E.
They are only estimates at this point but will be refined based on the RAMP proceeding and
continuing analysis. The utility is expected to present a firmer set of figures for mitigations as
part of the GRC testimony and workpapers.
Table 3: Top Risks, Scores, and Forecast Mitigation Costs shows the chapters arranged in
numerical order with the TA MARS, Risk Score Reduction, 2017-2022 total 6-years of projected
spending on the risk’s mitigations, Risk Spend Efficiency (RSE) score, percentage of risk
reduction projected over the 6-years, and the 3-year propose plan spending for 2020-2022.
Note: The risks that usually have the highest RSE also have the lowest relative spending, which
inversely affects their RSE.
Table 3: Top Risks, Scores, and Forecast Mitigation Costs
2017-2022 2017-2022 2017-2022 2017-2022
Chapter
#Risk Name
MARS-TA-
Overall
Average-Total
MARS-TA-
Overall
Average-
Total-
RANK
MARS-TA-
Proposed Plan-
Risk Score
Reduction (all
years)
Proposed Plan-
Total spend (all
years)2
MARS-TA-
Proposed Plan-
Total RSE
(Units/$M)
Proposed plan
Risk reduction
% of baseline2
Proposed Plan-
Total spend
(2020-2022)
1 Transmission pipeline 37.62 15 15.52 $3,259,252,592 0.0048 6.9% $1,583,968,171
2 Maintaining system capacity (GSO) 325.34 3 747.57 $460,169,278 1.6246 38.3% $177,958,106
3 Measurement & Control downstream 12.07 20 10.77 $583,120,367 0.0185 14.9% $302,637,873
4 Measurement & Control facility 17.49 18 1.94 $380,070,892 0.0051 1.8% $187,184,777
5 Distribution - Cross bore 28.46 16 34.58 $376,815,080 0.0918 20.2% $263,540,249
6 Compression & Processing facility 39.86 14 36.20 $120,133,419 0.3014 15.1% $57,647,061
7 Distribution - Non-cross bore 188.84 9 23.02 $147,037,344 0.1566 2.0% $54,222,072
8 Storage - Wells 12.68 19 0.00 $0 0.0% $0
9 Distribution OH conductor 824.35 1 46.60 $86,600,000 0.5381 0.9% $51,960,000
10 Transmission OH conductor 227.50 7 20.15 $300,579,881 0.0670 1.5% $214,388,506
11 Wildfire 257.58 5 76.97 $797,683,138 0.0965 5.0% $721,835,727
12 Nuclear core damage 6.65 21 0.00 $0 0.0% $0
13 Hydro dam failure 100.89 12 9.02 $57,344,398 0.1573 1.5% $41,100,000
14 Contractor Safety 181.48 10 519.21 $8,279,123 62.7135 47.7% $5,329,969
15 Employee Safety 263.01 4 1.12 $7,465,234 0.1494 0.1% $2,999,386
16 Motor Vehicle Safety 214.30 8 95.36 $2,917,299 32.6868 7.4% $2,917,299
17 Fitness for Duty 50.43 13 9.32 $31,650,372 0.2945 3.1% $14,421,782
18 Cyber attack 107.75 11 0.00 $0 0.0% $0
19 Insider Threat 233.79 6 0.00 $0 0.0% $0
20 ERIM 19.81 17 8.36 $73,768,316 0.1134 7.0% $33,614,737
21 Skilled and qualified 4.96 22 2.36 $6,110,000 0.3870 $6,110,000
22 Climate resilience 665.33 2 0.00 $0 0.0% $0

Page | 28
Table 4: Existing Control Expenses – 2016 Actual Spending, and 2017-2019Projected Spending
shows the combined control spending for 2016 O&M expenditures, the 2016 spending on
mitigations which have not become fully implemented as controls, and the high/low average of
the 2017-2019 forecast range for O&M control spending forecast (includes non-GRC and GRC
mitigation spending).
Table 4: Existing Control Expenses – 2016 Actual Spending, and 2017-2019 Projected Spending
MARS 2016 Controls
Recorded
2017-2019
Average Control
Cost
Expense Expense
1 Transmission Pipeline 37.62 243,457$ 203,967$
2 Maintaining System Capacity (GSO) 325.34 13,210 15,133
3 Measurement & Control Downstream 12.07 21,448 20,067
4 Measurement & Control Facility 17.49 194,278 156,129
5 Distribution M&S - Crossbore 28.46 - -
6 Compression & Processing Facility 39.86 112,994 119,536
7 Distribution M&S - Non-Crossbore 188.84 160,079 116,192
8 Storage Wells 12.68 81,483 104,041
9 Distribution Overhead Conductor 824.35 434,303 484,645
10 Transmission Overhead Conductor 227.50 86,528 136,728
11 Wildfire 257.58 491,532 541,129
12 Nuclear Core Damage 6.65 282,041 309,684
13 Hydro Dam Failure 100.89 10,782 11,432
14 Contractor Safety 181.48 952 981
15 Employee Safety 263.01 40,609 42,450
16 Motor Vehicle Safety 214.30 754 754
17 Lack of Fitness for Duty 50.43 86,825 87,897
18 Cyber Attack 107.75 22,151 23,121
19 Insider Threat 233.79 - -
20 Records and Information Management 19.81 1,975 2,764
21 Skilled and Qualified Workforce 4.96 - -
22 Climate Resiliance 665.33 - -
2,285,401$ 2,376,650$
ChapterRisks by RAMP Chapter
(000)

Page | 29
Table 5: Existing Control Capital – 2016 Actual Spending, and 2017-2019 Projected Spending
shows the combined control spending for 2016 capital expenditures (Capex), the 2016 spending
on mitigations which have not become fully implemented as controls, and the high/low aveage of
the 2017-2019 forecast range for capital control spending forecast (includes non-GRC and GRC
mitigation spending).
Because the 2016 controls only include the one-year of 2016 Capex, it is provided as a point of
reference and may not be comparable to the 3-years of forecast Capex spending that includes
both non-GRC and GRC amounts.
Table 5: Existing Control Capital – 2016 Actual Spending, and 2017-2019 Projected Spending
MARS 2016 Controls
Recorded
2017-2019
Average Control
Cost
Capital Capital1 Transmission Pipeline 37.62 51,951$ 89,741$
2 Maintaining System Capacity (GSO) 325.34 - -
3 Measurement & Control Downstream 12.07 76,473 118,313
4 Measurement & Control Facility 17.49 111,882 188,318
5 Distribution M&S - Crossbore 28.46 11,217 20,965
6 Compression & Processing Facility 39.86 117,070 144,218
7 Distribution M&S - Non-Crossbore 188.84 348,030 500,733
8 Storage Wells 12.68 28,226 114,368
9 Distribution Overhead Conductor 824.35 197,059 224,324
10 Transmission Overhead Conductor 227.50 315,351 363,730
11 Wildfire 257.58 266,109 336,122
12 Nuclear Core Damage 6.65 13,239 184
13 Hydro Dam Failure 100.89 - -
14 Contractor Safety 181.48 - -
15 Employee Safety 263.01 - -
16 Motor Vehicle Safety 214.30 - -
17 Lack of Fitness for Duty 50.43 - -
18 Cyber Attack 107.75 - -
19 Insider Threat 233.79 - -
20 Records and Information Management 19.81 - -
21 Skilled and Qualified Workforce 4.96 - -
22 Climate Resiliance 665.33 - -
1,536,607$ 2,101,016$
ChapterRisks by RAMP Chapter
(000)
Page | 30
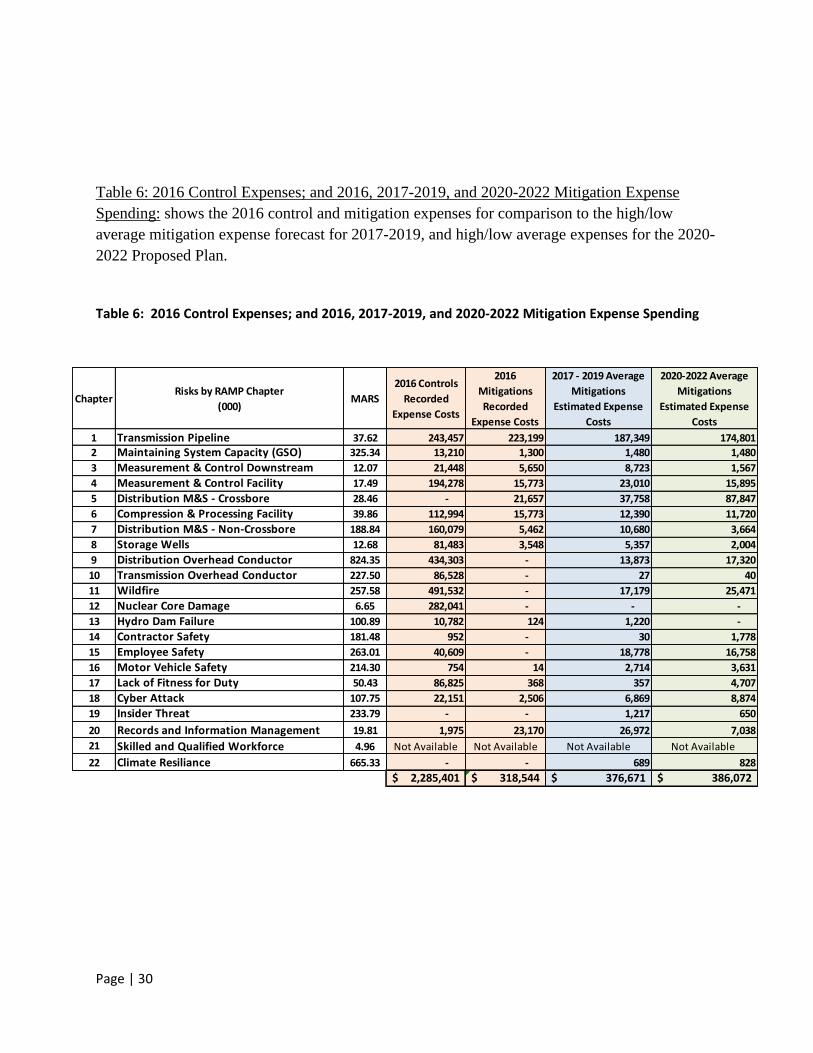
Table 6: 2016 Control Expenses; and 2016, 2017-2019, and 2020-2022 Mitigation Expense
Spending: shows the 2016 control and mitigation expenses for comparison to the high/low
average mitigation expense forecast for 2017-2019, and high/low average expenses for the 2020-
2022 Proposed Plan.
Table 6: 2016 Control Expenses; and 2016, 2017-2019, and 2020-2022 Mitigation Expense Spending
ChapterRisks by RAMP Chapter
(000)MARS
2016 Controls
Recorded
Expense Costs
2016
Mitigations
Recorded
Expense Costs
2017 - 2019 Average
Mitigations
Estimated Expense
Costs
2020-2022 Average
Mitigations
Estimated Expense
Costs
1 Transmission Pipeline 37.62 243,457 223,199 187,349 174,801
2 Maintaining System Capacity (GSO) 325.34 13,210 1,300 1,480 1,480
3 Measurement & Control Downstream 12.07 21,448 5,650 8,723 1,567
4 Measurement & Control Facility 17.49 194,278 15,773 23,010 15,895
5 Distribution M&S - Crossbore 28.46 - 21,657 37,758 87,847
6 Compression & Processing Facility 39.86 112,994 15,773 12,390 11,720
7 Distribution M&S - Non-Crossbore 188.84 160,079 5,462 10,680 3,664
8 Storage Wells 12.68 81,483 3,548 5,357 2,004
9 Distribution Overhead Conductor 824.35 434,303 - 13,873 17,320
10 Transmission Overhead Conductor 227.50 86,528 - 27 40
11 Wildfire 257.58 491,532 - 17,179 25,471
12 Nuclear Core Damage 6.65 282,041 - - -
13 Hydro Dam Failure 100.89 10,782 124 1,220 -
14 Contractor Safety 181.48 952 - 30 1,778
15 Employee Safety 263.01 40,609 - 18,778 16,758
16 Motor Vehicle Safety 214.30 754 14 2,714 3,631
17 Lack of Fitness for Duty 50.43 86,825 368 357 4,707
18 Cyber Attack 107.75 22,151 2,506 6,869 8,874
19 Insider Threat 233.79 - - 1,217 650
20 Records and Information Management 19.81 1,975 23,170 26,972 7,038
21 Skilled and Qualified Workforce 4.96 Not Available Not Available Not Available Not Available
22 Climate Resiliance 665.33 - - 689 828
2,285,401$ 318,544$ 376,671$ 386,072$

Page | 31
Table 7: 2016 Control Capital; and 2016, 2017-2019, and 2020-2022 Mitigation Capital
Spending: shows the 2016 control and mitigation capital spending for comparison to the
high/low average mitigation capital forecast for 2017-2019, and high/low average capital for the
2020-2022 Proposed Plan.
Table 7: 2016 Control Capital; and 2016, 2017-2019, and 2020-2022 Mitigation Capital Spending
ChapterRisks by RAMP Chapter
(000)MARS
2016 Controls
Recorded Capital
Costs
2016 Mitigations
Recorded Capital
Costs
2017 - 2019 Average
Mitigations Estimated
Capital Costs
2020-2022 Average
Mitigations Estimated
Capital Costs
1 Transmission Pipeline 37.62 51,951 309,906 371,079 353,189
2 Maintaining System Capacity (GSO) 325.34 - 79,118 92,590 57,839
3 Measurement & Control Downstream 12.07 76,473 55,411 84,771 92,917
4 Measurement & Control Facility 17.49 111,882 38,119 34,786 38,030
5 Distribution M&S - Crossbore 28.46 11,217 - - -
6 Compression & Processing Facility 39.86 117,070 10,237 33,543 31,219
7 Distribution M&S - Non-Crossbore 188.84 348,030 8,356 20,258 10,444
8 Storage Wells 12.68 28,226 21,159 71,908 60,446
9 Distribution Overhead Conductor 824.35 197,059 - - -
10 Transmission Overhead Conductor 227.50 315,351 23,514 28,704 71,423
11 Wildfire 257.58 266,109 - 30,862 248,819
12 Nuclear Core Damage 6.65 13,239 - - -
13 Hydro Dam Failure 100.89 - 625 5,211 13,700
14 Contractor Safety 181.48 - - - -
15 Employee Safety 263.01 - - 10,000 10,000
16 Motor Vehicle Safety 214.30 - - 976 171
17 Lack of Fitness for Duty 50.43 - - 337 100
18 Cyber Attack 107.75 - 19,990 24,043 24,587
19 Insider Threat 233.79 - - 1,100 1,100
20 Records and Information Management 19.81 - 4,588 7,491 4,167
21 Skilled and Qualified Workforce 4.96 Not Available Not Available Not Available Not Available
22 Climate Resiliance 665.33 - - - -
1,536,607$ 571,023$ 817,659$ 1,018,150$

Page | 32
Table 8: 2016 Control Combined Expenses and Capital Total; and 2016, 2017-2019, and 2020-
2022 Mitigation Combined Expenses and Capital Total shows the combined total of 2016 control
expense and capital and the combined mitigation expense and capital spending for comparison to
the high/low average mitigation combined expenese and capital total forecast for 2017-2019, and
high/low average mitigation expense and capital total for the 2020-2022 Proposed Plan.
Table 8: 2016 Control Combined Expenses and Capital Total; and 2016, 2017-2019, and 2020-2022
Mitigation Combined Expenses and Capital Total
ChapterRisks by RAMP Chapter
(000)MARS
2016 Controls Total
Recorded Costs
2016 Mitigations
Total Recorded
Costs
2017 - 2019 Average
Mitigations Total
Estimated Costs
2020-2022 Average
Mitigations Total
Estimated Costs
1 Transmission Pipeline 37.62 295,408 533,105 558,428 527,990
2 Maintaining System Capacity (GSO) 325.34 13,210 80,418 94,070 59,319
3 Measurement & Control Downstream 12.07 97,921 61,061 93,494 94,484
4 Measurement & Control Facility 17.49 306,160 53,892 57,796 53,925
5 Distribution M&S - Crossbore 28.46 11,217 21,657 37,758 87,847
6 Compression & Processing Facility 39.86 230,064 26,010 45,932 42,939
7 Distribution M&S - Non-Crossbore 188.84 508,109 13,818 30,938 14,108
8 Storage Wells 12.68 109,709 24,707 77,266 62,450
9 Distribution Overhead Conductor 824.35 631,362 - 13,873 17,320
10 Transmission Overhead Conductor 227.50 401,879 23,514 28,731 71,463
11 Wildfire 257.58 757,641 - 48,041 274,290
12 Nuclear Core Damage 6.65 295,280 - - -
13 Hydro Dam Failure 100.89 10,782 749 6,432 13,700
14 Contractor Safety 181.48 952 - 30 1,778
15 Employee Safety 263.01 40,609 - 28,778 26,758
16 Motor Vehicle Safety 214.30 754 14 3,689 3,802
17 Lack of Fitness for Duty 50.43 86,825 368 694 4,807
18 Cyber Attack 107.75 22,151 22,496 30,912 33,461
19 Insider Threat 233.79 - - 2,317 1,750
20 Records and Information Management 19.81 1,975 27,757 34,463 11,205
21 Skilled and Qualified Workforce 4.96 Not Available Not Available Not Available Not Available
22 Climate Resiliance 665.33 - - 689 828
3,822,008$ 889,566$ 1,194,330$ 1,404,222$

Page | 33
ANALYSIS OF RISKS
The following chapter reviews provide a range of detail in commentary, with a few selected
chapters given a “deeper dive” into specifics. In many cases, the same observations hold true
across chapters, and while Staff has attempted to reduce repetition, it is useful to identify trends
and common questions.
2.1 TRANSMISSION PIPELINE RUPTURE WITH IGNITION
SUMMARY
This chapter describes an assessment, and a mitigation proposal for the risk of transmission
pipeline rupture with ignition. The assessment is based on probabilistic modeling of both the
risk drivers and consequences using a “bow-tie” approach. This approach generally meets the
criteria and objectives of CPUC Decision D-16-08-018.
The chapter makes use of PG&E’s new “MARS” risk scoring methodology, which attempts to
equalize the level of risk across the many different safety risks in the RAMP. This initial MARS
approach may benefit in the future from refinement of assumptions regarding the relative
severity of different risk categories.
The proposed 2020-2022 mitigation plan is a continuation of currently funded programs. The
RAMP report presents costs and Risk-Spend-Efficiency (RSE) data that show this chapter’s
mitigation plan has the highest cost with the lowest RSE of the 22 RAMP risks. However, two
of the five identified mitigation programs are required or have been previously approved by
CPUC decisions and the estimation of benefits is contained within the rate case period, while
true benefits will likely extend for many years beyond.
The RAMP model predicts an event frequency of once in about nine years, with a MARS-TA of
37.62, which is 15th
among the 22 Risks, and low in comparison to the highest MARS-TA of
824.35 for the electric distribution overhead conductor risk.
The proposed mitigation plan has an RSE of 0.0048, which is the lowest for all risks in the
RAMP, but at a six-year cost of $3.26 billion, which is the highest of all the risk mitigation
plans.
As required, the mitigation discussion includes consideration of two alternative approaches;
however, the alternatives presented are only variations in pacing of the same mitigation
programs. No discussion of other possible mitigations is provided.

Page | 34
Chapter Statistics Summary:
MARS-EV-Overall Average-Total: 3.76
MARS-EV- Proposed Plan-Risk Score Reduction (all years): 1.53
MARS-EV-Overall Average-Total-RANK: 16
MARS-TA-Overall Average-Total: 37.62
MARS-TA-Proposed Plan-Risk Score Reduction (all years): 15.52
MARS-TA-Overall Average-Total-RANK: 15
RSE Units of Risk Reduced Per Million Dollars:
MARS-EV-Proposed Plan-Total RSE (Units/$M) 0.0005
MARS-TA-Proposed Plan-Total RSE (Units/$M) 0.0048
2016 Baseline Controls and Mitigations (000):
Recorded control expense costs: $243,457
Recorded capital control costs: $51,951
2017-2019 (000):
Current mitigation plan expenses (average): $187,349
Current mitigation plan capital costs (average): $371,079
2020-2022 (000):
Proposed mitigation plan expenses (average): $174,801
Proposed mitigation plan capital costs (average): $353,189
STRENGTHS
PG&E chose the risk drivers from the well-established list of pipeline threats described in the
American Society of Mechanical Engineers standard B31.8S, which is incorporated by reference
into the Federal Gas Safety code, Title 49 CFR Part 192.
PG&E was able to characterize its own system performance in terms of leaks, which were then
correlated with pipeline rupture statistics in the PHMSA national gas industry database to
establish event frequencies.
AREAS FOR IMPROVEMENT
While pipeline integrity was generally characterized by PG&E leak data, the specifics of how
much each risk driver contributes to the risk frequency were based on national data rather than
PG&E performance. Staff recognizes this may be the best information available, but it could
tend to misrepresent the specific risks for PG&E. Additionally, it may be difficult to document
“improvements” in risk reduction, if the model is heavily based on national statistics that will not
change as a result of any PG&E activities.

Page | 35
As PG&E has pointed out, the new MARS system is dependent on the choice of scaling factors
used to project various kinds of risks, like human injuries or environmental damage, into a
universal safety rating score that is intended to compare risks on an equal footing. The selection
of those scaling factors is under discussion by parties in the S-MAP proceeding, and PG&E
states that the ones used for this RAMP should be considered “place-holders” for more refined
factors to come in the future.
Therefore, since the RSE calculations all depend on the MARS values, the evaluation must keep
in mind the “placeholder” nature of these figures when interpreting the RSE results for the
various risks.
In general, all the risk chapters could be improved by an RSE analysis for the current baseline
controls and mitigations, to allow comparison of the proposed incremental spending to the
effectiveness of the programs already in place.
Analysis of Chapter Specifics:
Risk specific information
The risk of transmission pipeline rupture with ignition is well described. While fortunately rare,
such incidents can have severe consequences such as the San Bruno rupture in 2010. PG&E
relates that in the recent years of 2010-2016, the U.S. natural gas transmission industry
experienced a total of 83 rupture-with-ignition reported events; 11 had safety impacts, the largest
of which was in San Bruno. PG&E notes that, compared with the rest of the nation, there is a
higher percentage of High Consequence Areas (locations near pipelines with high human
occupancy) in its service territory, so exposure to safety risk is higher than the national average.
Pipeline rupture with release of gas does not always result in ignition. The RAMP model
combines PG&E data on pipeline integrity with national incident data to determine event
frequency and predict consequences.
Potential Drivers:
PG&E used the list of nine pipeline integrity threats (or drivers) from the national standard
ASME B31.8S, which are appropriate for this risk. These threats include internal and external
corrosion, manufacturing defects, third-party damage, and natural forces, among others
Potential Consequence:
The risk model produced distributions of potential consequences in seven categories, such as
injury, financial, and environmental risk. Safety data from the PHMSA industry data base was
used to predict injuries and fatalities assuming ignition had occurred. In order to derive an
average worst case outcome, PG&E chose to take the Tail Average of the outcomes to represent
that level of risk.

Page | 36
Risk Score
MARS - Tail Average:
The risk score is based on the combination of driver frequency, risk exposure, and consequence
likelihoods. PG&E does not have a sufficient data set from which to model event frequencies
for all nine risk drivers, so they combined national driver frequencies with their own leak history
data. PG&E reasoned that their leak frequency data could stand as a measurement for the
likelihood of pipeline ruptures. The national incident database provided statistics for rupture
events by driver type, and whether the events led to ignition or not. From the national database,
PG&E determined the frequency of rupture with ignition events per mile of transmission
pipeline. PG&E then applied the same frequency to its own system.
Tail Average vs. Expected Value:
The probabilistic risk model produces a set of outcomes that take sinto account the selected
driver frequencies and consequence frequencies appropriate to the risk event. The set of
outcomes is a distribution of probable results ranging from no consequence to some level of
consequence. For example, there could be a pipeline rupture with ignition that results in no
injuries, one injury, or several injuries.
The distribution of model results has an average, or “expected value” (EV). The majority of the
outcomes from the risk model were zeros, so that the EV is an average of many non-injury
results combined with a small number of results with one or more injuries. PG&E considered
that the EV does not sufficiently represent the impact of consequences, while of low probability,
that would have a very negative impact on the public and the company.
Instead of the EV, PG&E chose to use a “tail average” (TA) of the results from the 90th
to 100th
percentile of the outcome distribution. The TA works out to be ten times the value of the EV
because all of the non-zero outcomes are within the 90th to 100th
percentile.
Histograms of the full outcome distribution and the 90th
-100th
percentile portion of that same
distribution are given in the figures below. The example data chosen was from the model run
for injuries in Year 1 of the six years 2017-2022, before mitigations, to show the baseline risk for
injuries. The other years had similar results. The model was run 10,000 times to produce a
probabilistic distribution of results.

Page | 37
Figure A: Model outcomes for Year 1 injuries, before mitigation
Figure B: 9001st to 10,000th outcomes from Figure A data s
The Risk Score:
The Tail-Average Risk Score in MARS units for this risk is 37.62, representing the baseline risk
before proposed mitigations, relatively low compared to the other RAMP risk scores.
9862
1 3 4 12 8 21 19 19 14 24 5 4 2 2 0
2000
4000
6000
8000
10000
12000
0 1 2 3 4 5 6 7 8 9 10 11 12 13 14
Number of Injuries per Trial
Injury Histogram, 10000 trials
10000 trials average= 0.104 injuries per trial (Expected Value)
862
1 3 4 12 8 21 19 19 14 24 5 4 2 2 0
100
200
300
400
500
600
700
800
900
1000
0 1 2 3 4 5 6 7 8 9 10 11 12 13 14
Number of Injuries per Trial
90th - 100th percentile "tail"
Tail Average = 1.04 injuries per trial

Page | 38
For example, the electric Distribution Overhead risk has a MARS TA score of 824 and there are
12 risks with MARS scores of 100 or more.
The baseline Tail-Average safety risks in natural units are one injury per year and one fatality in
five years.
The Frequency Score and its Impact on the Overall Risk Score:
The estimated frequency score is one event in about 9 years and directly impacts the overall risk
score, since there can be no consequences without an event. The frequency estimation is lower
than recent PG&E experience: there have been three transmission pipeline ignition events during
2010-2017 (San Bruno, and the Fresno and Bakersfield third-party dig-ins) an average of about 1
in 2.7 years. However, significant mitigations put in place following these events may already
be reducing the likelihood.
This baseline frequency score of once in 9 years combined with the TA MARS injury and
fatality rates predicts 9 injuries and 2 fatalities per event, average worst case.
Baseline Mitigation Plan
PG&E describes eleven risk control programs currently in effect, such as corrosion control, leak
surveys, line patrols, integrity management, etc., where most are mandatory under current
Federal and State safety regulations. The recorded 2016 costs for expense and capital are given
for each of the eleven controls and for the current mitigation programs.
Upon the request of CPUC Staff, PG&E supplied capital and expense forecasts (under a
confidentiality agreement) for the control programs through 2022. Staff finds that the future
control spending is expected to increase moderately over the 2016 baseline year. Presumably
that spending is necessary to maintain the baseline level of risk while costs are expected to
increase; it would be helpful if PG&E had also supplied an RSE analysis for the baseline
program effectiveness.
The baseline TA-MARS score, 37.62, is ranked 15th
on the list of the 22 top safety risks
presented The MARS scoring system attempts to equalize the risk level from one risk category to
another, so by comparison to the total of all 22 risks at 3820 MARS points, this chapter
contributes about 1% of the total RAMP risks.
Alternative Mitigation Plans and Their Relative RSE, if any
In this chapter, two alternative mitigation packages are discussed. However, each of the
alternative packages offers only a variation in tempo for some of the five mitigation programs,
rather than introduction of truly alternative approaches for consideration. Risk-Spend
Efficiency, RSE, is presented for each of the alternative plans. The choice of mitigation pace
was based on an SME judgment that accelerated programs would add cost without significant
risk reduction.

Page | 39
RASA Staff finds that some examples of mitigation programs that could have been discussed are
satellite observation, ground vibration monitoring, acoustical sensors, buried fiber optic cables,
motion detectors, infrared cameras, strain gauges on pipe, and patrol frequency.
Proposed Mitigation Plans
PG&E describes a package of five mitigation programs already in progress from before 2017,
which they propose to continue into the 2020-2022 rate period. All of the proposed mitigations
are continuations of programs that were funded in previous rate cases, while some of them are
recently mandated by CPUC decisions. The overall program cost for the six years 2017-2022 is
$3.26 billion, of which $1.5 billion is proposed for the 2020-2022 rate case period.
The estimated 6-year risk reduction is 15.22 MARS units, about a 40% reduction of the baseline
MARS score. When compared to the total MARS score of 3,840 for the 22 risks, this risk
reduction is less than one-half percent of the total. However, the long-term benefits will be
greater since these mitigations will be in effect for decades after the 6-year period.
The largest cost contributor is the In-Line Inspection (ILI) program, which includes the cost of
retrofitting pipelines to allow use of in-line inspection tools. ILI tools or “pigs” travel inside the
pipe to identify anomalies in pipe wall thickness and related properties. ILI is not a regulatory
requirement, but it is an industry best practice for measuring the health of a pipe and is a
preferred option for compliance with Integrity Management regulations. PG&E has established
a preferred pace for completing this program and proposes to continue at that pace.
The next-highest cost program is hydrostatic testing of pipeline segments, part of which is a
continuation of a CPUC mandate resulting from the San Bruno incident. A hydro test uses
pressurized water in the pipe to validate the maximum operating pressure without risk of a
potential gas release. Hydro-tests are also an optional method for required Integrity Management
assessments.
PG&E states a mandate to replace 20 miles of vintage pipeline in 2018. The Vintage Pipeline
Replacement program specifically looks at the threat of land movement combined with vintage
pipeline construction practices that are more susceptible to land movement.
The other mitigation programs are not specifically mandated but are worthwhile practices for
pipeline integrity.
RSE Applied to this Risk, and the RSE Results
While not the sole criteria for decision-making, the RSE of these mitigations, at 0.0048, is the
lowest compared to the other 22 Risks, and the mitigation plan total is the most expensive
overall. Gas transmission pipeline events can have serious consequences and the proposed
mitigations are an indication of how seriously PG&E regards this risk.
It is interesting to compare the relative effectiveness of the five programs. As shown in the table
below, high cost does not always give the most effective risk reduction. The Shallow and

Page | 40
Exposed Pipeline program has the greatest RSE at 0.0152, while the Vintage Pipe Replacement
program, at three times the cost, has an RSE about ten times less at 0.0012.
Table 9: Mitigation Breakdown
Program
ID
MARS TA-
Overall Risk
MARS
TA Risk
Reduction
Program Cost,
$ Millions
RSE, Total MARS
TA Reduction per
$Million
Package Total 37.62 15.22 $3,259 0.0048
M1B Inline Inspection 6.89 $1,398 0.0049
M2B Hydro Tests 4.67 $890 0.0052
M3B Vintage Pipe Replace 0.71 $608 0.0012
M4B Valve Automation 0.12 $155 0.0008
M5B Shallow/Exposed Pipe 3.13 $206 0.0152
CONCLUSION
This chapter addresses the required elements of a RAMP. The risk analysis is based on primary
PG&E-specific data that uses PG&E performance to estimate the risk level although the driver
frequencies come from national data.
The high cost and low RSE values for this risk are worth further discussion in the course of the
upcoming GT&S rate case, however the RSE calculation is capped by the end of the 2022 Rate
Case while the risk reduction benefits will continue long after that.
2.2 FAILURE TO MAINTAIN CAPACITY FOR SYSTEM DEMANDS
SUMMARY
The risk described here stems from the failure to maintain supply capacity resulting from gas
transmission safety projects (e.g., in-line inspections and hydrotests) entailing operating
restrictions that reduce system capacity during winter months (November through March), when
core customer gas load demands are high (aka pressure reductions).

Page | 41
The risk could occur when customer demand is high and gas supply is limited due to intentional
gas pipeline depressurization, a necessary condition to allow for safety project work to be
completed.
Operating restrictions can occur if the safety work identifies issues that require immediate
pressure reductions or sections of the system to be removed from service, both of which
significantly reduce system capacity. This risk event can cause customer curtailments (controlled
or uncontrolled) that could lead to consequent gas surge-backs into homes or the use of unsafe
heating and cooking devices, which presents a risk of fire or carbon monoxide (CO) poisoning,
potentially resulting in serious injury or fatality.
This risk is relatively newly considered, having been introduced to the PG&E risk register in
2015. PG&E has elevated this risk – designated as Enterprise-level (overseen by its Board of
Directors’ Nuclear, Operations and Safety Committee) – as a concern given that the utility is
undertaking a major campaign of pipeline upgrades. Such upgrade projects necessitate
temporarily reducing pipeline pressure,which increases the probability for the risk event.
The utility characterizes existing conditions surrounding the risk as such:
“This risk has become one of the top risks for PG&E in the last two years because PG&E
has substantially increased the number of safety projects performed to mitigate risks on
transmission pipelines. The large number of safety projects per year has increased the
likelihood of project delays, due to various reasons, into the winter months.”
The sole driver for this risk event is pipeline safety projects occurring beyond the ideal
construction season and into the winter months. The mitigation programs in place for 2016
would continue through the 2017-2019 time period. Costs are anticipated to peak in 2017, before
settling down in 2019-2022 to levels less than $60 million per year.
The RAMP model predicts an event frequency of once approximately every three years, with a
MARS-TA of 325.34, which is third among the 22 risks. And although the likelihood of this
event is low, any associated consequences are expected to be high. The proposed mitigation plan
has a MARS-TA RSE of 1.6246, ranked third, at a projected total six-year cost of $460.2 million
(also third overall).
Based on the model inputs for frequency, this risk event is likely to occur approximately every
three years (having a occurrence likelihood of 0.3067 for any one year).
This risk’s MARS-TA-Proposed Plan-Risk Score Reduction (all years) of 747.522 is ranked first
— highest — of the RAMP’s 22 chapters.
Chapter Statistics Summary::
MARS-EV-Overall Average-Total: 40.94
MARS-EV- Proposed Plan-Risk Score Reduction (all years): 100.39
MARS-EV-Overall Average-Total-RANK: 9

Page | 42
MARS-TA-Overall Average-Total: 325.34
MARS-TA-Proposed Plan-Risk Score Reduction (all years): 747.522
MARS-TA-Overall Average-Total-RANK: 3
RSE Units of Risk Reduced Per Million Dollars:
MARS-EV-Proposed Plan-Total RSE (Units/$ Millions) 0.0006 = 100.39/$173.518
MARS-TA-Proposed Plan-Total RSE (Units/$ Millions) 0.0043 = 747.522/$173.518
2016 Baseline Controls and Mitigations
Recorded control expense costs (000): $13,210
Recorded capital control costs: $0
2017-2019:
Current mitigation plan expenses (average) (000): $1,480
Current mitigation plan capital costs (average) (000): $92,590
2020-2022:
Proposed mitigation plan expenses (average) (000): $1,480
Proposed mitigation plan capital costs (average) (000): $57,839
The MARS TA risk reduction estimated by PG&E’s model exceeds by more than double its
MARS TA Overall Total. It seems illogical that the risk reduction score would be twice the
MARS TA. Therefore, PG&E should explain this paradox where the Risk Reduction score can
exceed the MARS TA Total.
STRENGTHS
PG&E checked its RAMP model assumptions against an older, existing model and was able to
replicate its modeled risk outcome. In other words, besides applying a high-level bow tie-based
operational risk model, PG&E applied a probabilistic model that pre-dates the development of
the RAMP model. For the time being, the utility relies on a probabilistic model designed to help
quantify the likelihood that any given safety project delayed into the winter may result in
pressure reductions that reduce capacity and create a risk of not meeting winter demands. This
model informed the inputs into the RAMP model to estimate risk of customer outages. The
RAMP model then extends the risk estimate by considering safety and reliability impacts once a
customer outage occurs.
AREAS FOR IMPROVEMENT
PG&E’s overall Chapter 2 risk documentation seems conflicted about where the risk resides,
which results in reviewer confusion.
Beginning with the chapter title Failure to Maintain Capacity for System Demands, the reader
expects the crux of the issue to be one of the utility keeping pace with increasing customer
demand brought about by population growth and new development which in turn strain existing

Page | 43
gas delivery infrastructure’s ability to maintain sufficient gas pipeline pressurization, potentially
leading to problematic (in terms of safety and reliability) operating conditions. Indeed, this
assumption plays out in risk chapter Workpapers narrative and risk description, which points to a
solution characterized as one of merely bringing online additional transmission capacity.
Contrast this with narrative provided within the RAMP Report chapter, which points to project
work extending into winter months as the root of the risk and the sole driver for this risk event.
The Workpapers narrative neglects to describe this condition as integral to the risk.
The reviewer is left to ponder whether the risk is an involuntary year-round insufficient system
capacity condition or a controlled winter-season-only risk. This suggests the risk could be more
clearly defined and stated.
Separately, PG&E acknowledges that its model and analysis suffer from a paucity of data on this
little-considered risk. Specifically, PG&E states, “Going forward, PG&E plans to collect and
analyze more data to improve the model inputs and continue the move toward more quantitative,
data driven risk models. One of the key next steps for this risk is to collect additional data to
estimate the number of potential cross bores throughout the system. A detailed list of next steps
is included in Section VIII."
Thus PG&E is perhaps over-reliant on SME judgment in assigning risk scores. Staff recognizes
that PG&E may be constrained and as this risk is not known to have occurred ever in the U.S.
gas industry, may be applying the best-available assumptions. Nevertheless, the limited available
data could compromise risk model assumptions and misrepresent the prospects for an occurrence
of this risk.
Finally, as described above in the Risk Reduction summary, PG&E proposes an illogical overall
Risk Reduction score that exceeds Risk Reduction baseline levels. PG&E should reconcile its
proposed 100-percent-plus Risk Reduction with its statement, “By implementing the mitigation
strategy outlined in this chapter, PG&E forecasts a potential 38 percent reduction to the overall
multi-attribute risk score (MARS) for the 2017-2022 time period.”
Analysis of Chapter Specifics:
Risk specific information
The risk of local-area gas pipeline depressurization and/or service outage and resulting impacts
to residential customers is adequately described in the RAMP Report chapter. This risk of failure
to maintain capacity, stems from gas transmission safety projects (e.g., ILIs and hydrotests) that
lead to operating restrictions that reduce system capacity during winter months (November
through March) when core customer gas load demands are high. Operating restrictions can occur
if the safety work identifies issues that require immediate pressure reductions or sections of the
system to be removed from service, both of which significantly reduce system capacity. This risk
event can cause customer outages (controlled or uncontrolled) which could lead to consequent

Page | 44
gas surge-backs into homes or the use of unsafe heating and cooking devices which presents a
risk of fire or carbon monoxide (CO) poisoning, potentially resulting in serious injury or fatality.
Potential Drivers:
The sole driver for this risk event is pipeline safety projects occurring beyond the ideal
construction season and into the winter months. In other words, the only driver identified for
quantification purposes would be pipeline safety projects that occur when demand is high and
which necessitate a temporary reduction in pipeline pressure operating conditions.
Potential Consequence:
Gas customers resort to unsafe heating or cooking methods during an extended gas
outage, which present a risk of fire or CO poisoning. (PG&E chose this scenario because
it is the most probable among the three consequences.) PG&E used SME input, informed
by data regarding natural gas pilot light product recalls from the U.S. Consumer Products
Safety Commission (CPSC), to estimate that 0.2 percent of customers may resort to using
unsafe heating or cooking equipment during prolonged system outage. Additionally, of
this small percentage of customers, 0.2 percent would likely experience ignition resulting
in injury or or death, based on CPSC data and SME input.
Gas pressure surges back into homes due to older or failed appliance safety devices
shortly after the pressure drops and extinguishes the pilot lights. (The ambient
accumulated gas would then present a risk of ignition and explosion.)
Hypothermia (Well documented as having been experienced by some individuals at
temperatures as warm as 46 degrees F).
The average number of injuries is 1.5 per household and the average number of fatalities is 0.5
per household. Based on the tail average model results across the 2017-2022 time period, the
calculated average worst case number of injuries per year is 0.73 and the average worst case
number of fatalities per year is 0.25. This can be interpreted as one injury every 1.4 years or one
fatality every four years.
Risk Score
MARS - Tail Average:
Based on the tail average results, reliability contributes the most to the overall baseline MARS
calculation. The reliability score for this risk is high because the model assumes that 40,000-
70,000 customers are impacted due to this risk event.
Injuries & Fatalities: CPSC data and SME input was used to quantify the average number of
injuries and fatalities per household resulting from fires or CO poisoning. To estimate the
percentage of risk incidents with injury and fatality, the estimated number of customers impacted

Page | 45
by this risk events (40,000-70,000 customers) is multiplied by the likelihood of using CO2-
emitting cooking equipment and the likelihood of ignition.This results in deriving the average
number of injuries of 1.5 per household, and the average number of fatalities of 0.5 per
household. Based on the tail average model results across the 2017-2022 time period, the
calculated average worst case number of injuries per year is 0.73 and the average worst case
number of fatalities per year is 0.25. This can be interpreted as one injury every 1.4 years or one
fatality every four years.
The Risk Score:
The Tail-Average Risk Score in MARS units for this risk is 325.34, which represents a baseline
pre-mitigation value. This score ranks third overall.among the 22 risk chapters.
The Frequency Score and its Impact on Overall Risk Score:
The estimated frequency score is one event about every four years with the vast majority of the
risk score assignment attributed to the reach of the occurrence, which would be expected to
impact 40,000-70,000 customer accounts. It is difficult to assess the reasonableness of the
assigned frequency score since this risk has not occurred within PG&E territory, and the utility is
unable to cite to a single occurrence within the industry.
As described above, the baseline frequency of one in four years combined with the TA MARS
injury and fatality rates predicts an average of 1.5 injuries and 1.0 fatalities per household per
event, average worst case. These incident counts, multiplied by 70,000 households and adjusted
for likelihood of hazardous indoor cooking with ignition, results in an expected per event injury
count of 0.42 and death count of 0.28.
Baseline Mitigation Controls
PG&E’s sole existing control for this risk is to conduct hydraulic analysis which the utility
explains would facilitate optional scheduling of gas safety projects to avoid delays into or near
the winter and would lead to better understanding of customer outage risks.
To minimize the liklihood of the event, PG&E schedules pipeline maintenance in the non-winter
months. If a project is delayed into or near the winter, PG&E uses hydraulic analysis to develop
contingency operations to minimize the negative impact pressure reductions has on capacity.
Probabilities of customer outages are also developed to allow PG&E to make an informed
decision to either proceed or defer a project outside the winter.
PG&E’s existing mitigation measures for this risk include focused pressure restoration projects,
completion of transmission capacity projects, and a three-year plan to improve work execution.
(Only the first two mitigations are included in the RAMP model for risk spend efficiency
calculations because the three-year plan is essentially a work process improvement that staff
within PG&E are performing and it does not result in a level of expenditure that can be
quantified.)

Page | 46
PG&E baseline costs for 2016 are forecast to spike in 2017 to allow completion of Line 407,
dive in 2018 (as large transmission capacity projects are completed), and dip further in 2019
before settling in to relatively stable levels through 2022 . The largest cost contributors are 2017-
2019 transmission capacity projects (at a cost of about $163 million), and Line 407 at a cost of
about $12 million.
Proposed (“Preferred”) Mitigation Plan
The mitigation programs for this risk in years 2020-2022 are pressure restoration projects and
transmission capacity projects.
Pressure Restoration Projects: Estimated to consist of two projects per year for 2020-2022.
Transmission Capacity Projects: Estimated to consist of four projects per year for 2020- 2022.
The total cost of the three-year effort is $173.5 million, with $4.4 million for expenses, and
$169.1 million for capital.Pressure restoration activities, which include In-Line Inspection
(commonly known in the industry as “pigging”), are pegged to a cost of $1.48 million per year
for the 2020-2022 period, a spend amount level with that of the 2017-2019 period, an expenses-
only cost.
Alternative Mitigation Plans
PG&E provided two project alternatives as required. However, the alternatives don’t offer a
different approach, but merely contemplate a change in the pace of project completion.
Alternative 1 would not change the number of projects but would expedite completion by 25
percent with a commensurate 25 percent increase in cost. PG&E does not favor this proposal as
they estimate it would bring excess capacity on line well in advance of expected demand and
need. Its RSE is 1.2454.
Alternative 2 would not modify the number of projects but would merely slow completion by 25
percent, with a commensurate 25 percent increase in cost. PG&E does not favor this proposal as
the utility estimates the alternative would not allow for needed capacity and would unduly delay
vital safety improvements. Its RSE is 1.3604.
RSE Applied to this Risk, and the RSE Results
The MARS-TA RSE for this risk’s mitigation is 1.6246, which ranks a distant third among the
22 risk chapters, far trailing the no. 2-ranked Contractor Safety, which was assigned 62.7135.
CONCLUSION
This chapter addresses the required elements of a RAMP. The risk analysis, due to a paucity of
real-world data based on actual occurance of the risk, is somewhat circumspect, but probably the

Page | 47
best available at this time. PG&E promises to further refine its approach, migrating from a pre-
existing probability model over to the bow-tie RAMP model rigor methodology.
This risk and its mitigation funding merits further scrutiny in the coursing of the forthcoming
GT&S rate case. In the interim, the RSE calculation and funding request presented in the chapter,
which extends through 2022, should have its risk title (label) more accurately assigned and
PG&E should reconcile seeming discrepencies about risk drivers in the report and Workpapers.
2.3 MEASUREMENT AND CONTROL (M&C) FAILURE – RELEASE OF GAS WITH IGNITION
DOWNSTREAM
SUMMARY
This chapter addresses the risk of a gas release with ignition resulting from a pipeline over-
pressure event, which occurs downstream of a measurement and control (M&C) station20
on
transmission or distribution pipelines. Essentially this is the risk that the pressure control
function of an M&C station fails, causing the downstream pipeline pressure to exceed the
Maximum Allowable Operating Pressure (MAOP). While not every overpressure event will lead
to gas release, such an event could result in pipeline rupture and the possibility of ignition with
injuries.
PG&E states that during the 2011-2016 reporting period its system experienced 34 overpressure
events; one of these did have a gas release that caused property damage, but without ignition or
safety consequences. This experience, plus the occurrence of similar incidents that did have
safety consequences on other U.S. pipelines, has led PG&E to classify this potential risk as
safety risk.
The absence of safety consequences from this risk for PG&E to date seems to indicate that
current risk controls have been effective. However it is important to keep in mind that a Risk
Assessment must take into account the possibility of future risks even if the operator may not yet
have experienced them.
To estimate the level of risk, PG&E combined operating history with national gas industry
statistics on frequency and safety consequences from the PHMSA database. Based on the
frequency data selected, the risk model estimates a release-with-ignition event frequency of
about once in 15 years, which may or may not result in safety consequences. 20
M&C Stations provide pressure regulation by various means depending on the pipeline. Most distribution stations are governed by self-controlled spring-loaded regulators, while most transmission stations are controlled by mainline valves which operate independently but can also be remotely controlled by a SCADA system from the central control room. Federal safety code requires an overpressure protection device in case the primary regulator fails on all pressure control stations.

Page | 48
PG&E’s recent record is one overpressure event with gas release but without ignition in six
years, so this frequency estimate appears to be in the ballpark.
For the consequence data chosen, the model gives a baseline Tail Average MARS of 12 units.
That TA-MARS result, which includes consequences from all seven of the risk categories
including financial risk, environmental risk, loss of trust, safety, etc., ranks near the lowest on the
list of 22 RAMP risks (the highest risk score is 824). However calculation of the MARS, which
attempts to equate different types of RAMP risks (injuries, financial, environmental, etc.) on the
same scale, depends on subjective opinions of scaling factors, risk reduction impact, input
choices and model assumptions, which may not give a true picture of risk.
The model estimates the proposed mitigation programs will reduce the TA-MARS incrementally
by 15% each year, for a total of 90% cumulative reduction over the six years 2017-2022, at a
program cost of $583 million (half of which is already budgeted for 2017-2019). The expected
Risk Spend Efficiency (RSE) of total risk reduction per million dollars is 0.0185, near the lowest
RSE for the 22 risks. In terms of fatality risk the model estimates a reduction from one death in
six years to one in nine years, or 3 years added to one life. The proposed mitigation plan budget
for 2020-2022 would be about $300 million.
While gas release with ignition due to M&C failure has not occurred on PG&E’s system, it is
prudent to anticipate the possibility and to manage the risk with appropriate measures.
The presentation of RSE figures for the proposed mitigation plan in the RAMP report may assist
decision makers with funding requests in the next rate case; however it would also help if the
RSE values for the baseline set of controls and mitigations were presented, to provide a
comparison of current program effectiveness with the proposed additional spending.
Chapter Statistics Summary:
MARS-EV-Overall Average-Total: 1.21
MARS-EV-Proposed Plan-Overall Average-Risk Score Reduction: 1.08
MARS-EV-Overall Average-Total-RANK: 21
MARS-TA-Overall Average-Total: 12.07
MARS-TA-Proposed Plan-Risk Score Reduction (all years): 10.77
MARS-TA-Overall Average-Total-RANK: 20
RSE Units of Risk Reduced Per Million Dollars:
MARS-EV-Proposed Plan-Total RSE (Units/$M) 0.0018
MARS-TA-Proposed Plan-Total RSE (Units/$M) 0.0185
2016 Baseline Controls:
Recorded control expense costs (000): $21,448
Recorded capital control costs (000): $76,473
2017-2019 (000):

Page | 49
Current mitigation plan expenses (average) (000) $ 8,723
Current mitigation plan capital costs (average) (000): $84,771
2020-2022:
Proposed mitigation plan expenses (average) (000): $ 1,567
Proposed mitigation plan capital costs (average) (000): $92,917
STRENGTHS
Risk drivers and choices of input data are well explained. Current risk controls are well
described, consisting of maintenance and equipment replacement programs. Controls seem to
be effective given the risk event has not occurred. Proposed mitigations are well described.
PG&E explains in a footnote that the type of overpressure event under consideration is defined
as a pressure excursion that is 10 percent above Maximum Allowable Operating Pressure
(MAOP), or 25 pounds per square inch gauge (psig) pressure above MAOP for systems with
MAOP of 250 psig or greater. A value of 15 inches of water column pressure is the limit for low
pressure station locations. These definitions are set by the Federal gas safety regulations (49
CFR Part 192).
AREAS FOR IMPROVEMENT
It should be noted that the MARS calculation is a novel approach to risk assessment, presented
for the first time in this PG&E RAMP. The scaling factors applied to each natural unit to
develop the MARS scores merit further evaluation; a change in any of these factors could have a
major impact on the MARS values. That is one reason why looking at the natural units, for
example, the estimated number of injuries or fatalities, may help illustrate the size of a safety risk
and estimated reductions.
The absence of severe consequences resulting from PG&E M&C facilities to date suggests that
the current level of controls and mitigations are effective. To fully consider the value of proposed
incremental mitigation spending, an RSE analysis of the current baseline controls should be
provided.
Risk specific information
The chapter adequately describes the risk of a pipeline over-pressure event resulting in loss of
containment with ignition, which occurs downstream of a measurement and control station.
Potential Drivers:
PG&E selected two drivers out of the nine well-defined pipeline integrity threats described by
the Association of Mechanical Engineers in Standard B31.8S that logically contribute to
overpressure of pipelines downstream from M&C stations: equipment-related threats and
incorrect operations threats. Those choices are appropriate for the risk definition. Other
pipeline integrity issues such as corrosion, third party damage, etc. are not reasonable drivers for

Page | 50
this event as they would not cause the pressure regulation devices to fail, or would logically
contribute to other types of failure events.
Potential Consequence:
The consequence model gives trust and safety risks the highest TA-MARS scores. The potential
safety consequences of injuries and fatalities elevate this risk to a high priority.
Safety consequences are based on the distribution of injuries and fatalities due to gas release
events from the most recent PHMSA national database, which covers 2010-2016. The
distribution then feeds into the MARS calculations to give the overall risk scores, which PG&E
decided should be based on the Tail Average outcomes of the model (the 90th
-100th
percentile of
outcomes) to provide a conservative prediction of consequences (average worst case).
Individual components of the mitigated score were not provided, so RASA staff requested the
separate model outcome data for the safety consequences. From that data, RASA staff
determined the expected reduction for injuries is from 0.66 to 0.47 per year, and the estimated
reduction in fatality risk is from 0.16 to 0.11 per year; or approximately 30% reductions in the
safety consequences. In whole numbers, the fatality risk is reduced from once in six years to
once in nine years. Injuries are reduced from one in 18 months to one in 2 years.
Risk Score
MARS - Tail Average and Risk Score:
The MARS overall Tail-Average risk score is 12.07, which ranks 20th
out of 22. The MARS
figure is a composite of all seven risks, not just the safety risks. The safety elements contribute
4.47 MARS units to the baseline total MARS value of 12.07, or 37% of the total. The largest
risk element of the MARS value is Trust, at 6.338 MARS units.
In natural units, the Tail-Average baseline gives an estimate of injuries and fatalities at 0.66 and
0.16 per year, or about 1 injury in 18 months and 1 fatality in 6 years. PG&E commented that
the estimated safety consequences seem high, compared to the utility’s own history of no injuries
or fatalities from this cause.
The Frequency Score and its Impact on the Overall Risk Score:
To model the event frequency, PG&E started with their own data of one gas release in 34
overpressure events in the period 2011-2016, which is a practical choice to reflect the recent
performance of their pipeline risk control programs. Then, since none of those events has
resulted in ignition, PG&E used the PHMSA national industry incident database to determine the
probability that an unexpected release would result in ignition.
This rate was then applied to the number of transmission and distribution stations in the PG&E
system to determine an estimated event frequency, which is about once in 15 years.

Page | 51
Baseline Mitigation Plan.
The current controls and mitigations are well explained, logical, and have been demonstrably
effective in preventing the risk event so far. The controls and mitigations specifically address the
identified risk drivers of incorrect operations and equipment-related threats. The 2016 recorded
cost of controls is $115 million, with an additional $61 million spent on mitigation programs that
year.
Alternative Mitigation Plans and Their Relative RSE, if any
PG&E considered altering the pace of one program among the four proposed. Both an
accelerated and decelerated pace were analyzed and were ultimately not chosen for the proposed
case based on the feasibility of execution of mitigations and overall affordability of the portfolio
of mitigations.
No completely different alternative methods or programs were presented.
Proposed Mitigation Plans
PG&E proposes one plan that continues the four programs currently under way. About half of
the total program cost of $583 million has already been funded for the 2017-2019 period. PG&E
proposes to continue the same programs into the next rate case period 2020-2022 with
incremental spending of about $100 million per year.
The four mitigation programs have been chosen to address the identified risk drivers of
equipment-related threats and incorrect operations threats, which affect the operation of pressure
control equipment at M&C stations. The Critical Documents Program seeks to identify and
correct problems with equipment documentation, so that operations and maintenance will align
with the equipment specifications and requirements. The HPR Replacement program is focused
on a particular type of pressure control device that is becoming obsolete and thus more likely to
fail. The SCADA Visibility program will add more pressure monitoring points to the central
control room’s manned system for alarming of abnormal conditions so that potential
overpressure events can be prevented. The Over-Pressure Protection (OPP) Enhancement
program will examine industry best practices and then will install secondary over-pressure
protection equipment to add another level of protection should the existing pressure controls fail.
While all the proposed programs are logical choices for further risk mitigation, the current
baseline level of safety seems to be effective given the PG&E experience. It may be that greater
risk reduction at lower cost can be achieved for some of the other risks.
RSE Applied to this Risk, and the RSE Results
PG&E applied the RSE in the standard fashion consistently used for all risks in the report. The
Total Tail-Average MARS estimated reduction of 10.77 MARS units over the six years 2017-

Page | 52
2022 was divided by the total mitigation cost of $583 million to produce a Risk-Spend-
Efficiency value. The RSE for the proposed mitigations is 0.0185, which ranks 20th
among the
22 RAMP risks.
It should be pointed out that the RSE is based on the total MARS figure, not just the safety
categories by themselves. In terms of safety risk reduction, the total $583 million of the
currently budgeted and proposed continuation of the mitigation plan is estimated to reduce the
injury rate from one in 18 months to one in 2 years, while the fatality estimate is reduced from
one in six years to one in nine years. Or in gross terms, $583 million will add three more years
to one life every six years.
CONCLUSION
The risk description, selection of data for modeling, current controls, bow-tie analysis, proposed
and alternate mitigations, and RSE were presented clearly.
While the proposed mitigations are logical for the risk described, the estimated safety
improvement is moderate for a relatively high cost. The basis for the risk reduction estimate is
the newly-developed MARS concept, which may be subject to modifications as further
experience will suggest.
There may be other safety investment candidates that will bear greater results.
2.4 MEASUREMENT AND CONTROL (M&C) FAILURE – RELEASE OF GAS W/ IGNITION
SUMMARY
The chapter addresses the risk of gas release with ignition within a measurement and control
facility, or station. While PG&E reports that this event has never occurred at a PG&E facility,
such events have occurred elsewhere in the United States gas industry. The risk drivers are the
nine pipeline threats listed in ASME B31.8S, including corrosion, mechanical flaws, outside
forces, etc.
Since there have been no incidents of this type on PG&Es stations, PG&E chose to base the risk
driver frequency solely on PHMSA industry data, proportioned by the length of PG&Es pipeline
compared to the national total and considering the number of M&C stations operated by PG&E.
Unfortunately, that choice of input data does not account for the actual condition of PG&E’s
equipment or the effectiveness of current controls and mitigations, but assumes that PG&E’s risk
is the same as the average risk in the USA. Based on the inputs chosen, the risk model predicts a
baseline event frequency of once in about 9 years.
The consequence model produced a MARS-TA score of 17.49, which ranks 18th
on the list of
22 RAMP risks. The proposed six-year mitigation plan is expected to reduce the MARS-TA
score by 1.94, or 11 percent.

Page | 53
Any actual reductions would be difficult to attribute to the proposed mitigations since the
baseline has no relation to PG&E’s own safety record for this risk.
Chapter Statistics Summary:
MARS-EV-Overall Average-Total: 1.76
MARS-EV-Proposed Plan-Overall Average-Risk Score Reduction: 0.03
MARS-EV-Overall Average-Total-RANK: 19
MARS-TA-Overall Average-Total: 17.49
MARS-TA-Proposed Plan-Risk Score Reduction (all years): 1.94
MARS-TA-Overall Average-Total-RANK: 18
RSE Units of Risk Reduced Per Million Dollars:
MARS-EV-Proposed Plan-Total RSE (Units/$M) 0.0018
MARS-TA-Proposed Plan-Total RSE (Units/$M) 0.0051
2016 Baseline Controls:
Recorded control expense costs (000): $194,278
Recorded capital control costs (000): $111,882
2017-2019:
Current mitigation plan expenses (average) (000): $23,010
Current mitigation plan capital costs (average) (000): $34,786
2020-2022:
Proposed mitigation plan expenses (average) (000): $15,985
Proposed mitigation plan capital costs (average) (000): $38,030
STRENGTHS
Identification of potential risks, even those that have never occurred, is a prudent risk
management outcome. An example is the San Bruno pipeline rupture, a type of event that had
no precedent at PG&E.
AREAS FOR IMPROVEMENT
This risk assessment suffers from the lack of any PG&E-related indication of risk frequency.
The fact that no risk of this type has occurred to date is an important data point that should be
used to inform the risk assessment. A conservative risk estimate could start with the number of
years the equipment has been in operation without incident, and then assume one event may
happen in the next year. That would establish an initial frequency, which could be refined over
time as incidents do or do not occur.
Alternative mitigations are only variations in pacing for one of the six mitigation programs. No
other possible mitigations are discussed.

Page | 54
Analysis of Chapter Specifics:
Risk specific information
Measurement and Control (M&C) stations or facilities typically provide pressure regulation for
gas pipelines or gas processing at gas storage injection and withdrawal facilities. An
unintentional release of gas at these facilities may ignite, leading to property damage, injuries,
loss of service, and other undesirable consequences.
PG&E’s review of national data finds that unintentional release has occurred 306 times at M&C
stations in the US gas industry from 2010-2016, the most recent data available from PHMSA.
Of these incidents, 41 resulted in ignition. The data can be divided between transmission and
distribution facilities.
Potential Drivers:
Risk drivers are the nine causes of pipeline failure listed in ASME B31.8S such as corrosion,
mechanical flaws, outside forces, etc., as referenced in several of the risk chapters. The drivers
are appropriate since M&C stations contain the same types of equipment found on pipelines in
general. Driver frequencies were apportioned to the nine threats according to their contributions
to the PHMSA incident data set.
Potential Consequence:
Safety consequences were based on the national PHMSA data set for gas pipeline incidents,
including number of injuries and fatalities. The predicted baseline consequences are 1 injury in
six years and one fatality in five years.
Risk Score
MARS - Tail Average and Risk Score
While the model inputs lack data for PG&E’s performance history, the risk model produced a
baseline MARS-TA risk score of 17.49, which ranks 18th
on the list of 22 RAMP risks. The
largest component of the MARS-TA is Trust at 9.4, then fatalities at 5.9 MARS units.
The Frequency Score and its Impact on the Overall Risk Score:
The frequency score of 8.5 years per event is the sum of the average frequencies of the nine risk
drivers. The frequency score has a direct impact on the overall risk score, by virtue of the bow-
tie model.
Baseline Mitigation Plan
Current controls are logical and clear. It is assumed they will continue through 2022.

Page | 55
Alternative Mitigation Plans and Their Relative RSE, if any
Two alternative programs are presented, with RSEs. There is very little difference from the
proposed plan with the exception of pacing for the Physical Security Upgrades program.
Proposed Mitigation Plans
The proposed plan continues the six current mitigation programs into the 2020-2022 period.
RSE Applied to this Risk, and the RSE Results
RSE is based on the Tail Average MARS reduction of 1.9 units, or 11% of the baseline score of
17.5, giving an RSE of 0.005, or 21st out of 22 RAMP risks.
CONCLUSION
It is important to raise up potential safety risks in order to develop plans and programs for
mitigation. In this chapter however, the absence of any PG&E-specific performance history
casts doubt on the accuracy of the risk level, and undermines confidence that the effectiveness of
the proposed mitigations can be fairly weighed.
2.5 RELEASE OF GAS WITH IGNITION ON DISTRIBUTION FACILITIES – CROSS BORE
SUMMARY
This risk is the result of PG&E gas pipelines coming into conflict with existing sewer
infrastructure in the course of trenchless installation. Because operators of waste-water and
storm drain systems are not required to mark their locations, there is a potential for a gas utility
to inadvertantly cut through existing pipe as it installs gas distribution pipe. Although such
instances are not well quantified, PG&E claims “Cross-bored sewers are found on many gas
distribution systems throughout the United States.”
The utility seems to be arguing that if the existing infrastructure were clearly marked, gas
utilities could avoid the problem. PG&E also describes the risk as being triggered during a sewer
pipe cleaning process, which presumably could damage PG&E’s gas pipe, causing a gas leak.
PG&E does adequately acknowledge that it introduced the risk by breaching the sewer to begin
with, or that PG&E has many existing gas pipes that leak for reasons having nothing to do with
cleaning of sewer pipes.
Incorrect Operations – defined as including ‘human error and incorrect procedures that may lead
to safety hazards when procedures are not followed or when improperly trained or untrained
personnel perform work on the distribution system – is the only identified driver for this risk.

Page | 56
PG&E describes this risk – which has occurred industry-wide infrequently and not in PG&E’s
service territory – as one that could occur were leaking gas to travel along a sewer pipe and into
a home where its accumulation could be ignited with explosive, potentially deadly, force.
Although PG&E has not yet suffered an event with ignition, PG&E has recorded at least 24 “loss
of containment” events since 2012 attributed to cross bores. PG&E estimates that this risk is
likely to occur once every six years leading to potential “severe consequence impacts” that
would include an average of 2.5 injuries per event, 1.3 injuries per year; and 1.5 deaths per event,
a single death per four years.
PG&E states that it is putting forward a conservative assumption that the next such event will
result in ignition and pegs the likelihood to four percent.
Chapter Statistics Summary:
MARS-EV-Overall Average-Total: 2.85
MARS-EV- Proposed Plan-Risk Score Reduction (all years): 3.47
MARS-EV-Overall Average-Total-RANK: 17
MARS-TA-Overall Average-Total: 28.46
MARS-TA-Proposed Plan-Risk Score Reduction (all years): 24.581
MARS-TA-Overall Average-Total-RANK: 16
2016 Baseline Controls and Mitigations:
Recorded control expense costs (000): $21,657
Recorded capital control costs (000): $11,217
2017-2019:
Current mitigation plan expenses (average) (000): $113,275
Current mitigation plan capital costs (average) (000): $0.0
2020-2022:
Proposed mitigation plan expenses (average) (000): $276,714*
Proposed mitigation plan capital costs (average) (000): $0.0
* PG&E provides a cost range for years 2020-2022; the high end of the range is shown here.
STRENGTHS
PG&E has committed to identifying and addressing all potential cross bores by 2023; PG&E
claims a 67 percent resulting reduction of in the associated risk score, an estimate that might be
questioned as explained in the discussion that immediately follows below.
AREAS FOR IMPROVEMENT
PG&E’s executive summary of this risk factor alternately pegs its number of gas customer
accounts as both 3.4 million (p. 5-1) and 4.3 million (p. 5-1).

Page | 57
Risk factor and analysis require more scientific rigor and less reliance on guesswork.
PG&E needs to do a better job of labeling and presenting its programs to aid reader
comprehension and avoid reader confusion.
For example, PG&E describes a cross bore [remediation] program21
that would complete
500,000 inspections and an unknown number of repairs over a 10-year period from 2014 to
2023. The program would seek to apply video equipment to sewer laterals and mains to identify
cross-bored pipes in need of repair. 22
The program promises to “identify and remediate all
potential cross bores by 2023” (p. 5-1).
This program is distinct from a related PG&E effort, a relatively new (2015) cross bore
prevention program that seeks to eliminate the creation of new cross bores within the system by
eliminating human error (p. 5-7) by means that include camera inspections during construction
(p. 5-1).
PG&E’s risk summary includes a factious and erroneous claim, “By implementing the mitigation
strategy outlined in this chapter, PG&E forecasts a potential 67 percent reduction to the overall
multi-attribute risk score (MARS) for the 2017-2022 time period.” For starters, claims of
forecasts and potential should not be looking back to a past time period. The reviewer expects a
proposed mitigation strategy to refer to PG&E’s preferred alternative for 2020-2022. PG&E does
not explain how it derived the 67 percent, and the number is not found in its workpapers.
PG&E’s workpapers-assigned value to its Proposed Plan Risk Reduction % of Baseline is 0.203.
Thus, PG&E is advised to make a correction as follows: “By implementing the prefered
alternative mitigation strategy descibed in this chapter, PG&E estimates a resulting potential 20.3
percent reduction to the overall multi-attribute risk score (MARS) for the 2020-2022 time
period.”
Analysis of Chapter Specifics:
Risk specific information
The risk described here could occur should PG&E below-grade gas pipes be breached by other
utility pipes (or vice versa, most commonly wastewater), in the course of installation of utility
pipe. PG&E describes the risk incident as “accidental breaching of surrounding [PG&E] piping
within pre-existing third-party wastewater and storm drain systems. Because such third-party
infrastructure are not required to locate and mark their facilities, an inadvertent placement of a
gas main or service through a waste water or storm drain pipeline can occur during trenchless
construction, resulting in a ‘cross-bore’.”
21
Having approximately twice the budget of the prevention program, with 2016 spending of $21,657 million v. $11,217 million spent for the prevention program 22
PG&E reasonably estimates the inspection to repair conversion rate to by 0.6 percent based on a sample of 85,100 completed inspections (p. 5-3). This, in turn, would indicate the expected number of repairs across the ten-year program period to be 3,000.

Page | 58
The danger of this event occurs should a breach involve a PG&E gas pipeline emitting even small
quantities of explosive gas. Such stray escaping gas, if introduced to a second, non-gas pipe, could
then carry the gas into a home where it could be accidentally ignited, and in turn, cause an
explosion.
PG&E also states, “In the United States such cross-bored sewer conditions are not uncommon
within gas distribution systems. Although their numbers are not well quantified, the consequence
of natural gas migrating in sewer lines is significant. Cross bores are of increasing concern for
PG&E and are identified as high risk events with potential [for] serious injuries and fatalities.”
PG&E’s 42,700 miles of gas distribution mains transport gas downstream of a distribution center
where services lines then connect the mains to any of the utility’s 4.3 million gas customers.
Potential Drivers:
PG&E stated, “Because a cross bore is created during the trenchless construction process, the
Incorrect Operations [defined as including ‘human error and incorrect procedures that may lead
to safety hazards when procedures are not followed or when improperly trained or untrained
personnel perform work on the distribution system.’] threat is the only identified driver for this
risk.”
PG&E states, “Because PG&E has not identified the exact number of existing cross bores, the
exposure is uncertain. In PG&E’s 2014 General Rate Case (GRC), PG&E estimated
approximately 500,000 sewer lateral inspections would be completed within a 10-year period.
For the risk model, the cross bore exposure is estimated on the basis of the historical find rate of
0.6 percent (e.g., 2012-2015 approximately 510 cross bores were found out of the approximately
85,100 inspections completed).”
Risk Score and Plan Alternatives
MARS - Tail Average:
PG&E’s 2020-2022 proposed preferred mitigation plan, 45,000 inspections per year to locate and
make corrections to existing cross bore gas lines, includes just one measure having a RSE of
0.918.
PG&E offers two plan alternatives, as is required, but they are little more than minor variations
on the original preferred mitigation plan, and only alter the rate of progress per year on making
necessary inspections and repairs to existing cross bore gas lines.
PG&E’s Alternative Plan 1, would accelerate the rate of completion and spending from 45,000
inspections per year to 72,000. The TA RSE for Alternative Plan 1 is 0.1054. PG&E indicates
that this alternative mitigation plan was not chosen because the utility has no practical way of
hiring the required number of sewer inspectors given California labor and housing conditions.

Page | 59
PG&E’s Alternative Plan 2, slows the pace of progress to 24,000 inspections per year. PG&E
indicates that it did not advance this plan because it has little to no real cost savings benefit while
postponing important safety upgrades.
Conclusion
The risk is adequately described, although the analysis of likelihood and consequence is very
much dependent on national data, as PG&E has not experienced serious injuries or fatalities from
such events. This will make it difficult to assess the effectiveness of mitigations, as PG&E’s
proposed activities will not have a significant impact on national incidents.
2.6 COMPRESSION AND PROCESSING FAILURE – RELEASE OF GAS WITH IGNITION
SUMMARY
This chapter discusses the risk of a gas release that results in ignition at a compressor station or
processing station (C&P station). PG&E has five gas compression stations and nine gas
processing facilities in California.
To date, PG&E has only experienced one incident of this kind at a compression or processing
facility, and that one did not result in harm to personnel. However there have been a number of
such events in the U.S. gas industry with safety consequences so it is appropriate to identify and
manage this risk.
Because there has been so little history of such events at PG&E, national pipeline database
information was used to feed the probabilistic risk model. PG&E scaled the data by 2% to
account for the relative size of PG&E’s system to the national total. However the model does
not account for the superior safety performance achieved by PG&E in this category to date.
Given those inputs, the risk model predicts an event frequency of once in 12.5 years with a TA-
MARS score of 40 points, which ranks 14th
on the list of 22 RAMP risks. Predictions of
financial risk contribute 2/3rds of the MARS score because the consequence scenario envisions a
complete rebuild of the compressor station in the worst case. Proposed mitigations are expected
to reduce the risk score by an impressive 36 points over six years, a 90 percent reduction.
Chapter Statistics Summary:
MARS-EV-Overall Average-Total: 3.99
MARS-EV-Proposed Plan-Overall Average-Risk Score Reduction: 4.04
MARS-EV-Overall Average-Total-RANK: 15
MARS-TA-Overall Average-Total: 39.86
MARS-TA-Proposed Plan-Risk Score Reduction (all years): 36.20
MARS-TA-Overall Average-Total-RANK: 14

Page | 60
RSE Units of Risk Reduced Per Million Dollars:
MARS-EV-Proposed Plan-Total RSE (Units/$M) 0.0337
MARS-TA-Proposed Plan-Total RSE (Units/$M) 0.3014
2016 Baseline Controls :
Recorded control expense costs (000): $112,994
Recorded capital control costs (000): $117,070
2017-2019:
Current mitigation plan expenses (average) (000): $12,390
Current mitigation plan capital costs (average) (000): $33,543
2020-2022:
Proposed mitigation plan expenses (average) (000): $11,720
Proposed mitigation plan capital costs (average) (000): $31,219
STRENGTHS
PG&E’s modeling of the mitigated risk shows a 90% reduction in total MARS score over the
six-year period 2017-2022. However the baseline MARS score may be inflated do to
dependence on national rather than PGE-specific data.
AREAS FOR IMPROVEMENT
1. Event Driver Dataset
Since there has only been one incident of this kind ever at a PG&E facility, PG&E chose to use
national PHMSA data to establish driver frequencies. Further, since compressor-station specific
data had zero events in some categories, PG&E chose the data set for all transmission pipeline
incidents, rather than compressor stations alone, to represent the risk. The number of events per
year was scaled by 2%, since that is about PG&E’s fraction of the total US transmission piping.
However, a 2% fraction of the national data does not account for what seems to be a better than
average record at PG&E; indeed one might expect superior safety performance given the
attention and investments in safety made since San Bruno.
At best, this data set (shown below) can only serve as an approximation of the C&P station risk,
not based on PGE-specific circumstances.
While two of the nine PHMSA compressor station-specific driver categories lacked any events,
the other driver categories do have event data. PG&E chose to ignore the available data specific
to compressor stations. The first column below is for all transmission pipeline incidents, while
the second column is for relevant stations.
There is no data for two categories in the second column indicating no incidents for stations in
those categories; however it is clear there is data for all the other categories.

Page | 61
The distribution of incident frequencies for relevant stations is considerably different from the
all-transmission distribution. If an input of zero cannot be used in the probabilistic models,
RASA Staff suggests a nominal entry of 1 could be used to generate a better approximation.
Table 10: Driver Mapping Frequency
PHMSA incidents
PHMSA incidents Filtered for relevant stations (not used)
Equipment
214 count / period 154
External corrosion
43 count / period 1
Incorrect operational procedure 40 count / period 31
Internal corrosion
44 count / period 6
Manufacturing related defects 21 count / period
Stress corrosion cracking
20 count / period Third party/mechanical
damage 115 count / period 3
Weather-related and outside force 146 count / period 63
Welding/fabrication related
59 count / period 5
While it may be conservative to benchmark PG&E’s baseline risk as equivalent to the overall
national baseline, it does not account for PG&E’s actual equipment condition, state of
maintenance, or risk reduction practice. The use of national data ignores PG&E’s own safety
record, which is better than the national average. The fact of only one incident ever occurring at
PG&E, without injury or fatality, compared to 263 station events (some with safety
consequences) nationally should be somehow modeled into a lower risk baseline than the
national rate.
2. Risk Reduction Clarity
In the narrative portion of the chapter, “PG&E forecasts a potential 15 percent reduction in the
overall Multi-Attribute Risk Score (MARS) between 2017 and 2022.” That sentence implies that
the risk reduction over the six years will be 15%. However, the tabulated score data predicts a
15% reduction for each year, for an expected total MARS reduction of 90%. The narrative does
not take credit for an impressive potential achievement.
Analysis of Chapter Specifics:
The chapter meets the RAMP objectives: current controls, probabilistic risk modeling, risk-spend
efficiency for proposed mitigations and two alternative mitigations are discussed to some degree.

Page | 62
Risk specific information
The risk is release of gas with ignition specifically within compressor stations or at processing
stations. PG&E calls attention to the history of ignition events at similar facilities in the US.
Potential Drivers:
The chosen risk drivers for the C&P station risk are the standard set of nine transmission pipeline
threats identified by the ASME B31.8S standard, including corrosion, outside force, equipment
failure, etc.
Potential Consequence:
The standard list of consequences was assigned outcome probabilities by the model. Financial
consequences are the largest component of the total MARS risk score, with fatalities and trust
consequences tied for second-greatest.
Risk Score
MARS - Tail Average and Risk Score:
The overall tail-average MARS score of 39.86 ranks this risk at 13th
highest, near the middle of
the 22 RAMP risks. Financial Risk is the largest MARS component at 25.9, followed by the
trust score of 6.9 and the fatality risk component at 6.8. In natural units the baseline tail average
fatality risk is 0.25, or one in four years.
The MARS Risk Score and Tail Average are a result of the model inputs. As noted in the Areas
for Improvement section above, the risk driver data set may not closely model PG&E station
risks since it is drawn from all national transmission incidents rather than station-specific
incidents, and does not include consideration of PG&E’s much better historical performance
compared to the national statistics. Further, a simple 2% fraction of the national data does not
take into account the relative performance of PG&E’s incidents (higher or lower) compared the
national data. The MARS and Tail Average would likely be lower with a closer modeling.
The Financial Risk is high due to the assumption that an ignition result would devastate the
compressor or processing station, requiring a near–total rebuild. It seems probable that fire-
control activities would more likely preserve station structures but it may be accurate for a worst-
case scenario, which is modeled by the Tail Average.
The Frequency Score and its Impact on the Overall Risk Score:
The frequency score is a summation of the nine driver scores, which as mentioned, may be
biased to a higher frequency than due to choice of input data. The frequency score has a direct
impact on the risk score.

Page | 63
Baseline Mitigation Plan
The baseline controls are comprehensive and clearly explained, and are expected to continue
through the 2017-2022 rate case periods. These controls are primarily based on compliance with
State and Federal gas safety regulations.
Alternative Mitigation Plans and Their Relative RSE, if any
The chapter presents two alternative mitigation plans, as required. The only difference from the
proposed plan is to accelerate or decelerate the pace of the physical security upgrade program,
one of five programs within the plan. The alternative pacing would provide small changes in the
RSE. According to PG&E, an accelerated pace would be constrained by operational and
resource issues, while a slower pace would delay implementation of protection from vandalism
or terrorism that has been determined to be a key safety issue for these stations.
Alternative mitigation plans should explore truly alternative programs such as emerging
technologies; techniques used by other utilities worldwide; or elimination of one or more of the
lower-RSE programs to examine that effect on the total risk mitigation.
Proposed Mitigation Plans
The mitigation programs include review and revision of critical design documents, engineering
critical assessments of mechanical components, and physical security upgrades. In addition, a
new Strength Testing program is planned to begin in 2018, to assess the integrity of any
remaining components that could not be verified with the engineering critical assessment
program. The mitigation plan is predicted to reduce the MARS Tail Average by 15% each year
for a total reduction of 90 percent in six years.
RSE Applied to this Risk, and the RSE Results
In the same way as the other chapters, PG&E uses the MARS Tail Average score to represent
baseline and mitigated risk levels. The MARS score total reduction for 6 years is divided by the
total mitigation spending to determine the RSE.
RSE for this risk is 0.3014, which ranks 6th
-highest among the 22 risks, while the overall risk is
ranked 13th
. As noted, baseline risk may be inflated due to choice of driver input frequencies.
CONCLUSION
The absence of incident data specific to PG&E’s C&P stations is a double-edged sword. It is
perhaps an indication of well-managed risk at these facilities, or it may be just good fortune or
some of both; but also makes it difficult to accurately quantify the baseline risk. PG&E’s
reliance on data from the national incident database may have inflated the MARS score to an
unrealistic degree.
RASA Staff suggests that additional review by SME’s of the input data to more closely model
PG&E performance may lead to a justifiable reduction in event frequency.

Page | 64
2.7 RELEASE OF GAS WITH IGNITION ON DISTRIBUTION FACILITIES – NON-CROSS BORE
SUMMARY
The chapter addresses the risk of ignition from gas release on the extensive PG&E distribution
network, excluding cross-bore damage as a cause. PG&E applied probabilistic risk modeling
and bow-tie analysis to determine a base level of risk, and proposes a package of mitigation
programs that will help reduce that risk. Risk levels were tabulated in natural units and in terms
of the MARS (Multi-Attribute Risk Score) values.
The risk model is based on PG&’s own experience with loss of containment events as recorded
in the most recent PHMSA report, which covers 2010-2016. PG&E had 59 such incidents over
the last seven years, 36 of which resulted in ignition, which sets a high probability of occurrence.
Considering the PG&E risk exposure of 78,000 pipeline miles of distribution mains and services,
the model predicts 2.5 events per year, on average.
Safety consequences from these incidents for PG&E have been few, so PG&E chose to model
the consequences from the national statistics for injuries and fatalities. The model produces a
baseline risk of 7 injuries and 3 fatalities a year, which PG&E comments are higher than their
own experience to date and are due to inclusion of all national data.
Ten existing risk control programs are described, with their 2016 recorded costs. A package of
four mitigation programs currently in progress is proposed to continue into the next rate case
period. Two alternative variants in program pacing were presented with reasons given for not
chosen them, such as lower risk-spend-efficiency (RSE) and/or lack of resources. No other
potential mitigation alternatives were discussed.
The proposed mitigations are predicted to reduce the TA-MARS risk score of 188 by 23 points,
or a 12% reduction over the six-year period 2017-2022. That reduction was erroneously stated
as 90% in the chapter narrative. The total mitigation cost over six years is $147 million, of
which $54 million is proposed for 2020-2022. The Risk-Spend Efficiency for this plan is 0.156
MARS points per $ million, which ranks in the middle of the 22 RAMP risks.
Chapter Statistics Summary:
MARS-EV-Overall Average-Total: 37.18
MARS-EV-Proposed Plan-Overall Average-Risk Score Reduction: 6.63
MARS-EV-Overall Average-Total-RANK: 10
MARS-TA-Overall Average-Total: 188.84
MARS-TA-Proposed Plan-Risk Score Reduction (all years): 23.02
MARS-TA-Overall Average-Total-RANK: 9

Page | 65
RSE Units of Risk Reduced Per Million Dollars:
MARS-EV-Proposed Plan-Total RSE (Units/$M) 0.0451
MARS-TA-Proposed Plan-Total RSE (Units/$M) 0.1566
2016 Baseline Controls :
Recorded control expense costs (000): $160,079
Recorded capital control costs (000): $348,030
2017-2019:
Current mitigation plan expenses (average) (000): $10,680
Current mitigation plan capital costs (average) (000): $20,258
2020-2022:
Proposed mitigation plan expenses (average) (000): $ 3,664
Proposed mitigation plan capital costs (average) (000): $10,444
STRENGTHS
PG&E drew on their own performance data as a primary input for the model. That input gives a
solid basis for predicting the frequency of future events when using the probabilistic model and
bow-tie analysis.
AREAS FOR IMPROVEMENT
PG&E comments that the model prediction of safety consequences seems high; in their own
experience there has been only one fatality by this cause since December 2008 (RASA Staff
notes this was the Rancho Cordova house explosion, caused by a service line leak) while the
model predicts three a year- because the consequence inputs were taken from all US gas
operators reporting to PHMSA. An improved model could weigh PG&E’s safety record more
heavily, to take credit for the investments made and management practices already in place.
Perhaps there could be a finer analysis of consequences if the breakdown of incidents on mains
versus services is performed. A large portion of the total pipeline miles used for risk exposure
consists of service line equivalent length; however the consequences for a service line in most
cases would be limited to a single home while the consequences for a distribution main could be
an entire block or neighborhood.
The inaccurate statement in the narrative of a 90% risk score reduction, when the underlying data
tabulation only shows a 23 point reduction of the 188 point MARS-TA baseline (12% reduction),
is a surprising error considering the integrity of the chapter as a whole.

Page | 66
In common with many of the other risk chapters, no truly alternative mitigations were discussed
in the chapter. If the proposed programs are considered the most effective, were there other
ideas brought forward in the selection process?
Analysis of Chapter Specifics:
Risk specific information
The risk of unintentional gas release from distribution pipelines with ignition and injuries or
fatalities is very real and the chapter explains the risk, although the outcomes predicted by the
model may be overstated.
Potential Drivers:
PG&E chose the eight drivers, or threats, for distribution pipelines given in the Federal safety
code 49 CFR Part 192. These are appropriate drives for the risk.
Cross-bore damage has a different set of drivers and mitigations, so these are appropriately
excluded from the risk as defined.
Potential Consequence:
As discussed in the Summary, the model outcomes for safety consequences predict a much
higher level than so far experienced by PG&E.
Risk Score
MARS - Tail Average Risk Score
The Tail Average Risk Score is 188 MARS points, which ranks 9th
overall and higher than most
of the gas-related risks. The score is driven about equally by a high fatality risk and also a
public trust risk. As previously discussed, the safety consequences predicted by the model are
higher than PG&E’s own experience, which directly influence the MARS scores.
The Frequency Score and its Impact on the Overall Risk Score:
The baseline frequency score of 2.5 ignition events per year is primarily driven by PG&E’s own
data, which lends confidence to this prediction. Of course, the overall risk score depends on the
frequency, since you can’t have consequences without an event.
Baseline Mitigation Plan
The current controls and mitigations are well explained and address the risk drivers.

Page | 67
Alternative Mitigation Plans and Their Relative RSE, if any
The only alternative considered was variation in the pacing of some of the mitigation programs.
RSE was calculated for the proposed plan and for the two alternative plans. The chosen plan had
the best RSE; Alternative 2 had a nearly equal RSE and spending level.
Proposed Mitigation Plans
The proposed plan is to continue with the current mitigation programs already under way. The
total predicted risk reduction over the six years starting 2017 is 23 MARS Tail Average points,
or 12% of the baseline risk. Considering the high number of predicted injuries and fatalities, a
12% reduction is not very impressive.
RSE Applied to this Risk, and the RSE Results
RSE for the proposed package of mitigation programs is 0.156 MARS units per $ million spent.
It would be useful to also have a calculated RSE for the baseline controls and mitigations.
CONCLUSION
The risk of gas release with ignition has solid documentation of occurring with some frequency
on the PG&E distribution system. It is prudent to assign a high priority to continuing mitigation
of the risk.
However, the model outcome predicts a higher level of safety consequences than seem realistic
given PG&E’s actual experience. The model could be improved by better incorporation of
actual PG&E history.
2.8 NATURAL GAS STORAGE WELL FAILURE – LOSS OF CONTAINMENT WITH IGNITION AT
STORAGE FACILITY
SUMMARY
Loss of containment from a gas well at a storage facility occurred recently at the Southern
California Gas Company’s Aliso Canyon storage field with near catastrophic environmental
consequences, but without ignition. PG&E has not experienced this type of event to date but it is
prudent to manage the potential risk.
In parallel with this RAMP, PG&E has proposed significant changes to its gas storage strategy in
the 2019 GT&S Rate Case. The Natural Gas Storage Strategy (NGSS) is in response to the new
California DOGGR regulations, which require investments to increase well safety and will
reduce the flow rate of existing gas wells. The primary driver for the NGSS is to achieve
compliance with the new regulations which are intended to reduce risk but must be followed
without consideration of risk reduction effectiveness.

Page | 68
The PG&E NGSS proposes to reduce the total number of gas wells in operation because the need
for storage capacity is expected to decrease in the future, and fewer wells means less risk
exposure as well as a lower cost to bring the remaining wells up to the DOGGR standards.
PG&E expects to save $1.5 billion from their strategy when compared to the cost of continuing
all current wells in operation.
This chapter provides an estimate of the risk reductions and Risk Spend Efficiency (RSE)
resulting from adoption of the NGSS. The use of RSE in this situation, when the proposed
mitigations will most likely be funded on the strength of the holistic NGSS rather than
independently adopted on their own risk reduction merits, has less relevance than for other
RAMP chapters.
Chapter Statistics Summary:
MARS-EV-Overall Average-Total: 1.27
MARS-EV- Proposed Plan-Risk Score Reduction (all years): 0
MARS-EV-Overall Average-Total-RANK: 20
MARS-TA-Overall Average-Total: 12.68
MARS-TA-Proposed Plan-Risk Score Reduction (all years): 0
MARS-TA-Overall Average-Total-RANK: 19
RSE Units of Risk Reduced Per Million Dollars:
MARS-EV-Proposed Plan-Total RSE (Units/$M) 0.0
MARS-TA-Proposed Plan-Total RSE (Units/$M) 0.0
2016 Baseline Controls and Mitigations):
Recorded control expense costs (000): $81,483
Recorded capital control costs (000): $28,226
2017-2019:
Current mitigation plan expenses (average) (000): $5,357
Current mitigation plan capital costs (average) (000): $71,908
2020-2022:
Proposed mitigation plan expenses (average) (000): $2,004
Proposed mitigation plan capital costs (average) (000): $60,446*
*Does not include complete costs of NGSS needed to affect the mitigation.
The RAMP result for the baseline risk estimate is higher than logic would suggest. The worst-
case fatality rate (Tail Average) is given as once every three years while the estimated event
frequency is once in 231 years. RASA Staff’s interpretation is that the expected fatalities from
that one event would be 77 people to account for an average of 1 in 3 years (231/3). However,
the maximum number of people who could be exposed to a well failure with ignition is limited to

Page | 69
15 people (the maximum number of employees who could possibly be present at McDonald
Island). The baseline risk appears to be overstated by a considerable amount.
The chapter narrative states that PG&E forecasts a 27% reduction in the overall MARS (Tail
Average Multi-Attribute Risk Score) between 2017 and 2022. However, examination of the
tabulated data shows that the MARS reduction estimate used to determine the RSE is 27% for
each year of the six-year period for a total reduction of 162%.
That result is illogical. Some of the mitigations will not even begin until 2022. And a reduction
of more than 100% of the baseline risk is not possible. Risk cannot be reduced below zero.
An RSE value for the proposed mitigations is presented along with RSE for two alternative
plans. However, the RSE calculation does not take into account the full costs of implementing
the proposed mitigations: the costs of drilling new wells and the full costs of decommissioning
Los Medanos and Pleasant Creek are not included. The RSE value is also questionable due to
what seems to be an unrealistic estimate of the baseline risk and the risk reduction.
While the chapter follows the standard approach adopted by PG&E for this RAMP, there are
weaknesses in the baseline risk calculation, estimated risk reduction, and RSE value.
STRENGTHS
Since PG&E has not experienced an event of this kind, event frequencies are based on a study
prepared for the Gas Research Institute by URS Corporation in March 2005, “Risk Assessment
Methodology for Accidental Natural Gas and Highly Volatile Liquid Releases from
Underground Storage, Near-Well Equipment.” The model result of one ignition event in 231
years may not be exact to PG&E’s circumstances but represents a low probability of occurrence,
which agrees with PG&E’s history of no events in the approximately 50 years of underground
storage operations at the three storage locations.
The proposed NGSS will reduce the overall risk exposure by eliminating 27 old non-compliant
wells and adding 11 new ones. The required DOGGER well modifications and inspections will
further reduce risk.
AREAS FOR IMPROVEMENT
The baseline Tail Average MARS value has been chosen by PG&E to represent an average worst
case scenario: 1 fatality in 3 years on average. Given the estimated event frequency of one event
in 231 years, there would have to be 77 fatalities for that event to satisfy the average of one every
three years.
In this chapter, the data set used for modeling the risk put a realistic limit on the number of
possible fatalities. The limit is the maximum possible number of PG&E employees on site at
McDonald Island: 15 people. In this case, use of the Tail Average value overestimates the
possible fatalities, inflating the safety prediction and raising the baseline MARS. With an
incorrect baseline value, the subsequent mitigation effectiveness and RSE will be incorrect.

Page | 70
The PG&E-supplied spreadsheet: “Tabulated Risk and Mitigations outcomes” includes the
baseline risk score, risk reduction per year, total risk reduction for all years, the total mitigation
cost, and resulting RSE. For this chapter the baseline TA MARS is 13 points and the estimated
reduction per year is 3.45 points. The risk reduction is then 27% per year. The total reduction
for all years is calculated at six times the annual or 20.7 points in this case.
The problem is that the baseline risk is only 13 points so a reduction of more than 13 points is
illogical. The baseline risk cannot be less than zero. However, the RSE is calculated assuming a
risk reduction of 20.7 points. The chapter narrative forecasts a risk reduction of 27% for the
entire 2017-2022 period. The narrative and the tabulated data do not agree.
The RSE is also dependent on cost estimates for the proposed mitigations. The two mitigation
programs are 1) Decommission wells at Los Medanos and Pleasant Creek, and 2) Perform
DOGGR-required well integrity inspections, with well rebuilds and retrofits.
The costs presented for these programs in the RAMP chapter do not include all of the costs
necessary to implement the mitigations. For the well decommissioning, only the $16.7 million
for costs of plugging and abandoning the wells planned for 2022 are considered. However, in
the GTS Rate Case testimony, additional costs for decommissioning add up to a total of
$40.5 million in 2022, as shown in Table 11 below (taken from PG&E Table 11-1).
The proposed mitigations cannot be realized without spending that amount.
Table 11: Gas Storage Decommissioning Costs
In addition, the cost of drilling 11 new wells is part of the NGSS. PG&E projects the cost at
$4 million per well so another $44 million should be included in the RSE calculations.
This chapter suffers from inconsistencies in data interpretation and RSE calculation. It appears
that any reviews of the chapter for logical outcomes were minimal at best. RASA Staff
recommends a more comprehensive review of the RAMP chapters before filing the report.

Page | 71
Analysis of Chapter Specifics:
Risk specific information
The risk is loss of containment of with ignition at a gas storage well.
Potential Drivers:
The selected drivers, from the API RP 1171 recommended practice for natural gas reservoirs, are
logical choices for the risk. The API standard is incorporated into the PHMSA Interim Final
Rule governing gas safety in Title 49 CFR Part 191-192.
Potential Consequence:
The potential consequences are overstated, as already discussed in the Weaknesses section.
Risk Score
MARS - Tail Average:
The MARS Tail Average is unrealistically high since the fatality estimate of 77 per event is too
high by a factor of 5 (maximum possible = 15), as discussed above.
The Risk Score:
The risk score is the MARS-Tail Average.
The Frequency Score and its Impact on the Overall Risk Score:
The frequency result of 1 in 231 seems reasonable given the history of no incidents during an
average service life of 50 years: McDonald Island dates from 1959, Pleasant Creek from 1960
and Los Medanos from 1980.
Baseline Mitigation Plan
The current controls seem logical and apparently effective given the history of no incidents in
50 years. However, to determine the efficacy of the controls requires an understanding of the
performance metrics and the condition of the assets as well as the other contributing drivers that
could lead to safety incidents at the storage facilities. It would be helpful for PG&E to analyze
its controls to determine what is working well and why.
Alternative Mitigation Plans and Their Relative RSE, if any
The alternatives are the same plans explored in the NGSS Strategy. If all the current wells
continue to operate, they will all incur expensive retrofits and require more inspections to
comply with DOGGR. RSE for the alternatives was not as good as the proposed plan. But given
the issues with the RSE calculation it is difficult to make a fair comparison between the
alternatives and the proposed plan.

Page | 72
Proposed Mitigation Plans
The proposed plan is the NGSS as detailed in the 2019 GT&S Rate Case.
RSE Applied to this Risk, and the RSE Results
As discussed above, the RSE is a result of questionable estimates of baseline risk, risk reduction,
and included costs of the mitigation plan.
CONCLUSION
NGSS is proposed as a least-cost compliance requirement in the 2019 GT&S Rate Case so
funding is not dependent on a particular estimation of risk reduction effectiveness. If NGSS is
rejected as part of the 2019 rate case, the risk assessment and proposed mitigations should be
revisited to address the deficiencies in baseline risk score, risk reduction, and RSE.
2.9 DISTRIBUTION OVERHEAD CONDUCTOR PRIMARY
SUMMARY
PG&E defines the Distribution Overhead Conductor Primary (DOCP) Risk as the safety risks
associated with human physical contact with an energized distribution conductor.
PG&E includes the following in scope: 1) contact with intact conducts on utility poles directly or
via an object; and 2) contact with downed conductors. The risk does not include other
distribution risks such as seismic events, wildfires, flooding risks, land subsidence, or extreme
weather. PG&E references its data from the last five years 2012-2016 reported to the CPUC as
incident statistics tied to this risk. That data is not included in the chapter but was referenced in
the work papers..
It is stated in the chapter that PG&E data shows:
There were a total of 16,123 wires down events from 2012-2016.
PG&E averages over 3,200 wires down events per year.
PG&E estimates that 30 % or about 4,800 of these from 2012-2016 remained energized for some
period.
Vegetation is responsible for 42% of these events (6841 wires down events).
8.5% (579 out of 6841) vegetation wire down events is with 0-9 feet of the line.
The 13 worse performing circuits make up 11.3% of vegetation wire down events and only 1.43%
of total miles.
24% of vegetation wires down events are from tree branches.
Equipment failure accounted for 31% of these events.
For conductors made of #4 ACSR, there is a more than 400% higher risk of failure than other
conductors in PG&E’s distribution system.
For conductors made of #4 copper, there is a 330% higher risk of failure than other conductors in
PG&E’s distribution system.

Page | 73
For conductors made of #6 copper, there is a 280% higher risk of failure than other conductors in
PG&E’s distribution system.
Approximately 31% of wires down events occur during storm events.
There were a total of 39 public contact events on PG&E’s distribution system from 2012-2016.
Of the 39 events, 14 resulted in fatalities; the remaining 25 events resulted in injuries requiring
medical attention. Of these events resulting in injury, 20 were due to contact with intact
conductor, 5 involved wires down events.
For fatal incidents, 8 were due to contact with intact conductor, 6 involved wire down events.
72% of injury or fatalities were due to contact with intact conductors.
46% of involve residential customers.
PG&E describes eight risk drivers for DOCP, based on PG&E data:
Vegetation – 6,841 wires down events, 42% of the total, were due to trees, branches and other
vegetation falling on distribution assets.
Equipment failures – conductor – 2,901 wires down events, 18% of total, were due to conductor
failures
Equipment failures – connector/hardware – 1,216 wires down events, 7.5% of total were due to
equipment failures associated with connector or splice failures.
Equipment failures – other – 887 wires down events, 5.5% of total, were due to overhead
equipment failures such as transformers, cross-arms, and poles
Third-party wire down – 3,420 wires down events, 21% of total, were due to third parties such as
vehicles, metallic balloons, and vandalism.
Animal – 481 wires down events, 3% of total, were due to animals such as birds, squirrels and
snakes.
Natural forces – 307 wires down events, 2% of total, were due to natural forces such as
earthquakes, lightning, flood, ice or snow.
Company initiated – 70 wires down events, 1% of total, were due to PG&E employees actions
such as improper construction or operating error.
Chapter Statistics Summary:
MARS-EV-Overall Average-Total: 659.44
MARS-EV-Proposed Plan-Overall Average-Risk Score Reduction: 43.31
MARS-EV-Overall Average-Total-RANK: 1
MARS-TA-Overall Average-Total: 824.35
MARS-TA-Proposed Plan-Risk Score Reduction (all years): 46.60
MARS-TA-Overall Average-Total-RANK: 1
RSE Units of Risk Reduced Per Million Dollars:
MARS-EV-Proposed Plan-Total RSE (Units/$M) 0.5002
MARS-TA-Proposed Plan-Total RSE (Units/$M) 0.5381
2016 Baseline Controls:
Recorded control expense costs (000): $434,303
Recorded capital control costs (000): $197,059

Page | 74
2017-2019:Current mitigation plan expenses (average) (000): $13,873
Current mitigation plan capital costs (average): $ 0
2020-2022:
Proposed mitigation plan expenses (average) (000): $17,320
Proposed mitigation plan capital costs (average): $ 0
While PG&E did highlight new initiatives it is taking to address this risk, they are not
incorporated into the proposed mitigation plans.23
There were no specific discussions on how
Electric Operations could improve the collection of data given existing and emerging smart grid
sensors and controls, data platforms, and falling conductor protections.
STRENGTHS
Similar to other chapters of this filing, the strength is the level of effort to mesh risk assessment
into the GRC with a RAMP report that attempts to cover a wide range of diverse risks involved
in the operation and management of a large electric utility. PG&E does a sufficient job in
providing base costs associated with each control. PG&E did highlight new initiatives to address
this risk which was helpful.
AREAS FOR IMPROVEMENT
This specific chapter would be improved with the following additions:
Stronger relationship between identified and scored risk drivers and proposed mitigation
programs
Specific initiatives to improve operational and infrastructure options. This includes
undergrounding, falling conductor protection and improving the collection and use of
operational data.
Better description of upgrades and utilization of smart grid technologies and data analysis
tools.
Risk specific information
The risk of human contact with overhead distribution conductors or downed wires does result in
injuries and fatalities. However, the purpose of the RAMP proceeding is to identify low
frequency, high impact incidents that normally are given insufficient attention. When
considering the potential impact of other risks to the distribution system, particularly risks
associated with natural disasters, those events would have a greater potential for widespread and
cascading impacts. So, while the risk as defined by PG&E is well described with supporting data
23
This includes 1) System Tool for Asset Risk (STAR) which would score each distribution asset for potential
failure, 2) vegetation management data enablement which uses remote sensing data to improve transmission and
distribution inspections, 3) Storm Outage Prediction Project (SOPP) that allows PG&E to properly prepare and
respond to storm events and 4) Distribution Support Structures (DSS).

Page | 75
to support their case, it is misleading in that other risks could have significantly great impacts,
including more injuries and fatalities than the identified risk in this chapter.
Given the defined risk scope, there is no insight on what the controlling and contributing risk
drivers are. As previously mentioned, there is no holistic discussion of the range of risks that are
faced by a distribution system spread over 70,000 square miles. When making decision on future
investments, it is critical to at a minimum to show that these risks were examined and evaluated
to determine whether they warrant further consideration.
Potential Drivers and Consequences:
PG&E concludes that the main drivers for wire down events are:
Vegetation
Equipment failures – conductor
Equipment failures – connector/hardware
Equipment failures – other
Third-party wire down
Given the similarities to wildfire risks, it is noted elsewhere in this report that a prior RAMP
filing identified 10 risk drivers which would also be applicable for this risk. They are:
Downed conductor
General equipment failure
Water-related failure of electric equipment
Contact by foreign object
Failure of third-party attachments
Vegetation contact
Not observing operational procedures
Lack of internal or external coordinated response
Based on past history of RAMP filings, PG&E did not exhaust the list of potential risk drivers
and provided drivers that are somewhat ambiguous.
No consequences are directly addressed in this chapter. The reduction of frequency of contact
with a conductor would factor in to the RSE and MARS scores.
Risk Score
MARS - Tail Average: 824.35
The Frequency Score and its Impact on the Overall Risk Score: 1

Page | 76
Baseline Mitigation Plan
In this chapter PG&E has 11 current controls in place to address this risk, ranging from public
education to capital replacement of overhead conductor. Those eleven controls are
1. Public Awareness Program
2. Vegetation Management
3. Vegetation Management of dead trees
4. Preventative Maintenance
5. Conductor Replacement Program
6. Overhead Patrols and Inspections
7. Overhead infrared inspections
8. Targeted Circuits Program
9. Supervisory Control and Data Acquisition (SCADA) on distribution substation sand feeder
circuits
10. Annual Protection Reviews
11. Electric Distribution Line and Equipment Capacity
PG&E gives a summary of new tools it is developing to further mitigate this risk but these are
not included in their mitigation plans or alternatives nor is any risk scoring done for these
programs.
System Tool for Asset Risk (STAR) Assessment – This is intended to provide asset
replacement guidance for conductor replacement. It will provide a risk score for each asset that
indicates probability of failure based on asset health factors and resulting consequences. Assets
with highest scores will be prioritized for replacement. In the future it may include vegetation
management so that it may provide guidance for that program.
Vegetation Management Data Enablement – PG&E’s Electric Vegetation Management
Department utilizes remote sensing information to inform maintenance, inspection, reliability
and wildfire mitigation. This information is coupled with other risk determinants such as asset
health and failure probability.
Storm Outage Prediction Project (SOPP) – This utilizes a statistical model that predictions
potential outages due to storm events. It predicts storm damage to distribution assets, allowing
for PG&E to prepare and respond to storm events. PG&E has a SOPP Objective Upgrade
project to improve and automate the SOPP model.
Distribution Support Structures (DSS) – A new data platform that PG&E is building to
centralize the data for all PG&E distribution assets, improve data quality, access and, hopefully,
risk assessments and reporting. Unfortunately, no mention is made of its abilty to track assets
conditions, including safety ratings of each asset. Using GIS and standards-based algorithms it
will include baseline loading calculations for all 2.4 million poles PG&E solely or jointly owns
and tracks inspections and has safety ratings for individual poles. Coupled with smart grid
upgrades, this type of tool could have significant safety benefits for the California electric utility
industry if appropriately developed to meet a utility’s unique needs.

Page | 77
Alternative Mitigation Plans and Their Relative RSE, if any
PG&E provided two alternatives. Alternative Plan 1 consisted of all five control mitigations but
with different scopes of work. For the conductor replacement mitigation, PG&E would increase
the annual volume of replaced overhead primary conductor by 210 additional miles a year,
tripling the current targets for the program. These additional miles would solely focus on size #4
ACSR in corrosion zones, which has a 4.25 times greater likelihood of failure per 100 miles
when compared to their system average. Requested annual budget is $110.9 million beginning in
2020.
PG&E is also proposing conductor replacement projects in areas identified with elevated or
extreme fire risk but view it as not reasonable at this time. Alternative Plan 2 considers four
mitigations which consist of public awareness, vegetation management, targeted conductor
replacement and underground conversion but due to wildfire mitigation proposals and low RSE,
it was deemed not reasonable by PG&E.
Proposed Mitigation Plans
PG&E describes four mitigation measures for 2017-2019 –
1. Overhead Infrared Inspection
2. Public Awareness Programs
3. Additional Outreach
4. Overhang Clearing
Proposed Annual Budgets
2017 $2.2 million
2018 $19.7 million
2019 $19.7 million
Overhead Infrared Inspection – PG&E seeks to continue this effort with a goal of inspecting
12,500 circuit miles a year24
, with full inspection of all circuits to be completed by 2019. As a
result, PG&E will have an inventory of spices within the distribution system and identification of
the health of each span. No justification provided for why budget escalates over three years if
inspections the same number of circuit miles each year.
Public Awareness Programs – continuation of current effort targeting 3rd
party contractors and
residential customers
Additional Outreach – Additional safety material including bill inserts, costs is split with
transmission mitigation
24
PG&E has 82,000 circuit miles of distribution lines in its service territory

Page | 78
Overhang Clearing – According to vegetation causes 42% of the wires down events, tree
branches are attributed to 24% of vegetation caused outages. Overhanging branches are
responsible for 70% of branch caused outages. Mitigation consists of clearing 24,000 miles over
overhang clearing over a five-year period in high wildfire risk areas from 2018-2022.
For 2020-2022, the proposed mitigation is
Control of overhang clearing with an increased annual budget and
Increased public awareness via mail inserts in PG&E residential bills
Proposed Annual Expense Budgets
2020 $20.8 million
2021 $20.8 million
2019 $20.8 million
In selecting these two mitigations, PG&E acknowledges that other more long-term solutions
such as conductor replacement and undergrounding may be preferable, the current RAMP
process with RSEs playing a prominent factor, undervalues options that may be more expensive
but reduce long-term safety risk.
RSE Applied to this Risk, and the RSE Results
The Tail Average Risk Spend Efficiency (RSE) for the proposed mitigation scores significantly
higher than the two alternatives, 0.538 versus 0.137 and 0.079. The proposed mitigation consists
of all expense costs and no capital costs, with the expense costs ranging from $13.9 million to
$20.8 million. The main reason for this is the high RSE for public awareness outreach, 18.335.
It also is low costs relative to clearing overhang, with a total $200,000 versus $86 million.
While public outreach may be cost-effective, this chapter does not connect how this mitigation
will educate a diverse public, whether there will be a multi-lingual approach so that anyone who
works near power lines may get educated on the dangers and risks of contact with distribution
equipment.
In the GRC filing as well as in the next iteration of its RAMP, it would be informative to explain
how the risk reduction numbers were put together, even if they are at an early stage. The goal
here is transparency, and without understanding PG&E’s thought process, it is difficult to
understand how much weight to assign the RSE differences.
CONCLUSION
The purpose of the RAMP proceeding is to elicit a utility’s sense of the safety risks, particular
low frequency, high impact events that could have catastrophic and long-term consequences.
While the risks identified in this chapter are important, they are focused on safety risks that have
limited impact on public safety and reliability.

Page | 79
This risk is a crosscutting risk directly related to wildfire risks considered in Chapter 11, there
are mitigations considered in this chapter that should also be considered for wildfire mitigations
but are not included in that chapter. Overall, the proposed mitigations are not well related to the
risk and do not include more aggressive mitigations such a replacement of conductors that have a
relatively higher probably of failure.
2.10 TRANSMISSION OVERHEAD CONDUCTOR (TOHC)
SUMMARY
This chapter describes the scope of this risk as human contact with overhead transmission
conductor and wires down incidents. While this risk is sufficiently modeled with adequate
proposed mitigation, this is solely focused on risk associated with 3rd
party contact with
transmission conductors and downed wires. PG&E has separate risk analysis associated with
Contractor and Employee Safety, which encompass a much greater range of possible risk events,
in both electric and natural gas operations and related to workplace health and safety (see
Chapters 14 & 15).
In either risk event, safety incidents appear minimal, and PG&E’s analysis confirmed that this
risk is primarily a reliability risk rather than a safety risk.” PG&E documented 55.8 wire down
events per year in the 2012-2016 period, for a total of 279 downed wires, but none resulted in
injuries or fatalities. A total of three (3) fatalities have been recorded for third-party contact with
transmission overhead lines, each a result of someone climbing a transmission tower.
As narrowly defined, this risk might be considered analogous to Third-Party Dig-Ins on natural
gas pipelines – a risk over which the utility has little direct control and for which the strongest
mitigation appears to be Public Awareness and Outreach campaigns.
Chapter Statistics Summary:
MARS-EV-Overall Average-Total: 96.41
MARS-EV-Proposed Plan-Overall Average-Risk Score Reduction: 16.15
MARS-EV-Overall Average-Total-RANK: 6
MARS-TA-Overall Average-Total: 227.50
MARS-TA-Proposed Plan-Risk Score Reduction (all years): 20.15
MARS-TA-Overall Average-Total-RANK: 7
RSE Units of Risk Reduced Per Million Dollars:
MARS-EV-Proposed Plan-Total RSE (Units/$M) 0.0537
MARS-TA-Proposed Plan-Total RSE (Units/$M) 0.0670

Page | 80
2016 Baseline Controls:
Recorded control expense costs (000): $ 86,528
Recorded capital control costs (000): $315,351
2017-2019:
Current mitigation plan expenses (average) (000): $27
Current mitigation plan capital costs (average) (000): $28,704
2020-2022:
Proposed mitigation plan expenses (average) (000): $ 40
Proposed mitigation plan capital costs (average) (000): $71,423
STRENGTHS
PG&E provides sufficient description of its effort assessing safety risks for the specific identified
event.
There is some valuable information provided in the description of risk consequences for the non-
safety attributes, particularly on financial consequences, claims against the utility and payments
made (four instances averaging $1,125 million each) and an annual financial loss of $5 million
per year, based on the tail average analysis.
AREAS FOR IMPROVEMENT
Given the fact that this risk is more about reliability and economic consequences, a methodology
that puts more emphasis on safety might cause PG&E to take it out of consideration as a top risk
in future RAMPs. However, even with relatively rare incidents, injuries and fatalities associated
with utility assets are of great public concern, so it can never be completely ignored.
Analysis of Chapter Specifics:
Risk specific information
Describe the Risk:
PG&E states that it collects safety data on this risk from 2012 to 2016 and that primary causes
are related to physical security failures at PG&E transmission assets. It also notes that the have
been 55.8 wire down events per year in that time period, for a total of 279 downed wires, but
none resulting in injuries or fatalities. Similarly with 3rd
party contact with transmission
conductors, it is noted that from 2012 to 2016 there was a total of 3 fatalities, in each case, from
individuals trespassing onto utility property and climbing on transmission towers to reach the
conductors.
The description of this risk and associated proposed mitigations do not address the physical
security aspects of this risk. With an average of 0.6 fatalities per year, it is not clear why this is a
high priority risk when it appears that for the most part this risk is currently being sufficiently
managed and no new mitigation measures are proposed.

Page | 81
Potential Drivers:
Given the narrow scope for the identified risk, potential drivers are sufficiently identified.
Potential Consequence:
Given the narrow scope for the identified risk, potential consequences are sufficiently identified.
Risk Score
PG&E’s risk modeling is sufficient for the identified risk given the state of PG&E’s risk
modeling capabilities.
Baseline Mitigation Plan
PG&E in 2016 spent over $425 million on control mitigations.
These consist of 12 measures as listed below:
C1 - Design, Construction and Operation – this includes warning signage, fencing.
C2 - Anti-Climbing Guards
C3 - Inspection and Maintenance – includes visual and infrared inspections.
C4 - Public Awareness Programs
C5 - Aircraft Line Markers
C6 - Animal Abatement
C7 - Capacity Program – monitor and control loading on lines.
C8 - Restoration and Response
C9 - System Protection Program – includes protective relaying.
C10 - Vegetation Management
M1A - Conductor/Equipment Replacement Programs (2016)
M2A - Right of Way Expansion (2016) – in 2016 PG&E began expanding its right of
way with the removal of all vegetation within the transmission lines’ right of way.
In terms of base-line costs design, construction and operation was the highest at $178 million in
capital costs in 2016. It is not clear what this expenditure is going toward and no real description
exists in the chapter. The next highest capital expense was the capacity program at over
$104 million. Again, not enough information was provided to assess whether these costs are
reasonable.
PG&E also notes that it is developing the Transmission Support Structures (TSS) tool, which is a
new data platform that PG&E is building to centralize the data for all PG&E transmission assets,
improve data quality, access and, hopefully, risk assessments and reporting.
Vegetation Management Data Enablement – PG&E’s Electric Vegetation Management
Department utilizes remote sensing information to inform maintenance, inspection, reliability
and wildfire mitigation. This information is coupled with other risk determinants such as asset
health and failure probability.

Page | 82
Storm Outage Prediction Project (SOPP) – this utilizes a statistical model that predictions
potential outages due to storm events. It predicts storm damage to distribution assets, allowing
for PG&E to prepare and respond to storm events. PG&E has a SOPP Objective Upgrade
project to improve and automate the SOPP model.
Alternative Mitigation Plans and Their Relative RSE, if any
PG&E provided two alternatives. Alternative Plan 1 consisted of all five mitigations. For the
conductor replacement mitigation, PG&E would increase the annual volume of replaced
overhead primary conductor by 210 additional miles a year, tripling the current targets for the
program. These additional miles would solely focus on size #4 ACSR in corrosion zones which
has a 4.25 times greater likelihood of failure per 100 miles when compared to their system
average. Requested annual budget is $110.9 million beginning in 2020. PG&E is also proposing
conductor replacement projects within the wildfire risk so it viewed this mitigation as not
reasonable at this time.
Alternative Plan 2 considers mitigations M3, M5, M6 and M7 but due to wildfire mitigation
proposals and low RSE, it was deemed not reasonable by PG&E.
Proposed Mitigation Plans
For 2017-2019, the current mitigation plan is shown in the table below and consists of expanding
the conductor and insulator replacement programs, vegetation management that expands current
right of way to reduce outages at the worst performing eight percent of transmission line miles
that experience 80 percent of PG&E vegetation related outages, and additional public awareness.
The proposed mitigation plan for 2020 to 2022 is shown in the table below and is an extension of
the current program, with the same measures applied to more assets within the three year period
than the current plan. The proposed mitigation plan had a tail average RSE of 0.0670
It is stated that spending will go from $425 million in 2016 to an additional amount that averages
$28 million per year from 2017 to 2019 for an average total of $453 million for that period. For
the years 2020-2022 average spending drops to $75 million with more aggressive conductor
replacement program, expected to replace 26 miles of transmission conductor per year, an
insulator replacement of 139 miles per year.
RSE Applied to this Risk, and the RSE Results
RSE results look adequate given the state of PG&E risk modeling capabilities. The proposed
mitigations are supported by their RSE scores. The overall RSE for the proposed mitigation plan
is 0.0670. Public Awareness has the highest RSE 6.6628 with the remaining mitigations of right
of way expansion, overhead conductor replacement and insulator replacement having respective
RSEs of 0.2507, 0.0052, and 0.0031. These figures look reasonable particularly since public
outreach is an expense and the remaining mitigations are capital projects.

Page | 83
CONCLUSION
As characterized by PG&E, this is more of a reliability risk rather than a safety risk. Contact
with a transmission conductor by an outside party that is trespassing on utility property is a
physical security issue. None of the proposed mitigations in the current plan appear to address
this. There is also no mention of FERC CIP-014 physical security regulations or measures that
PG&E might have taken to improve security at FERC-jurisdictional transmission assets and how
they relate to safety risks associated with their system.
One is also left with an impression from the mitigations that are proposed that somehow trees
and other vegetation are primary drivers, but it is not clear why this would be the case.
2.11 WILDFIRE
SUMMARY
PG&E defines this risk as “Fire ignitions and associated impacts resulting from interaction with
[PG&E] electric assets.” This important distinction segregates such incidents from non-utility
involved fires and those over which the utility has no control (i.e., lightning).
The utility noted that the risks of such events have intensified dramatically in recent years, due to
extreme weather, including drought conditions and subsequent wet periods that drive additional
vegetation growth. Among contributors to the risk are bark beetle infestations, local land use
policies and forestry management practices.
The chapter notes “the backdrop of extraordinary wildfires” that occurred in October 2017,
shortly before the RAMP was filed, but much of the analysis pre-dated these events. “PG&E
expects to update the wildfire risk analysis, modeling and proposed mitigations” based on on-
going fire investigations. Indeed, in late March 2018, the utility announced it would pursue
“enhanced fire mitigation program” that goes beyond what was recounted in this RAMP. Staff
recommends that PG&E provide its updated mitigation analysis as part of the subsequent GRC
expected in September 2018.
PG&E operates over 82,000 miles of electric distribution lines and 18,000 miles of transmission
lines. Of these, PG&E states there are 43,000 overhead distribution circuit miles and 9,000
overhead transmission circuit miles that fall within High Fire Threat Districts (HFTDs) as
defined by the CPUC Firemap. For this RAMP filing, only the HFTD areas with elevated or
extreme fire risk were considered.25
These lines amount to approximately half the total
distribution assets and one-third of the transmission assets. Both the transmission and
distribution portions were aggregated as one entity for risk modeling.
25
Areas of elevated or extreme fire risk are delineated on the CPUC Fire map. PG&E was involved in the development of this map in 2017.
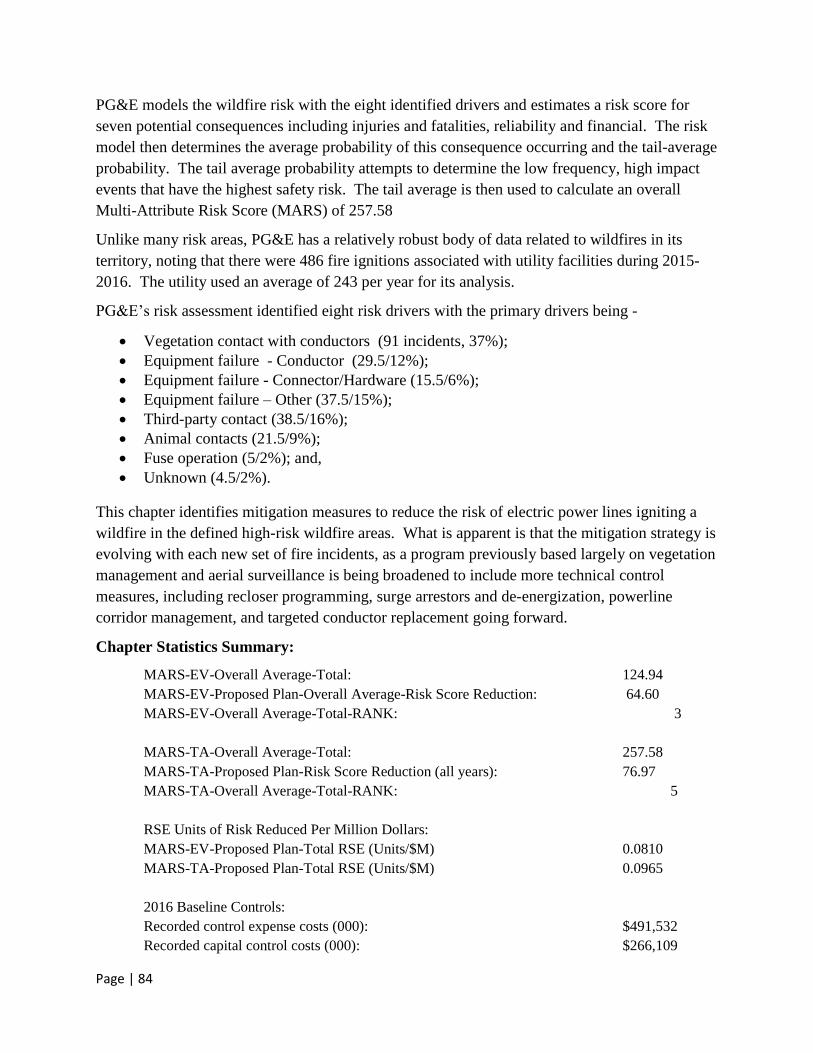
Page | 84
PG&E models the wildfire risk with the eight identified drivers and estimates a risk score for
seven potential consequences including injuries and fatalities, reliability and financial. The risk
model then determines the average probability of this consequence occurring and the tail-average
probability. The tail average probability attempts to determine the low frequency, high impact
events that have the highest safety risk. The tail average is then used to calculate an overall
Multi-Attribute Risk Score (MARS) of 257.58
Unlike many risk areas, PG&E has a relatively robust body of data related to wildfires in its
territory, noting that there were 486 fire ignitions associated with utility facilities during 2015-
2016. The utility used an average of 243 per year for its analysis.
PG&E’s risk assessment identified eight risk drivers with the primary drivers being -
Vegetation contact with conductors (91 incidents, 37%);
Equipment failure - Conductor (29.5/12%);
Equipment failure - Connector/Hardware (15.5/6%);
Equipment failure – Other (37.5/15%);
Third-party contact (38.5/16%);
Animal contacts (21.5/9%);
Fuse operation (5/2%); and,
Unknown (4.5/2%).
This chapter identifies mitigation measures to reduce the risk of electric power lines igniting a
wildfire in the defined high-risk wildfire areas. What is apparent is that the mitigation strategy is
evolving with each new set of fire incidents, as a program previously based largely on vegetation
management and aerial surveillance is being broadened to include more technical control
measures, including recloser programming, surge arrestors and de-energization, powerline
corridor management, and targeted conductor replacement going forward.
Chapter Statistics Summary:
MARS-EV-Overall Average-Total: 124.94
MARS-EV-Proposed Plan-Overall Average-Risk Score Reduction: 64.60
MARS-EV-Overall Average-Total-RANK: 3
MARS-TA-Overall Average-Total: 257.58
MARS-TA-Proposed Plan-Risk Score Reduction (all years): 76.97
MARS-TA-Overall Average-Total-RANK: 5
RSE Units of Risk Reduced Per Million Dollars:
MARS-EV-Proposed Plan-Total RSE (Units/$M) 0.0810
MARS-TA-Proposed Plan-Total RSE (Units/$M) 0.0965
2016 Baseline Controls:
Recorded control expense costs (000): $491,532
Recorded capital control costs (000): $266,109

Page | 85
2017-2019:
Current mitigation plan expenses (average) (000): $ 17,179
Current mitigation plan capital costs (average) (000): $ 30,862
2020-2022:
Proposed mitigation plan expenses (average) (000): $ 25,471
Proposed mitigation plan capital costs (average) (000): $248,819
STRENGTHS
The description of current wildfire mitigation activities and the risk modeling used to estimate
the wildfire risk were the strongest components of this chapter. Another strength of this chapter
was PG&E’s description of four initiatives to develop new tools to address wildfire safety.
AREAS FOR IMPROVEMENT
An area for improvement in the risk modeling of is the assessment of wildfire risk for
transmission and distribution (T&D) assets. As noted by PG&E, rather than combined as in this
filing there is sufficient justification for future risk assessments to be performed separately for
each system. The wildfire risks for these systems are different and mitigations also differ for
these two asset classes. At some point in the future, this more refined risk modeling should
become more granular with risk assessed based on asset characteristics such as age, construction,
type of conductor and other factors to further refine the accurate of modeling results.
For example, in the past ten years SEMPRA has developed a Wildfire Risk Reduction Model
(WRRM) that inventories distribution assets and assessed wildfire risk to every component of the
electric system, including power lines, poles, switches and fuses. The model factors in historical
fire and outage information, weather, fire history and vegetation to predict which elements of the
infrastructure are at high risk. Given that PG&E is developing new separate data platforms for
its T&D systems, in the future this type of risk model will be more feasible and support PG&E’s
analytical capabilities and tools.
Chapter 9 on distribution safety risks included control measures that could have applicability to
wildfire safety but were not included as part of a wildfire mitigation program. In order to
account for all potential benefits from mitigation measures, improved coordination between cross
cutting risks should be highlighted. For example, Chapter 9 discusses issues such as conductors
and how their probability of failure is dependent on the conductor material. This has
implications on risk modeling, identifying risk drivers, and mitigations. Such cross cutting
factors should be included in all relevant chapters in the future RAMP filings.

Page | 86
Similarly, PG&E provided description of new initiatives under development that would benefit
wildfire safety: 1) System Tool for Asset Risk (STAR), 2) Joint Use Map and Portal (JUMP), 3)
Vegetation Management Data Enablement, and 4) Next Generation Wildfire Detection. It is
suggested that future RAMP filings include some discussion about what stage of development
these efforts are at and how the utility foresees their incorporation into its mitigation programs,
particular for the GRC periods under consideration.
It would promote consistency and ease CPUC review if future utility RAMP filings by all
utilities address wildfire safety on a similar basis, such as consideration of the same safety risk
drivers, similar risk modeling methods, and potential mitigation measures.
Risk specific information
The risk was generally described as fire ignitions and associated impacts resulting from
interaction with PG&E electric assets. While it is important to address all ignitions from electric
assets, the majority of wildfires have limited spread and it is the large wildfires that are of
principle concern.
Potential Drivers:
PG&E analysis shows the main drivers for fire ignitions are
Vegetation contact with conductors
Equipment failure, and
Third party contact
The other drivers of lesser importance were conductor failure, connector failure, animals, fuse
operations and unknown.
Potential Consequence:
The Consequence attribute scores show the potential impacts of the identified risk. The tail
attribute scores are shown below:
Table 12: Tail Average Multi-Attribute Scores
Consequence Attribute Tail Average Multi-Attribute Risk Score
Safety - Injuries 1.61
Safety - Fatalities 48.54
Environmental 2.76
Reliability 36.98
Trust 92.43
Financial 75.26

Page | 87
Risk Score
MARS - Tail Average:
The rational supporting the inputs are reasonable and given the state of knowledge about this
risk, the MARS Tail Average is supported with currently available information.
The Risk Score:
The rationale supporting the risk score is reasonable. The model results can be defended based
on the stage of development of the RAMP process and information available at the time of the
writing of this chapter.
The Frequency Score and its Impact on the Overall Risk Score:
The Frequency Score and its impact appear to be reasonable and complete given currently
available information. Overall, vegetation was the risk driver with the highest frequency score at
91.0 and then the next highest scores are 3rd
party contact and equipment failure at 38.5 and 37.5
respectively.
Baseline Mitigation Plan
PG&E identifies 12 mitigations measures that PG&E implemented in 2016. Funding levels are
provided that indicate the level of effort for each measure. This includes vegetation
management, equipment and conductor replacement, and installation of SCADA equipment.
Based on these risk drivers and the model outcome, this filing proposes mitigations for two
periods, 2017-2019 and 2020-2022. In recent years PG&E has spent the bulk of its efforts on
vegetation management. It is proposing continue upgrades for circuit reclosers with SCADA
capabilities that can reduce wildfire risk by de-energizing distribution circuits during periods of
high fire danger. The SCADA recloser upgrades are part of PG&E’s Distribution Automation
Program. Conductor replacement is also being proposed as future mitigation.
It should be noted that since the filing of this RAMP report, PG&E has proposed major new
initiatives to address wildfire risk26
with mitigation measures that were not included in this
chapter; therefore it is expected the proposals in this filing will be supplemented with new
measures in PG&E’s GRC submittal.
Alternative Mitigation Plans and Their Relative RSE, if any
PG&E provided two alternatives that changed the scope of work for this program, one with
fewer resources, and the other with more resources. The first alternative plan has a small annual
budget ($47 million-52 million) and proposes two mitigations: SCADA installation and
equipment replacement.
26
SF Chronicle, “PG&E’s Wildfire Plan: Round-The-Clock Prediction and Response Center in S.F.” March 22, 2018

Page | 88
The second has an annual budget that ranges from $413 million to $460 million with eight
mitigation measures that are consistent with current controls but with the addition of
underground conversion. This added option substantially increases the budget by about $150
million per year, with a relatively minor risk-spend efficiency of 0.0048 to 0.0058 for Expected
Value (EV) and Tail Average (TA), respectively.
Proposed Mitigation Plans
Replacement of non-exempt surge arresters through 2019
Vegetation Management through 202027
Conductor Replacement Program (2020-2022)
Reclosing Operations in High Fire Threat Districts (HFTDs) (2017-2022)
It is important to note that chapter 9 on risks to PG&E’s distribution system identifies 11 controls
in place to address this risk, ranging from public education to capital replacement of overhead
conductor. Given that distribution and wildfire risks are closely related, some of those eleven
controls should have been included in this chapter and identified as crosscutting risks.
Those eleven controls from Chapter 9 are:
1. Public Awareness Program
2. Vegetation Management
3. Vegetation Management of dead trees
4. Preventative Maintenance
5. Conductor Replacement Program
6. Overhead Patrols and Inspections
7. Overhead infrared inspections
8. Targeted Circuits Program
9. Supervisory Control and Data Acquisition (SCADA) on distribution substation and feeder
circuits
10. Annual Protection Reviews
11. Electric Distribution Line and Equipment Capacity
In the future it would be helpful if the utility discussed the cross-cutting nature of these two risks
and how mitigations for them overlap. Particularly mitigation measures such as infrared
inspections, overhead protocols and inspections, and targeted circuits programs are reasonable
measures for wildfire mitigation and inclusion in the Wildfire chapter would further support
GRC funding.
2017 – 2019 Wildfire Mitigations
PG&E has proposed three primary programs for this period:
27
PG&E lists vegetation management and overhang clearing as separate mitigation measures, M3, M4, no explanation for distinction in chapter, how these two measures differ or are implemented.

Page | 89
1. Installation of SCADA Reclosers in HFTDs
2. Vegetation Management
3. Replacement of non-exempt surge arresters
Proposed Annual Budgets:
2017 $7.5 million
2018 $68 million
2019 $68 million
$143 million
2020 – 2022 Wildfire Mitigations
PG&E has proposed four primary programs for this period:
1. Installation of SCADA Reclosers in HFTDs
2. Vegetation Management
3. Replacement of non-exempt surge arresters
4. Targeted conductor replacement
Proposed Annual Budget
2020 $290 million
2021 $290 million
2022 $290 million
$870 million
RSE Applied to this Risk, and the RSE Results
The Tail Average Risk Spend Efficiency (RSE) is 0.965 for the proposed plan. Compared to
alternative 1 and 2, with their respective RSEs of 0.0518 and 0.0619, the proposed plan is
predicted to provide greater risk reduction per amount spent on mitigations. Vegetation
management is given the highest RSE with a RSE of 0.9496. Another similar mitigation,
overhang clearing has a RSE of 0.3762.
CONCLUSION
While the RAMP process is still under development, with this filing PG&E has made a credible
first attempt at meeting the CPUC’s requirements for justifying GRC requests using a process
that identifies wildfire safety risks, their drivers, and quantifying the effectiveness of proposed
mitigations will impact wildfire risks through risk spend efficiency estimates. Major risk drivers
and their relative importance was quantified and used as input in a risk model which then
calculates probabilistic estimates for levels of impact for identified impacts, described as
consequence attributes.

Page | 90
These attributes looked at calculated average and tail average, or low frequency, high impact,
risk scores. These scores were totaled to produce a multi-attribute risk score. PG&E then
described current, proposed and alternative mitigations.
One of the features of PG&E’s risk modeling for wildfire is that transmission and distribution
assets are considered collectively rather than as separate systems. Given that General Orders 95
and GO 165 requirements differ for transmission and distribution assets as well as risks
associated with wildfire, it is recommended that future risk modeling be conducted separately on
these two systems as well as proposed mitigation programs and incorporate any relevant
outcomes from the 2017 wildfire investigations.
In this chapter PG&E provides descriptions of current controls, proposed mitigations and
alternatives that were developed prior to the 2017 wildfires. PG&E has recently proposed
additional mitigation measures that were not included in this chapter. These new measures are
intended to harden its infrastructure and improve operational readiness and response with regard
to wildfire safety risks. It is recommended that PG&E update its assessment for wildfire safety
and include it in its upcoming GRC submittal to accurately reflect all activities that it is seeking
funding for through the GRC.
2.12 NUCLEAR CORE DAMAGE
SUMMARY
The Diablo Canyon Nuclear Power has two Westinghouse 4 loop pressurized water nuclear
reactors with a combined capacity of 2,240 MW. PG&E defines the risk narrowly as a Core
Damaging Event, which is the potential for radiological release at DCPP due to natural disaster,
equipment failure or some other significant event.28
The risk of a core damaging event has always been assessed since DCPP was placed in
operation. The NRC requires every nuclear power plant to be designed and operated to minimize
the risk of a core damaging event. This is quantified via a “Probabilistic Risk Assessment” model
that takes into account the potential drivers to a core damaging event.29
By feeding their PRA assumptions into the RAMP model resulted in one event in 18,376 reactor
years which significantly exceeds the Federal Nuclear Regulatory Commission (NRC) required
threshold of one event in 10,000 reactor years. Based on the RAMP risk assessment and given
that existing controls are deemed to be effective PG&E is proposing no new safety mitigation
measures “since PG&E considers this risk to be well below the regulatory required threshold.”
28
Though this includes all parts of the Nuclear facility, the risk excludes external flooding, external fire, aircraft accidents and evacuation directed by the county as well as other externally driven events not included in the DCPP probabilistic risk assessment (PRA) model. 29
12-1.

Page | 91
The existing controls will continue in accordance with Nuclear Regulatory Commission (NRC)
requirements to maintain and operate this facility.
Chapter Statistics Summary:
MARS-EV-Overall Average-Total: 0.67
MARS-EV-Proposed Plan-Overall Average-Risk Score Reduction: 0
MARS-EV-Overall Average-Total-RANK: 22
MARS-TA-Overall Average-Total: 6.65
MARS-TA-Proposed Plan-Risk Score Reduction (all years): 0
MARS-TA-Overall Average-Total-RANK: 21
RSE Units of Risk Reduced Per Million Dollars:
MARS-EV-Proposed Plan-Total RSE (Units/$M) 0.0
MARS-TA-Proposed Plan-Total RSE (Units/$M) 0.0
2016 Baseline Controls (000):
Recorded control expense costs: $282,041
Recorded capital control costs: $ 13,239
2017-2019 (000):
Current mitigation plan expenses (average): $ 0
Current mitigation plan capital costs (average): $ 0
2020-2022:
Proposed mitigation plan expenses (average): $ 0
Proposed mitigation plan capital costs (average): $ 0
STRENGTHS
The description of PG&E compliance activities and risk drivers are thorough for a core
damaging event. PG&E complies with Nuclear Regulatory Commission (NRC) requirements
including performing a probabilistic risk assessment (PRA). The PRA is used to determine risk
drivers and their frequencies. The five identified drivers are well defined.
1. External Initiated Events30
2. Internal Initiated Events
3. Internal Flooding Unit 1
4. Internal Flooding Unit 231
5. Internal Fires
30
This refers to the hard shell that protects the reactor from extreme natural events that may occur, e.g. earthquakes, hurricanes, and tornados. 31
Structural differences in the unit’s location and situation to other equipment and infrastructure between unit 1 and 2 make for different risk profiles and mitigation actions.

Page | 92
Defined metrics provide insight on how PG&E monitors safety performance by regularly
updating their PRA to ensure risk threshold is maintained and comparison with other nuclear
plants in the US. This chapter does mention potential additional NRC regulations with regard to
seismic and tsunami risks.
AREAS FOR IMPROVEMENT
Given the CPUC RAMP requirements, this chapter adequately addresses safety risks at Diablo
Canyon Power Plant.
Analysis of Chapter Specifics:
This chapter met the specific requirements laid out for RAMP filings.
Risk specific information
The risk, as noted above, was sufficiently described Potential drivers were also sufficiently
described.
Risk Classification:
This is described by PG&E as an enterprise risk.
Potential Drivers:
The definition of drivers was general (see above). These were sufficiently explained, particularly
with reference to NRC actions and requirements. However, PG&E added a note about concerns
raised since the events at Fukushima that were triggered by a seismic event and resulted in
flooding of backup generation that led to catastrophic failure.
“However, with continuing seismic evaluations being performed in response to NRC
regulations, DCPP will continue to evaluate the core damaging event risk and need for
mitigations based on the evaluation. In addition, the NRC continues to evaluate if
additional actions may be taken based on lessons learned from the Fukushima nuclear
accident in 2011. Any new actions identified and imposed would lead to additional
mitigations in the future.”32
The existing controls were clear and given the summary nature of the RAMP filing appear
reasonable.
C1 – Maintaining the Plant Systems: These controls address all plant event drivers that could
initiate a core damaging event. This includes the following specific programs:
NRC-mandated preventive maintenance and testing programs.
C2 – Operating the Facility: These controls address all event drivers that could initiate a core
damaging event: NRC-mandated emergency response program.
32
12-2.

Page | 93
C3 – Plant and system Configuration Control: These controls address all plant event drivers that
could initiate a core damaging event: NRC-mandated PRA program.
C4 – Security from External and Internal Threats, and Emergency Response: This control
addresses all event drivers of this risk that could initiate a core damaging event: NRC mandated
requirements on external and internal threats, emergency response.
C5 – Independent Oversight and Training: This control addresses all plant event drivers that
could initiate a core damaging event: Staff training programs, NRC-mandated quality control
programs.
C6 – Regulatory required improvements and ongoing seismic evaluations: This control addresses
all the drivers of this risk that could initiate a core damaging event. The plant’s Long-Term
Seismic Program is ongoing and has been in place since early in the plant’s life. This program
searches for and critically examines new information regarding the seismology around DCPP for
changes in plant susceptibility to seismic events. The Long-Term Seismic plan is updated as new
information is identified: Ongoing NRC=mandated long term seismic program. Most recent
activities involved installation of backup cooling for spent fuel pools and critical equipment.
Potential Consequence:
The potential consequences are sufficiently described for this risk. The recent events in Japan
demonstrated the difficulty of speculating on the full consequences of a nuclear event and were
considered for establishing the environmental costs. This chapter makes an appropriate attempt
to portray the scale and impact that such an event at Diablo Canyon would have on the
environment, community, its workers and the company itself.
Risk Score
MARS - Tail Average
The rationale supporting the risk model inputs appear to be well established and reasonable,
resulting in a credible MARS score, give the risk model and inputs.
The Risk Score:
The MARS and RSE seems appropriate given the manner in which the risk is framed. Again,
PG&E emphasizes NRC requirements and ongoing risk assessments to address these safety risks.
Baseline Mitigation Plan
The controls are driven by NRC requirements and are clearly explained in this chapter. These
controls are deemed by PG&E as sufficient and meeting NRC regulations. Therefore, no new
mitigations are proposed. All control mitigations were completed in 2016 and sufficient to meet
this safety risk.

Page | 94
Alternative Mitigation Plans and Their Relative RSE, if any
Since there are no additional mitigation measures proposed for 2017-2019 or 2020-2022, no
alternatives were provided in this chapter.
CONCLUSION
This chapter covers the topics required for a RAMP filing and the RAMP risk assessment,
MARS, RSE and continuation of the existing controls appears reasonable.
DCPP is a large nuclear power plant under the jurisdiction of the NRC and its associated
regulations and requirements which provide significant risk mitigation. Given the narrow scope
of the RAMP risk as defined by PG&E and the information provided in this chapter the RAMP
risk of a possible radiological release due to a core damaging event appears to be adequately
addressed.
On January 11, 2018, the CPUC adopted Decision 18-01-022 approving retirement of Diablo
Canyon when the federal operating licenses expire in 2024 and 2025, after which PG&E will
decommission this facility. This activity is beyond the scope of this RAMP filing as expected
decommissioning activities fall outside the pending GRC rate cycle. Nonetheless D.18-01-022
contemplated that PG&E may incur capital expenditures as part of decommissioning, or cancel
planned capital expenditures that will not be needed because of impending closure. Such costs,
not already anticipated in the Decommissioning fund, would be addressed in GRCs. The
decision also included discussion about PG&E possibly shutting down Diablo Canyon earlier
than 2024/2025.
Staff recommends that PG&E’s upcoming GRC application should include any revised
assessment of potential activities and expenditures, and that the next RAMP cycle include a more
detailed assessment of risk’s associated with decommissioning and how NRC guidance applies
going forward.
2.13 HYDRO SYSTEM SAFETY - DAMS
SUMMARY
PG&E defines Hydro System safety as a “failure of a [PG&E]-owned high-consequence dam as
a result of a flood, seismic event, or seepage.” The analysis concentrates on the 20 dams that
PG&E has categorized as “highest consequence”. Of these 20, PG&E states that 18 meet the
high hazard classification established by the Federal Energy Regulatory Commission (FERC),
which holds licensing jurisdiction for hydroelectric facilities, plus two others.
With 169 hydro projects in 16 river basins spread throughout its 70,000 square mile service
territory, PG&E operates the largest investor-owned hydroelectric system in the U.S.

Page | 95
The system generates electricity from 68 powerhouses and has the capacity to produce 3,900
MW of power. A total of 26 hydro projects are licensed by FERC.
At the state level, primary safety jurisdiction falls to the California Department of Water
Resources’ Division of Dam Safety (DSOD). Although not specifically mentioned in the RAMP
filing, in recent years, PG&E has been working with DSOD to develop a risk mitigation program
for its facilities.
Additionally, PG&E notes that FERC and DSOD engineers inspect PG&E’s dams at an interval
between annually and 3very three years, and federal law (18 CFR Part 12D) requires an
independent consultant to perform a safety inspection every five years.
PG&E maintains a Dam Safety Program (DSP) to address safety risks associated with
operations, especially as documented in the inspection program. While dams represent a
significant portion of PG&E’s hydro infrastructure, it also includes reservoirs, spillways, flumes,
penstocks, powerhouses, substations, and transmission towers and lines, and backup generation.
The 20 selected dams were assessed against the risk drivers of flooding, seismic failure, and
seepage. The overall likelihood of a catastrophic failure at one of these facilities was determined
to be one failure every 140 years.
Chapter Statistics Summary:
MARS-EV-Overall Average-Total: 10.09
MARS-EV-Proposed Plan-Overall Average-Risk Score Reduction: 0.90
MARS-EV-Overall Average-Total-RANK: 14
MARS-TA-Overall Average-Total: 100.89
MARS-TA-Proposed Plan-Risk Score Reduction (all years): 9.02
MARS-TA-Overall Average-Total-RANK: 12
RSE Units of Risk Reduced Per Million Dollars:
MARS-EV-Proposed Plan-Total RSE (Units/$M) 0.0157
MARS-TA-Proposed Plan-Total RSE (Units/$M) 0.1573
2016 Baseline Controls:
Recorded control expense costs (000): $10,782
Recorded capital control costs: $ 0
2017-2019:
Current mitigation plan expenses (average) (000): $ 1,220
Current mitigation plan capital costs (average) (000): $ 5,211
2020-2022:
Proposed mitigation plan expenses (average): $ 0
Proposed mitigation plan capital costs (average) (000): $13,700

Page | 96
STRENGTHS
Zeroing in on dam safety specifically, PG&E examines the generic risk of dam failure due to
flooding, seismic failure, and seepage. The risk modeling provides a broad assessment and
aggregates the risks for its 20 dams. The model produces a Multi-Attribute Risk Score for the
hydro system.
The utility’s mitigation program, on the other hand, is marked by ongoing maintenance and
repairs at specifically designated facilities, notably for Seepage Mitigation Programs at Fordyce
Dam, Spillway Remediation at Salt Springs Dam and various identified low-level Outlet
Refurbishments.
This signals that mitigation proposals are more driven by specific asset conditions that a broad
programmatic approach, which is appropriate for a hydro system that exhibits a wide range of
facilities of various vintages and subject to disparate physical conditions.
PG&E states that “the risk quantification effort has improved Generation’s capability to apply
risk reduction value to our planned work” an effort which the utility be improved by improving
inputs to the risk model and adding additional facilities to the analysis.
AREAS FOR IMPROVEMENT
Catastrophic failures associated with hydro projects, even with no loss of life, can pose a
significant public safety risk. The recent events at Oroville Dam impact raised awareness of the
latent risks that could exist in the hydro industry, particularly in California. With the Director for
the California Department of Water Resources describing Oroville Dam as “an industry
shortcoming” and “a wake-up call for everyone involved in dam safety,” this recent event has
highlighted what might be considered chronic systemic failures in regulatory and hydro industry
practices.
These failures identified through root cause analysis and include an immature safety culture as a
sub-driver, resulted in questioning the effectiveness of the Federal Energy Regulatory
Commission licensing requirements and enforcement. Another sub-driver in the Oroville Dam
incident was overconfidence and complacency regarding the integrity of the infrastructure and
tendency to emphasize shorter-term operational considerations, which is reportedly “not atypical
among large dam owners.”33
Oroville Dam is a state-run facility, but PG&E recognized the spillway failure event as
“precedent setting and potentially industry changing.” In light the recent findings of the
Independent Forensic Team (IFT) Report34
on Oroville Dam, PG&E could better describe its
hydro system and current issues related to its operation and maintenance.
33
Independent Forensic Team Report, Oroville Dam Spillway Incident, January 5, 2018 34
ibid

Page | 97
The IFT report specifically noted that:
“Appurtenant structures associated with dams, such as spillways, flumes, outlet works,
emergency spillways, penstocks, powerhouses, and associated transmission assets must
be given attention including risks associated with events which may not result in
uncontrolled release of reservoirs but are still highly consequential from a public safety
perspective.” 35
PG&E’s use of FERC high consequence criteria for narrowing its analysis is understandable at
this stage of its risk assessment methodology, but may not be sufficient in the future, as its hydro
assets continue to age and conditions potentially deteriorate with added stresses of time and
changing water patterns due in part ot Climate Change.
It would also be informative if PG&E provided information on any safety incidents related to its
hydro system occurred in the last five years or whether they have been cited by the FERC or
California Department of Fish and Game for violations in that timeframe. In hindsight, this
chapter could have spoken specifically to the findings in the IFT report and how it does or does
not relate to PG&E’s hydro assets.
Analysis of Chapter Specifics:
This chapter meets the RAMP objectives of using risk modeling to specify risk drivers and
determine appropriate mitigation priorities and investments in the regard that it utilizes an off-
the-shelf risk model coupled with PG&E data on a limited selection of a narrow asset class. In
explaining its risk modeling efforts, it did a thorough job given its scope. However, it did not
provide a comprehensive risk assessment for PG&E’s hydro system and does not draw a clear
link between safety risks and proposed mitigations.
Risk specific information
The risk was the impact on public safety from a failure at any of the 20 dam structures listed
below:
Earthfill
1. Belden
2. Butt Valley
3. Crane Valley
4. Lake Almanor
5. Lake Tabeaud
6. Pit 1 Forebay
Rockfill
7. Bucks Lake
8. Courtright
9. Fordyce
35
Ibid

Page | 98
10. Main Strawberry
11. Relief
12. Salt Spring
13. Spaulding No. 3
14. Upper Bear
15. Wishon
16. Lower Bear
Concrete
17. Chili Bar
18. Scott
19. Spaulding No. 1
20. Spaulding No. 2
Risk Classification:
As the owner of the largest private hydro system in the US, any public safety impacts due to a
failure have the potential to be catastrophic and result in significant cost. While this RAMP
filing successfully provides all the components that the RAMP proceeding is intended to provide,
in the future, future risk assessments of this asset class should address the findings from the
recent investigation of the Oroville Dam Spillway Failure to ensure that lessons learned from that
event are incorporated into utility hydro operations and investments.
Potential Drivers:
PG&E identifies the drivers for dam failure as seismic, flood, and seepage. Of the high
consequence dams the causes of failure are flooding is estimated to cause 91%, seismic are 8%
and seepage is 1% of dam failures.
Seepage depending on the situation could be a significant contributor to dam failure and can be a
chronic issue that deteriorates the asset over time. For example, Fordyce Dam, where improper
construction has led to a history of constant maintenance costs due to seepage that threatens to
weaken the dam’s structural integrity.
Similarly, while two of the three drivers are credible given the scope of this RAMP filing, future
filings would be more informative if it addressed all hydro assets, beyond the 20 dams presented
in this chapter. Risk modeling that is designed to more accurately portray hydro asset safety
risks should also be considered by the Commission and the utilities.
For example, seismic modeling of specific hydro projects may provide more accurate risk
assessments, particularly if that model has been vetted within the hydro industry and the FERC.
Similarly, specific watershed modeling developed for PG&E’s FERC relicensing proceedings
would provide better and more specific insights for those watersheds where a failure could have
catastrophic safety impacts.

Page | 99
Potential Consequence:
Overall, this chapter identifies the significant consequences for this specific, identified risk that
is within the scope of this RAMP proceeding.
Risk Score
MARS - Tail Average:
The MARS resulting from this risk modeling is sufficient given its narrow scope and limited
context.
More specific, tailored models are required if the CPUC wants to make risk assessments a tool
for making hydro safety mitigation decisions. Given the narrow scope, limited context, and off-
the-shelf modeling software, the results meet expectations. PG&E uses commercial software,
@Risk, to perform Monte Carlo simulations. It is an “off-the-shelf” software rather then a model
specifically developed to model risks for that specific type of infrastructure.
Baseline Mitigation Plan
The current controls in place to maintain safety under the DSP that were cited by PG&E are:
Routine observations
Regular inspections by PG&E staff and FERC personnel
Independent Consultant Safety Inspections every five years as required under Federal law
Engineering evaluation of dam design and operations
The current controls are partially explained. For example, it states that engineering evaluation of
dam design and operations are conducted, but it doesn’t say how frequently, whether findings are
reviewed by a regulator (FERC) or independent third party. It would also be more compelling if
the statistical metrics that make up the inspections and indicators or precursors to dam failure
was provided by PG&E from its inspections, FERC’s assessment of its assets, as well as what
independent safety consultants are finding. PG&E should also provide informative on whether
the Oroville event resulted in any of its changes to operations, procedures or safety protocols.
Alternative Mitigation Plans and Their Relative RSE, if any
PG&E presents two alternatives. The first alternative examines the impact of increasing
resources for the projects identified in the proposed mitigation plan. For example, PG&E
concluded that the installation of geomembrane liners for seepage mitigation it proposes
significantly increases expense and capital costs from 2020 to 2022but would not significantly
reduce safety risk.
The second alternative examined in this filing was perform only the minimum work required to
maintain compliance with laws and regulations. For seepage mitigation, only the Fordyce Dam
project would continue since it is needed to meet regulatory requirements by FERC and DSOC.

Page | 100
For spillway remediation, only the Belden project would continue due to regulatory
requirements. No Low Level Outlet (LLO) refurbishment projects would be performed under
this alternative.
Proposed Mitigation Plans
Near Term Mitigation Projects (2017-2019)
Seepage – Projects are ongoing at Fordyce, Main Strawberry, Relief and Courtright Dams
with all work to be completed by 2022.
Spillway Remediation – Based on recommendations from recent 18 CFR Part 12
Independent Safety Consultant Inspection report, multiple projects are planned at Scotts
Dam. Belden and Salt Springs Dam also will have mitigation projects to address current
deficiencies.
Seismic Retrofits – The fore mentioned Crane Valley Intake Tower project will continue
during this period.
LLO Refurbishments – work on Pit 1 Forebay, Relief and Spaulding Dams will continue
during this period. Lake Almanor Dam will have work done in 2017 to restore its five
operating LLO gates.
Proposed Future Mitigation Projects (2020-2022) -
Seepage – Seepage mitigation projects will continue during this period on Fordyce, Main
Strawberry and Relief Dams.
Spillway Remediation – Projects for Scott and Belden Dams continue through 2022.
Seismic Retrofit – Crane Valley Intake Tower seismic improvements are expected to be
made through 2020.
RSE Applied to this Risk, and the RSE Results
Given the state of PG&E’s modeling capabilities for assessing safety risks, the RSE in this
chapter is sufficient. The proposed mitigation plan scores a RSE of 0.157 with spillway
remediation having the highest RSE at 0.692, seismic retrofit is next at 0.474. and seepage
mitigation having the lowest RSE at 0.0045.
CONCLUSION
Given the current state of the RAMP effort and knowledge of PG&E’s hydro system, the MARS
and RSE provided in this report appear to meet the Commission’s goal of improving
transparency and accountability for safety in utility general rate cases. Based on risk
assessments that utilize probabilistic Monte Carlo simulations, the MARS and RSE make sense
given the modeling and its inputs.
PG&E notes that through its development of the RAMP filing for safety at hydro projects, it
realized “further ways to apply risk analysis techniques” are needed for future RAMPs.

Page | 101
Many of these, PG&E observes, would best be through improving inputs to the RAMP
operational risk model and including more hydro projects in the model. PG&E believes the risk
model developed for hydro project safety could attain a higher granularity and ensure reliable
and insightful results. PG&E should also consider other risk models that are consistent with
current practices and standards in the hydro industry. Not only could this improve the accuracy
of MARS and RSE results but ensure consistency with other regulatory agencies risk models.
In recent years, the CPUC Safety and Enforcement Division (SED) has been in communications
with the Department of Water Resources’ Division of Safety of Dams (DSOD) regarding PG&E
hydro assets and safety efforts by the utility. Under the California Water Code, DSOD is
responsible for regulating dam safety in the State, providing oversight to the design, construction
and maintenance of all hydro projects including those owned by investor-owned utilities. These
duties include conducting annual inspections and dam condition assessments.
A 2016 report by SED noted DSOD views on PG&E activities and the need for better
communications between PG&E and DSOD on its safety program for its hydro projects. In the
interim time since that report, PG&E has established a more proactive stance in communicating
how it determines and prioritizes safety risks to the DSOD, which is to be commended.
Concurrently, after the Oroville Dam incident in 2017, SED has requested PG&E to identify its
hydro projects that may have similar potential safety risks as was demonstrated at Orville.
PG&E has submitted records to SED of its safety reports and associated documentation in 2016
and a summary of conditions at its hydro assets, noting that 32 dam spillways have similarities to
Oroville Dam. PG&E has also reported to the CPUC on its DSOD consultations, with the next
update to be submitted on September 1, 2018 as part of its 2020 GRC Testimony.
These developments were not described in the RAMP chapter, but provide added insight into
PG&E’s evolving risk program for hydro assets and should be clearly described in GRC
testimony to provide context for safety regulation and necessary expenditures to address risk and
safety concerns.
2.14 CONTRACTOR SAFETY
SUMMARY
The contractor safety risk is categorized as “the failure to identify and mitigate occupational
exposures that may result in contractor injury or illness that is fatal, life threatening or life
altering.” Staff note that this description is consistent with how PG&E framed this risk in the
2017 GRC, however it appears to diverge from its definition of risk events, drivers and how it
framed risk in other chapters. In this case the risk is framed to focus on the causes of events,
rather than the risk events themselves (see detailed discussion below).

Page | 102
Reviewing this chapter posed many challenges for Staff and many small issues were found that
are explained below. The items discovered during the review are not intended to be an
exhaustive list of issues that may exist within this chapter.
Contractors and sub-contractors experience fatalities and injuries on a regular basis while
working for PG&E, and it states the 2012-2016 average to be 2 fatalities and 149 OSHA
reportable injuries over this period. Staff agrees that this risk should be one of PG&E’s top
risks.36
From the relatively small amount of funding proposed, adopting the proposed mitigation
plan would be warranted even if the MARS and RSE were significantly smaller. However, there
are significant issues with the utilization of the model and the RAMP process, which could shade
the results of the RAMP mitigation proposals when comparing the RSE and MARS across other
risks.
The following are the stated “drivers” for the risk event described as a “Failure to fully
implement pre-qualification and field oversight procedures may result in a contractor fatality,
injury or illness that is life threating or life altering.”37
1) Overexertion and bodily reaction.
2) Contact with objects and equipment.
3) Fall, slips and trips.
4) Exposure to harmful substances or environments.
5) Violence and other injuries by persons or animals.
6) Fire and explosions.
7) All other.
Based on the allocation used in the model the first four “drivers” result in the majority of
injuries, with the second thru fourth contributing to fatalities (with exposure to harmful
substances and environments the leading cause of projected fatalities).38
PG&E bases the
calculation of the MARS and RSE on a contractor/sub-contractor population of 23,721
individuals.39
PG&E began implementing an enterprise wide Contractor Safety Program in 2014,
which created the foundation of existing controls and formed the basis for the 2017 GRC
mitigation enhancements.
Chapter Statistics Summary:
MARS-EV-Overall Average-Total: 100.16
36
Pg. 14-1 of the RAMP filing. The statistics do not clarify the source of the data, and whether it also includes sub-contractors. For some inputs the model data only used 2 years of contractor data and one year of subcontractor data and that data does not comport with this information. Additionally, this figure is also at odds with the bow tie injury frequency of 167, which is a figure derived from the model. The use of these different data sets is confusing. 37
14-1. 38
The composition of injuries and fatalities are based on PG&E employee injury (11.2 years) data, and fatality (13 years) data. 39
This is supposed to be based on the 2016 12-month average number of contractors, which had a minimum of 17,181 (February) and maximum of 28,535 (October). The stated figure of 23,721 monthly average individuals is wrong and should be 22,701 (a 4.5% discrepancy).

Page | 103
MARS-EV-Proposed Plan-Overall Average-Risk Score Reduction: 354.05
MARS-EV-Overall Average-Total-RANK: 5
MARS-TA-Overall Average-Total: 181.48
MARS-TA-Proposed Plan-Risk Score Reduction (all years): 519.21
MARS-TA-Overall Average-Total-RANK: 10
2016 Baseline Controls:
Recorded control expense costs (000): $952
Recorded capital control costs: $0
2017-2019:
Current mitigation plan expenses (average) (000): $30
Current mitigation plan capital costs (average): $0
2017-2019 (000):
Proposed mitigation plan expense (average)(000): $98340
Proposed mitigation plan capital costs (average): $ 0
2020-2022 (000):
Proposed mitigation plan expenses (average) (000): $1,778
Proposed mitigation plan capital costs (average): $0
STRENGTHS
The risk chapter clearly identifies PG&E’s role and responsibility for the risks. Mitigations
focus on:
1. Automating processes to improve efficiency;
2. Increased resources for oversight to increase that procedures and processes are
adhered to;
3. Use of national statistics to help with the identification of key drivers of
contractor injuries and fatalities;
4. Increased focus on educating contractors.
The underlying model appears to work as intended and seems to be providing results consistent
with the inputs.
AREAS FOR IMPROVEMENT
1. The description of risk is confusing, overly broad, and appears to relate more to
mitigations than to risk events. The bow tie risk event does not seem to correspond to the
stated risk in the opening paragraph. The bow tie risk event of pre-qualification and
40
This information was gleaned from supporting worksheets and work papers. It was not included in the RAMP filing and represents Proposed Mitigations for the 2017-2019 timeframe with associated spending.

Page | 104
oversight are two types of mitigation activities that reduce the probability that the risk
events occur. The stated “drivers” appear to meet the definition of risk event that result in
injury and fatality.
2. In general, there is a lack of transparency in explaining model inputs. The filing does not
adequately explain SME rationale for the allocation choices and input choices being
made in the model. This is a generalized issue with PG&E’s current RAMP, which adds
uncertainty to the analysis of outcomes.
3. Many of the model assumptions appear to inflate the MARS and RSE. Combining 2015
and 2016 data for a trailing 2-year average is a very small sample and does not take into
account the 100% increase in sub-contractor hours added in the 2016 data set that was
used in the equation (e.g. comparing 2015 to 2016 results in a 37% decrease in the 2016
injury rate). If the model used only 2016 data, which corresponds to the current baseline
controls, then the MARS and RSE would decrease significantly. Because parties and
Staff do not have the native expertise, SMEs should provide explicit rationalization along
with the data to support the key inputs used to determine the MARS and RSE.41
4. Based on information obtained via data request the SMEs appear to have accepted data
provided by their third-party contractor management service at face value without
analyzing it for integrity or reasonableness. For instance, the 2016 hours worked vary
significantly. In December 2016, individuals each worked an average of 510 hours for the
month (which would mean every one of the 23,300 contractors worked 17 hours a day for
30 days straight42
); however, in the month of January 2016 each individual worked an
average of 105 hours for the month.
5. Using a two-year data set to determine the average number of injuries and fatalities is a
concern because five years of contractor data was available for this purpose. The reasons
for choosing the two years of data versus the five years of data should be explicitly
provided in the chapter.
6. At the outset PG&E explained that it focused the RAMP analysis on going-forward
mitigations rather than existing controls and did not provide a MARS and RSE for its
baseline controls.43
Staff finds that without a baseline MARS and RSE, it is difficult to
gain confidence in the asserted risk reduction from proposed mitigations. Especially
since no trend analysis on the risk reduction impact of existing controls has been
provided. Thus, it is unclear how much of the reduction in risk is due to the ongoing
benefit of controls already in place versus the incremental impact from newly proposed
mitigations. PG&E should define and share the performance of its baseline controls in
order to compare them to the proposed mitigations.
41
“I only believe in statistics that I doctored myself” – Winston S. Churchill 42
This level of effort could contribute to overwork injuries, fatigue and mistakes and should be investigated to ensure that if this is a causal factor, then mitigations could address the potential for increased incidents. 43
For purposes of RSE calculations, PG&E focused on mitigations (rather than controls) due to the forward-looking nature of its program and the desire to understand the potential risk reduction associated with new mitigation investments. A-13.

Page | 105
7. The consequences outlined in the chapter only show injuries and fatalities, without any
secondary consequences should contractors fail to perform in accordance with their
contract or in compliance to statutory requirements. For example, if the contractor does
not follow procedures, this could result in environmental spills or result in harm to the
public. Failure to do work properly could result in premature failure of assets (pipeline
weld failure, other asset replacements don’t holdup, etc.) that reduces reliability and trust.
These ancillary consequences could be acknowledged and an explanation of how or
where addressed within PG&E’s risk assessment.
8. Contextual information is lacking to help put the controls, mitigations and proposed plan
into perspective. For example, even though existing controls include 140 contractor
safety program compliance assessments across all LOBs, there is no sense of context that
explains what that means against the entire number of contractor projects completed in
that time frame. A ratio that entails of all projects would give intervenors a better sense
of the scope of the task.
9. The tables in the RAMP filing do not always agree with the supporting worksheets and
work papers. There are projected spending amounts for mitigations M9-M12 in the
2017-2019 timeframe, but they are not shown in the Table 14-2: Risk Mitigations and
2017-2019 Estimate Costs. These mitigations are contemplated for implementation and
counted toward risk mitigation during this time frame, yet about $2.9 million in costs
were omitted and they are not included as part of the current mitigation plan.
10. Many of the chapters reference data and source data not in the public domain. If this is
key information used in developing the risk information in the chapter and modeled to
derive the MARS and RSE, then it should be provided to parties and Staff. This could be
done in many ways, such as by appending the model workbook, or report chapter, or on
PG&E’s website.44
At the end of each RAMP risk chapter, PG&E should include a
bibliographic list of the data used in the chapter with an explanation of where it may be
located.
Risk specific information
PG&E needs to do more to properly identify the drivers in the bow tie, and it appears the risk
events are conflated as risk drivers. In addition, the mitigations focus on determining whether
the PG&E employees and contractors have complied with process, contractual requirements,
statutory requirements, procedures and protocols. It is implied that active participation by PG&E
in the scoping contracts, contract administration, job oversight, incident investigation and
corrective action procedures will identify the exposures and thus enhance contractor safety.
However, it was not explained how any one of these mitigations can be tied directly to specific
risk reduction or incident reduction.
44
https://pgera.azurewebsites.net/account/login

Page | 106
The contractor safety risk is described as “the failure to identify and mitigate occupational
exposures that may result in a contractor injury or illness that is fatal, life threatening or life
altering.”45
The phrasing of the risk could be confusing because the failure to fully implement the
prequalification and oversight procedures is not the risk event where injury or fatality takes
place. Pre-qualification and oversight are two types of mitigation activities that reduce the
probability that the following types of risk events from taking place. See the Summary for the
events that result in injury and fatality in contractors and employees alike.
Within RIM these are called risk drivers by PG&E. PG&E’s definition of risk event (B-6) says
that a “risk event, which is a single, measurable event caused by the drivers… which [could]
brings about the consequences.” This chapter is inconsistent in framing the risk, which is
variously described as the “failure to identify and mitigate occupational exposures” and “failure
to fully implement prequalification and field oversight.” The bow tie risk event focuses on two
activities that Staff sees as mitigations that would increase the likelihood of detecting and/or
preventing risky situations where risk events occur. For this chapter, it appears that the stated
“risk drivers” are the real contractor safety “risk events”.
For example, overexertion and bodily reaction is an event, which under the right set of
circumstances leads to injury or fatality. There might we many incidents of overexertion where
only a very small fraction actually results in negative consequence. A driver might be:
Not enough contractor employees with the right skill sets to perform the work which
puts pressure on those with the skills to overexert to get the job done; or
The number of contract projects that were poorly scoped where more hours are
required by the limited employees to complete the project; or
Underestimating the resource requirement for the project which puts pressure on
contractors to get more done with fewer resources.
These, then, could become the drivers and this tie directly to the mitigations being proposed,
which reduce the frequency that contractors overexert themselves to get the job done.
It appears that because of the many stated drivers included in this chapter, which appear to be
events, the stated mitigations do not directly match up. The only way success of the mitigations
can be gauged is by trending the ultimate consequences in the model, which are the rates of
fatality and injury.
The misalignment between mitigations and drivers makes this chapter confusing and contributes
to difficulty in identifying appropriate metrics for measuring mitigation performance. For
instance, mitigation M9 provides structure, information and organization for contractors to
45
14-1

Page | 107
improve their work planning. This could reduce the cause of overexertion by ensuring that
contractors have scoped in enough project resources and not behind schedule.46
Risk Classification:
Classification of contractor risk as a significant safety risk is consistent with the RET
classification and appears to be appropriate and in keeping with the Commission guidance, and
the specific risk impacts have qualified this for inclusion in RAMP under PG&E’s current
methodology.
Potential Drivers:
The drivers match the injuries and fatalities experienced by contractors. The bow tie depiction
shows in graphical form the key drivers of contractor injuries and fatalities. See drivers listed
above in the summary.
Potential Consequence:
It appears that the actions of contractors which result in injuries and fatalities could also have
other consequence attributes (Environment, Reliability, Compliance, Trust and Financial).
PG&E claims that there were no impacts included in the data sets for Environmental, Reliability
and Trust consequence attributes. However, staff noted that in Chapter 3 – Release of Gas with
Ignition Downstream, a case was made to use PHMSA data for fatalities and injuries in the
absence of PG&E data. It appears that part of the reasoning behind using an alternate data
sources is to establish a worst-case scenario, because similar events have happened somewhere
before on similar assets. This same discussion should take place within the Contractor Safety
risk. In the not too distant past, the Kern Power Plant Settlement imposed several compliance
requirements on PG&E with associated costs, which may impact Trust and Financial
consequences.47
Even though the Compliance consequence was assumed to be embedded in the current
Contractor Safety Program, PG&E has not established the worst-case Tail Average consequence
should another event like the Kern Power Plant demolition occur. Lastly, the Financial
consequence was excluded because costs associated with contractor injuries, illnesses and
fatalities are subsumed by the contractor. It would appear that in keeping with establishing
worst-case scenarios, that the Financial consequences of contractor safety should be discussed
more fully in the RAMP.
46
The relationship between frequency of overexertion events and whether the project is on schedule or behind schedule could help identify whether projects that are poorly scoped and run behind schedule have a higher frequency of overexertion injuries or events. This could be developed into a metric for measuring mitigation performance. 47
D.15-07-014 in I.14-08-022 pg. 12 a fine of $2.3 million along with a $3.3 million ratemaking adjustment imposed, and pg. 4 of the settlement showed how the Kern event created concerns in other affected communities in California.

Page | 108
It appears that PG&E is assuming that it has shielded itself and limited its liability since it relies
on the use of contractors, however, Commission policy and California courts have affirmed that
the utility still bears ultimate responsibility.48
In addition, PG&E’s contractors who fail to comply with safety rules, procedures and policy
could endanger the public.49
This aspect of contractor safety was ignored and should at least be
discussed to show how and why the risk is being handled by PG&E as it does.
Risk Score
MARS - Tail Average:
All of the TA MARS Safety RSEs for the programs within the proposed plan fall within PG&E’s
top 10 RSEs for the entire list of programs in the RAMP. This appears to be due to input
assumptions on the risk reduction expected and built into the model by the SMEs. Staff does not
have native expertise to assess the validity of the input assumptions, though the explanations for
the assumed risk reduction did not provide enough guidance to adequately support these inputs.
If there was any bias that over/understates risk reduction or the allocation of impact from the
mitigations on event frequency, then that would diminish the comparability of the RSE across
other risks. Without a greater level of validation, Staff is unable to determine whether this is the
case.
Issues with the Model:
In addition to the items noted in the areas for improvement above, the following represent issues
of data integrity that had an impact on the MARS and RSE, even though small, it raises the
concern that greater care should be taken should issues like these have a greater impact and skew
results unfairly.
1. The 2016 supporting worksheet average number of employees does not match the
figure in the Model. The worksheet average is 22,701 contract and subcontract
employees, whereas the model shows 23,721, which is 4.5% greater. This is due
to both January and February contractor figures being stored in the underlying
data as text instead of numbers and not being considered by PG&E in the average.
The lack of proper vetting of the third party supplied data is the likely cause of
this error.
48
See, Snyder v. Southern California Edison (44 Cal.2d 793 (1955)), which prohibited a California utility from delegating to an independent contractor responsibility for compliance with Commission safety rules and regulations governing activities that are a necessary part of its business as an owner and operator of utility facilities. 49
In many construction activities, PG&E relies on California Environmental Quality Assessment contractors to perform many sensitive and dangerous tasks, from handling hazardous materials to operating aircraft.

Page | 109
2. The average hours worked per month per individual in 2016 should be 183.3
(monthly total hours/monthly total of individuals) versus the 175.4 included in the
model. This would have a slight impact on the MARS.
3. Per a staff data request, it was discovered that 2015 data excluded sub-contractors.
Therefore, the average incidents and incidents per individual may have issues, but
without digging deeper into the source of the incidents it is difficult to assess the
quality of these inputs. For example, there are months in 2016 where the data
shows a low of 100 hours/individual and a high of 510 hours/individual. The data
was accepted at face value from the third-party service provider without vetting.
4. The number of incidents claimed in the model could not be traced to the data
request values for 2016. It appears that the same issues affecting the
discrepancies in #2 above apply here as well.
5. PG&E used National BLS injury and fatality rates to determine the frequency of
its risk (167 injuries and 2.8 fatalities per year). PG&E used two years of
statistics for its own incident rates. Using the higher National BLS statistics to
establish the baseline could give a false sense of achievement given that PG&E’s
2016 actual incident rates are lower.50
Granted that this is the first attempt to use such a model, however, greater effort should have
been put into explaining all inputs and variables within the chapter model as well as providing
values produced from the model within an output tab that represented the live model outputs.
The Risk Score:
The following shows the proposed mitigation plan for 2020-2022.51
Table 13: MARS Scoring for Contractor Safety Mitigations
519.21 NA 62.7135 NA
Mitigation Name
MARS-TA-
Risk score
reduction
MARS-TA-
Risk score
reduction-
RANK
MARS-TA-
RSE (units
/ $M) by
mitigation
MARS-TA-
RSE (units
/ $M) by
mitigation-
RANK
Contractor Governance 327.26 3 55.17 7
Tools and Technology 77.58 6 315.52 2
Contractor Process Improvements-A 54.59 8 71.55 5
50
One year of data does not a trend make, but in the absence of reliable statistics from 2015, the 2016 data may be a good starting point since the Contractor Safety Program was in full force during 2016. 51
Note the Contractor Process Improvements-“A” overlaps with the descriptions of both “B” and “C”, See discussion below regarding alternatives, therefore, these valued need to be reviewed and checked for accuracy.

Page | 110
Contractor Knowledge 41.61 12 379.25 1
Contractor Process Improvements-B 9.08 32 17.03 11
Contractor Process Improvements-C 9.08 32 13.05 12
In spite of the concerns over the data integrity and rationale for choices of inputs and
assumptions, intuitively one can see the significant safety risks associated with contractors.
Even if estimates of risk reduction were significantly downsized, the risk spend efficiency would
still provide relatively high RSE scores. The problems with the transparency and explanations
that dictate the MARS and RSE do not obviate the perceived value of these lower cost programs.
Baseline Mitigation Plan
The current controls are described briefly, and reference is made to the Kern Power Plant
Settlement, which was fundamental in creating the Contractor Safety Program. PG&E asserted
that the mitigations required by the Kern Settlement have been completely implemented and in
effect, with $981,000 annual expenses thru 2022.
Alternative Mitigation Plans and Their Relative RSE
Based on the model it appears that Alternative 2 provides the greatest risk score reduction value
based on its RSE, and both Alternative 1 (RSE = 65.86 a 5% better value) and 2 (RSE = 71.07 a
13% better value) provided greater value than the Proposed Plan (RSE = 62.71). This is due to
Alternative 1 and 2 eliminating Contractor Process Improvement “B” and Alternative 2 also
eliminating Contractor Process Improvements “C”, which have relatively high costs compared to
their risk reduction score.
Table 14: Mitigation Alternatives
MARS-TA-Risk score
reduction
MARS-TA-RSE
(units / $M) by
mitigation
Total Spend (All
Years)
Proposed Plan 519.21 62.71 $ 8,279,123
Alternative 1 510.13 65.86 $ 7,745,973
Alternative 2 501.05 71.07 $ 7,050,160
It is very difficult to discern the choices between the proposed plan and the alternatives because
of the conflicting information and descriptions in both the work papers and the Chapter. The
following describes how the chapter write-up of the Alternative mitigations was confusing and
lacked clarity. The proposed mitigations for Contractor Process Improvement “A”, “B”, and “C”

Page | 111
were worded unclearly and appear to duplicate the project areas when they are combined with
each other in the project plan, or the alternatives.
Rejection rationale for Alternative 1: “PG&E did not choose [Alternative 1] as an alternative
plan due to restrictions around resource demands, as they pertain to the required technology
development, training and deployment of this mitigation, which could affect PG&E’s ability to
achieve the desired risk reduction results.”52
It is not clear what restrictions around resource
demands are driving the rejection of Alternative 1. This needs to be more fully explained. Does
this mean that the efficiencies gained by doing “B” net out significant cost savings, such that by
not doing “B” it is more expensive than the added cost of “B”, which is $534K?
Rejection rationale for Alternative 2: “Alternative 2 in addition to the removal of SOW
Enhancements, removes the DMV records review and states that obtaining the records could be
difficult, and also removes the development of a process for tracking contract "Change Orders"
at the close-out of projects given implementation constraints. The other three mitigations
(Governance, Knowledge, Tools and Technology) for Contractor Safety remain the same. PG&E
did not choose this as an alternative plan because the other three mitigations could better achieve
the desired risk mitigation results and feasibility of this strategy was uncertain.”53
This too needs
more explanation.
Proposed Mitigation Plans
The proposed mitigation is very close to the Alternatives and all three appear reasonable (as
noted in the prior section there are issues with the descriptions and what the projects entail). The
best risk reduction value is found in Alternative 2, where the reasons for rejection are vague and
seemingly contradictory. The saving grace of this chapter is the high safety coefficient in the
scores and relatively low cost as compared to other risks and their associated mitigations.
However, here is another opportunity to provide some suggested improvements regarding the
proposed mitigations. In the chapter and model there is an explicit exclusion of motor vehicle or
transportation incidents, however, specific mitigations are proposed that would impact motor
vehicle/transportation risks. PG&E should explain whether and where the contractor motor
vehicle risk is included in RAMP. If PG&E feels it is not culpable or divorced from the
contractor motor vehicle risk then it should so state and obviate the mitigation projects where it
believes it has no risk.
Currently, the proposed plan includes:
Review Motor Vehicle Incident (MVI) Records (Department of Motor Vehicle (DMV)
Records) and specify any additional driver training required by PG&E - This mitigation
will ensure that PG&E is using contractors that have safe driving records and that have a
safe history of operating motor vehicles prior to engaging in PG&E related work.
52
WP 14-12. 53
WP 14-13

Page | 112
Additionally, requiring safe driving programs and additional driver training for specific
contractors will help reduce the risk of both Preventable Motor Vehicle Incidents
(PMVIs) and Serious Preventable Motor Vehicle Incidents (SPMVI’s) on PG&E related
work.
RSE Applied to this Risk, and the RSE Results
See comments in sections of the evaluation above that refer to RSE.
CONCLUSION
Because of the over reliance on SME input and judgement the RSE’s calculated by the model
cannot be used to make reliable comparisons across the other chapter risks. Any appearance that
incident frequency, risk reduction or other key model input assumptions are slanted could make
the model outputs less credible for comparing RSEs across risks and prioritizing spending,
especially when there is very little difference between normalized RSEs.
The key Staff concern is that the input assumptions in the model were inadequate to be able to
fully evaluate the risks and risk reductions within the chapter. PG&E should contemplate
instituting controls to ensure that an objective entity within PG&E reviews questions, tests, and
vets LOB risk owner and SME assumptions, opinions, inputs and supporting data for quality and
integrity and signs off on the chapter results.
With respect to the housekeeping in this chapter, PG&E needs to take greater care in preparing
the chapters, ensuring consistency of descriptions and definitions throughout the chapter and
work papers. It appears that PG&E lacks the internal quality control processes necessary to
detect and prevent erroneous data from being used in the MARS and RSE model. PG&E should
improve its processes to ensure quality control over the accuracy of data and inputs used in the
model.
Lastly, PG&E should make a concerted effort to develop a MARS and RSE for the baseline
controls. This would aid in the evaluation and quantification of any mitigation in progress and
proposed for future implementation. For this particular chapter understanding the efficacy of the
existing controls in place is paramount to evaluating the impact that proposed mitigations might
have in the future.
Even though Staff has limited expertise in this model, the following observations are offered and
need to be investigated further in the S-MAP. Staff believes the complexity of the model could
be an impediment in its effective use, unless parties, risk owners, SME’s and PG&E RAMP
personnel develop adequate levels of expertise and experience in its use. From the limited
amount of review performed the model appears to function properly and consistently produces
outputs that hinge on the subjective inputs provided by SMEs and risk owners.

Page | 113
2.15 EMPLOYEE SAFETY
SUMMARY
PG&E describes this risk as “the failure to identify and mitigate occupational exposures that may
result in an employee injury or illness that is fatal, life threatening or life altering.”54
PG&E has
approximately 24,000 employees, and identifies seven key drivers for Employee Safety events:
1. Overexertion
2. Contact with Objects and Equipment
3. Falls/Slips
4. Exposure to Harmful Substances or Environments
5. Violence and Other Injuries by Persons or Animal
6. Fire and Explosions
7. All other events
The driver categories are based off the Bureau of Labor Statistics (BLS) “Occupational Injury
and Illness Classification Manual. For example, Overexertion and Bodily Reaction is a risk
driver with a frequency of 379 injuries per year, based on PG&E OSHA Log Incidents from
2006 to through March 2017. PG&E adequately describes the risk driver, which “includes
bending, climbing, crawling, bodily reaction and exertion, overexertion in holding and carrying,
overexertion in lifting/lowering, overexertion in pulling or pushing, repetitive placing, grasping,
repetitive use of tools, typing or key entry.”55
PG&E also describes the risk event for each driver
and the consequences. For this driver, the risk event is the “failure to identify and mitigate
occupational exposures that results in an employee OSHA recordable injury/illness” and the
consequences are safety-injuries and financial.56
Chapter Statistics Summary:
MARS Expected Value Score: 203.56
MARS Expected Value Proposed Plan Overall Average Risk Score Reduction: 0.17
MARS Expected Value Rank: 2
MARS Tail Average Score: 263.01
MARS Tail Average Proposed Plan Overall Average Risk Score Reduction: 0.186
MARS Tail Average Rank:
4
54
15-2 55
15-4 56
15-3

Page | 114
2016 Baseline Controls:
2016 recorded control expense costs (000): $40,609
2016 recorded capital control costs: $0
2017-2019:
Current mitigation plan expenses (average) (000): $18,778
Current mitigation plan capital costs (average) (000): $10,000
2020-2022:
Proposed mitigation plan expenses (average) (000): $950 – $1,050
Proposed mitigation plan57
capital costs (average) (000): $0
PG&E’s tail average impact modeling results are as follows: ~703 injuries per year, ~2 fatalities
per year, and a financial impact of ~$9,766,683.58 PG&E quantifies the financial impact using
2016 workers compensation claims data with estimated costs assigned to each claim.
There are currently six controls in place. Some are discretionary while others are in place to meet
Cal/OSHA and OSHA requirements. An example of a discretionary control is PG&E’s
Corrective Action Program (CAP). The CAP is a program that allows employees to identify and
document hazardous or unhealthy conditions. CAP submissions are then assessed by a team, and
referred to a subject matter expert, and the resolution tracked.
The current mitigation plan includes 12 different mitigations.
PG&E states that it will use leading indicators for the employee safety metrics, including job
hazard analysis, employee and supervisor training, safety observations, program audits, and near-
hit reporting. They also currently use Serious Injury and Fatality (SIF) Corrective Actions
Completion, SIF Effectiveness of Corrective Actions, Number of Employee SIFs, Days Aware
Restricted Duty Rate, Lost Workday Case Rate, and OSHA Injury Rate.
STRENGTHS
PG&E does a very thorough job describing the drivers for this risk, and the drivers are clear. For
example, of the drivers is Overexertion and Bodily Reaction, which PG&E goes on to define as
“including bending, climbing, crawling, bodily reaction and exertion, overexertion in holding
and carrying, overexertion in lifting/lowering, overexertion in pulling or pushing, repetitive
placing, grasping, repetitive use of tools, typing or key entry.” PG&E provides similar
definitions for each of the other drivers. In addition, the driver is well-established, having been
drawn from the Bureau of Labor statistics. Using already established and defined drivers may
help us more easily benchmark PG&E’s employee injury improvements to other utilities.59
57
The proposed mitigation plan runs from 2017 to 2021. 58
15-6 59
PG&E elected to use national fatality data rather than its own data in order to evaluate a large sample size.

Page | 115
AREAS FOR IMPROVEMENT
PG&E includes only one mitigation for its proposed plan, which is the 5-year implementation of
a Safety Management System. According to PG&E, the “SMS establishes the guidelines
(minimum requirements) and sets a foundation to manage PG&E’s safety-related systems,
policies, and procedures and includes a process for continuous improvement to drive
performance and risk reduction (see Safety Culture chapter).
Moving to an SMS will help PG&E manage assets and processes to reduce the safety risks for all
stakeholders, foster continuous learning and continuous improvement, and help connect the
behavior of employees and contractors to the desired safety culture.”60
In its workpapers, PG&E goes on to state that “this mitigation reduces risk by providing an
organized methodology of accountability, assessment, and corrective actions for all Safety and
Health Programs”61
and that the mitigation affects all of the risk drivers.62
Although PG&E goes
into some detail about the effectiveness of other SMSs, and the elements of the SMS, there is
still something lacking.
It would really help if PG&E approached the description of this mitigation as a mitigation for
this risk, rather than giving a very high-level overview of a program that is rolling out company-
wide.
Because this mitigation is so high-level, it is difficult to understand how it would be
implemented. For example, one of the alternatives utilizes an IT solution, but it is not
immediately obvious that the chosen mitigation would not use an IT solution. We just don’t have
enough detail on the inner workings of this mitigation.
Although PG&E says that this mitigation will address all of the risk drivers for employee safety,
it’s very difficult to understand how this will happen in practice. For example, the first element
as described by PG&E – Leadership and Employee Participation – is as follows, “Leadership
begins with top management providing the direction for integrating health and safety into the
daily functions of the business. The SMS will also establish a process to ensure effective
participation by PG&E employees at all levels of the organization, including those working
closest to the hazards.”
PG&E has not actually described how this mitigation is addressing any of the risk drivers.
Similarly, the descriptions of the other elements of the SMS do not go over it either. PG&E
should provide the reader with a direct connection between the mitigation and the risk driver and
the risk.
60
15-11 61
WP 15-2 62
WP 15-3

Page | 116
RISK SPEND EFFICIENCY
Given that there is only one mitigation in this chapter, we can only compare the RSEs for the
alternatives. PG&E’s proposed mitigation plan has an RSE of 0.15 and an average cost ranging
from $950,000 – $1,050,000.
Alternative 1 slows down implementation of the SMS and has a lower RSE, but if you assume
the SMS is needed as PG&E says, it seems reasonable that faster implementation would be
warranted. Alternative 2 has the highest RSE and includes both a 5-year SMS and IT solution to
replace staff-based SMS implementation.
It costs an additional average cost of $30,000-$36,667 compared to PG&E’s proposed
mitigation. According to PG&E, they did not pick this alternative because of the increased cost
and a lower RSE. There is an increased cost, although it’s quite a bit less than even the difference
in the top and bottom range of PG&E’s proposed mitigation plan ($100,000), and it actually has
a higher RSE score, 0.21, than PG&E’s proposed mitigation plan. It is unclear why PG&E made
this statement and PG&E should provide some logical rationale supporting its decision.
CONCLUSION
PG&E should have spent more time developing this chapter. The description of the mitigation
does not clearly address how it will mitigate the risk drivers. Given that this seems to be an
important program to PG&E, its ability to explain the merits and benefits of this program are
paramount, and the ability of PG&E to implement this program successfully should be clearly
connected to the risk.
In addition, PG&E states that it did not choose one of the alternatives because of the lower RSE
and the increased cost. The explanation was cursory, and erroneously states that the RSE is
lower. Based on the Expected Value MARS score, Employee Safety ranks 2nd
on PG&E’s risk
register, and it deserves careful consideration by parties. PG&E should provide further details as
indicated in this review in its GRC filing to allow parties to more fully participate in the
evaluation of this risk and mitigations.
2.16 MOTOR VEHICLE SAFETY
SUMMARY
PG&E defines the Motor Vehicle Safety (MVS) Risk as the “failure to identify and mitigate
motor vehicle incident exposures that may result in serious injuries or fatalities for employees or
the public, property damage, and other consequences.” PG&E includes the following in scope:
operation of a registered vehicle requiring a driver’s license on company business; operation of
vehicles with a company logo at any time; motor vehicle incidents; and driving on road, public
streets, and highways.

Page | 117
The risk does not include off-road vehicles, off-road driving, motorized equipment, unique or
specialized vehicles, non-staff augmentation contractors, and other drivers.63
PG&E measures
the exposure of this risk by the number of miles driven. In 2017, PG&E has over 9,000 vehicles,
and employees drove approximately 151 million miles. 64
PG&E-owned vehicles make up 69 percent of the miles while employee-owned vehicles make
up 23 percent and rental vehicles make up the remaining 8 percent. Driving is one the highest
risk activities in many professions according to the Bureau of Labor Statistics.65
This risk was added to PG&E’s risk register in 2015, and in 2017 was moved to a top risk for the
Company.
PG&E describes three risk drivers for this risk, based on PG&E and national data:
Human error, such as distractions or speeding. Human error makes up 94% of incidents
based on PG&E’s evaluation of national data (2,121 events/year, or 1 event/71,200 miles).
Outside forces, such as roadway design or road conditions. Outside forces make up 4% of
incidents based on PG&E’s evaluation of national data (90 events/year, 1 event/1.7 million
miles).
Equipment, such as brake failures or flat tires. Equipment makes up 2% of incidents based on
PG&E’s evaluation of national data (45 events/year, or 1 event/3.4 million miles).
Chapter Statistics Summary:
MARS Expected Value Score: 114.76
MARS Expected Value Proposed Plan Overall Average Risk Score Reduction: 11.95
MARS Expected Value Rank: 4
MARS Tail Average Score: 214.30
MARS Tail Average Proposed Plan Overall Average Risk Score Reduction: 15.893
MARS Tail Average Rank: 8
2016 Baseline Controls:
2016 recorded control expense costs (000) $75466
2016 recorded capital control costs: $0
2017-2019 (000):
Current mitigation plan expenses (average) (000): $2,714
Current mitigation plan capital costs (average) (000): $976
63
16-1 64
16-4 65
16-2 66
Many control expenses are not listed and are embedded in existing resources or don’t reside in Corporate Safety,
so they are not reflected in this total.

Page | 118
2020-2022:
Proposed mitigation program expense costs (average) (000): $3,631
Proposed mitigation program capital costs (average) (000): $171
PG&E’s estimates 41.9 injuries per year and 4.58 fatalities a year based on the tail average
model worst case results based on PG&E data for injuries and national data for fatalities. It’s
important to note that PG&E only had one fatality related to motor vehicle incidents over the
2014-2016 timeframe, but PG&E chose to rely on national data due to the statistical limitations
of their data set. Specifically, there were too few fatality incidents to rely on PG&E data for the
modeling.67
The Trust tail average model worst case result is an average value of 9 percent change a year.68
They believe that if there are any fatalities there will be a high severity brand favorability change
and if there are injuries without fatalities there will be a 50/50 chance of low or severe brand
favorability change. The Financial impacts are based on incident logs, claims, settlements, and
repair records from 2012 through 2016. PG&E modeled claims using an 83 percent likelihood of
a claim based on data using 1,723 historical claims and 2,085 incidents. The result is a tail
average worst case scenario result of $56 million a year for the 2017-2022 time period.
According to the PG&E, the combination of mitigations proposed will reduce this TA risk by
7.4 percent.69
PG&E already has an astounding 17 controls in place for this risk, as well as an
additional 8 mitigations in place for the 2017 GRC. In this RAMP, PG&E proposes an additional
3 mitigations.
The controls and mitigations for the most part, are made up of driver training courses, drug
testing, and driver qualification verification. With so many it is difficult to determine how much
each program mitigates the risk drivers, and whether there are synergistic effects from one or
more of the programs working together. Therefore, it would be helpful to have a matrix that
showed what each control and mitigation was accomplishing, so we could more easily determine
whether some are redundant or could be combined.
PG&E currently tracks this risk using several metrics: The Preventable Motor Vehicle Incident
Rate, the Serious Preventable Motor Vehicle Incident Rate, the Driver’s Check Rate, the Hard
Brake Rate, the Hard Acceleration Rate, and the Maximum Speed Rate. For its proposed
mitigations, Vehicle Safety Technology in Personal Vehicles will initially track deployment of
the technology, and then overall and individual data such as hard brake rate as the metrics.
The Driver Selection Program and MVS Management system do not appear to have established
metrics. Given the vast number of programs in place to mitigate this particular risk, it’s unclear
how PG&E will determine whether one program is working more effectively than another, or if
PG&E even desires to track that measurement.
68
16-7 69
16-2

Page | 119
STRENGTHS
PG&E is able to draw from large set publicly available data to determine the percentage of each
type of driver to use in the model, and it clearly shows which risk driver causes the most
accidents. PG&E relies on the data from the US Department of Transportation and it looks at the
drivers for over 2 million crashes from 2005 to 2007. This data shows that 94% of crashes result
from driver error, a clear indication of where PG&E should be focusing its mitigation efforts.
The drivers are clearly described an easy to understand. Although they do not match directly
with the Department of Transportation descriptions of each driver, they are written in an easier to
understand manner.
AREAS FOR IMPROVEMENT
The definition of the risk should be more transparent. The risk is “failure to identify and mitigate
motor vehicle incident exposures that may result in serious injuries or fatalities for employees or
the public, property damage, and other consequences,” but that really doesn’t mean anything
unless a vehicle incident is defined. A vehicle incident could really mean any number of things.
The reader has to open a document referred in a footnote to determine that an incident is actually
a car crash. PG&E could easily increase understanding of this chapter by changing incident to
crash or accident or at least defining vehicle incident clearly early on, so there’s no mystery.
Assuming Human Error causes 94% of car crashes, it makes sense to focus on this driver. The
US Department of Transportation Document that PG&E cites70
includes a breakdown of the sub-
drivers of this risk:
Recognition error (driver inattention, internal/external distractions, inadequate
surveillance): 41%
Decision error (driving too fast for conditions/curve, illegal maneuver, misjudgment of
gap or other’s speed, false assumption of other’s actions): 33%
Performance error (overcompensation, poor directional control): 11%
Non-Performance error (sleep is the most common reason): 7%
Other: 8%
Knowing these sub-drivers allows parties to better evaluate the prioritization of mitigations and
spending for this risk. It would be up to PG&E to verify whether these sub-drivers are applicable
to their own operations, but if PG&E is relying on this national data, it seems likely that they
would.
PG&E should also track and include the contractor motor vehicle accident information within
this risk or create a sub-chapter for contractor MVS since it was separated and excluded from the
Contractor Safety chapter and could be a significant driver of contractor injuries and fatalities.
Some of PG&E’s mitigations could impact the training and performance of contractors, but
without being analyzed as part of the MARS and RSE they cannot be evaluated holistically.
70
https://crashstats.nhtsa.dot.gov/Api/Public/ViewPublication/812115.

Page | 120
PG&E should provide alternatives that are feasible today. For the first alternative, PG&E
describes two new mitigations. The first is Emerging Incident Reduction Technology and the
second is Emerging Impact Reduction Technology.
PG&E estimates a cost and RSE for these mitigations, but these technologies don’t exist yet. If
these technologies do not exist today, we do not believe they can be considered as part of a valid
alternative mitigation plan. That being said, we don’t mean to say that PG&E can’t consider
these technologies at all but describing an alternative that is actually infeasible in its entirety is
not in the spirit of the complying with the decision.
PG&E states that if the technologies get better, PG&E might adopt them. It’s unclear whether
PG&E wants these to be alternatives or possible future mitigations. They likely belong in the
next steps section. It’s our position that these are not valid as alternative mitigations.
Alternative Plan 2 involves the same mitigations except not implementing the Process
Improvement mitigation. PG&E states that another existing mitigation, the Safety Management
System (SMS) may be able to handle some of the functions of the MVS Process Improvement
mitigation, but that it would require increasing the resources for the Employee SMS. If this
alternative is really doing the same thing, but calling it something different, then it doesn’t really
seem like much of an alternative either. PG&E should spend some time thinking about valid
alternatives for this risk.
RISK SPEND EFFICIENCY
The Deploy Vehicle Safety Technology (VST) in Personal Vehicles mitigation scores very low
in terms of Tail Average RSE compared to the other mitigations (6.5 for Personal Vehicles VST
vs. 277.8 for Driver’s Selection Program and 118.7 for MVS Management System). The capital
cost averages from $162,333 -$179,667 and the expense costs average $654,000 – $723,333. The
low VST RSE score is the result of lower mileage exposure coupled with high relative costs.
Also, there is not enough information in the chapter describing the nuts and bolts of the VST
mitigation, so it’s very difficult to understand what exactly is driving the costs. It is not clear
how broadly PG&E plans to deploy this technology. If only 23 percent of miles driven are in
personal vehicles, it seems likely that only a small subset of PG&E employees actually utilizes
their personal vehicles for work, and that this mitigation would only need to be implemented for
that smaller subset. Still, there may be only a few employees who drive regularly for work.
Unanswered questions arise such as: Whether the RSE would be higher if PG&E targeted VST
to the employees who drive the majority of miles in their personal vehicles. It makes sense for
PG&E to provide these details to the reader, so we understand their thought process. We need to
understand whether they are implementing this mitigation in a way that makes the most sense.
PG&E attributes a 25% reduction in incidents attributable to human factors to the Driver
Selection mitigation, and the VST mitigation, but the VST mitigation applies to a much smaller
portion of the mileage. This information could be misleading because 25% on significantly fewer

Page | 121
miles has a significantly reduced impact. This is not clearly stated in the workpapers but can be
found in the model.
The Driver Selection Program averages $25,667 - $28,333 in expense costs and has no capital
costs. The goal of the program is to “create a holistic assessment of individual driver risk.” For
these RSE scores, PG&E cites a CNA Driver Performance article, a Davis Consulting Report,
and SME judgment. It is not clear whether data supports the risk reduction for these mitigations,
especially with the wealth of risk driver and sub-driver data available, this would have been a
great opportunity for PG&E to share the data or explain the reasoning behind its asserted risk
reduction.
We would like to see more effort put it to explaining how the risk reduction numbers were put
together, even if they are at an early stage. The goal here is transparency, and without
understanding PG&E’s thought process, it is difficult to understand how much weight to assign
the RSE differences.
CONCLUSION
The data in this chapter is very compelling, but PG&E should ensure that it’s risks are easy to
understand on their own without inordinate research into footnotes. In addition, PG&E should
really take some time to develop reasonable, feasible alternatives. Although the alternatives may
not be PG&E’s preferred choice, they should represent a course of action that is possible and
with merits worth consideration in regards to risk mitigation. As stated elsewhere in this report,
more detail is needed in certain sections for the reader to understand PG&E’s proposal to better
evaluate the benefits and costs of its proposal.
2.17 LACK OF FITNESS FOR DUTY PROGRAM AWARENESS
SUMMARY
PG&E defines the Lack of Fitness for Duty Program (FFD Program) Awareness Risk as
“PG&E’s people leaders failing to identify and act upon observed behaviors which indicate an
employee may be unable to work safely.”71
Often PG&E employees are working in hazardous
situations, and if they aren’t able to perform their jobs in a safe manner they could injure
themselves or others.
Chapter Statistics Summary:
MARS Expected Value Score: 11.82
MARS Expected Value Proposed Plan Overall Average Risk Score Reduction: 1.03
MARS Expected Value Rank: 12
71
17-1

Page | 122
MARS Tail Average Score: 50.43
MARS Tail Average Proposed Plan Overall Average Risk Score Reduction: 1.553
MARS Tail Average Rank: 13
2016 Baseline Controls:
2016 recorded control expense costs (000) $8672
2016 recorded capital control costs: $0
2017-2019:
Current mitigation plan expenses (average) (000): $357
Current mitigation plan capital costs (average) (000): $337
2020-2022:
Proposed mitigation program expense costs (average) (000): $4,707
Proposed mitigation program73
capital costs (average) (000): $10074
There is only one driver for this risk, which is Fitness for Duty events with an adverse outcome.
PG&E divides this into two “sub-drivers” which are Supervisor Effectiveness and Undetected
Behaviors. Typically, a driver of a risk would be a cause of a risk, but in this case, Supervisor
Effectiveness is not actually a cause of the risk. Based on PG&E’s description, this is actually a
description for when supervisors observe FFD events and take action. It would make more sense
to describe the sub-driver as Supervisor-ineffectiveness. Despite the description of the sub-
driver, it appears that the numbers used in the model make sense, meaning that PG&E used the
number of events when supervisors were not recognizing FFD events.
Although this risk was placed on the risk register in 2015, PG&E brought on a consultant in 2012
to evaluate its Employee Assistance Program, and the FFD Program has been under various
stages of evaluation and change ever since. The model indicates that training has the greatest
impact on reducing this risk, but currently the model uses SME judgement as well as PG&E data.
PG&E states that it placed more emphasis on data quantification in 2017.
PG&E’s tail average impact results, are all based off of SME judgment as follows:
5.03 injuries per year;
1.17 fatalities per year;
Reliability impacts of 12.8 hours per year;
Compliance impacts of $427,741;
0.87% change in brand favorability per year; and
Financial impacts of $21,402,624.
72
The largest contributor to this amount is the $75,656,000 from Employee Benefits Plans and Policy. 73
All of the proposed mitigations run from 2017 to 2022. 74
Some of the expense costs are embedded in other programs.

Page | 123
Although PG&E defines the risk as Lack of Fitness for Duty Awareness, many of the controls
and mitigations appear to address actual Fitness for Duty instead. PG&E currently has three
controls in place for this risk. Controls include several trainings, employee wellness, and benefits
plans and policy. Many of these controls cited by PG&E were not put into place for the FFD
program directly, such as employee drug and alcohol testing requirements.
PG&E has three ongoing mitigations in place: amending the benefits plan (including long-term
disability, stay at work, return to work, and leaves of absence), tracking and measuring FFD
training, and redesigning time off policy for management and union employees.
PG&E’s current mitigation plan (2017-2019) includes three additional mitigations directly
related to the risk which include: FFD trained field safety specialist observations, enhanced FFD
metrics, and FFD data sources review. According to PG&E, the enhanced FFD metrics should
improve its ability to measure improvements due to changes in the FFD program.
The proposed mitigation plan includes four additional mitigations: Knowledge – mandatory
training, Process Improvements – redesigned time off policy and voluntary plan, Tools and
Technology – Kiosks, and Tools and Technology Clinics.
PG&E presents two alternatives to the proposed mitigation plan. The two alternatives proposed
include similar risk reduction numbers as compared to PG&E’s proposed mitigation plan.
PG&E will track the risk utilizing two metrics:
The percent of referrals to the FFD program deemed proper FFD situations and
separately those reported late (more than 6 months after the observed behavior).
Percentage of full-time employees unavailable for work either due to long-term or short-
term health reasons.75
STRENGTHS
The Fitness for Duty Risk is difficult to estimate. Fitness for Duty encompasses not just whether
an employee is under the influence of drugs and alcohol, but whether they are physically and
psychologically prepared to do the work at hand. It is very difficult to try to model something
like this because complete data is not readily available on employees who have been unfit for
duty historically.
To the extent possible, PG&E has made a reasonable attempt to model this risk given the
limitations.
AREAS FOR IMPROVEMENT
The mitigations do not address the risk. The way PG&E scopes this risk is very specific. The risk
is not whether an employee is unfit for duty, but whether PG&E’s people leaders fail to act on
certain behaviors that indicate the employee is unfit for duty.
75
17-15

Page | 124
Based on PG&E’s description of the scope of the risk, some of the mitigations it describes do not
address the risk. For example, the third and fourth mitigations (M10, M11) involve providing
employees with telemedicine kiosks and on-site clinics so that employees have immediate access
to healthcare, which appear to address mitigating an unfit employee who is already at work.
PG&E structures the risk into two sub drivers: Supervisor Effectiveness and Undetected
Behaviors. According to PGE’s workpapers, these mitigations reduce the likelihood of an
undetected fitness for duty situation. The kiosks and on-site clinics “contribute to risk reduction
by providing employees with easy access to medical care or advice, which contributes to the
overall fitness of the workforce.”76
The fitness of the workforce is not the stated risk.
Mitigations should be preparing PG&E’s people leaders to identify behaviors or improving their
ability to act on those behaviors. There appears to be an issue either with explaining the value of
this mitigation clearly or with the scope of the risk itself. The sentence states that the mitigation
contributes to the overall fitness of the workforce, but the risk drivers are defined as supervisors
not detecting behaviors, or behaviors being undetected completely.
PG&E should provide more specifics on how this mitigation is supporting reducing undetected
behaviors. If an employee uses the kiosk, will it notify their supervisor that they shouldn’t return
to work? It’s unclear how this mitigation is addressing this risk. One of the metrics PG&E will
use to track the risk is “percentage of full-time employees unavailable for work either due to
long-term or short-term health reasons.”
PG&E states that “a healthier employee population helps reduce the occurrence of FFD
situations supervisors would need to detect.” While true, this does not address the awareness risk
it addresses whether the employee is fit for duty.
Similarly, M9, Process Improvements, Redesigned Time-off Policy and Voluntary Plan also
seems to address employee health and general wellbeing that contributes to better work
performance and productivity, which is tangentially related to fitness for duty rather than the
stated risk of FFD awareness. This mitigation does not address the stated risk based on the way
PG&E scoped this risk.
These same mitigations are not explained well enough for Staff to determine what they are
doing. There is not enough information about the telemedicine kiosks and on-site clinics
programs to really understand how they would work.
Similarly, the Benefits Plans and Policy controls are not explained well. They cost $75,565,000
in 2016, which makes up the majority of the controls cost. PG&E states that the “Benefits Plans
and Policy controls act to improve employee access to benefit plan information and provide a
one stop shop for help in choosing which benefit suits their needs such that the employees can
readily address medical concerns in order to stay FFD. Some of the controls ensure proper
administration of benefits which ensures proper and prompt delivery of benefits.”
76
WP 17-8

Page | 125
PG&E does not fully explain one of its alternative mitigation plans. The first alternative
mitigation plan includes training on FFD awareness for new leaders and removal of telemedicine
kiosks. According to PG&E, this appears to be a more effective plan, but it is currently
restructuring its New Leader Curriculum, so PG&E did not choose this plan. PG&E does not
explain why it would be impossible to do this training even though the New Leader Curriculum
is being restructured.
PG&E has not provided an explanation stating why the benefits of excluding this training
outweigh the lost benefits of excluding it. There may be a reason why this makes sense, but
PG&E does not provide it. If it’s merely administrative, this does not seem like a good reason to
forgo the safety benefits of the training. It’s not clear what restructuring mean, does that mean all
safety trainings are cancelled for new employees until PG&E figures out its curriculum? PG&E
should provide more explanation.
PG&E does not include a control that seems appropriate to this section. In the Motor Vehicle
Safety chapter, PG&E describes a Reasonable Suspicion Supervisor Training control. This
training qualifies “supervisors to recognize the warning signs of alcohol abuse or drug use; to
know how to handle the substance abusing employee; and to follow proper procedures for
reasonable suspicion drug and/or alcohol testing, documentation and reporting as required by
current federal regulations and Company policy.”
This control seems like an obvious fit for this risk, and it is unclear why it was omitted.
RISK SPEND EFFICIENCY
There are four mitigations in this chapter that PG&E proposes in its preferred mitigation plan.
They all have tail average RSEs ranging from 0.04 to 6.4. The one mitigation PG&E did not
choose was FFD training for new leaders taught by the FFD program manager. This mitigation
has a tail average RSE of 48.88, which is a much higher RSE than the other mitigations. This
training costs significantly less than the other mitigations. As stated previously, PG&E has not
explained in any detail why this training is infeasible.
CONCLUSION
PG&E needs to go back to the drawing board with this chapter. PG&E could consider scoping
this risk as a Fitness for Duty risk rather than a Lack of Fitness for Duty Awareness risk, given
that the mitigations in place and the proposed mitigations appear to address employee health and
wellbeing as foundational to Fitness for Duty rather than Fitness for Duty awareness. Fully
evaluating this chapter was not possible given the scoping confusion.
PG&E should also provide a better explanation for mitigations that were rejected, especially ones
with a particularly high RSE and where there appears to be no feasibility issues with the
mitigation. In addition, for more complicated mitigation programs, such as on-site clinics and
telemedicine kiosks, PG&E needs to provide enough details for parties to understand at least the
basics of mitigation implementation and how they tie to the risk.

Page | 126
2.18 CYBER ATTACK
SUMMARY
PG&E describes a cyber-attack as an event that results in a loss of operational control or loss of
company data. Scoring of this risk leans more toward Reliability impacts and Financial
consequences than to Safety impacts, but the overall risk impacts have qualified this for
inclusion in RAMP under PG&E’s current methodology.
The RAMP testimony offers somewhat vague descriptions of the utility cyber defense program,
casting it in terms of “goals” and visions” rather than specifics. The only benchmark appears to
be adherence to the National Institute of Standards & technology (NIST) framework (which is
currently under revision).
The utility claims that its analysis has “confirmed” the direction of its controls and mitigations,
but there is little evidence offered. The NIST framework is a generalized approach that
categorizes activities into four buckets: Identify, Protect, Detect, and Respond.
The analysis is hampered by a lack of publicly available quantified data. PG&E reported
“Cyber-attacks among all utilities have increased from a confirmed total of three (3) in 2012, to
66 in 2015, the last year for which figures are publicly available.” Such statistics are difficult to
reconcile, given that “attacks” are not defined.
It is known that utility networks are almost constantly bombarded with various types of attempts
– ranging from malware incorporated in emails or documents, to outright hacking – but actual
penetrations are rarely reported. Making this more difficult is the fact that penetrations may have
occurred, but the malware is lying dormant for a period of time before activating. One thing is
known however, “Intelligence indicates cyber-attacks have also become more ingenious and
complex.”
Energy companies and utilities in particular, are extremely reluctant to provide public
information about system vulnerabilities or defenses being put into place. Even at the federal
level, where Critical Infrastructure Protocols (CIP) for cyber security have been in place for over
a decade, utilities are resisting potential regulations from the Federal Energy Regulatory
Commission to report events and incidents in greater detail.
Although, to date, there have been no known instances where a malicious cyber event has
resulted in utility operational disruptions or power outages, there have been recent news reports
about breaches in data security that lead to a $2.7 million settlement between reliability operators
and an un-named utility, as well as a brief power disruption in Michigan caused by an employee
exceeding access authority.
When significant events do occur, they are considered significant news events, such as the
alleged Russian attacks on the Ukrainian national electric utility in 2016 and 2017.

Page | 127
PG&E does provide expenditures related to each, under its current program (2016; $13.6 million
O&M and $25.4 million Capital). But again, these activities are described in only the most
general of terms in the testimony, although somewhat more fleshed out explanations of
mitigation programs are available in work papers.
Chapter Statistics Summary:
MARS-EV-Overall Average-Total: 10.77
MARS-EV-Proposed Plan-Overall Average-Risk Score Reduction: - 0 -
MARS-EV-Overall Average-Total-RANK: 13
MARS-TA-Overall Average-Total: 107.75
MARS-TA-Proposed Plan-Risk Score Reduction (all years): - 0 -
MARS-TA-Overall Average-Total-RANK: 11
RSE Units of Risk Reduced Per Million Dollars:
MARS-EV-Proposed Plan-Total RSE (Units/$M) - 0 -
MARS-TA-Proposed Plan-Total RSE (Units/$M) - 0 -
2016 Baseline Controls:
Recorded control expense costs (000): $22,151
Recorded capital control costs (000): $0
2017-2019:
Current mitigation plan expenses (average) (000): $ 6,869
Current mitigation plan capital costs (average (000): $24,043
2020-2022:
Proposed mitigation plan expenses (average) (000): $ 8,874
Proposed mitigation plan capital costs (average) (000): $24,587
STRENGTHS
The use of the bow-tie helped illuminate the concept of sub-events used to calculate potential
frequency of adverse events. Recognizing the lack of utility specific data, PG&E turned to
communications network data from Verizon and other industry data from Adivsen to supplement
its own Subject Matter Experts.
Such data would indicate loss of customer data breaches, although still rare, can be anticipated
far more frequently than “intrusions” that lead to loss of operational control.
The utility description of “points of potential intrusion” is useful for a non-technical reviewer,
although they might seem rudimentary to a cyber professional, describing such vulnerabilities as
computing systems that are owned by third parties, operating “untrusted” networks, or simply
not being well maintained. And while “malicious actors” (insider threat) are a constant threat, in

Page | 128
reality, it is well understood that employees and/or contractors not engaging in good security
practices remains a most serious system vulnerability – for any kind of company or enterprise.
AREAS FOR IMPROVEMENT
Development of usable energy utility statistics is a goal, although providing for public access to
such data will likely remain a challenge for the foreseeable future.
Risk Score
A total MARS score of 107.75 indicates that this as a lower-tier risk, although potential impacts
somewhat high for Reliability under the operational events and Economic Consequences, for
operational and data incursions.
Mitigation Plan
The mitigation strategies (they would not rate being called projects or programs) are not much
different from those employed in the past controls, although it seems that those devoted to the
“Protect” aspect seem more detailed with some timelines described. The proposed plan entails
roughly the same amount of Capital spending over the next three years ($22.8 million in 2017
rising to $25.1 million in 2019, but only about half the 2016 expenditures for Expense, about $6
million in 2017 to $7.3 million in 2019).
The proposed mitigation plan for 2020-2022 is really not much different, with a slightly
diminishing capital investment (from $26 million to 23.3 million per year), and somewhat higher
Expense budgets, rising from $6.5 million in 2020 to $10.7 million projected for 2022.
Mitigation strategies align with the four pillars of activity: Identify, Protect, Detect and
Respond), and are generally described. Of interest are mitigations strategies based on employing
common standards and practices throughout the company, documenting system users and assets.
Increasing the visibility of the system through evolving technologies, even from Smart Grid
architecture is also a goal, and enhanced cyber reporting is expected to allow operators to spend
more time responding to high-impact incidents, rather than routine administrative tasks.
Among the more technical programs described by PG&E is to complete Bridge ODN (Corporate
network) improvements to reduce risks identified in an Integrated Planning attack failure
scenario to acceptable levels. Basically, this would limit potential impacts to customers should
the Electric Transmission & Distribution network is compromised.
Similarly, PG&E cites completion of its Gas SCADA network protection plan to reduce the risk
of unauthorized access to operational data.
Alternative Mitigation Plans
PG&E admits that each alternative plan “is a more of or less than approach” using the same
bundle of strategies, in a relatively small range of projected cost differences. Roughly $24
million - $28 million annually for Capital and $7 million to $10 million for Expense.

Page | 129
Generally, for increased spending plans, PG&E determined that “resulting risk reductions would
be minimal compared to the investment required” while for the lower expenditures could either
increase the impact of a cyber-attack event, or “relinquish an opportunity to substantially reduce
cyber-attack risk.”
However, PG&E did not provide any attempt at scoring potential changes to risks from its
options.
CONCLUSION
Detailed analysis of the Cyber Attack risk is difficult because of a reluctance by companies in
critical industries to reveal vulnerabilities, and a lack of overarching industry standards beyond
NIST framework and the compliance with the federal CIPs program. We know there is a lot
going on inside the company and expect that the growing threats to cyber security are taken
seriously, based on the level of public concern expressed. However, understanding exactly what
the utility is doing to mitigate risks is a challenge for policy-oriented agencies.
2.19 INSIDER THREAT
SUMMARY
The “insider threat risk is the potential for employees or non-employee workers (NEWs) with
current or previously authorized access to PG&E’s assets to use their access and knowledge with
intent to negatively affect PG&E or its customers.”77
Staff observes that PG&E takes this issue
very seriously to the extent that it has elevated this to an enterprise level risk. Staff agrees that
insider threats that result in sabotage/vandalism, and violence against employees and NEWs are
serious and deserve a high level of attention.
That being said, there are two main issues with this RAMP chapter. First, throughout the chapter
PG&E makes the case that insider threat is a cross-cutting risk, yet treats it as a stand-alone risk.
Second, both of the insider threat issues appear to be risk drivers and, in Staff’s opinion, should
be grouped with the drivers of their associated stand-alone risks.
The obvious choice for insider threat of sabotage/vandalism against property and systems that do
not include intentional violence against employees and NEWs would be physical security and
cybersecurity. It appears the insider threat of violence against employees and NEWs, would be
shared in some proportion within mitigations for physical security, employee safety, contractor
safety and lack of fitness for duty program awareness risks.78
77
19-1 78
The Active Shooter being the only driver associated with injuries and fatalities within this risk chapter.

Page | 130
Staff’s concern is that this risk duplicates the safety risks from the respective stand-alone risks,
and if the attribution of employee and contractor safety injuries are being doubled up here, then
would this risk would meet the standard for inclusion in the RAMP.
The insider threat risk is purposely limited to a very small subset of conditions, where an insider
with access and knowledge acts with malicious intent. This chapter excludes all external drivers,
even though there would be a natural overlap in mitigations designed for the related stand-alone
risks, E.G. situational awareness, response training, and event severity mitigation.
PG&E makes a good case that the physical harm from active shooters is remote, and must seek
national statistics to make the worst-case scenario for this risk, which has a TA worst-case
outcome of 1/10 of a fatality/year or one every 10 years. The FBI finds three (3) fatalities on
average per incident which would mean that PG&E expects worst-case, one active shooter
incident in 30 years.79
The frequency for injuries is a bit murkier, and not explained well in the chapter or in the model.
Staff understands that the method combines both national active shooter and resident injuries
statistics in calculating the TA outcome in natural units of 4.44 injuries per year.80
However,
PG&E applies a national injury factor to the non-active shooter injuries and it would seem that
PG&E should have enough internal data in its employee and NEWs injuries to develop its own
frequency for this narrowly defined insider risk, which then could be used to determine the TA
value.
Providing a RSE for this risk appears to present a challenge for PG&E because it was not able
calculate a RSE with the model. It is not clear why there is no attempt at devising estimates of
risk reduction since in just about every other risk PG&E’s experts manage to come up with an
estimate of risk reduction. Because the SMEs cannot easily estimate proportional impact on risk
then this becomes another argument for subsuming these drivers within their respective stand-
alone risk.
There are no new mitigations proposed, only the carry-forward of the existing mitigation (M5)
thru 2020-2022 with no projected change in the average annual expenses of $650,000 and capital
of $1.1 million. The Multi-Attribute Risk Score (MARS) leans more toward Reliability, Trust
and Financial consequences than to Safety impacts.
The RAMP testimony offers somewhat vague descriptions of the utility insider threat programs,
casting it in terms of “holistic” and “proactive engagement” rather than specifics. There is
significant overlap in the testimony with the cyber security chapter on related matters.
The framework is a generalized approach that categorizes activities into four buckets: Identify
Protect, Detect, and Respond.
79
https://www.fbi.gov/about/partnerships/office-of-partner-engagement/active-shooter-incidents-graphics. (661 fatalities/220 incidents from 2000-2016.) 80
19-9.

Page | 131
Chapter Statistics Summary:
MARS-EV-Overall Average-Total: 84.59
MARS-EV-Proposed Plan-Overall Average-Risk Score Reduction: - 0 -
MARS-EV-Overall Average-Total-RANK: 7
MARS-TA-Overall Average-Total: 233.79
MARS-TA-Proposed Plan-Risk Score Reduction (all years): - 0 -
MARS-TA-Overall Average-Total-RANK: 6
RSE Units of Risk Reduced Per Million Dollars:
MARS-EV-Proposed Plan-Total RSE (Units/$M) - 0 -
MARS-TA-Proposed Plan-Total RSE (Units/$M) - 0 -
2016 Baseline Controls:
Recorded control expense costs: $0
Recorded capital control costs: $0
2017-2019 (000):
Current mitigation plan expenses (average) (000): $1.217
Current mitigation plan capital costs (average) (000): $1,100
2017-2019 (000):
Proposed mitigation plan expense (average): $0
Proposed mitigation plan capital costs (average): $0
2020-2022:
Proposed mitigation plan expenses (average) (000): $ 650
Proposed mitigation plan capital costs (average) (000): $1,100
Strengths
PG&E does a good job providing third party data links, which supports the insider shooter
threat.
Areas for Improvement
The primary focus is on the overall risk impacts and PG&E does not make a clear case how the
safety implications qualified this for inclusion in RAMP under PG&E’s current methodology.
It appears insider threats are comprised of subsets of a multitude of stand-alone risk drivers.
The primary stand-alone cyber security risk is a natural and intuitive place where insider threats
towards cyber systems would reside and would likely be a risk driver that cybersecurity risk
mitigations would act upon. Other stand-alone risks that should absorb these risk drivers include
(but may not be limited to) employee safety, contractor safety, physical security and lack of
fitness for duty awareness.

Page | 132
The mitigation proposed (Internal Threat Intelligence, Data, and Analytics Strategy) defined in a
cursory manner and does not indicate how it will specifically impact the identified risk drivers.
If the mitigation is designed properly to reduce risk there should be a means to measure the risk
reduction impact and show a clear linkage to the risk drivers. Based on the cryptic description
the mitigation is basically enhance and create cyber platforms for gathering data on employees
and NEWs and developing ways to monitor activities.
PG&E claims that this is a cross-cutting, cross-functional risk yet conforms this risk to the stand-
alone risk model. Staff agrees that PG&E continues to classify this risk as a top safety risk then it
should conform this risk to the cross-cutting model as suggested in the RIM chapter.
The cyber security focus on this risk includes a vaguely worded mitigation plan that invests in
threat intelligence, data and analytics capabilities. The mitigations are supposed to provide
advance detection of anomalies that wouldn’t be detected using traditional security measures.
It is not clear what traditional measures are considered, or how they would be able to detect the
types of malicious insider threats that have the tactical advantage as explained by DHS:81
Who can operate relatively unfettered;
Aware of an organization’s vulnerabilities; and
May have purposefully created the very vulnerabilities they intend to exploit.
There needs to be better descriptions of the range of risk drivers. E.G. there are degrees of theft,
fraud, vandalism and sabotage. PG&E has not done a good job of providing the context for the
review to understand whether it is concerned about pencil theft by employees, or whether an
employee or NEWs made off with a caterpillar tractor.
PG&E needs to clarify whether the safety metrics used in this RAMP risk have been duplicated
in all other stand-alone risks to ensure that duplication of safety risks does not inproperly inflate
the safety risk used for inclusion in the RAMP.
Risk Score
A total MARS score of 233 indicates that this as a higher -tier risk, with potential impacts
significantly high for Reliability, Trust and Financial consequences. The reliability risk is based
sabotage of substation which results in a TA of 54 million lost customer minutes.
It would seem that there are significant other potential reliability outcomes due to cyber
sabotage that might even have more significant reliability impacts. Trust is conflated with
injuries and fatalities, yet Staff thinks that an insider incident would have significantly less
impact on overall Trust in the company “brand” because these kinds of events are often seen as
something outside the control of the company. The financial risk estimates seem reasonable.
The absence of an RSE is problematic as noted above.
81
DHS – “National Risk Estimate: Risks to U.S. Critical Infrastructure from Insider Threat.” at ii.

Page | 133
Mitigation Plan
The mitigation strategy continues one program approved in the 2017 GRC and it appears it will
mainly be an information gathering and monitoring tool.
Alternative mitigation plans
The alternative mitigations offered and rejected primarily focused on physical security and
appeared somewhat draconian. Alternative 1 included enhanced threat detection, armed guards,
personal article and vehicle inspections, and dual factor authentication. These would all run into
the tens of millions of dollars. Based on the risk frequency and the probability of success given
these would be to try to detect and prevent individuals with inside access, knowledge and the
intent to wreak havoc, that they would like act as a deterrent and measuring the actual risk
reduction extremely hard to determine.
Alternative 2 focused two other measures - ballistic protections and safe rooms. It would seem
that putting bullet proof glass on company vehicles is and extreme response given current
conditions. It is not clear how PG&E would deploy safe rooms and to what extent. Both these
seem a bit extreme for the risk and based on cost. Because no RSE has been calculated it is
doubly difficult to ascertain the relative worth of these mitigations.
CONCLUSION
Staff are concerned that the risk has been ill defined and more likely the risk drivers should be
subsumed in their respective stand-alone risk chapters and tied to the risk mitigations therein, if
appropriate.
Even though PG&E makes a good case that this is a cross-cutting risk and yet decided to
evaluate this using their stand-alone risk model. Because Staff expressed concerns with the
cross-cutting model as discussed in the RIM chapter this risk should re-evaluated as a safety risk
and the cross-cutting model reviewed within S-MAP.
2.20 RECORDS AND INFORMATION MANAGEMENT (RIM)
SUMMARY
The Records and Information Management (RIM) risk is characterized by ineffective records
and information management systems that “may result in the failure to construct, operate and
maintain a safe system and lead to property damage and/or loss of life.” The San Bruno gas
pipeline explosion and resulting civil and regulatory sanctions was cited as an example of
extreme outcome that highlights the importance record keeping and information management for
PG&E.

Page | 134
The main concern after San Bruno that drove the ERIM appears to be that “(t)he inability to find
records and information in a timely manner undermined the public’s trust in PG&E as a safe
pipeline operator.”82
While such a description might indicate this risk would have greater
impacts for Compliance, Trust and Financial attributes of consequence, the analysis shows a
quantified Safety risk as expressed in potential serious injuries and/or fatalities.
However, because the RIM risk is a precursor risk, and in some cases a follow-on risk to a safety
event, Staff is not convinced that RIM risk rises to the level of a significant safety risk.
The RIM risk has a total Tail Average (TA) MARS of 19.81 which ranks it 17th
out of 22 risks,
and its Risk Spend Efficiency (RSE) is 0.1134 which means that for $1 million dollars in
mitigation spending PG&E expects a 0.6% reduction in the MARS risk score. The safety risk
score in TA natural units is 9.55 injuries per year and 0.08 fatalities per year (one in 12.5 years).
The safety risk has been duplicated because these injuries and fatalities should be included in the
stand-alone RAMP risks associated with each sub-driver along with the mitigations designed to
reduce the safety risks therein.
The safety component of the RIM risk duplicates the safety risk already embedded in the
associated stand-alone risks and would have been part of the P95 and RET safety consequence
evaluation used to rank PG&E’s top safety risks.
Chapter Statistics Summary:
MARS-EV-Overall Average-Total: 13.45
MARS-EV-Proposed Plan-Overall Average-Risk Score Reduction: 0.80
MARS-EV-Overall Average-Total-RANK: 11
MARS-TA-Overall Average-Total: 19.81
MARS-TA-Proposed Plan-Risk Score Reduction (all years): 8.36
MARS-TA-Overall Average-Total-RANK: 17
RSE Units of Risk Reduced Per Million Dollars:
MARS-EV-Proposed Plan-Total RSE (Units/$M) 0.0653
MARS-TA-Proposed Plan-Total RSE (Units/$M) 0.1134
2016 Baseline Controls:
Recorded control expense costs (000): $1,975
Recorded capital control costs: $0
2017-2019:Current mitigation plan expenses (average) (000): $26,972
Current mitigation plan capital costs (average) (000): $7,491
2020-2022:
Proposed mitigation plan expenses (average) (000): $7,038
82
20-1.

Page | 135
Proposed mitigation plan capital costs (average) (000): $4,167
PG&E developed the RIM Risk model to try to aggregate the potential contribution of RIM risk
events from, in this case, 12 stand-alone RAMP risks. They note that that this RIM safety risk is
only a precursor contributory risk, whereas the trust and financial RIM risk are post-event
consequences. However, there needs to be a link with the precursor event to the stand-alone risk
event called out in the chapter that justifies including that RAMP risk in the cross-cutting risk.
Staff strongly agree that poor records and record keeping practices and processes could
contribute to problems, but the linkage to safety and the frequency and impact needs to be clearer
and fully explained.
Staff agrees with the CC weaknesses that PG&E outlined in the filing;
“The drawback of using this cross-cutting approach is the dependence on the outputs of
the stand-alone models. Also, because these cross-cutting risks are an alternative view of
the associated risks, double counting will occur and the cross-cutting risks will be more
susceptible to change when additional risks are modeled and when existing stand-alone
models are updated or modified, making risk reduction difficult to measure.”83
In this risk model there were up to 17 potential risk drivers for the stand-alone risks which could
have a proportion attributed to the RIM cross-cutting risk. The sheer number of potential risk
drivers and number of stand-alone risks used to estimate a proportional RIM risk frequency this
very complicated.
In addition, the complexity of modeling this CC risk makes it difficult to explain, hard to follow
and understand for the lay person and those without “native expertise” in the model and the risk.
The chapter explains that the product of the underlying frequencies and RIM frequency attributes
result in the RIM risk frequencies shown in Table 20-1. However, one must puzzle this out by
deconstructing the model to assess the integrity of the risk frequency inputs.
Additionally, the model inputs rely on secondary source data, which was not well defined or
described. In addition, this information was not appended to the model workbook for reference.
This information would require additional data requests requiring more time and effort to fully
evaluate the MARS and RSE.
Without a deep dive into and greater transparency of the modeling assumptions, it is difficult to
completely trust the model outputs.
STRENGTHS
The risk chapter clearly identifies PG&E’s role and responsibility for the risks. The use of the
bow tie with the circles for contribution to frequency shows the RAMP risks that contribution to
frequency.
83
B-13.

Page | 136
AREAS FOR IMPROVEMENT
The CC model is very complex largely due to including up to 17 stand-along risk drivers for the
12 contributing risks, the types of metrics used for frequency and the subjective estimates for the
reduction of consequence. The various variables and inputs seem to be handled by the model
design and structure, but in general the lack of transparency of the underlying source
documentation, and rationale for input choices increase the difficulty parsing and evaluating the
assumptions for lay people who do not have the native expertise with the model or with each of
the associated stand-alone risks.
1. One of the main weaknesses of the CC model is that there is no direct link to the risk events
and the contribution to the events is based on SME and risk owner conjecture, so that makes
it very difficult to choose among the potential mitigations because no one can really say that
one will have as much risk reduction as proposed, and whether one may be better or not than
another.
2. Lack of transparency into the effectiveness of current controls. E.G. many of the mitigations
are enhancements on existing controls where it is unclear the current mitigation impact and
how much more impact should be attributed to enhancements.
3. The bow tie is used differently than for stand-alone risks, in that it does not show drivers
which are causally linked to and event. This was explained at length throughout the RAMP
but in the eyes of Staff this is still a short coming of the CC risk presentation and does not
easily and transparently convey the same driver to event linkage as for stand-alone risks. This
will be a continuing challenge if the use of the CC model moves forward.
4. The model does not stand on its own, which requires extensive amounts of additional source
data in order to evaluate the reasonableness nomenclature and nuance of the various inputs,
e.g. explanation of the source data tables, would be helpful not only for the preparer but the
reviewer to better navigate the model’s complexity.
5. PG&E should use a consistent method to calculate frequency for all risks.
6. This chapter appears to indicate a different start and completion date in the work papers than
the dates used in the model to calculate MARS and RSE. For example, the overall risk
reduction is exactly the same for each year 2017-2022 for all mitigations of the inputs. Given
the mitigations have different start dates, it would seem logical that there would be an
increased rate of mitigation after 2019 when the proposed mitigations are supposed to
contribute to risk reduction.
7. The CC model does not show any Output Dashboard results because Staff does not have
access to the AtRisk software. PG&E should find a way to show the output values in the
model so that intervenors and parties can easily reference the data.
Risk specific information
The risk of failing to construct, operate and maintain a safe system leading to injury, fatality
and/or property damage is described as a cross-cutting (CC) RIM risk and is a sub-driver in

Page | 137
12 RAMP risks. The chapter talks in general terms as to the issues each of the 12 RAMP risks
face with records management, but the chapter fails to clearly explain what the specific risks are
for each of the sub-drivers. In addition, it was not explained how the mitigations actually impact
the sub-drivers and reduce the risk.
In the Risk chapter there was very little specific linkage to actual events driven by a lack of
adequate records. This lack of a linkage with a specific risk event was noted by PG&E as a
weakness of the cross-cutting risk model.
For instance, the chapter shows in Table 20-1: RIM Frequency Attributes that Natural Gas
Storage Well Failure – Loss of Containment with Ignition has a 64.8% Ramp risk related to RIM
risk.84
Yet, this has not been explained adequately, so that the import of this is not clear.
Risk Classification:
The risk classification is based on associations with stand-alone risks which already are included
for safety reasons. PG&E notes:
“The consequences of all risks are limited to first order impacts, i.e., what may happen
directly after and explicitly attributable to an event, except for the ERIM… risk(s).”
Therefore, creating a CC risk like RIM duplicates the apparent safety risks that have already
been included in the other stand-alone RAMP risks and CC risks lack specific causal linkage to
event risk staff are concerned that the CC risk fails to qualify as a safety risk worthy of inclusion.
Unless a clear causal linkage between the sub-driver and the stand-alone risk event is evidenced
and the proportion of that gets separated out from the stand-alone risks to be scored separately
through the RET risk categorization steps, there does not appear to be enough of a safety risk to
justify including it in the RAMP.
If the sub-drivers are implicated as a causal factor and even as a precursory factor in other stand-
alone risks, then it should be included with the other risk drivers in the respective stand-alone
risk chapters and mitigated in accordance with its contribution to event risks.
Potential Drivers:
The following is the definition for stand-alone drivers and intuitively makes sense.
“Drivers on the left-hand side of the bow tie are the causes for the risk event. The list of
drivers should be exhaustive and encapsulate all possible causes for the risk event.
Drivers should also be measurable, with an associated frequency that can be informed by
industry and/or PG&E data. Drivers can be broken down into an exposure and a
frequency in units of counts per exposure per given time period, to further decompose the
left-hand side. See Exposure and Frequency section below for further detail.”85
84
20-5. 85
B-7.

Page | 138
The list of Rim risk sub-drivers is all associated with other stand-alone risks and therefore, per
the definition used by PG&E to construct the CC risk model, there was no attempt to link the
sub-drivers to the risk mitigations. This is considered a weakness of the CC model.
The Frequency Score, Impact on the Overall Risk Score, and Potential Consequence:
Additional observations to those noted above: It is not clear nor was it explained why on page
20-5 a ten-year average was used to calculate the injury frequency. One would expect that since
ERIM was recognized as an enterprise risk in 2013 that that would be the beginning from which
to measure progress. Additionally, it does not appear trending the data was performed, which
would indicate whether choosing a longer or shorter average would have on the MARS and RSE.
The observations were made for frequency “Source Notes” provided in the CC model inputs tab:
1. A total of 51 “risk drivers” mapped to RIM and only a handful of specific RIM causes
identified with the stand-alone risk, which means there are few links between the RIM risk
mitigations to stand-alone risks reduction.86
2. The SME explained that they used employee and contractor injuries because they had larger
value than fatalities. SME should explain why using injuries over fatalities was better and
why larger is better.
3. It is not clear why PG&E would exclude the Skill and Qualified Work Force over concerns
of duplicating the risk yet acknowledges that there is double counting for stand-alone risks as
well but doesn’t make some allowance for that in the stand-alone risk.
Electrical operations chose a medium range (between high and low) for its frequency with the
explanation that “these risks being ranked high in RAMP probabilistic modeling” which doesn’t
seem to correlate at all with the frequency. This should be explicitly explained for the non-
native experts who are the recipients of the RAMP filing.
Risk Score
MARS - Tail Average and RSE:
The RIM risk TA MARS RSEs for the proposed projects are heavily influenced by the Trust and
Financial post-event consequences that were linked via test cases to the RIM risk. The use of
test cases seems like a good way to bound the consequences associated with the RIM risk. The
weighted safety portion of the TA RSE was about 37% of the score. As noted above the method
used to estimate the contribution of safety factors to RIM risk duplicates the frequency of safety
events in stand-alone risks.
86
Even for the over-pressure event linked to RIM risk in Chapter 3, the specific RIM issue was not explained. It was not clear if it was missing records, inaccurate records, records access issues, incomplete records, and etc. Therefore, it is unclear whether the RIM mitigations would bear on the cause of the sub-driver and the associated stand-alone risk.

Page | 139
See comments above concerning the heavy influence on CC model from subjective inputs from
risk owners and SMEs which bear directly on the CC model results.
Baseline Mitigation Plan
The baseline controls appeared to be adequately explained and reasonable. The 2017 GRC
mitigations also seemed to mesh well with the controls, and lastly the proposed mitigations
intuitively make sense from an enterprise managerial perspective that is concerned with its
holistic approach to record keeping and records management. Staff did not perceive any
proposed mitigation that did not fit with an enterprise managerial risk.
Alternative Mitigation Plans and Their Relative RSE, if any
The alternatives were discussed in detail and the differences between the Alternative mitigation
RSE scores were clear. There were differences in the associated costs with the Proposed plan
and the timing of implementation and roll out which affected the opportunity to achieve the
estimated risk reductions sooner. In the alternatives discussion it was noted that PG&E would be
accepting a higher risk tolerance by choosing either of Alternative 1 and 2 that comes along with
their lower costs. However, this was not explored in greater detail in the chapter. The issue of
risk tolerance should be a feature of RAMP filings and it is hoped that guidance and ground rules
for developing risk tolerance will evolve through the S-MAP proceeding. Explaining how the
risk tolerance factors into the decision choices at a more granular level, so that the reader gets a
sense of what could be given up and at what cost would help the RAMP process.
Proposed Mitigation Plans
See comments under the Baseline Mitigation section.
RSE Applied to this Risk, and the RSE Results
Staff has limited skills and resources parsing models of this complexity and sophistication, and
due to the lack of access to the AtRisk software tools, have not done a full evaluation on the
integrity and workings of the CC model. Because Staff does not have the modeling expertise it
is recommended that the CC and stand-alone models go through a more granular and in-depth
evaluation within S-MAP.
Although, based on the review performed it appears that the CC model works as designed and
produces outputs consistent with the inputs. The RSE outputs applied to this risk are almost
exclusively based on risk owner and SME estimates of RIM contribution to the LOB stand-alone
risks. Because the risk owner and SMEs made selected inputs and variables that impact the
MARS score without enough transparency to adequate explain their modeling choices the RSE’s
calculated by the CC model are not reliable enough to be used at this stage of its evolution to
make comparisons across the other chapter risks.

Page | 140
CONCLUSION
Staff believe there are four key weaknesses with the RIM risk and the CC model that describes
its MARS and RSE: 1) lack of direct linkage to risk events which increase the uncertainty of
mitigation effectiveness and choosing between the mitigations, 2) the CC model duplicates the
RIM safety risks that have been substantially addressed in the stand-alone chapter, 3) the
complexity of the model that proportionally allocates frequency and risk reduction which are
largely SME inputs and assumptions makes it difficult to follow and have confidence in the
results, and 4) the uncertainty range of risk reduction has not been adequately explained in order
to provide a complete understanding of the range of potential outcomes.
Even though the model is complex it appears to function as designed and consistently produces
outputs based on the inputs injected into the model. Staff suggest that this model be scrutinized
in the S-MAP proceeding to determine whether the CC model makes sense for RAMP risk
evaluations.
2.21 SKILLED AND QUALIFIED WORKFORCE
SUMMARY
PG&E roughly defines this risk (and its sole driver) as a worker not possessing requisite skills or
qualifications for a task attempted or performed. PG&E does not speculate on whether workers
might find themselves in such situations due to some error in assignment or whether it is routine
that workers work out of class (performing tasks that exceed authority or qualifications). PG&E
categorizes as out of scope for this risk, work procedure error (workers who may accidentally or
deliberately commit an error due to fatigue or mental duress). Nuclear facilities are also excluded
from consideration.
Prior to 2013, the utility addressed this issue conventionally as one of many HR responsibilities.
With the increasing pace of change and PG&E’s new concerted risk-management approach, the
utility has shifted its approach to placing priority on rapid response to equip workers with
training and qualifications to appropriately address requirements likely to arise in their course of
duty.
The backbone of PG&E’s strategy is data recording and trending to better assess risk and
intervene appropriately. PG&E believes that this will enable them to assess the risk more
quantitatively, which will in turn help identify the most effective areas for future risk mitigations
and risk reduction. Specific controls and mitigations include increasing the availability of
technical resources to field employees, systems that will enable supervisors and others to easily
confirm qualifications status of employees, and bringing more processes under the scope of the
control and mitigation activities.

Page | 141
Chapter Statistics Summary:
MARS-EV-Overall Average-Total: 1.91
MARS-EV- Proposed Plan-Risk Score Reduction (all years): 1.00
MARS-EV-Overall Average-Total-RANK: 18
MARS-TA-Overall Average-Total: 4.96
MARS-TA-Proposed Plan-Risk Score Reduction (all years): 2.365
MARS-TA-Overall Average-Total-RANK: 22
RSE Units of Risk Reduced Per Million Dollars:
MARS-EV-Proposed Plan-Total RSE (Units/$M) 0.163
MARS-TA-Proposed Plan-Total RSE (Units/$M) 0.387
2016 Baseline Controls and Mitigations:
Recorded control expense costs: n/a*
Recorded capital control costs: n/a*
* PG&E claims it is unable to isolate and estimate costs for all of its eight identified controls for
2016
2017-2019:
Current mitigation plan expenses (average): n/a*
Current mitigation plan capital costs (average): n/a*
* PG&E claims it is unable to isolate and estimate costs for 11 of 13 mitigation measures. PG&E
provides only those expenses for Business Process Index (BPI) (M1A)
M1A Current mitigation plan expenses (average): $0.80 million
M1A Current mitigation plan capital costs (average): $0.00 million
and a new Training Substation in Livermore (M13)
M13 Current mitigation plan expenses (average): $51.85 million
M13 Current mitigation plan capital costs (average): $ 0.41 million
2020-2022:
Proposed mitigation plan expenses (average): $3.145 million*
Proposed mitigation plan capital costs (average): $0.263 million*
* PG&E in its expense tables provides a range of estimated costs; the high end of each range is
shown here. PG&E indicates that it is unable to provide a cost estimate for its mitigation measure
Electric and Power Generation Review and Update Expected Job Functions (M19)
** Note that the 2020-2022 total above is far from the amount that that PG&E establishes in its
cost workpapers as the risk’s Proposed Plan Total Spend (all years), which is $6,110,000.

Page | 142
STRENGTHS
By implementing the mitigation strategy outlined in this chapter, PG&E estimates a resulting
potential 8.7 percent reduction to the overall multi-attribute risk score (MARS) for the 2020-
2022 time period.
AREAS FOR IMPROVEMENT
PG&E states that it expects to continue improving its RAMP modeling efforts in order to more
quantitatively evaluate this risk, citing as an area for improvement the development of frequency
and consequence data for high-consequence work that impacts assets or operations not covered
by the existing asset-based RAMP risks.
PG&E believes this additional data, combined with the inputs from the asset based RAMP risks,
would provide a more complete picture of the SQWF risk.
PG&E rightly assessed this risk based on its relationship with other RAMP risks, but the utility
does not make a fully clear and persuasive case for justifying its use of “Incorrect Operations”
(“estimated using assessment pass rate data as a proxy combined with SME judgement”) as a
proxy driver until more thorough and precise SQWF risk data are obtained.
Unlike PG&E’s other risk chapters, the SQWF Chapter 21 does not provide a resulting multi-
attribute risk score (MARS) reduction estimate for six of its seven proposed mitigation measures.
PG&E estimates for one mitigation measure, On the Job Support – Mobile Technology for
Foremen and Crew Leads (Technical Competence), M14A : a corresponding reduction in the
the likelihood of the risk of a gas event by 7 percent, with 15 percent reduction for an electric-
based event. PG&E ties these risk reductions to effective program implementation leading to a
change in assessment pass rate when employees have the opportunity to review procedures and
other technical documentation.
PG&E’s workpapers reveal the risk reduction value of its overall preferred alternative “Proposed
Plan Risk Reduction % of Baseline” to be is 0.087. Thus, PG&E estimates a resulting potential
8.7 percent reduction to the overall multi-attribute risk score (MARS) for the 2020-2022 time
period. PG&E was unable to provide much, if any, solid cost estimates for the period from
2016-2019. PG&E performs marginally better -- but not in the ballpark of acceptable – with
missing risk reduction values and incomplete 2020-2022 cost estimates that are only provided
as a possible range of expenses.
One example is BPI: “The total estimate cost for this mitigation is from $0.3 million to $0.9
million expense. Because this is foundational work, no risk reduction has been estimated.”
PG&E concedes that it possesses limited historic data documenting risk events attributable to
lack of worker skills and qualifications. Thus, PG&E is perhaps over-reliant on SME judgment
in assigning risk scores. Staff recognizes that PG&E may be constrained and is doing what it can
to quickly grow its understanding of the risk.

Page | 143
In so doing, PG&E may be applying the best-available assumptions. Nevertheless, the limited
available data could compromise risk model assumptions and misrepresent the prospects for an
occurrence of this risk.
Risk Score and Plan Alternatives
MARS - Tail Average:
PG&E’s 2020-2022 proposed preferred mitigation plan includes seven measures having RSEs
that are assigned as 0.008, 0.195, 0.842, and 0.454, for an overall plan TA RSE of 0.387. (Three
of the seven meansure did not include an RSE value).
PG&E offers two plan alternatives, as is required, but they are little more than minor variations
on the original preferred mitigation plan.
PG&E’s Alternative Plan 1, a “more robust approach,” preserves all seven measures included
within its preferred mitigation plan with the exception being On the Job Support – Mobile
Technology – Foreman and Crew, M14A. However, this alternative would feature a more
expansive version of M14A, On the Job Support – Mobile Technology – All Field Employees,
plus Implement a 24/7 Technical Support Desk, M16. The TA RSE for Alternative Plan 1 is
0.432
PG&E indicates that this alternative mitigation plan was not chosen because the utility expects
that by the end of 2022, all or most field employees would have mobile devices in the field; and
the benefits of a 24/7 help desk were difficult to estimate and are likely overstated.
PG&E’s Alternative Plan 2, a “lowest cost bundle” that would “leave open an increased
opportunity for a failure due to human error more robust approach,” is identical to Alternative
Plan 1, except that it drops Work Scheduling Integration with Qualifications, M17 (also included
within the preferred alternative), a program that aims to transition PG&E from manual to
automated personnel scheduling. The TA RSE for Alternative Plan 2 is 0.419.
CONCLUSION
The risk analysis, due to a paucity of real-world data based on actual occurance of the risk, is
somewhat circumspect, but probably the best available at this time. PG&E promises to further
refine its approach, migrating from a proxy approach that relies on a somewhat opaic “Incorrect
Operations” risk driver input model, to a more conventional the bow-tie RAMP model rigor
methodology.
This risk and its mitigation funding merits further scrutiny in the course of the forthcoming
GT&S rate case. In the interim, PG&E should redouble its efforts to provide past and future cost
estimates that are somewhat grounded in concrete numbers, as well as assign values to the risk
mitigation RSEs that PG&E is willing to stand behind.

Page | 144
2.22 CLIMATE RESILIENCE
SUMMARY
PG&E defines Climate Resilience as “actions to be taken related to PG&E’s assets,
infrastructure, operations, employees and customers to mitigate against the potential
consequences of and adapt to a changing climate and associated weather patterns.” In this
RAMP, PG&E’s risk assessment approach is distinguished from what SED has seen from other
utilities by the inclusion of both mitigation and adaptation efforts, and that PG&E draws on
related analysis of 11 other RAMP risks (covering both electric and gas operations) for assessing
how to address potential climate risks. PG&E also identified six individual “drivers” of climate
impacts:
Major Storm Events
Sea Level Rise
Subsidence
Heat waves
Wildfires
Drought
Additionally, PG&E has chosen to analyze Climate risks in two differing time periods, 2022 and
2050 and somewhat differing scenarios to reflect the two dates. These climate change
multipliers ae meant to capture the expected increase in frequency of risk events, and are
independent of each other in PG&E’s model. PG&E also posits two “scenarios” for each time
frame to reflect
The differences apparent in PG&E’s model appear to be in the extremes, that is the range from
minimum to possible maximums is the same in 2022 and 2050, but outer years show more
extreme outcomes (for example significant increases in sea-level rise – measured in inches of
rise), and sometimes stark differences in the A & B scenarios (i.e., a 25 percent to 40 percent
increase in expected numbers of five-day heat waves). Of the six identified drivers, sea-level
rise appears to pose a far greater potential likelihood in the analysis, approximately an order of
magnitude greater than each of the other drivers.
PG&E correctly cautions about the great uncertainty of current forecasting climate change
impacts. An even greater uncertainty is noted for potential geohazards, including extreme winds,
ice storms, earthquakes and tsunamis.
Still, the utility’s attempt to better quantify all of its RAMP risks does provide some sense of the
safety consequences, even in the near term:

Page | 145
“[I]n 2022, PG&E could experience safety consequences for PG&E workforce and the
public of an additional 25 – 129 injuries and 1 -3 fatalities per year due to climate
change impacts, and in 2050, an additional 66 – 173 injuries and 2 – 5 fatalities…”
In terms of translating expected outcomes in the several risk attributes that PG&E uses to
compute a MARS “tail end” consequence score of 665.3 (for the 2020 Scenario B) and 845.1 for
the 2050 B scenario), the utility sees even greater impacts from environment, reliability and
financial outcomes of its model.
However, in the near-term, PG&E admits that its proposed mitigation strategy must still be
considered “foundational” and focused on improving its analytical capabilities rather than
altering operations or increasing capital expenditures in this GRC cycle. Its current set of
controls and mitigations (n the 2016 – 2019 period) are characterized as prioritizing emergency
preparedness and response, and information gathering by developing decision-making tools and
metrics to measure progress.
The proposed mitigation plan for 2020-2022 continues this work plan, not directly proposing risk
mitigations, but instead “to create knowledge, tools, and a platform through which to mitigate
risk when applied by PG&E’s lines of business in the future.” As a result, there is no expected
quantifiable risk reduction and no attempt to calculate a Risk Spend Efficiency (RSE) measure
for this cycle.
Proposed incremental expenditures are modest, rising from $518,000 in 2017 (est) to $844,000 in
2022, with the emphasis on training, implementing screening tools and developing plans for
asset prioritization. PG&E also projects what it calls “deep dives” into three of the risk drivers:
Major Storm Events, Drought and Subsidence. PG&E says the deep dives are “essential” to help
better understand how climate change impacts assets, infrastructure, operations, employees and
customers.
Chapter Statistics Summary:
MARS-EV-Overall Average-Total: 80.41
MARS-EV-Proposed Plan-Overall Average-Risk Score Reduction: - 0 -
MARS-EV-Overall Average-Total-RANK: 8
MARS-TA-Overall Average-Total: 665.33
MARS-TA-Proposed Plan-Risk Score Reduction (all years): - 0 -
MARS-TA-Overall Average-Total-RANK: 2
RSE Units of Risk Reduced Per Million Dollars:
MARS-EV-Proposed Plan-Total RSE (Units/$M) - 0 -
MARS-TA-Proposed Plan-Total RSE (Units/$M) - 0 -
2016 Baseline Controls:
Recorded control expense costs: $0

Page | 146
Recorded capital control costs: $0
2017-2019:
Current mitigation plan expenses (average): $0
Current mitigation plan capital costs (average): $0
2017-2019:
Proposed mitigation plan expense (average) (000): $689
Proposed mitigation plan capital costs (average): $0
2020-2022:
Proposed mitigation plan expenses (average) (000): $828
Proposed mitigation plan capital costs (average): $0
STRENGTHS
In a sense, PG&E’s admission of grappling with great uncertainty has pushed the utility into
relatively uncharted territory for its analysis of climate change impacts, and it appears to be
responding with flexibility in determining new strategies as more information is available and
actual climate impacts become more clear. That is possibly the best approach for the time being.
The utility appears to have taken seriously SED’s prior recommendations that utility planners re-
set their horizons from a too distant 50 – 75 year window a more foreseeable timeframe. The
analysis of projected safety consequences, in and of itself showing higher injuries and fatalities
in the short-term, should be taken as a cautionary for planners, regulators and lawmakers.
AREAS FOR IMPROVEMENT
Although PG&E has made a purposeful decision to try to segregate its risks and proposed
mitigation spending to minimize duplication and overlapping projections, there could be a better
understanding provided of PG&E’s assessment of the inputs related to the 11 stand alone risks
that it says contribute to the overall climate risk.
It is apparent that the climate analysis is unique, in that the other risks are employed to define the
risk exposure (illustrated in the Bow-Tie in Figure 22-1, page 22-5), but because this is a very
different approach that used for other Risk Exposures, the reader is left to merely accept PG&E’s
use of percentages or weightings of contribution and how that impacts the analysis.
The relatively greater percentage attributed to Hydro/Dam risk, is clearly a factor in the
estimation of Sea-Level Rise risk driver frequency, but again, the reader must take that on faith.
Perhaps the “deep dive” analysis will, over time, resolve these unanswered questions.
Also, because we know of PG&E’s involvement in national climate risk assessment efforts (in
particular, the U.S. Department of Energy’s Partnership for Energy Sector Climate Resilience),
there remain unanswered questions about how fully PG&E is using asset-based analysis for this
risk area.
Page | 147
RSE for Mitigations
As noted above, PG&E did not provide provided a risk-spend efficiency calculation for Climate
Change Adaptation mitigations.
Alternative Mitigations
The alternative approaches to PG&E proposed package of mitigations for 2020-2022 are
essentially two flavors of additional activity: “accelerated pace” and increased resources (ranging
from 50% greater to a doubling of expenditures for the deep dives). The range of expected costs
in the three-year GRC cycle goes from $2.5 million for the recommended mitigation plan to a
little over $3.1 million for the more assertive mitigation alternative. The “accelerate pace”
alternate is also $2.5 million but some expenditures are moved up to 2002, with less spent in
later years.
In other words, at this stage, there really is little difference among the plans, and because there is
no expectation of actual risk reduction from planned activities, little basis for deciding whether
one approach is truly preferable to the others.
CONCLUSION
The expectations for RAMP analysis are, of course, a moving target, and PG&E faced numerous
challenges in compiling its first discrete RAMP. As with all of its other identified risks in this
cycle, there are modes of analysis that have not been employed in the past, and PG&E should be
commended for pushing the envelope to better employ probabilistic analysis.
In the absence of quantifiable data about both the likelihood and consequences of climate change
impacts, PG&E correctly continues to put is emphasis on developing better tools and metrics that
will in future GRCs better inform investment choices.
Continued development of the PG&E analysis (independent of the specific multi-attribute model
approach eventually determined by the Commission) will benefit from PG&E’s further analysis
of both the interaction of its other related RAMP risks and the “deep dive” into analysis of the
identified risk drivers.
###

Page | 148
3 SPECIAL SECTIONS – APPENDICES
3.1 RISK ASSESSMENT FOR SUBSTATIONS
SUMMARY
PG&E does not consider risks to substations as among its top safety risks, but included a
relatively cursory description of Risk Assessment for Substations in its RAMP, at the request of
SED.
The impetus for SED’s concern relates to the April 2017 “arc flash” incident that occurred as a
result of circuit breaker failure at the Larkin Street substation in San Francisco. This event
caused an extensive and extended outage of electric power in key sections of the city, including
parts of the Financial District and to several government buildings in the Civic Center, including
CPUC headquarters. The outage affected as many as 88,000 customers for up to 8 hours.
As part of its review of the outage, Risk Assessment section issued a data request to PG&E about
its program of upgrades to such key substations, and it directed PG&E to include a substation
risk assessment when it filed the 2017 RAMP.
According to PG&E, risks associated with substations are weighted far more heavily on
reliability than on safety. PG&E noted that the last time an incident at a substation resulted in a
serious injury or fatality was more than 20 years ago, when a failed regulator spilled hot oil onto
an employee. This incident led to retrofits of similar equipment, new operational procedures and
training for employees and contractors.
On the other hand, equipment failures that can cause localized outages are more frequent, and
PG&E’s risk register includes a number of substation-related risk events, including:
Asset-based risks from single asset failures, causing a large outage, such as at Larkin St.;
Asset-based risks due to aging infrastructure at substations; and
Event-based failures, such as the 1989 Loma Prieta Earthquake.
Additionally, PG&E also notes process-based risks that relate to inadequate spare equipment,
restoration plans or workforce planning failures. Such risks are not specific to substations and
could affect any utility facilities; but PG&E does include two substation versions of the risk in its
risk register. None of these risks scored highly on the safety component of PG&E’s prioritization
of operational risks, and the utility provided some evidence that there has been a consistent
positive trend in reducing reliability events at substations since 2007.
In terms of quantifiable incidents, PG&E noted that circuit breaker failures, such as that which
occurred at Larkin St., “are not a systemic risk” and “are a very small percentage of incidents on
its system. During the 2009-2016 period, PG&E said it recorded an average of 8.5 failures per

Page | 149
year in a population of more than 5,200 distribution class circuit breakers. Such failures are a
minor contributor to statistics defining duration of outages (SAIDI, or System Average
Interruption Duration Index) accounting for 0.44 minutes per year of customer outages, as part of
the system average SAIDI of 13.3 minutes during that period.
There has been a fairly steady decrease in Transmission and Substation SAIDI over the past
decade, dropping from an average of 23.8 customer-minutes lost per year in 2008, to about an
average of 10.7 customer-minutes in 2016, a reduction of more than 55 percent.
Nonetheless, PG&E has noted a counter trend of increased transformer failures over the past five
years, reflecting that fact that PG&E’s fleet of 2,200 substation-grade transformers have an
average age of 44 years, with about 660 of them older than 60 years in operation – effectively
nearing the end of their useful life.
Mitigations
Based on the perceived risks of asset failures, including caused by earthquakes or physical
attacks on substations, PG&E says that it has spent over $100 million to replace vulnerable
equipment, retrofit key buildings and improve emergency response capabilities. Other strategies
to minimize outage potential have included the installation of a underwater cable linking the
Embarcadero and Potrero substations. PG&E in late December 2017 filed an application to
reconfigure underground circuits coming into San Francisco so that local reliability is less
dependent on the Martin Substation on the border with Daly City/Brisbane, by installing a new
Egbert switching station to reroute energy up the southeastern section of San Francisco (A. 17-
12-021).
Not part of its RAMP, but included in a response to SED’s data request, PG&E has laid out its
substation upgrade program, which will continue for the next several years. PG&E provided a
listing of upgrades projected for several key urban substations in its territory, those serving over
40,000 customers. The San Francisco substations at Larkin St., Embarcadero and Mission St.
represent a unique subset because of the larger populations they serve as well as supporting San
Francisco’s financial district.
Here are some major upgrades recently completed and planned:
SF – Larkin Six transformers had been replaced over the past decade, at a cost of
$45 million. PG&E is constructing a new building adjacent to the existing
substation to house all-new 12-kV switchgear, beginning in 2018. By
2020, all 58 distribution circuits will be transferred to the new
equipment. Transmission-level equipment is also scheduled for
replacement by 2020 to 2023.
SF – Mission A full station upgrade was completed in 2014, but an additional
transformer bank is included in PG&E’s 5-year plan.

Page | 150
SF – Embarcadero A 230-kV bus upgrade was completed in 2016, and four transformers
replaced in the past 15 years. Six more transformers will be replaced in
the next decade.
SF – Potrero A 230-kV bus upgrade was complete in 2016, by 2022, PG&E expects a
complete rebuild of 115-kV and 12-kV bus and banks.
Daly City – Martin The 115-kV bus was upgraded in 2012 and 6 of 9 transformers were
replaced. The three remaining transformers will be replaced as part of
the five-year plan.
Additionally, a number of switchgear and transformer replacements are scheduled for substations
in Oakland, Stockdale, Saratoga, and Santa Cruz, according to PG&E.
Mitigation Alternatives
No alternatives were presented.
Areas for Improvement
At this time, it is uncertain how to evaluate PG&E’s substation risks. Given the way the utility
characterizes potential incidents (asset-based and event based), the risk analysis of substations
may be better considered as part of a risk category devoted to “aging infrastructure” in the future
or in reference to a “public safety event” type of risk, similar to how San Diego Gas & Electric
categorized large-scale electric outages, as part of its 2016 RAMP.
Because PG&E does not consider substation risks as safety risks, the utility did not provide a full
assessment of mitigations or projected expenses in this RAMP filing, but pointed instead to
proposed spending in the prior GRC of nearly $290 million in 2017 for various major work
categories and components of equipment to be repaired or replaced at substations. The largest
category of expenditures were for Transformers and Voltage regulators, approximately $45
million, and nearly $80 million for circuit breakers and switchgear. PG&E has termed this its
Substation Asset Mitigation (SAM) program, a five-year plan of repairs and replacements.
Conclusion
While it does not fit neatly into the risk categories that PG&E has determined for this RAMP,
Risk to Electric Substations is a particular concern for the Commission, and incidents such at the
Larkin Street arc flash could pose a safety hazard for employees or contractors, and reliability
risks could very well trigger public safety risks if they result in extended outages of long
duration. For this reason, SED believes a continued focus on investments in substation reliability
should be considered in future RAMPs and GRCs.
###

Page | 151
4 CONCLUSION AND RECOMMENDATIONS
It is clear based on the level of complexity and the volume of documentation provided that
PG&E and its RAMP team expended significant effort to complete their RAMP filing. In
general, Staff found the filing to be in accordance with the Commission directives in D.14-12-
025 in R.13-11-006 and in D.16-08-018 in A.15-05-002, et al. This RAMP filing evolved
several of the lessons learned from Sempra’s first RAMP filing (consistently modeled output,
models for each chapter provided, overall results accumulated in one workbook, and providing
lessons learned).
The Cycla steps 1-8 were met appropriately. Though there are several issues noted above which
could be improved upon, this RAMP evolved the process and raised the bar for future RAMP
filings.
Recommendations:
PG&E did not provide a MARS or RSE for existing controls because they wanted to
focus the forward-looking nature of its programs and to understand the potential risk
reduction associated with new mitigation investments. However, without the relative
context provided by RSEs and MARS for existing controls, it is very difficult to assess
the relative benefit provided by the proposed mitigations. Therefore, Staff strongly
recommends that PG&E provide MARS and RSE for all controls on the same basis
developed for mitigations for their upcoming GRC and future RAMP filings.
The risk owner and SME are key inputs driving the model outputs and should be fully
explained throughout the chapters and model. The outputs of the model reflect these
choices and without transparency into these key inputs the value of the model outputs
could be called into question.
Risk areas that have greater available data seem to provide a far more solid basis for
evaluating the proposed mitigations.
A more rigorous review of the data, data sources, and data integrity should be done to
correct any errors and vet the input data prior to completing the RAMP. Numerous small
errors indicate a lack of care and due diligence that raises concerns over the overall
product of the RAMP since most of the source data is not transparent.
The cross-cutting model duplicates the risk already addressed in the stand-alone risk
chapters, and there is confusion in defining the risk, risk drivers and how mitigations link
to risk drivers. Because PG&E went out on a limb to develop a cross-cutting model and
it has not been vetted in S-MAP, Staff suggest that the cross-cutting model go through a

Page | 152
review and evaluation in S-MAP to determine whether, and, if so, how it should be used
for safety risks in the RAMP filing.
For several risk areas (Wildfire and Nuclear in particular) significant events transpired
since PG&E’s analysis which could impact how the risks are prioritized or mitigated
against. Staff urges PG&E to provide updated analysis or descriptions of how its
activities might change as a result of these events, as part of its GRC testimony.
The RAMP analysis could do a better job clarifying and ranking the risk mitigations that
are measured by the RSE and at the same time do a better job identifying metrics which
correlate with the performance of the respective risk mitigation. This will help ensure
that the utilities meet a specified goal that RAMP filings include “calculations of risk
reductions and a ranking of mitigations based on risk reduction per dollar spent,” as
articulated in D.16-08-018, Ordering Paragraph 30.
Because of time constraints and the lack of a Commission approved standard for evaluation, this
report does not specifically analyze the “safety culture” or “steady state” aspects of the utility’s
filing. These may be an area that is better explored in a workshop setting or in testimony in the
future GRCs.
The utility has not identified any immediate critical safety situations that should be addressed
outside of the GRC proceeding, except for its recent announcement of enhanced wildfire
prevention activities.
###