calculating risk and strategizing for improvement as a new ... · white paper the time to prepare...
TRANSCRIPT
WHITE PAPER
The Time to Prepare for Value-based Purchasing is NowCalculating Risk and Strategizing for Improvement as a New Payment Methodology Hits HomeBy Nell Buhlman, Vice President of Clinical Products; and Nikolas Matthes, MD, PhD, MPH, Vice President of Research and Development, Clinical Products, Press Ganey Associates
Although value-based purchasing (VBP) has been on the collective radar screen of hospital quality improvement and patient satisfaction professionals for some time, the Patient Protection and Affordable Care Act of 2010 has elevated VBP awareness – and concern – to the executive suite and the board room.
The reason for the sudden interest isn’t hard to fathom – under this new payment scheme, a portion of virtually every hospital’s Medicare reimbursement is at risk, beginning with 1% in fiscal year 2013 and growing to 2% in fiscal year 2017. Those percentages translate into serious money; on average, U.S. hospitals will have from $500,000 to $850,000 at risk annually under this program.
This concern has taken on new urgency in the wake of the Centers for Medicare and Medicaid Services’ (CMS) release of the final rule for the Hospital Inpatient Value-based Purchasing Program. The final rule underscores the fact that only a small percentage of hospitals will retain full reimbursement (See chart, page 2).
The concept of having Medicare revenue at risk is not new to hospitals. Since 2005, 2% of hospitals’ Medicare Annual Payment Update has been linked to facilities’ ability to successfully and accurately collect and submit data on a subset of the National Hospital Quality Measures and Hospital Consumer Assessment of Healthcare Providers and Systems (HCAHPS) measures to CMS.
The measurement areas of interest for VBP are similar to those used for public reporting, but the stakes are considerably higher – 2% of Medicare DRG payments to hospitals – and success more difficult to achieve, for under VBP, winning back some or all of the Medicare withhold will be tied to attaining specific performance thresholds or showing sufficient improvement on the measures, not just reporting the data.
Hospital leaders should not underestimate the magnitude of this shift from pay-for-reporting to pay-for-performance: Collecting data is one thing; improving and sustaining performance is another. And VBP is just the tip of the pay-for-performance iceberg. As the chart on page 6 shows, CMS’ plans for quality-based payment call for placing a much greater portion of hospitals’ Medicare dollars at risk in the coming years.
Helping With the Higher Math of VBPThe VBP regulations announced by CMS included some changes to prior models, notably one promulgated by CMS in 2007.
The regulations create a linear exchange function that will convert VBP scores into a percentage of the Medicare withhold a hospital will get back. A hospital with VBP scores at the median will be entitled to 50% of its withhold and a hospital at the 100th percentile will be entitled to 100% of its withhold. (Gone is an earlier proposal that would have
2
established a 90th percentile benchmark to attain full reimbursement.) And yet, there is some uncertainty in this calculus; if a substantial number of hospitals are lower performing, then CMS will increase the slope of the exchange function to redistribute leftover incentive funds to high achievers. Extremely high performers may even receive more than the full withhold. The slope of the exchange function for redistributing incentive dollars won’t be known until after the initial performance period when the first round of VBP scores will be calculated and it will be clear how much of the incentive pool remains.
This level of uncertainty in the calculus puts a premium on maximizing performance on all of the quality measures that make up the VBP program.
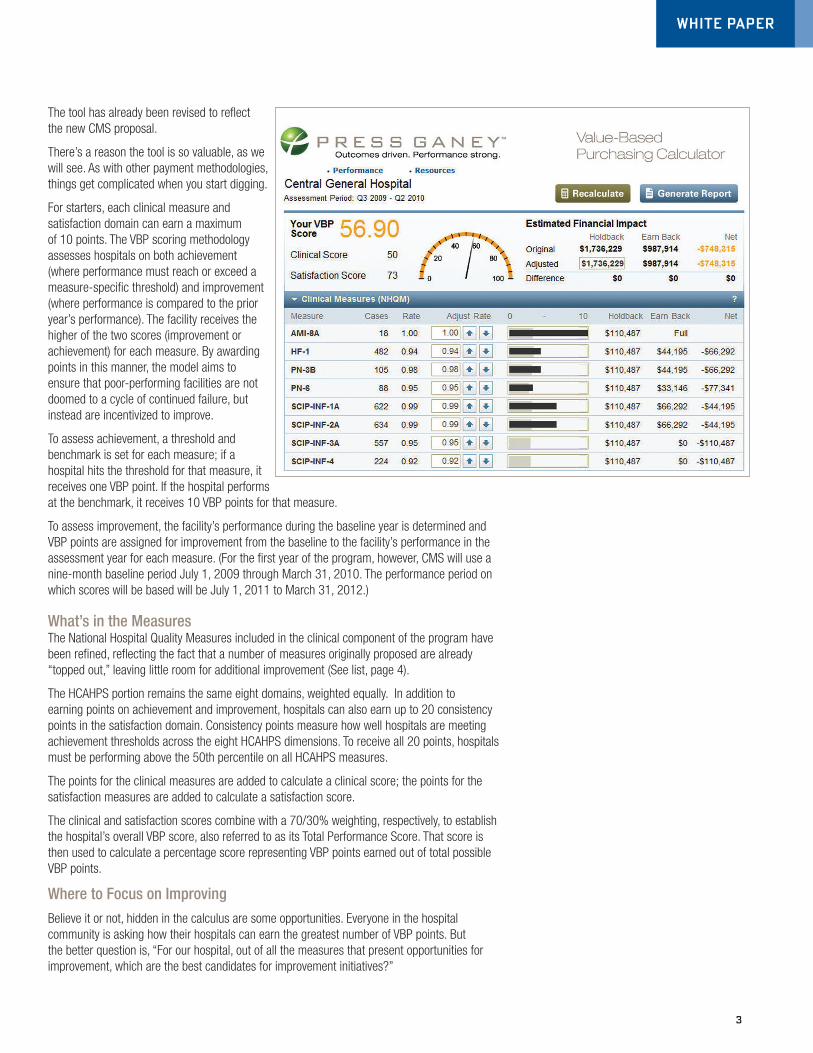
To help hospitals estimate how their payment could be affected by VBP, Press Ganey recently unveiled its Value-Based Purchasing Calculator (see graphic, page 3). Already in use at dozens of hospitals and health systems, providers have found the tool to be valuable. “The VBP tool has given us a tremendous resource to be able to track our performance and the performance of our physicians in complying with the government’s pay-for-performance standards,” says Jeff Fried, president and CEO of Beebe Medical Center in Lewes, Del. “Without such a tool, I’m not sure how we would be able to both track our compliance and quantify our performance. By using this tool to share our collective results with the board and our medical staff, we have already seen a significant improvement in our overall performance.”
00
100
200
300
OVERALL VALUE-BASED PURCHASING SCORE
NU
MB
ER
OF H
OS
PIT
ALS
IN
CO
HO
RT
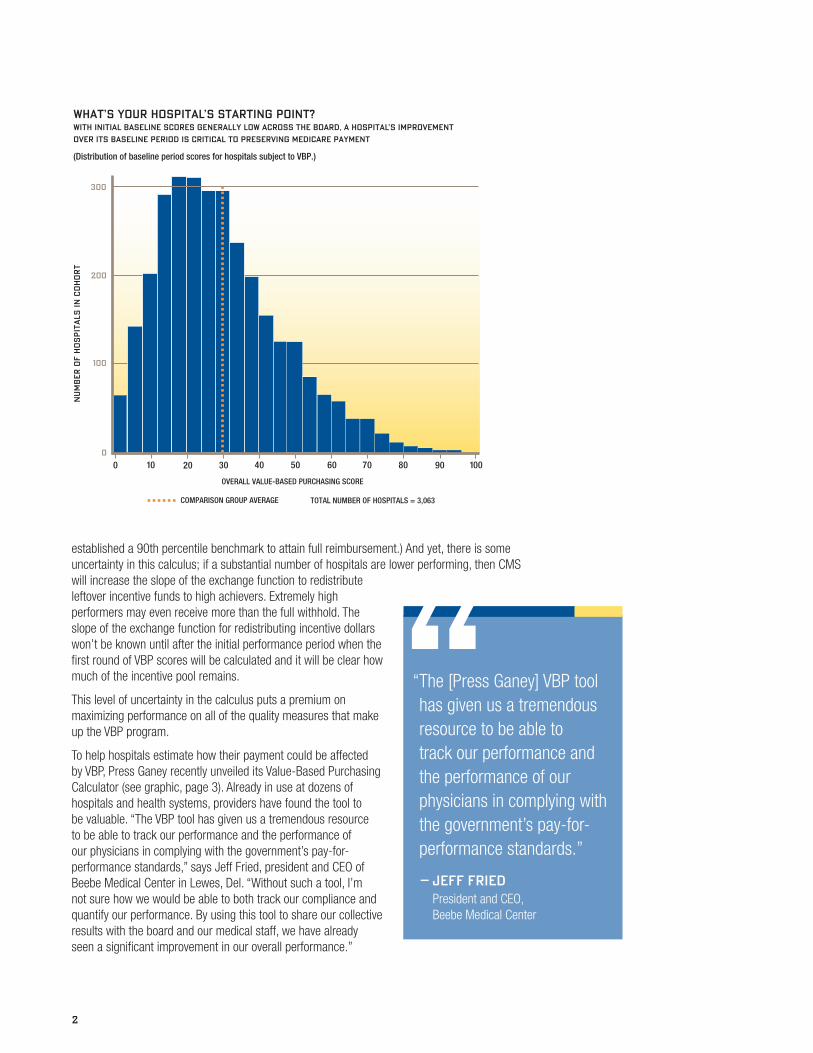
WITH INITIAL BASELINE SCORES GENERALLY LOW ACROSS THE BOARD, A HOSPITAL’S IMPROVEMENT
OVER ITS BASELINE PERIOD IS CRITICAL TO PRESERVING MEDICARE PAYMENT
(Distribution of baseline period scores for hospitals subject to VBP.)
WHAT’S YOUR HOSPITAL’S STARTING POINT?
TOTAL NUMBER OF HOSPITALS = 3,063
10 20 30 40 50 60 100908070
COMPARISON GROUP AVERAGE
“ The [Press Ganey] VBP tool has given us a tremendous resource to be able to track our performance and the performance of our physicians in complying with the government’s pay-for-performance standards.”
– JEFF FRIED President and CEO, Beebe Medical Center
3
WHITE PAPER
The tool has already been revised to reflect the new CMS proposal.
There’s a reason the tool is so valuable, as we will see. As with other payment methodologies, things get complicated when you start digging.
For starters, each clinical measure and satisfaction domain can earn a maximum of 10 points. The VBP scoring methodology assesses hospitals on both achievement (where performance must reach or exceed a measure-specific threshold) and improvement (where performance is compared to the prior year’s performance). The facility receives the higher of the two scores (improvement or achievement) for each measure. By awarding points in this manner, the model aims to ensure that poor-performing facilities are not doomed to a cycle of continued failure, but instead are incentivized to improve.
To assess achievement, a threshold and benchmark is set for each measure; if a hospital hits the threshold for that measure, it receives one VBP point. If the hospital performs at the benchmark, it receives 10 VBP points for that measure.
To assess improvement, the facility’s performance during the baseline year is determined and VBP points are assigned for improvement from the baseline to the facility’s performance in the assessment year for each measure. (For the first year of the program, however, CMS will use a nine-month baseline period July 1, 2009 through March 31, 2010. The performance period on which scores will be based will be July 1, 2011 to March 31, 2012.)
What’s in the MeasuresThe National Hospital Quality Measures included in the clinical component of the program have been refined, reflecting the fact that a number of measures originally proposed are already “topped out,” leaving little room for additional improvement (See list, page 4).
The HCAHPS portion remains the same eight domains, weighted equally. In addition to earning points on achievement and improvement, hospitals can also earn up to 20 consistency points in the satisfaction domain. Consistency points measure how well hospitals are meeting achievement thresholds across the eight HCAHPS dimensions. To receive all 20 points, hospitals must be performing above the 50th percentile on all HCAHPS measures.
The points for the clinical measures are added to calculate a clinical score; the points for the satisfaction measures are added to calculate a satisfaction score.
The clinical and satisfaction scores combine with a 70/30% weighting, respectively, to establish the hospital’s overall VBP score, also referred to as its Total Performance Score. That score is then used to calculate a percentage score representing VBP points earned out of total possible VBP points.
Where to Focus on Improving
Believe it or not, hidden in the calculus are some opportunities. Everyone in the hospital community is asking how their hospitals can earn the greatest number of VBP points. But the better question is, “For our hospital, out of all the measures that present opportunities for improvement, which are the best candidates for improvement initiatives?”

4
HCAHPS-1 Communication with nurses
HCAHPS-2 Communication with doctors
HCAHPS-3 Clean/quiet room
HCAHPS-4 Responsiveness of hospital staff
HCAHPS-5 New medicines explained
HCAHPS-6 Pain management
HCAHPS-7 Discharge information
HCAHPS-8 Overall hospital rating
Satisfaction Measures
AMI-7A Fibrinolytic therapy received within 30 minutes of hospital arrival
AMI-8A Primary PCI received within 90 minutes of hospital arrival
HF-1 Heart failure patients discharged with written instructions or educational materials
PN-3B Blood culture performed in the ED prior to initial antibiotics
PN-6 Initial antibiotic selection for community-acquired pneumonia in immunocompetent patients
SCIP-INF-1A Prophylactic antibiotics received within one hour prior to surgical incision – overall rate
SCIP-INF-2 Prophylactic antibiotics for surgical patients selected
SCIP-INF-3A Prophylactic antibiotics discontinued within 24 hours after surgery end time
SCIP-INF-4 Cardiac surgery patients with controlled 6 a.m. postoperative serum glucose
SCIP-CARD-2 Surgery patients on a beta blocker prior to arrival who received a beta blocker during the perioperative period
SCIP-VTE-1 Surgery patients with recommended venous thromboembolism (VTE) prophylaxis ordered
SCIP-VTE-2 Surgery patients who received appropriate VTE prophylaxis within 24 hours prior to surgery to 24 hours after surgery
Clinical Measures
CMS’ Proposed Value-based Purchasing Measures
Under the VBP methodology, scores earned for each clinical measure are weighted equally in calculating the performance score. The same holds true on the HCAHPS side. So a measure earning a high number of VBP points will contribute more to the hospital’s total VBP points than a measure earning a low number of VBP points. However, measures with low scores offer a high potential for earning points on improvement, which can drive higher VBP performance scores.
But consider, too, that quality improvement initiatives are expensive and time-consuming. Under VBP, the rewards for improving scores on a measure depend to a great extent on where a hospital’s performance falls between the baseline performance and the benchmark and how far those two are apart. Knowing where higher scores will translate into higher VBP points will enable hospital leadership to be strategic in targeting the opportunities for improvement and deploying the necessary resources to attain goals.

5
WHITE PAPER
Selecting Measures for ImprovementSo here is some advice on where to focus improvement efforts to win under VBP:
�� Assess your exposure. Examine your hospital’s performance on each measure to determine which measures are driving the biggest losses. These become your hospital’s candidate measures for improvement. Generally speaking, hospitals perform better on the clinical measures than they perform on the HCAHPS domains. As a result, there tend to be more dollars lost and therefore more opportunities to boost VBP scores by making improvement investments on the satisfaction side. That said, it also tends to be considerably harder to move the needle on the satisfaction measures than on the clinical measures.
�� Identify candidate measures for improvement. Measures that have low mean scores and a wide distribution of rates offer the most opportunity for improvement. On the clinical side, the measures that meet that description include AMI 8A, fibrinolytic therapy and percutaneous coronary intervention (PCI) timing for patients with a heart attack; and SCIP measures addressing antibiotic timing after surgery.
�� Bring in the experts. Engage your hospital’s quality improvement, patient satisfaction professionals and other key stakeholders who readily understand that some aspects of care lend themselves more readily to quality improvement interventions than others, and who can identify the effort required to improve candidate measures. Improving discharge instructions for heart failure patients is far less complicated than improving time-to-PCI, for example. Dissect your performance at the measure level, employing patient-level analysis to pinpoint and understand the factors that shape your hospital’s rates.
�� Use a return-on-investment approach to target specific measures. With the understanding that you can’t improve everything at once, identify the potential rewards for improving or hitting the attainment threshold on each measure. Prioritize interventions according to size of the opportunity, the investment required and the net effect of incremental improvement on the bottom line.
With all the challenges of running a hospital today, leaders understandably prioritize their investment of time and resources. Given that payments aren’t affected until fiscal year 2013, value-based purchasing may sound like a challenge that can be safely placed on a back burner. But like that car passing you on the right, VBP is closer than it appears. Recall that each measure is scored on attainment and improvement, and that scoring on improvement calls for comparing the hospital’s rate in the performance period (July 1, 2011 - March 31, 2012) to a hospital’s rate in the baseline period, which has already taken place.
Therefore, for all intents and purposes, VBP is already here, so now is the time to focus energy on winning back your full reimbursement under Medicare.
But Wait, There’s MoreHospital value-based purchasing is just one piece of the Centers for Medicare and Medicaid Services’ plans to shift from volume-based to quality-based payment. The Patient Protection and Affordable Care Act calls for additional programs to be implemented that also will put a portion of a hospital’s Medicare revenue at risk, should the hospital’s performance fall short of targets. While certain details about the scope and timeline of these initiatives have yet to be worked out, their overarching frameworks are well established.
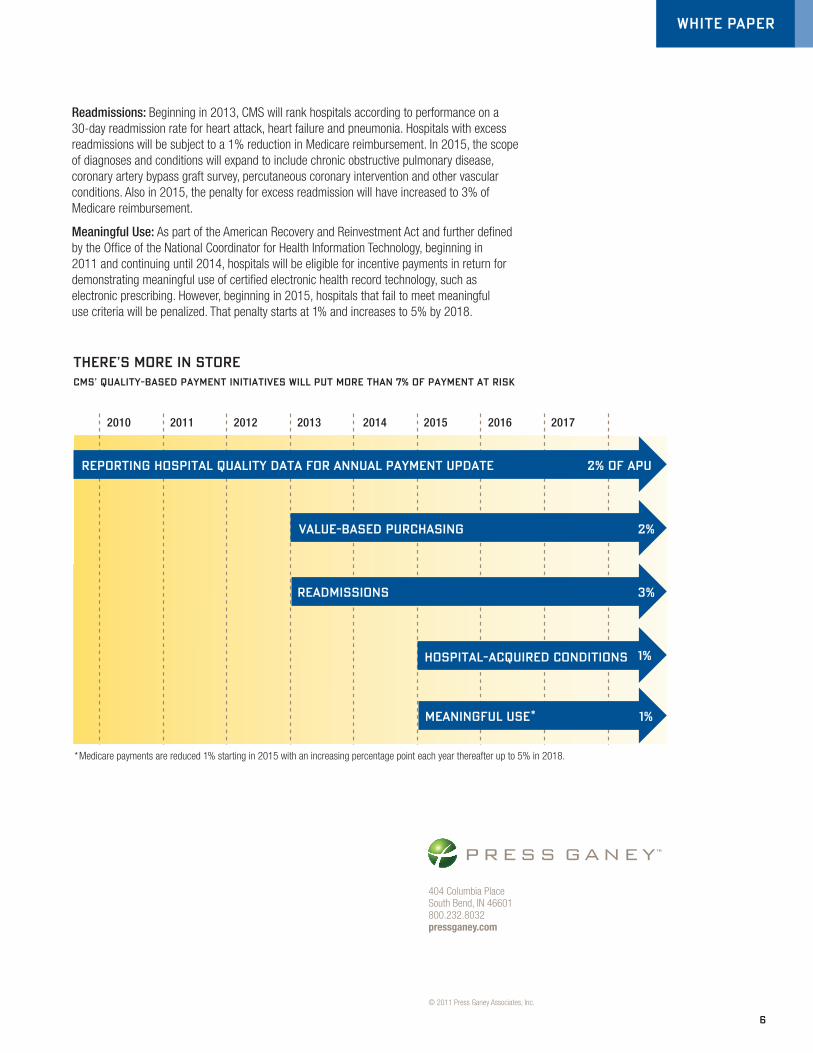
All told, these programs will put (gulp) more than 7% of every hospital’s Medicare payments at risk.
Hospital-acquired Conditions (HACs): Already, hospitals are not reimbursed for certain preventable conditions acquired in the hospital. But beginning in 2015, CMS will rank hospitals on their risk-adjusted rates for certain HACs. Hospitals in the top quartile will be subject to a 1% payment penalty under Medicare. That means that 25% of all hospitals will lose 1% of their baseline MS-DRG payments.
404 Columbia Place South Bend, IN 46601 800.232.8032 pressganey.com
© 2011 Press Ganey Associates, Inc.
WHITE PAPER
6
THERE’S MORE IN STORECMS’ QUALITY-BASED PAYMENT INITIATIVES WILL PUT MORE THAN 7% OF PAYMENT AT RISK
2010 2011 2012 2013 2014 2015 2016 2017
REPORTING HOSPITAL QUALITY DATA FOR ANNUAL PAYMENT UPDATE 2% OF APU
VALUE-BASED PURCHASING 2%
READMISSIONS 3%
HOSPITAL-ACQUIRED CONDITIONS 1%
MEANINGFUL USE* 1%
* Medicare payments are reduced 1% starting in 2015 with an increasing percentage point each year thereafter up to 5% in 2018.
Readmissions: Beginning in 2013, CMS will rank hospitals according to performance on a 30-day readmission rate for heart attack, heart failure and pneumonia. Hospitals with excess readmissions will be subject to a 1% reduction in Medicare reimbursement. In 2015, the scope of diagnoses and conditions will expand to include chronic obstructive pulmonary disease, coronary artery bypass graft survey, percutaneous coronary intervention and other vascular conditions. Also in 2015, the penalty for excess readmission will have increased to 3% of Medicare reimbursement.
Meaningful Use: As part of the American Recovery and Reinvestment Act and further defined by the Office of the National Coordinator for Health Information Technology, beginning in 2011 and continuing until 2014, hospitals will be eligible for incentive payments in return for demonstrating meaningful use of certified electronic health record technology, such as electronic prescribing. However, beginning in 2015, hospitals that fail to meet meaningful use criteria will be penalized. That penalty starts at 1% and increases to 5% by 2018.