revision and updates to the environmental dredging …passaic.sharepointspace.com/public...
TRANSCRIPT
Revision and Updates pto the Environmental Dredging Pilot Study
Lower Passaic River Restoration Project
Project Delivery Team MeetingProject Delivery Team Meeting March 4, 2009
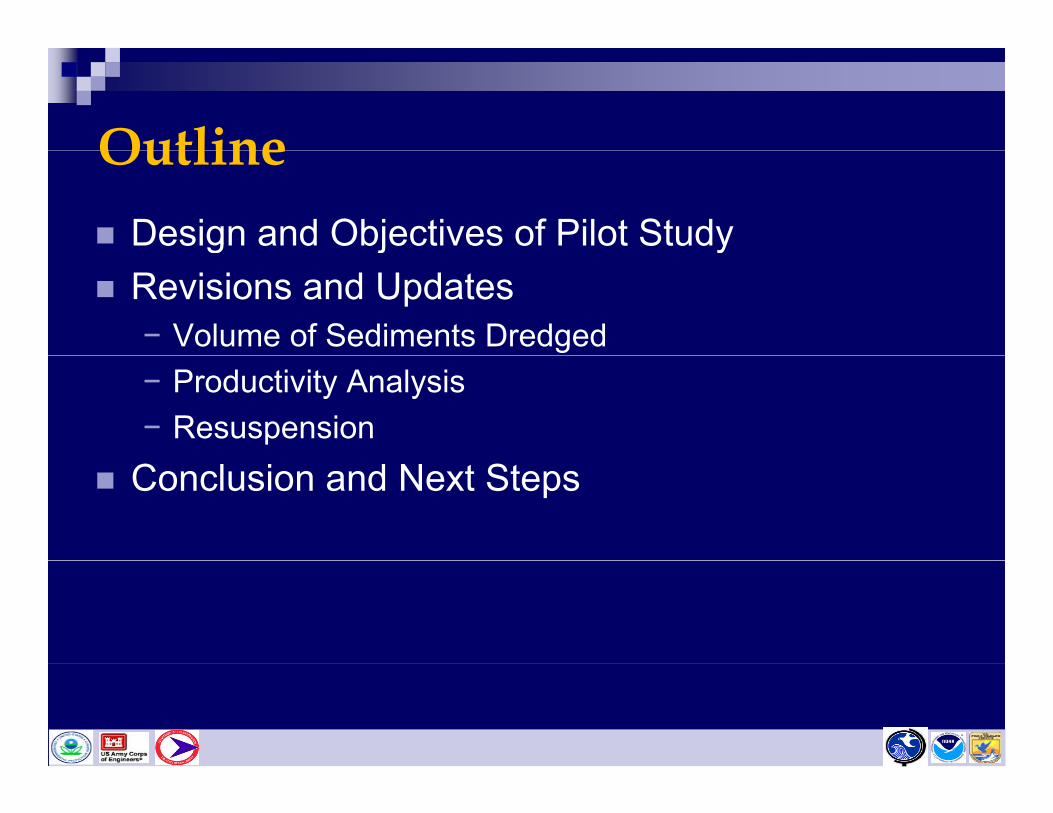
OutlineOutlineDesign and Objectives of Pilot Studyg j yRevisions and Updates− Volume of Sediments Dredged− Productivity Analysis− Resuspension
Conclusion and Next Steps
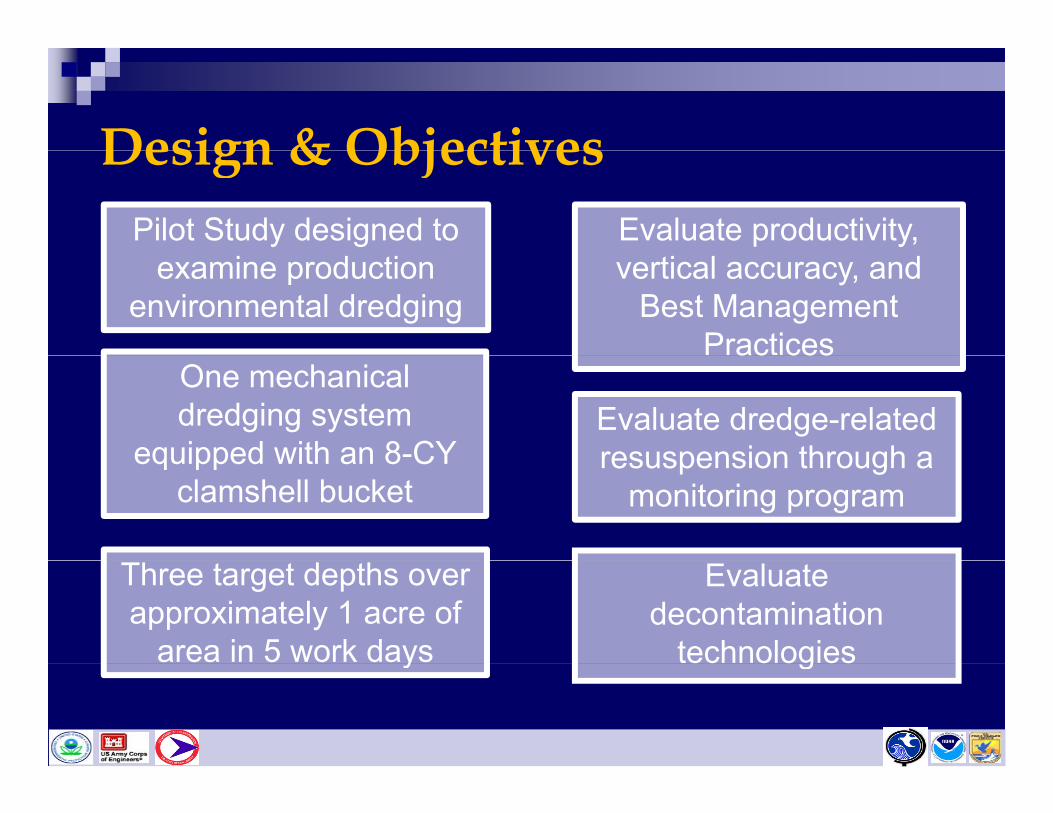
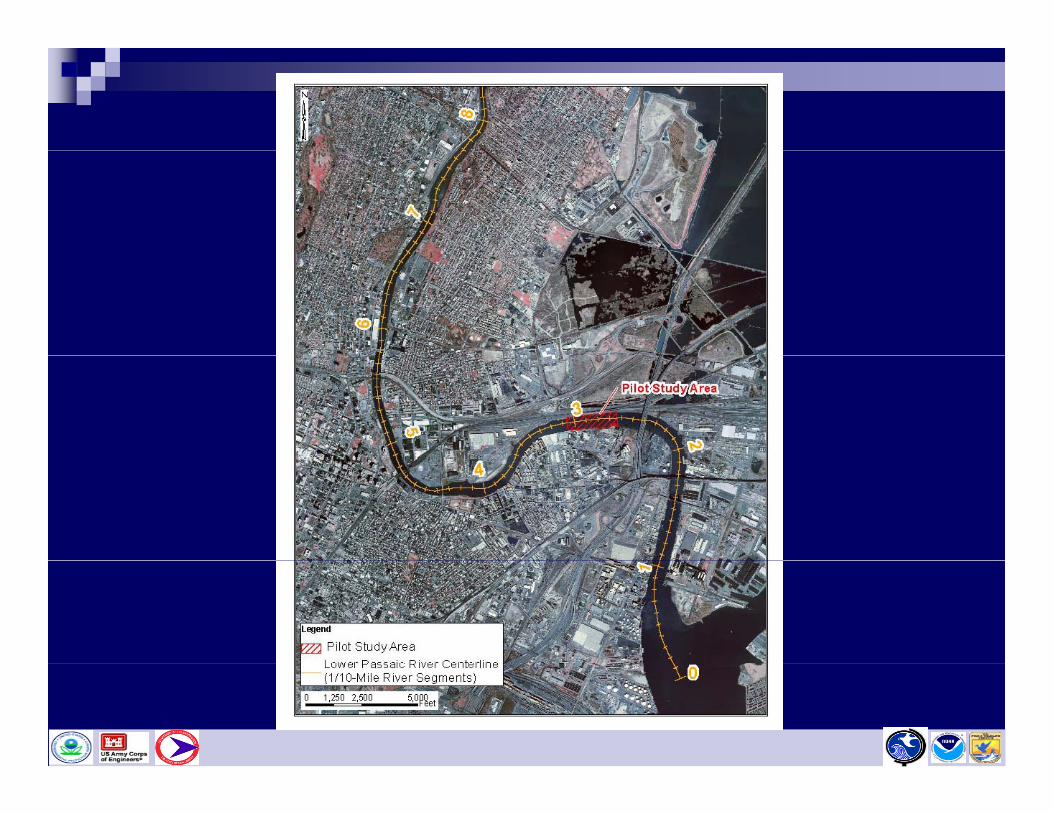
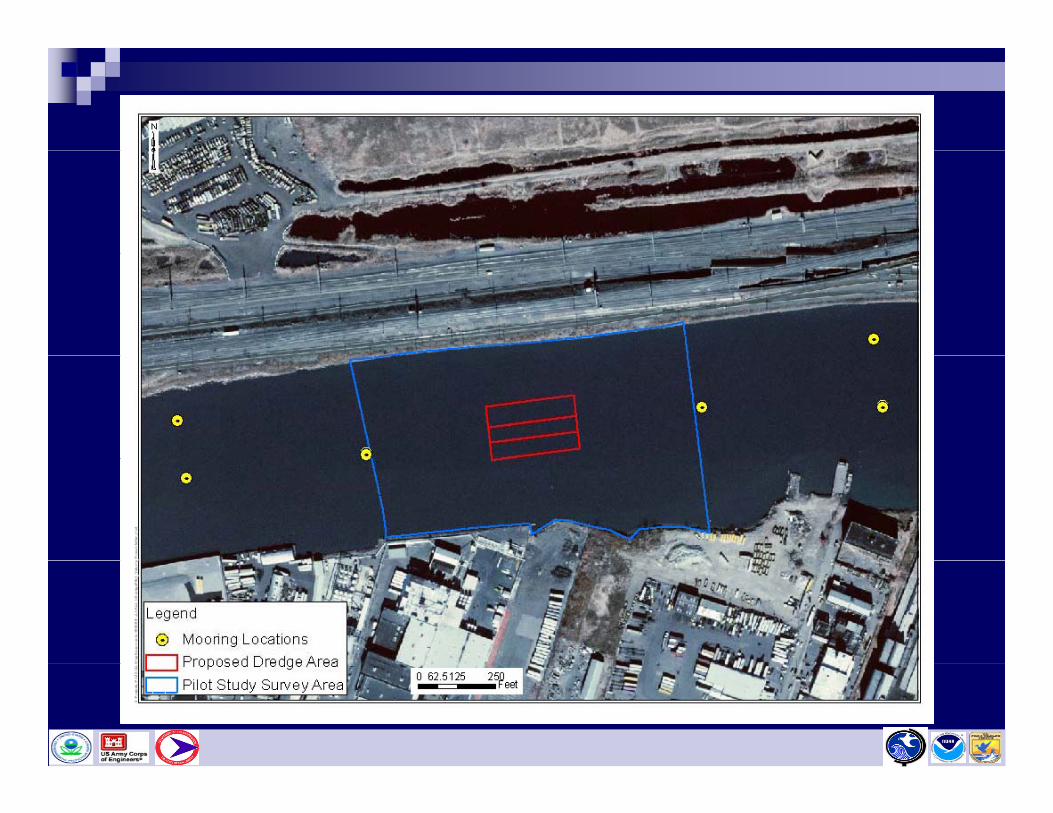
Design & ObjectivesDesign & ObjectivesPilot Study designed to Evaluate productivity,
examine production environmental dredging
vertical accuracy, and Best Management
Practices
Evaluate dredge-related resuspension through a
One mechanical dredging system
equipped with an 8-CY
ac ces
resuspension through a monitoring program
equipped with an 8 CY clamshell bucket
Three target depths over approximately 1 acre of
area in 5 work days
Evaluate decontamination
technologiesy ec o og es
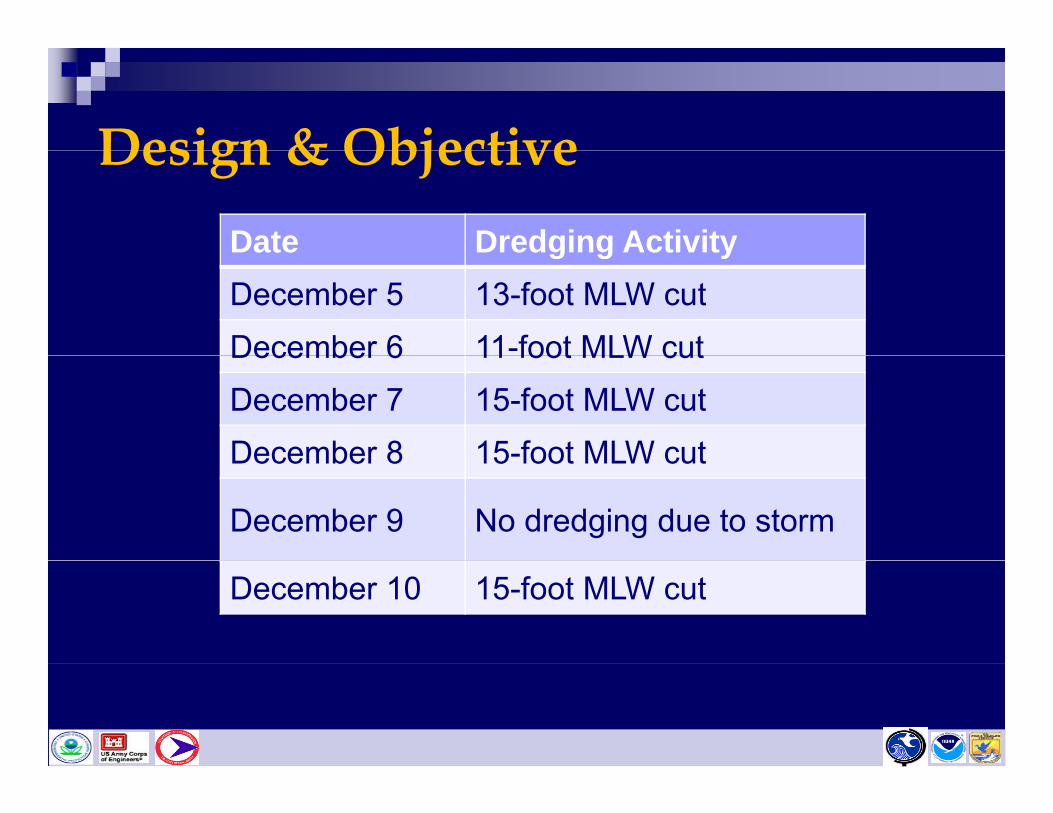
Design & ObjectiveDesign & ObjectiveDate Dredging Activityg g yDecember 5 13-foot MLW cutDecember 6 11-foot MLW cutDecember 6 11 foot MLW cut December 7 15-foot MLW cut December 8 15-foot MLW cutDecember 8 15 foot MLW cut
December 9 No dredging due to storm
December 10 15-foot MLW cut
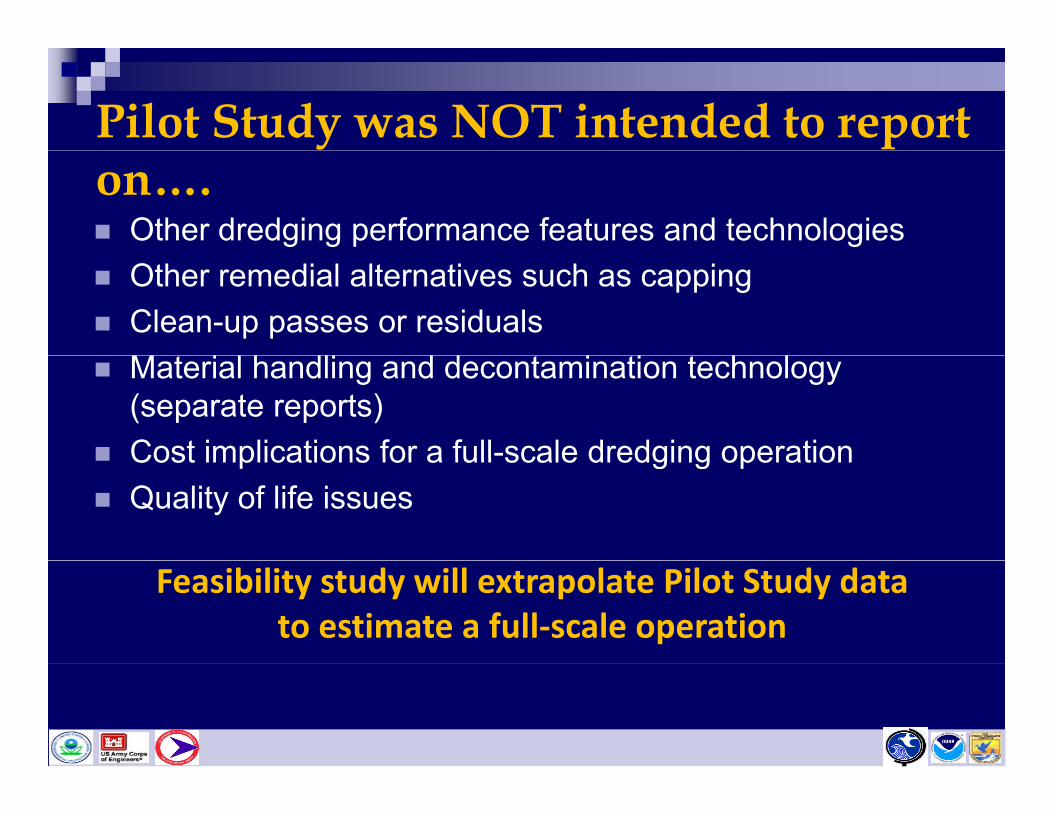
Pilot Study was NOT intended to report on….
Other dredging performance features and technologiesOther remedial alternatives such as cappingClean-up passes or residualsM i l h dli d d i i h lMaterial handling and decontamination technology (separate reports)Cost implications for a full-scale dredging operationCost implications for a full scale dredging operationQuality of life issues
Feasibility study will extrapolate Pilot Study data to estimate a full‐scale operation
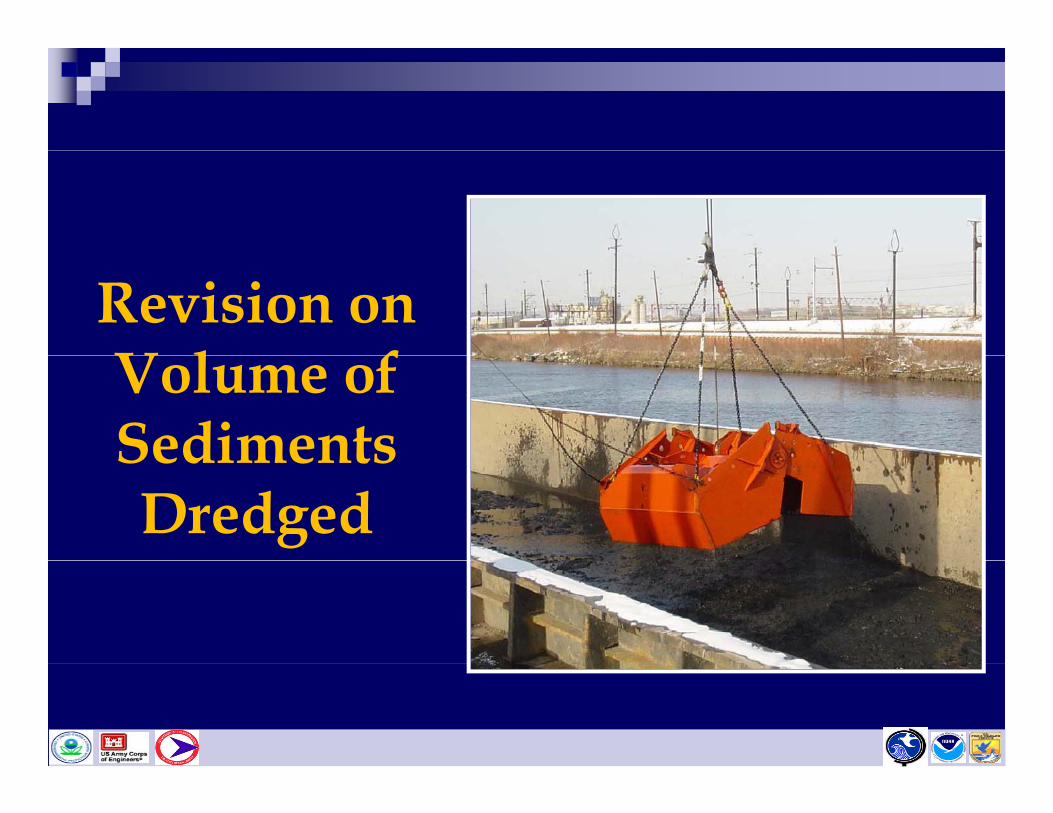
Revision on V l f Volume of Sediments Sediments Dredged
Revision on Volume of Sediments DredgedRevision on Volume of Sediments Dredged
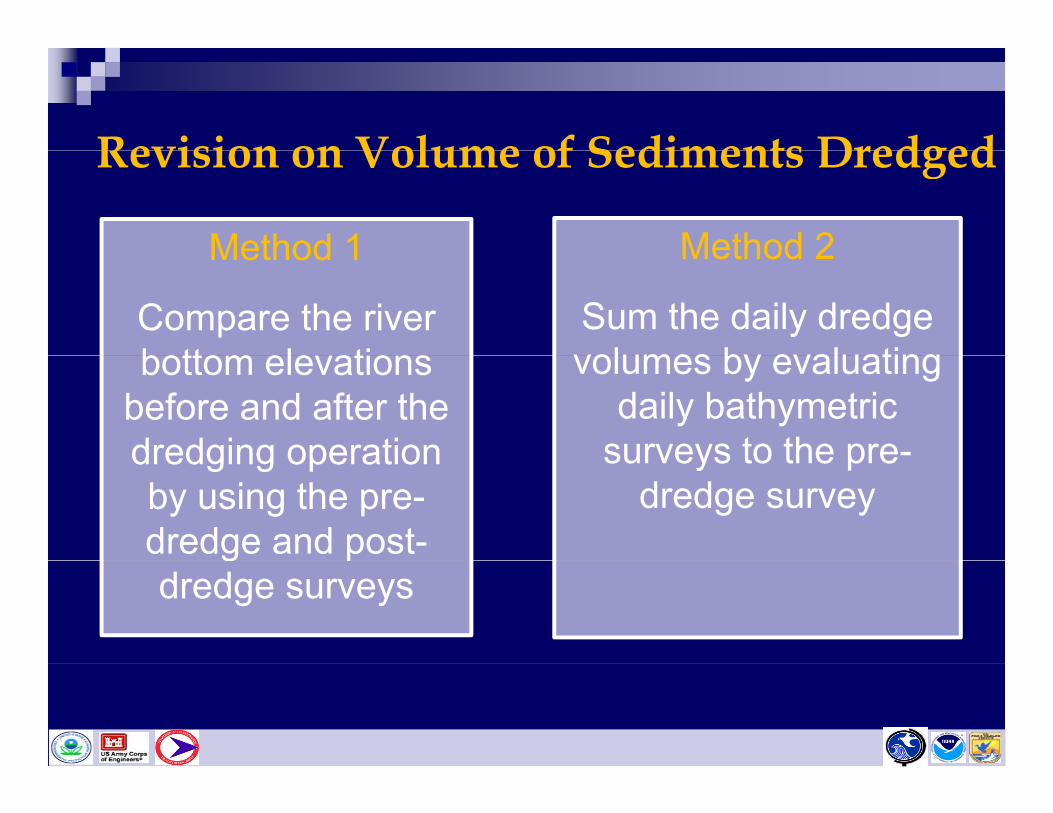
Method 1 Method 2Method 1
Compare the river bottom ele ations
Method 2
Sum the daily dredge volumes by evaluatingbottom elevations
before and after the dredging operation
volumes by evaluating daily bathymetric
surveys to the pre-dredging operation by using the pre-dredge and post-
surveys to the predredge survey
g pdredge surveys

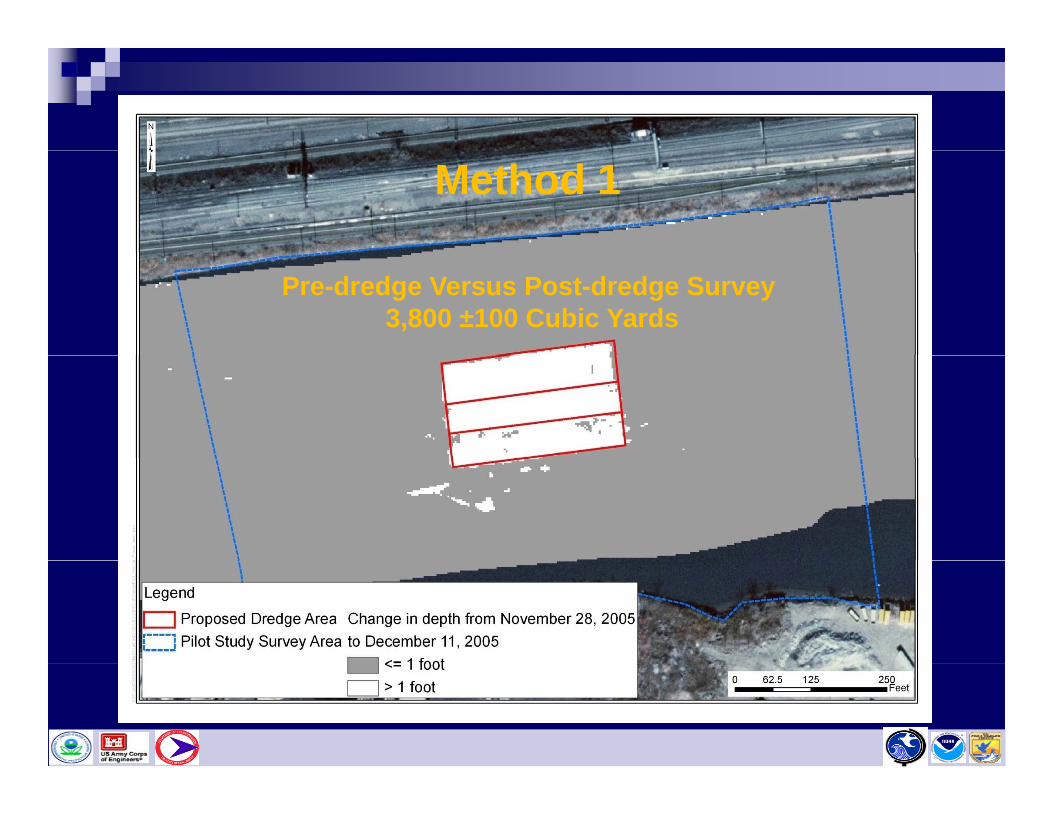
Method 1
Pre-dredge Versus Post-dredge Survey3,800 ±100 Cubic Yards
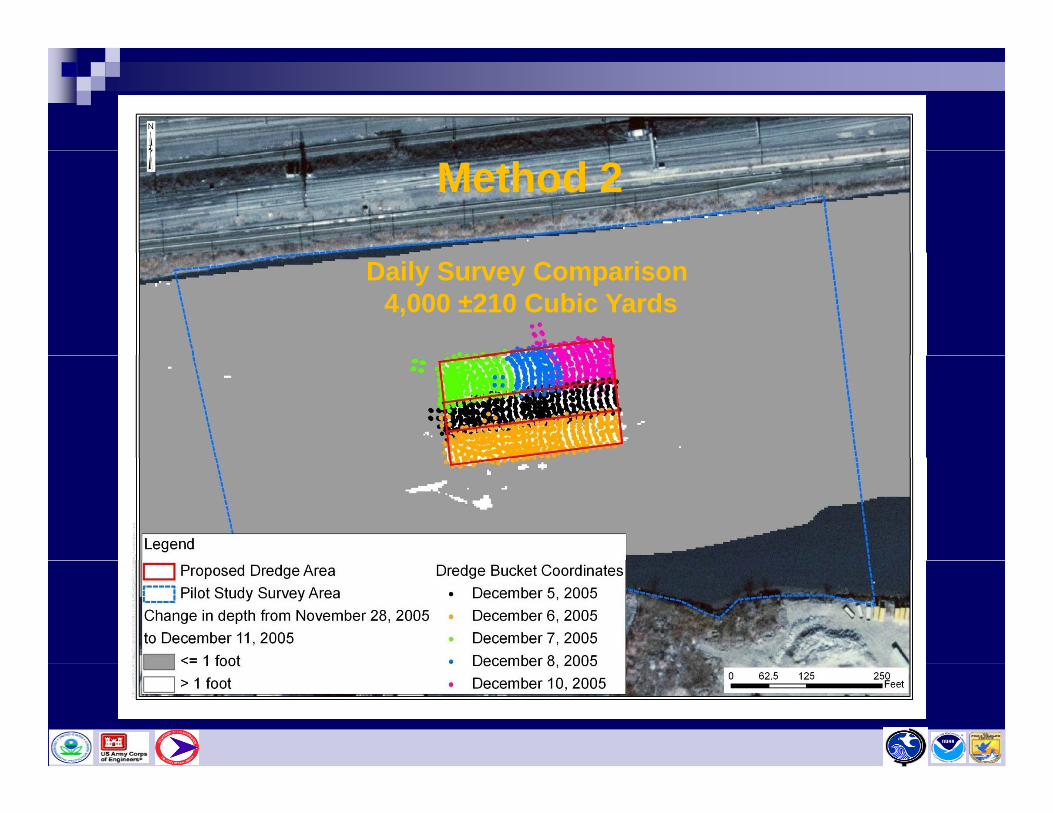
Method 2
Daily Survey Comparison 4,000 ±210 Cubic Yards
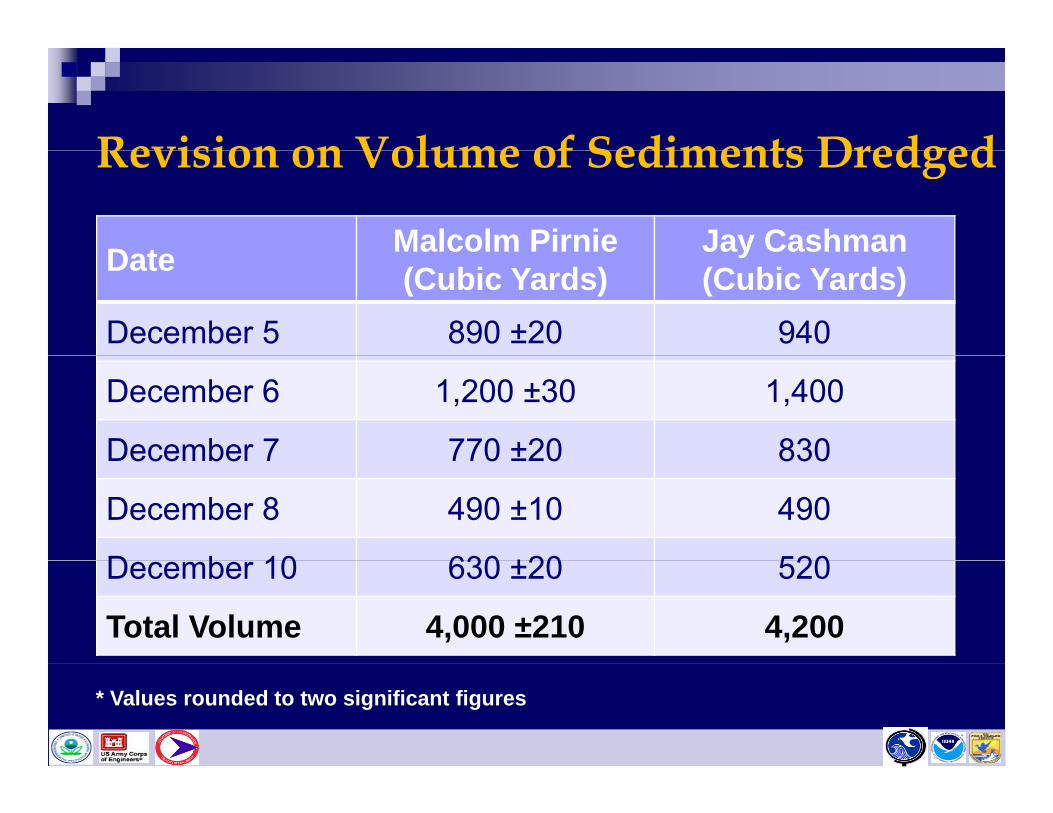
Revision on Volume of Sediments Dredged
D t Malcolm Pirnie Jay Cashman
Revision on Volume of Sediments Dredged
Date (Cubic Yards)y
(Cubic Yards)December 5 890 ±20 940
December 6 1,200 ±30 1,400
December 7 770 ±20 830December 7 770 ±20 830
December 8 490 ±10 490
D b 10 630 ±20 520December 10 630 ±20 520
Total Volume 4,000 ±210 4,200
* Values rounded to two significant figures

Revision of Revision of Productivity
A l iAnalysis
Revision of Productivity AnalysisDaily surveys were used to estimate
Revision of Productivity Analysisy y
productivityRevised work time breakdown based on ClamVision data for actual dredge timeLinked cycle time (ClamVision data) to the work time analysis to separate equipment movement from dredge time

Revision of Productivity AnalysisEvaluation decreased dredge time and
i d i t t hi h ill
Revision of Productivity Analysis
increased equipment movement, which will cause an increase in productivity.
Parameter Draft Dredge Pilot Value
Revised Value
Average Dredging Time 6.2 hours 5.0 hours
Average Working Day 11 hours 10 5 hoursAverage Working Day 11 hours 10.5 hours
Work Day minus Client Standby 9.6 hours 9.2 hoursStandby
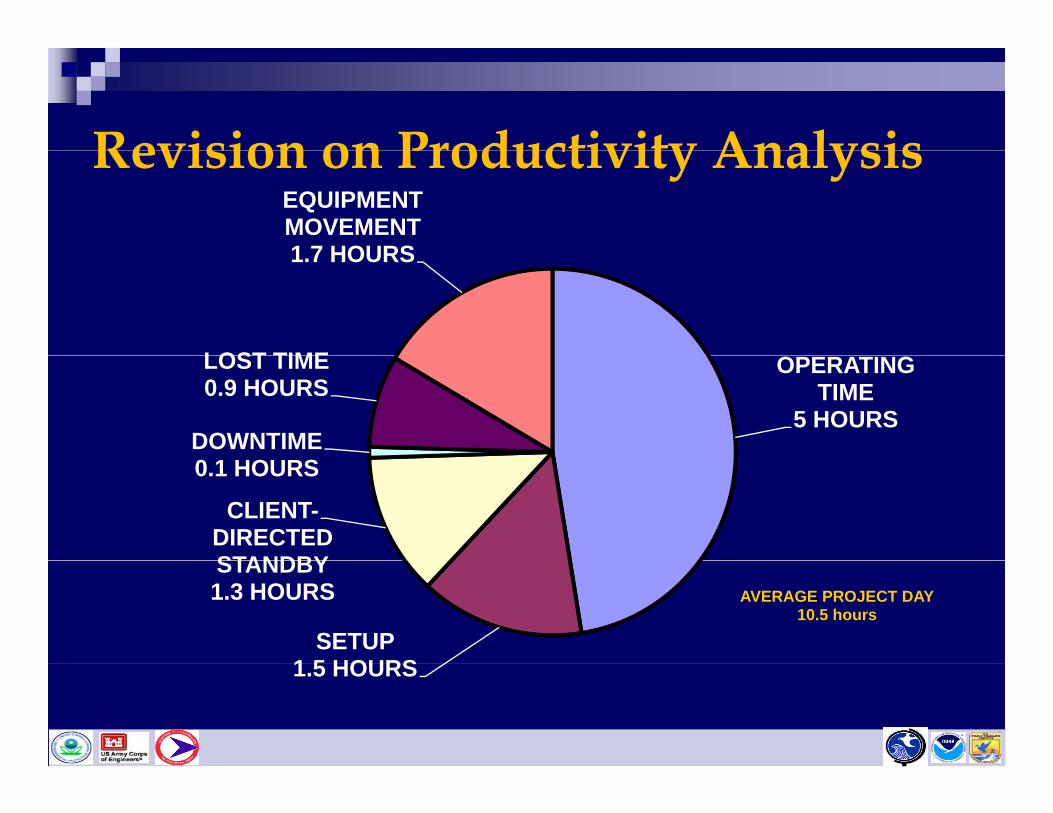
Revision on Productivity AnalysisRevision on Productivity AnalysisEQUIPMENT MOVEMENT1 7 HOURS
LOST TIME
1.7 HOURS
OPERATING TIME
5 HOURSDOWNTIME
LOST TIME 0.9 HOURS
CLIENT-DIRECTEDSTANDBY
0.1 HOURS
SETUP1 5 HOURS
STANDBY1.3 HOURS AVERAGE PROJECT DAY
10.5 hours
1.5 HOURS
Revision of Productivity Analysis
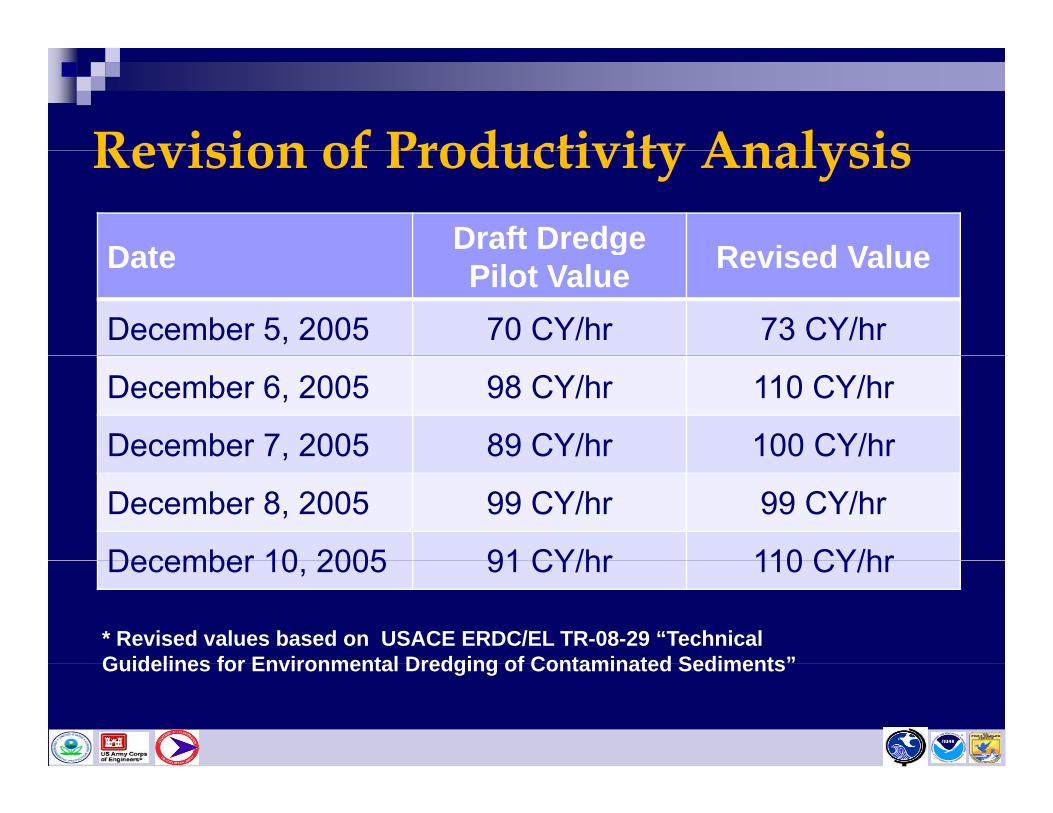
Date Draft Dredge Revised Value
Revision of Productivity Analysis
Date gPilot Value Revised Value
December 5, 2005 70 CY/hr 73 CY/hr
December 6, 2005 98 CY/hr 110 CY/hr
December 7, 2005 89 CY/hr 100 CY/hr,
December 8, 2005 99 CY/hr 99 CY/hr
December 10 2005 91 CY/hr 110 CY/hrDecember 10, 2005 91 CY/hr 110 CY/hr
* Revised values based on USACE ERDC/EL TR-08-29 “Technical Guidelines for Environmental Dredging of Contaminated Sediments”Guidelines for Environmental Dredging of Contaminated Sediments
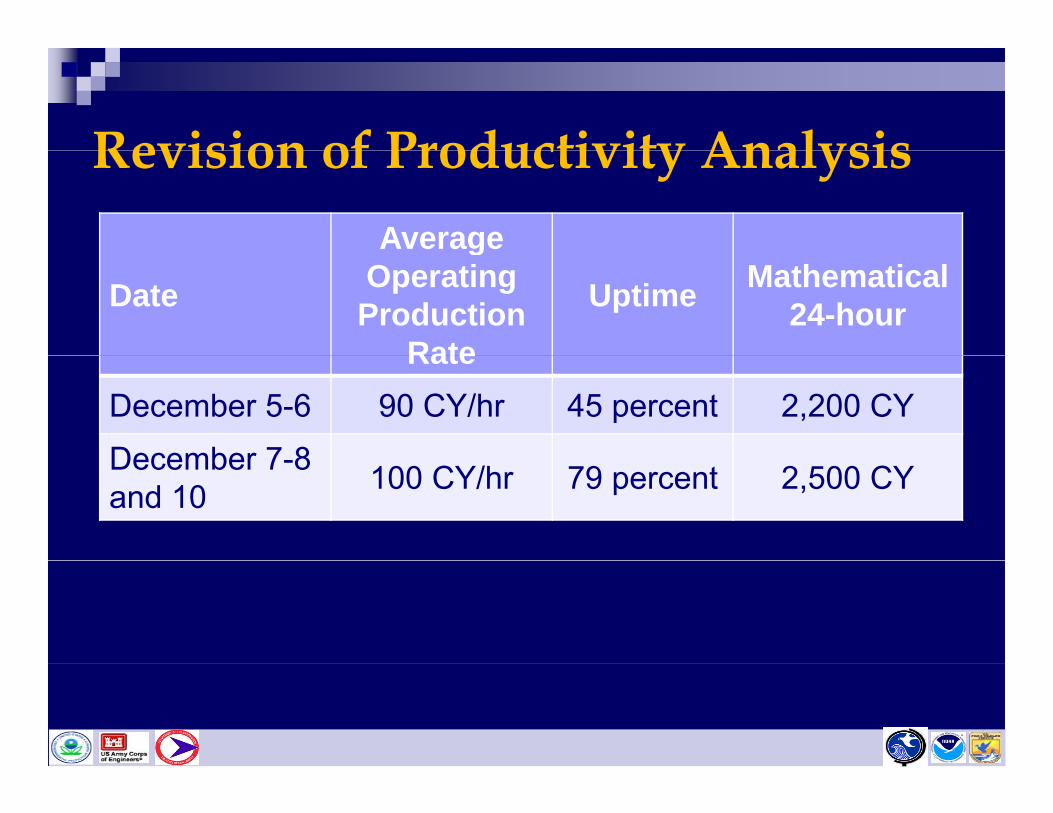
Revision of Productivity AnalysisAverage
Revision of Productivity Analysis
Date
gOperatingProduction
Rate
Uptime Mathematical24-hour
RateDecember 5-6 90 CY/hr 45 percent 2,200 CYDecember 7 8December 7-8and 10 100 CY/hr 79 percent 2,500 CY
Revision of Revision of Resuspension
A l iAnalysis
Revision of Resuspension Revision of Resuspension
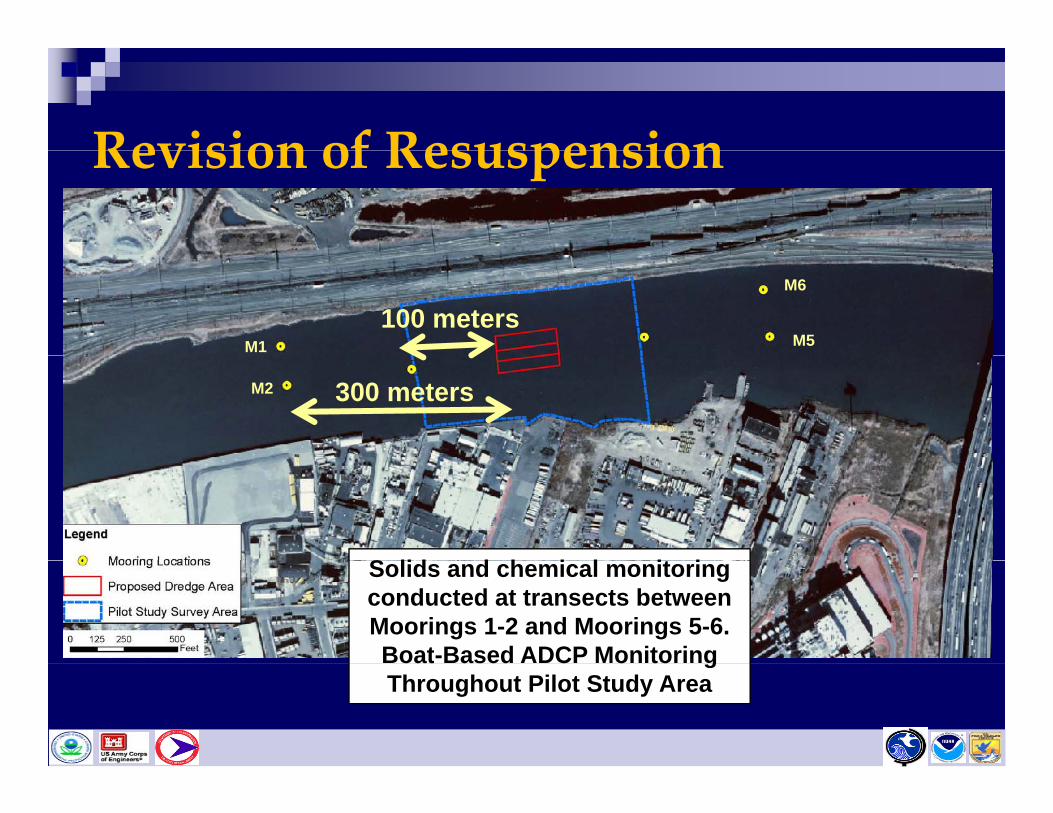
100 metersM1 M5
M6
300 metersM2
S lid d h i l it iSolids and chemical monitoring conducted at transects between Moorings 1-2 and Moorings 5-6.Boat-Based ADCP Monitoring oat ased C o to gThroughout Pilot Study Area
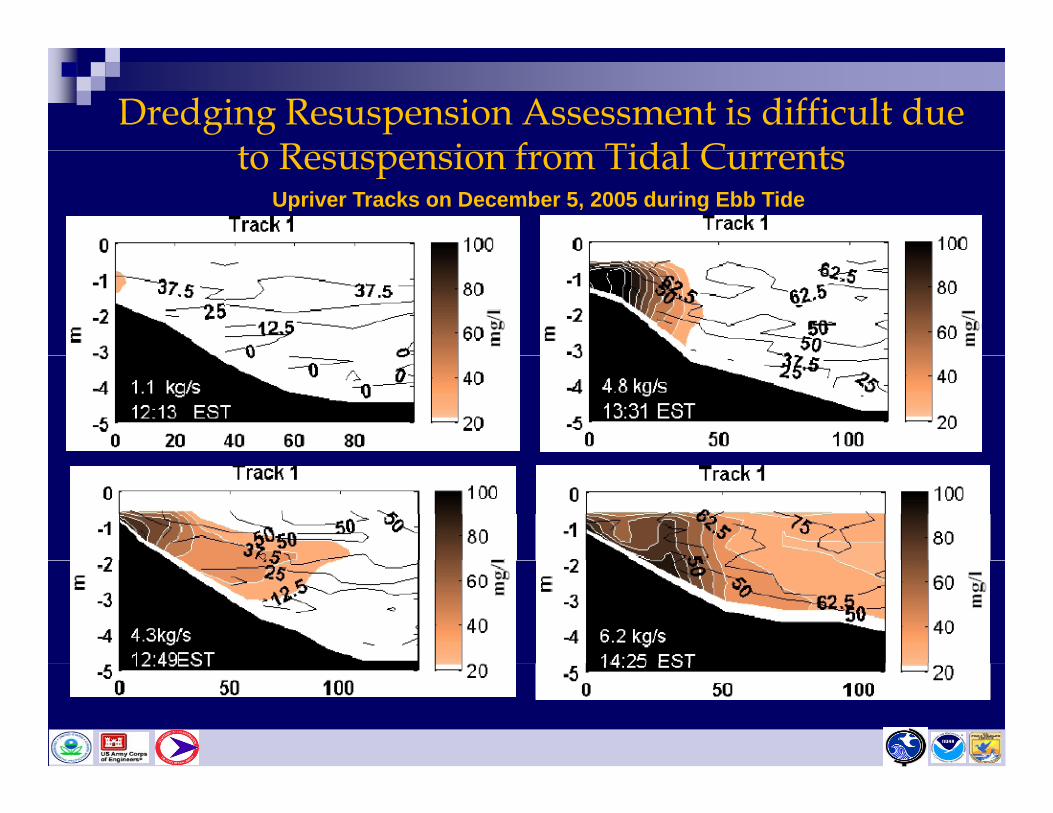
Dredging Resuspension Assessment is difficult due t R i f Tid l C tto Resuspension from Tidal Currents
Upriver Tracks on December 5, 2005 during Ebb Tide
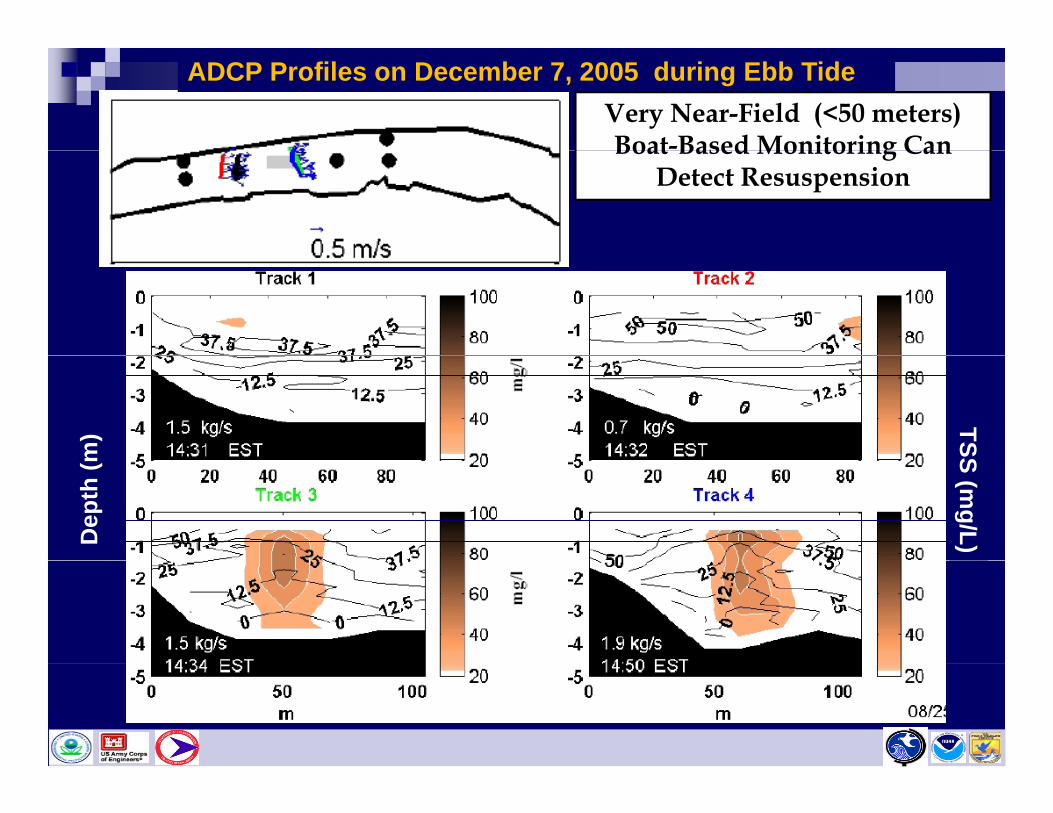
ADCP Profiles on December 7, 2005 during Ebb TideVery Near-Field (<50 meters) Boat-Based Monitoring Can Boat Based Monitoring Can
Detect Resuspension
m) TS
Dep
th (m
S (mg/L)
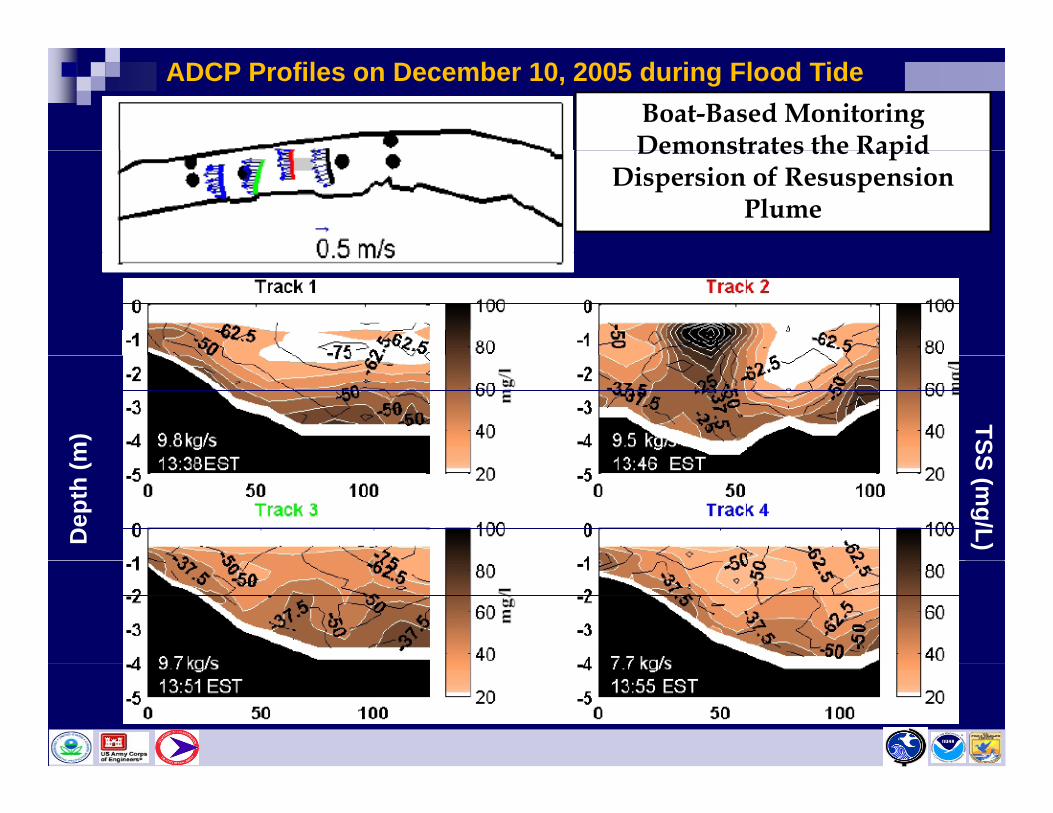
ADCP Profiles on December 10, 2005 during Flood TideBoat-Based Monitoring Demonstrates the Rapid Demonstrates the Rapid
Dispersion of Resuspension Plume
m)
TSSD
epth
(mS (m
g/L)
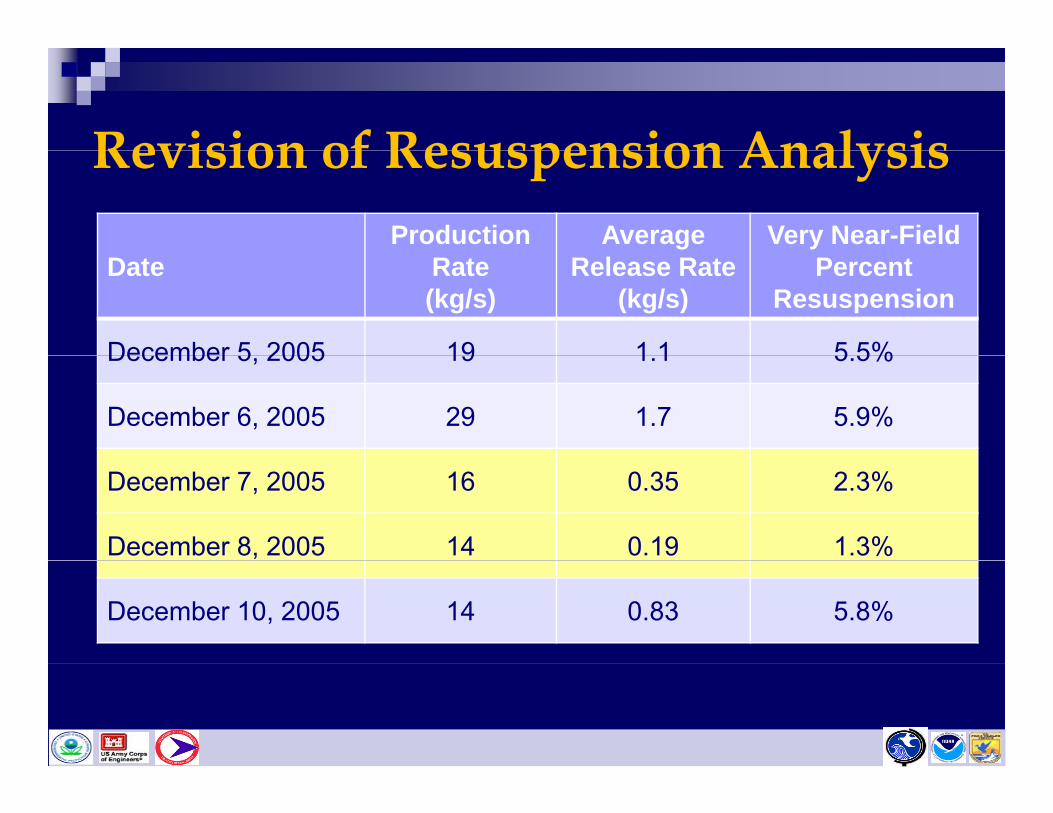
Revision of Resuspension AnalysisRevision of Resuspension AnalysisProduction Average Very Near-Field
Date Rate (kg/s)
Release Rate(kg/s)
PercentResuspension
December 5 2005 19 1 1 5 5%December 5, 2005 19 1.1 5.5%
December 6, 2005 29 1.7 5.9%
December 7, 2005 16 0.35 2.3%
December 8, 2005 14 0.19 1.3%
December 10, 2005 14 0.83 5.8%
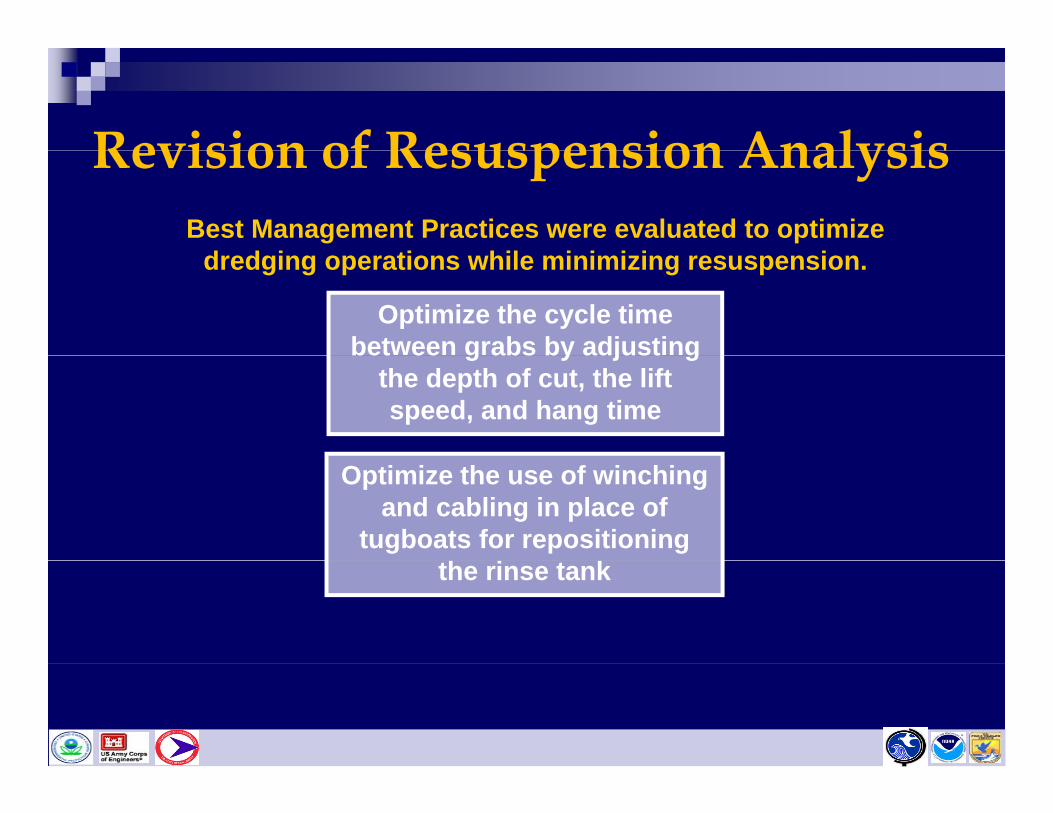
Revision of Resuspension AnalysisRevision of Resuspension AnalysisBest Management Practices were evaluated to optimize
d d i ti hil i i i i idredging operations while minimizing resuspension.
Optimize the cycle time between grabs by adjusting bet ee g abs by adjust g
the depth of cut, the lift speed, and hang time
Optimize the use of winching and cabling in place of
tugboats for repositioning the rinse tank
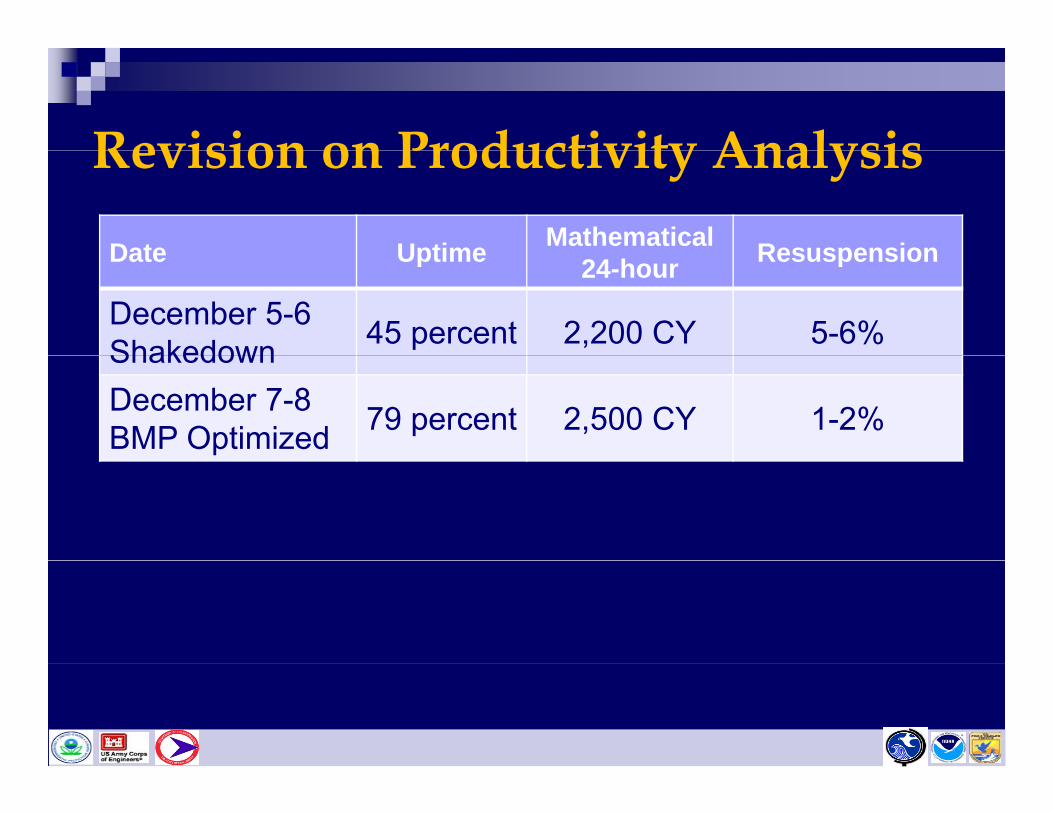
Revision on Productivity Analysis
Date Uptime Mathematical Resuspension
Revision on Productivity Analysis
Date Uptime 24-hour Resuspension
December 5-6Shakedown 45 percent 2,200 CY 5-6%ShakedownDecember 7-8BMP Optimized 79 percent 2,500 CY 1-2%
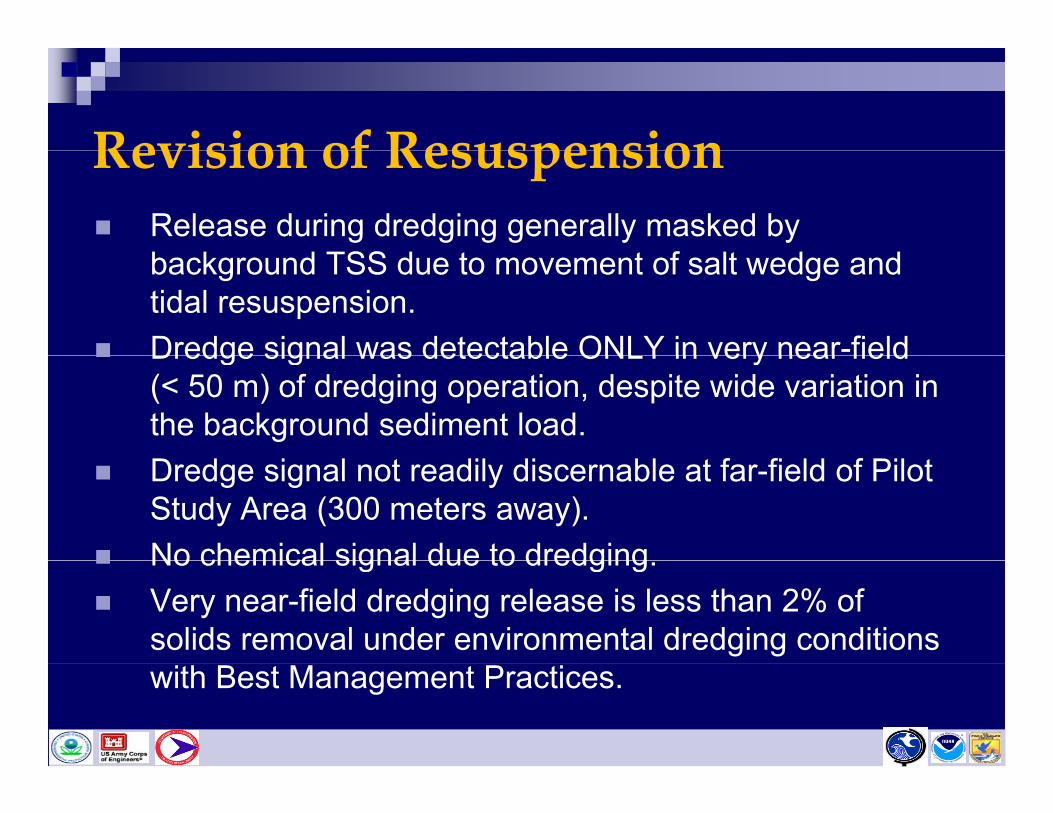
Revision of ResuspensionRevision of ResuspensionRelease during dredging generally masked by b k d TSS d t t f lt d dbackground TSS due to movement of salt wedge and tidal resuspension.Dredge signal was detectable ONLY in very near-fieldDredge signal was detectable ONLY in very near field (< 50 m) of dredging operation, despite wide variation in the background sediment load.
f f fDredge signal not readily discernable at far-field of Pilot Study Area (300 meters away).No chemical signal due to dredgingNo chemical signal due to dredging.Very near-field dredging release is less than 2% of solids removal under environmental dredging conditions with Best Management Practices.
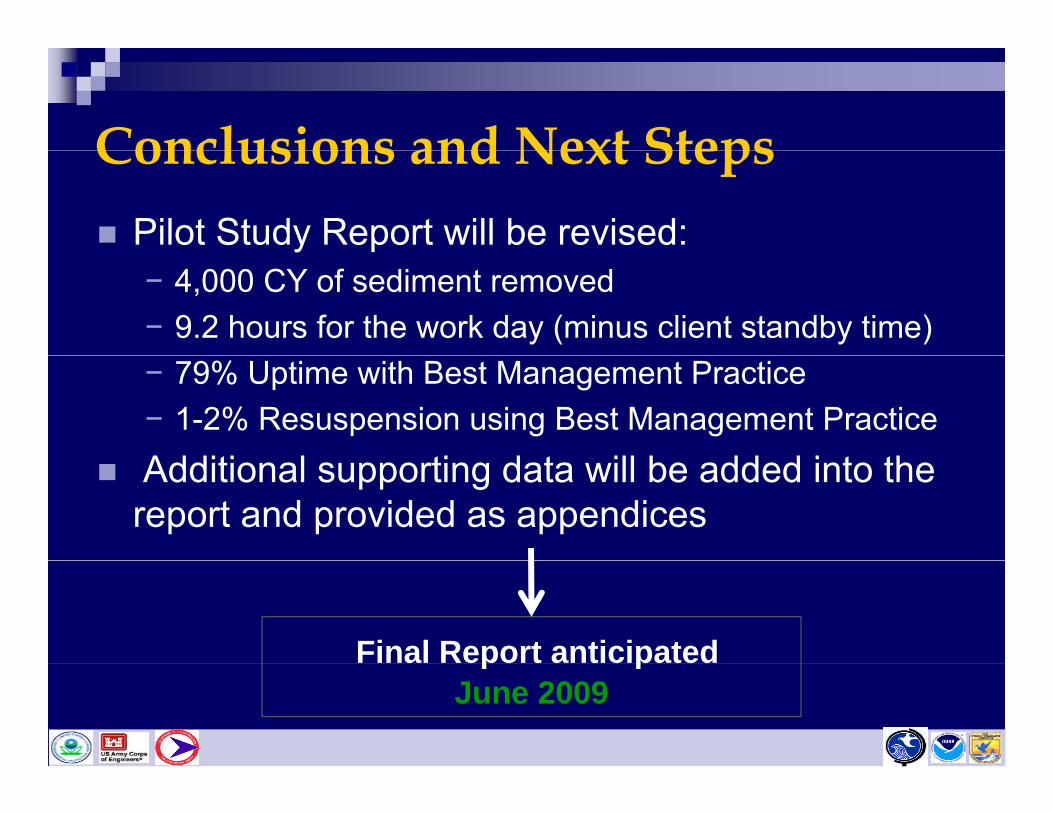
Conclusions and Next StepsConclusions and Next StepsPilot Study Report will be revised: − 4,000 CY of sediment removed− 9.2 hours for the work day (minus client standby time)− 79% Uptime with Best Management Practice− 1-2% Resuspension using Best Management PracticeAdditi l ti d t ill b dd d i t thAdditional supporting data will be added into the report and provided as appendices
Final Report anticipated a epo t a t c patedJune 2009