recognition of renal cell carcinoma by cd8+ and …...recognition of renal cell carcinoma by cd8+...
TRANSCRIPT

Recognition of renal cell carcinoma by
CD8+ and CD4+ TCR-engineered T lymphocytes
Dissertation der Fakultät für Biologie der
Ludwig-Maximilians-Universität München
vorgelegt von
Adriana Turqueti Neves
aus Porto Alegre, Brasil ien
München, 26. August 2010
Erstgutachterin: Prof. Dr. Elisabeth Weiß
Zweitgutachter: PD. Dr. rer. nat. Daniel Krappmann
Drittgutachter: PD. Dr. rer. nat. Josef Mautner
Viertgutachter: Prof. Dr. Angelika Böttger
Betreuerin der Arbeit: PD. Dr. rer. nat. Elfriede Nößner
(Sondergutachterin)
Eingereicht am: 26.08.2010
Tag der mündlichen Prüfung: 21.02.2011
Diese Dissertation wurde angefertigt am:
Institut für Molekulare Immunologie
Helmholtz Zentrum München
unter der Leitung von Prof. Dr. Dolores Schendel
und der Betreuung von PD Dr. Elfriede Nößner
Die in dieser Arbeit vorgestellten Ergebnisse flossen in folgende Publikationen ein:
Leisegang M.*, Turqueti-Neves A.*, Engels B., Blankenstein T., Schendel D.J.,
Uckert W. and Noessner E. T-cell receptor gene-modified T cells with shared renal
cell carcinoma specificity for adoptive T-cell therapy. Clin Cancer Res 16:2333-43,
2010.
*Contributed equally to this work

To my parents
_____________________________________________________Table of Contents
I
Table of Contents
Abbreviations .......................................................................................................... VI
Abstract .................................................................................................................. VIII
Zusammenfassung ................................................................................................... X
1 Introduction ..................................................................................................... 1
1.1 The T lymphocytes ........................................................................................ 1
1.1.1 The TCR complex ......................................................................................... 1
1.1.2 Effector functions of T lymphocytes .............................................................. 3
1.1.3 Secretion of cytokines ................................................................................... 3
1.1.3.1 The interferon family .................................................................................. 4
1.1.3.2 TNF ........................................................................................................... 4
1.1.3.3 IL-2 and IL-15 ............................................................................................ 5
1.1.4 Cytotoxicity .................................................................................................... 6
1.1.5 Lytic granule: perforin and granzymes .......................................................... 7
1.2 T lymphocytes in cancer therapy................................................................... 8
1.2.1 TCR optimization strategies ........................................................................ 11
1.2.2 The importance of CD4+ in the tumor immunotherapy ................................ 12
1.3 Renal cell carcinoma ................................................................................... 13
1.3.1 Tumor-associated antigens and antigen specific T cells for the immune
therapy of RCC ........................................................................................... 14
2 Rationale of the PhD project ........................................................................ 16
3 Results ........................................................................................................... 18
3.1 The B3Z-TCR53m indicator cell line for the analysis of the TCR53-pMHC
ligand prevalence among tumors and non-malignant cell lines ....................... 18
3.1.1 High incidence of TCR53-pMHC ligand in RCC cells and in tumor cells of
other histologies .......................................................................................... 19
3.2 Expression of TCR53 in PBLs and functional analysis ................................ 25
3.2.1 Cross-pairing of TCR53mc with endogenous TCR of PBLs. ....................... 26
3.2.2 Transduction with pMP71-TCR53mc endows PBL with HLA-A2 restricted
specific tumor recognition ........................................................................... 28
3.2.3 PBL-TCR53mc can kill RCC targets ........................................................... 28
3.2.4 The antigen specificity of PBL-TCR53mc is HLA-A2 restricted ................... 29
3.2.5 PBL-TCR53mc cells are cytotoxic toward tumors of other histology but not
normal kidney .............................................................................................. 31
3.3 TCR53mc is expressed on both CD4+ and CD8+ T cells but only functional in
CD8+ T cells. ................................................................................................... 32
3.3.1 PBL-TCR53mc cells are polyfunctional upon target recognition ................. 37
Table of Contents_______________________________________________________
II
3.3.2 TCR53mc-mediated killing of RCC-26 cells in a spheroid model mimicking
the tumor environment ................................................................................ 43
3.3.3 TCR53mc expression and functional performance after retroviral
transduction of PBLs of RCC patients ........................................................ 46
3.3.3.1 Expression of TCR53mc in PBLs of RCC patients .................................. 47
3.3.3.2 Expansion capacity of PBLs of RCC patients 9 days after stimulation and
supplementation with IL-2 ....................................................................... 48
3.3.3.3 Expansion capacity of PBLs of RCC patients 20 days after stimulation in
medium-containing IL-2 or IL-15 ............................................................. 49
3.3.3.4 CD28 expression on PBLs cultured in medium supplemented with IL-2 or
IL-15 ........................................................................................................ 50
3.3.3.5 Cytotoxic capacity of PBLs of RCC patients transduced with pMP71-
TCR53mc ................................................................................................ 51
3.3.3.6 PBLs of RCC patients transduced with pMP71-TCR53mc are
polyfunctional .......................................................................................... 53
3.4 Maintenance of functionality of PBLs transduced with pMP71-TCR53mc .. 55
3.4.1 Cytotoxic response of PBLs of RCC patients and a healthy donor
expressing TCR53mc at day 22 after stimulation. ...................................... 56
3.4.2 Polyfunctional response of PBL-TCR53mc of RCC patients and a healthy
donor at day 20 after stimulation ................................................................ 57
3.4.3 Comparison of the functional capacity of PBL-TCR53mc of RCC patients
and a healthy donor at day 9 and 20 after stimulation ................................ 58
3.4.4 IFN- treatment of target cells enhances TCR53-associated recognition . 60
3.4.5 B3Z-TCR53m cells can be used to detect TCR53-pMHC ligand expression
on fresh tissue ............................................................................................ 62
3.5 T cells develop deficits when exposed to spheroids ................................... 63
3.5.1 T cell survival after 4 h and 24 h in spheroids............................................. 63
3.5.2 Cytotoxic proteins in T cells exposed to spheroids ..................................... 66
3.5.3 CD28 expression on CD4+ and CD8+ T cells exposed to spheroids ........... 67
3.5.4 Functional performance of PBL-TCR53mc cells in 3-D tumor cell spheroids .
................................................................................................................... 68
3.6 Perforin deficits are seen in CD8 T cells in tumor tissues. .......................... 69
3.7 The role of CD4+ T cells in supporting CD8+ CTLs ..................................... 73
3.7.1 TCR26 is expressed on CD8+ and CD4+ T cells and is functional in both .. 73
3.7.2 CD4+ T cells expressing TCR26 are HLA-A2 restricted .............................. 77
3.7.3 CD4+ T cells expressing TCR26 are lytic against RCC-26 ......................... 78
3.7.4 CD4+ T cells facilitate CD8+ T cell recruitment into spheroids .................... 79
3.7.5 CD4+ T cells support the functional response of CD8+ T cells .................... 81

_____________________________________________________Table of Contents
III
4 Discussion .................................................................................................... 84
5 Material .......................................................................................................... 94
5.1 Equipment ................................................................................................... 94
5.2 Consumable material .................................................................................. 94
5.3 Reagents ..................................................................................................... 95
5.4 Cell culture basis-medium and supplements ............................................... 96
5.5 Cytokines and growth factors ...................................................................... 96
5.6 Commercial kits........................................................................................... 97
5.7 Human cell lines .......................................................................................... 97
5.7.1 RCC cell lines ............................................................................................. 97
5.7.2 Tumor cell lines ........................................................................................... 97
5.7.3 Normal kidney cell lines .............................................................................. 99
5.7.4 Other normal cell lines ................................................................................ 99
5.8 RCC patient samples ................................................................................ 100
5.9 Blood samples .......................................................................................... 100
5.10 Bacteria strain ........................................................................................... 100
5.11 Murine cells ............................................................................................... 100
5.12 Antibodies ................................................................................................. 101
5.12.1 Anti-human antibodies ........................................................................... 101
5.12.2 Anti-mouse and anti-rabbit antibodies ................................................... 101
5.12.3 Isotype antibodies .................................................................................. 102
5.13 Enzymes ................................................................................................... 102
5.14 Cell culture medium .................................................................................. 102
5.15 Buffers and other solutions ....................................................................... 104
5.16 Vectors ...................................................................................................... 106
5.17 Primer sequences ..................................................................................... 107
5.18 Computer softwares .................................................................................. 108
6 Methods ....................................................................................................... 109
6.1 Cell culture methods ................................................................................. 109
6.1.1 General considerations ............................................................................. 109
6.1.2 Thawing cells ............................................................................................ 109
6.1.3 Cell freezing procedure ............................................................................. 109
6.1.4 Cell culture ................................................................................................ 110
6.1.5 Primary culture from normal and RCC kidney tissue................................. 111
6.1.6 Cell count determination with trypan blue ................................................. 111
6.1.7 Cell count determination with counting beads ........................................... 112
6.1.8 Treatment of cells with IFN- and IFN- .................................................... 113
6.1.9 PBMC isolation by ficoll density centrifugation .......................................... 113

Table of Contents_______________________________________________________
IV
6.1.10 Anti-CD3 stimulation of PBMC .............................................................. 114
6.1.11 T cell stimulation with tumor cell lines or fresh tissue suspension ......... 114
6.1.12 Isolation of CD4+ and CD8+ T cells ........................................................ 115
6.2 Detection of cytokines in the supernatant of cultures (ELISA) .................. 116
6.2.1 Blocking of membrane proteins by specific antibodies ............................. 117
6.2.1.1 Blocking the HLA-A2-TCR interaction ................................................... 117
6.2.1.2 Blocking the interaction of CD8 with MHC class I molecules ................ 117
6.3 Generation of cryo-sections of frozen tissue ............................................ 118
6.4 Immunohistochemistry using the APAAP staining method ....................... 118
6.5 Immunofluorescence staining ................................................................... 119
6.6 Laser scanning confocal microscopy ........................................................ 120
6.6.1 Image acquisition and processing ............................................................ 121
6.7 Flow cytometry ......................................................................................... 121
6.7.1 Principle of flow cytometry ........................................................................ 121
6.7.2 Compensation .......................................................................................... 124
6.7.3 Polychromatic compensation .................................................................... 125
6.7.4 Staining of surface proteins ............................................................... 126
6.7.5 Staining of intracellular proteins................................................................ 126
6.7.6 Boolean gating .......................................................................................... 127
6.7.7 Detection of cytokine production and degranulation of T cells by
polychromatic flow cytometry.................................................................... 127
6.7.8 Generation of tumor cell spheroids ........................................................... 128
6.7.9 Coculture of T cells with tumor cell spheroids........................................... 128
6.7.9.1 Generation of multicellular spheroids using two RCC cell lines stained
with two different fluorescent dyes ........................................................ 130
6.7.10 Quantification of T cell lytic activity ....................................................... 131
6.7.10.1 Quantification of chromium release associated with T cell lytic activity
(Chromium release assay) ................................................................. 131
6.7.10.2 Quantification of cell lysis in multicellular tumor spheroids ................ 132
6.8 Molecular biology methods ....................................................................... 133
6.8.1 Determination of nucleic acid concentration and quality ........................... 133
6.8.2 DNA extraction from gels and purification ................................................ 133
6.8.3 Vector and insert preparation ................................................................... 134
6.8.4 Ligation of plasmid vector and insert DNAs .............................................. 135
6.8.5 Transformation of ligation products into bacteria ...................................... 136
6.8.5.1 Preparation of electrocompetent bacteria cells ..................................... 136
6.8.5.2 Electroporation of DNA into bacteria ..................................................... 136
6.8.6 Plasmid DNA preparations from bacteria ................................................. 137
_____________________________________________________Table of Contents
V
6.8.6.1 Plasmid DNA mini preparation............................................................... 137
6.8.6.2 Plasmid DNA maxi preparation.............................................................. 138
6.8.7 Restriction analysis of plasmid DNA ......................................................... 139
6.8.8 Electrophoresis ......................................................................................... 139
6.8.8.1 DNA electrophoresis .............................................................................. 139
6.8.8.2 RNA electrophoresis .............................................................................. 140
6.8.9 Cloning of TCR26 and chain sequences into pCDNA3.1 .................... 140
6.9 Generation of virus particles containing cDNAs of interest using transfected
HEK-293T ..................................................................................................... 142
6.10 Retroviral transduction of PBLs and culture conditions of the transduced cells .
.................................................................................................................. 144
6.11 Synthesis of in vitro transcribed RNA (IVT-RNA) ...................................... 146
6.12 Electroporation of cells with IVT-RNA ....................................................... 147
References ............................................................................................................. 149
Acknowledgments ................................................................................................. 163
Curriculum Vitae .................................................................................................... 164
Statement ............................................................................................................... 166
Abbreviations __
VI
Abbreviations 5-FU 5-fluorouracil
7-AAD 7- Aminoactinomycin D
AB antibody
AICD activation-induced cell death
ACT adoptive cell therapy
APAAP alkaline phosphatase anti-alkaline phosphatase
APC antigen presenting cell or allophycocyanin
ATT adoptive T cell therapy
BFA brefeldin A
C constant
ccRCC clear cell renal cell carcinoma
CD cluster of differentiation
CDR complementarity determining region
CFDA-SE carboxyfluorescein diacetate N-succinimidyl ester
CTL cytotoxic T lymphocyte
Cy5 cyanin 5
D diversity
DAPI 4‟, 6‟- diamodino-2-phenylindol
DEPC diethylpyrocarbonate
DMEM Dulbecco‟s modified Eagle‟s medium
DMSO dimethyl sulfoxide
EBV Epstein Barr virus
EDTA ethylenediaminetetraacetic acid
ELISA enzyme linked immunosorbent assay
FACS fluorescence activated cell sorting
FCS fetal calf serum
FITC fluorescein isothiocyanate
FSC forward scatter
HBSS Hanks buffered salt solution
HEPES 4-(2-hydroxyethyl)-1-piperazineethanesulfonic acid
HLA human leukocyte antigen
HS human serum
HSCT hematopoietic stem cell transplantation
Abbreviations
VII
IFN interferon
IL interleukin
ITAM immunoreceptor tyrosine based activation motif
IVT in vitro transcription
J joining
MACS magnetic cell sorting
mc murine TCR constant regions and codon optimized
MFI mean fluorescence intensity
MHC major histocompatibility complex
mIL-2 mouse interleukin-2
mRCC metastatic renal cell carcinoma
NKC normal kidney cells
OD optical density
OptiMEM Eagle's minimum essential medium (modification)
PB pacific blue
PBL peripheral blood lymphocytes
PBMC peripheral blood mononuclear cells
PBS phosphate buffered saline
PE phycoerythrin
PFA paraformaldehyde
PI propidium iodide
pMHC peptide MHC
RCC renal cell carcinoma
RPMI 1640 Rosewell park memorial institute medium 1640
SSC side scatter
TAA tumor-associated antigen
TAE tris-acetate-EDTA buffer
TCR T cell receptor
Th T helper cell
TIL tumor infiltrating lymphocytes
TNF tumor necrose factor
V variable
Abstract
VIII
Abstract Immunotherapy using T cells is a new approach that is being explored for the
treatment of metastatic melanoma. For renal cell carcinoma (RCC), adoptive T cell
therapy (ATT) is currently hampered by the lack of T cells expressing suitable T cell
receptors (TCR). A tumor-infiltrating T cell population (TIL) was identified in our group
(TIL-53) that showed a pattern of tumor recognition consistent with the requirements
of a TCR applicable for immunotherapy. With the advent of genetic TCR engineering
it was possible to further define the TIL specificity which was previously precluded by
the failure to cultivate TIL-53. To achieve high expression levels and functionality, the
TCR53 required the exchange of the human TCR constant region by the TCR murine
constant region (TCR53m).
The B3Z T cell hybridoma which stably expressed TCR53m after retroviral
transduction was used to analyze a large panel of tumor lines and non-malignant cell
cultures for expression of the TCR53 ligand. The analysis included 34 RCC cell lines,
55 tumor cell lines of different histologies and 30 non-tumor cell lines. 65 % of the
HLA-A2+ RCC cells and 25 % of other HLA-A2
+ tumor lines were recognized by the
B3Z-TCR53m cells. Among the non-RCC tumors, the TCR53 ligand was frequently
found in malignant B cell lines and EBV-transformed B-lymphoblastoid cell lines
(5/13, 38 %). Of 25 HLA-A2+ non-tumor cells only 2 were marginally recognized.
The TCR53 ligand expression could be increased with IFN- but not IFN- treatment
on cell lines that already had some TCR53 ligand expression. De novo induction in
cell lines that had no prior expression of the TCR53 ligand was not observed. The
B3Z-TCR53m cell line could detect the TCR53 ligand on fresh tumor material and, if
used for therapy, B3Z-TCR53m could be used to identify those patients whose
tumors are positive for the TCR53 ligand and thus could benefit from the therapy.
To achieve high expression levels and functionality of the TCR53m on human PBLs,
the TCR53 and chain sequences had to be optimized for codon usage. PBLs
expressing these recombinant TCR sequences (TCR53mc) showed very low
formation of hybrid TCRs between the TCR53mc chain and endogenous TCR
chains. TCR53mc-expressing T cells of RCC patients and healthy donors showed
specific killing of tumor cell lines and had a polyfunctional profile, defined by the
detection of T cells that simultaneously secreted cytokines (IFN-, TNF- or IL-2) and
performed granule exocytosis when recognizing targets. The functional response of
Abstract
IX
TCR53mc-expressing T cells depended on the expression of HLA-A2 on the target
cells.
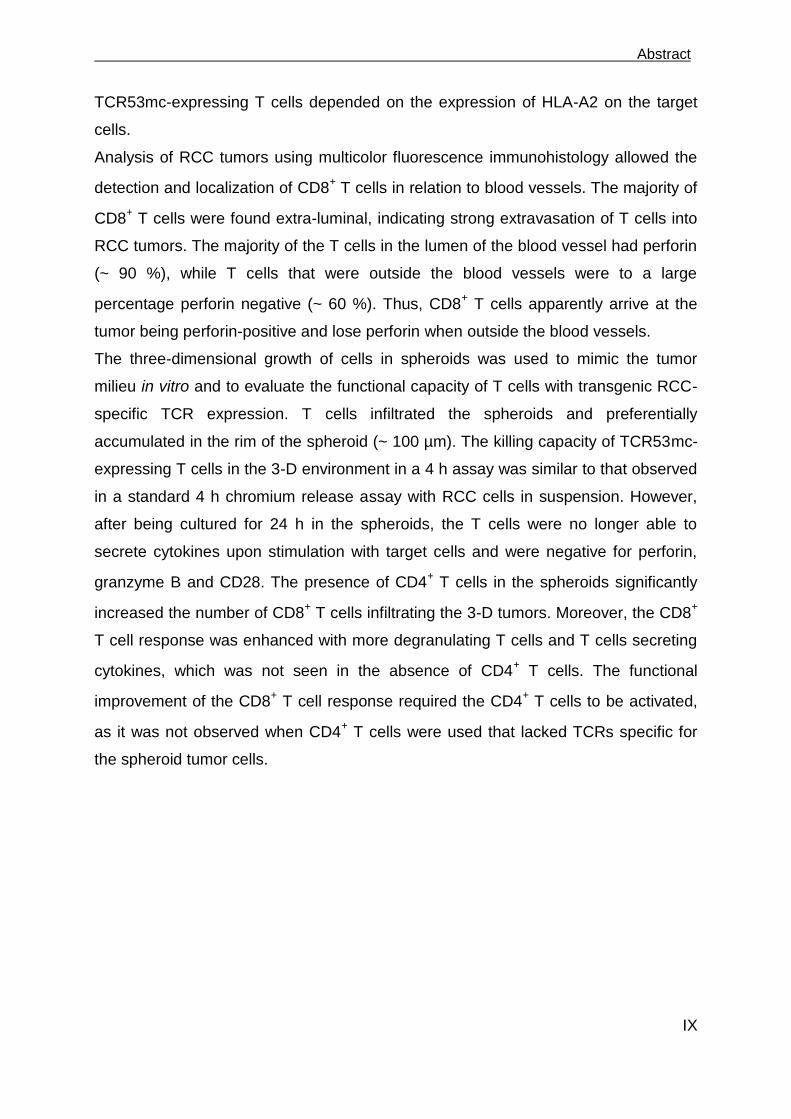
Analysis of RCC tumors using multicolor fluorescence immunohistology allowed the
detection and localization of CD8+ T cells in relation to blood vessels. The majority of
CD8+ T cells were found extra-luminal, indicating strong extravasation of T cells into
RCC tumors. The majority of the T cells in the lumen of the blood vessel had perforin
(~ 90 %), while T cells that were outside the blood vessels were to a large
percentage perforin negative (~ 60 %). Thus, CD8+ T cells apparently arrive at the
tumor being perforin-positive and lose perforin when outside the blood vessels.
The three-dimensional growth of cells in spheroids was used to mimic the tumor
milieu in vitro and to evaluate the functional capacity of T cells with transgenic RCC-
specific TCR expression. T cells infiltrated the spheroids and preferentially
accumulated in the rim of the spheroid (~ 100 µm). The killing capacity of TCR53mc-
expressing T cells in the 3-D environment in a 4 h assay was similar to that observed
in a standard 4 h chromium release assay with RCC cells in suspension. However,
after being cultured for 24 h in the spheroids, the T cells were no longer able to
secrete cytokines upon stimulation with target cells and were negative for perforin,
granzyme B and CD28. The presence of CD4+ T cells in the spheroids significantly
increased the number of CD8+ T cells infiltrating the 3-D tumors. Moreover, the CD8
+
T cell response was enhanced with more degranulating T cells and T cells secreting
cytokines, which was not seen in the absence of CD4+ T cells. The functional
improvement of the CD8+ T cell response required the CD4
+ T cells to be activated,
as it was not observed when CD4+ T cells were used that lacked TCRs specific for
the spheroid tumor cells.
Zusammenfassung
X
Zusammenfassung Die T-zellbasierte Immuntherapie ist ein neuer Therapieansatz, der seit ein paar
Jahren bei metastasierten Melanompatienten in klinischen Studien evaluiert wird. Die
Anwendung bei Nierenzellkarzinompatienten ist derzeit nicht möglich, da keine T-
Zellen mit geeigneter Spezifität verfügbar sind. In der Arbeitsgruppe wurde vor
Jahren eine T-Zellpopulation aus dem Tumor eines Patienten isoliert (TIL-53), die ein
Spezifitätsmuster zeigte, welches die Voraussetzung für eine mögliche
therapeutische Anwendung zu erfüllen schien. Da die Zellen nicht kultiviert werden
konnten, war eine bessere Charakterisierung erst möglich, als neue Methoden des
Gentransfers die Expression von rekombinanten T-Zellrezeptoren (TCR) in Spender-
T-Zellen ermöglichten. Um eine gute Expression und Funktion des TCR53 β-
Heterodimers zu erreichen, mussten die TCR53 Sequenzen modifiziert werden. So
war ein Austausch der Gensegmente der konstanten Domäne des humanen TCR
gegen die entsprechenden Gensegmente des Maus-TCR nötig (TCR53m).
In dieser Arbeit, wurde die B3Z-Hybridom-T-Zelllinie, die nach retroviralem
Gentransfer den TCR53m stabil auf der Zelloberfläche exprimierte (B3Z-TCR53m),
an 34 Nierenzellkarzinom (RCC)-Zelllinien und 55 Tumorlinien anderer Histologie
sowie 30 Nichttumor-Kulturen getestet, um die Häufigkeit der Expression des TCR53
Liganden zu bestimmen. Von den RCC-Linien exprimierten 65 % den TCR53-Ligand.
Unter den Tumoren anderer Histologie wurde eine positive Reaktion nur vereinzelt
gefunden, mit der Ausnahme von Tumoren der B-Lymphozytenlinie und EBV-
transformierten B-lymphoblastoiden Zelllinien, von welchen 38 % (5/13) als positiv
identifiziert wurden. Von den getesteten Nichttumor-Kulturen wurden nur zwei
marginal erkannt. Die Erkennung war HLA-A2 restringiert. Weitere Untersuchungen
zeigten, dass der von TCR53 erkannte Ligand durch Behandlung der Tumorzellen
mit Interferon-alpha (IFN-) hochreguliert aber nicht de novo induziert wird. Die
TCR53m-exprimierende B3Z-Linie konnte den TCR53 Liganden auch auf frischem
Tumorgewebe erkennen. Sollte eine adoptive Therapie mit TCR53-exprimierenden
T-Zellen zum Einsatz kommen, so wäre denkbar, mithilfe der B3Z-TCR53m Zellen
Biopsiematerial zu testen und gezielt solche Patienten für die Therapie auszuwählen,
welche TCR53 Ligand-positive Tumore haben.
Um eine Expression und Funktion des TCR53m β-Heterodimers auf der Oberfläche
von humanen PBL zu erreichen, musste die gesamte Sequenz kodonoptimiert
werden. Diese optimierten Sequenzen (TCR53mc) bildeten so gut wie keine Hybrid-
Zusammenfassung
XI
TCR-β-Heterodimere mit den endogenen TCR-Ketten der PBL. PBL von
gesunden Spendern und RCC-Patienten zeigten vergleichbare Effizienz des
retroviralen TCR53mc-Gentransfers, ähnliche TCR53mc-Heterodimerexpression und
vergleichbares HLA-A2-abhängiges, Tumorzell-spezifisches Funktionsprofil mit
Tumorzelllyse, Granulaexozytose und Sekretion von mehreren Zytokinen (IFN-,
TNF-, IL-2).
Mithilfe von immunhistologischer Multifarbenfluoreszenzfärbung wurde die Verteilung
der CD8+ T-Zellen und deren Perforinexpression in RCC-Tumorgeweben in
räumlicher Verteilung zu Blutgefäßen evaluiert. Es zeigte sich, dass sich die meisten
CD8+ T-Zellen nicht mehr im Blutgefäßsystem des Tumors, sondern im
Tumorgewebe, befanden. Die CD8+ T-Zellen, welche im Blutgefäß verblieben, waren
zu mehr als 90 % Perforin-positiv, während die intratumoralen CD8+
T-Zellen zu
einem großen Prozentsatz (~ 60 %) Perforin-negativ waren. Mithilfe eines
dreidimensionalen Tumorzellkultursystems (Sphäroid-Kultur) wurde gezeigt, dass
das Tumormilieu in zytotoxischen CD8+ T-Zellen den Verlust von Perforin und eine
funktionelle Inaktivierung in Abhängigkeit von der Expositionszeit induziert. Innerhalb
der ersten 4 Stunden der Sphäroidexposition waren alle T-Zellen Perforin-positiv und
zeigten eine lytische Aktivität vergleichbar mit der gegen Tumorzellen in Suspension.
Jedoch nach 24 Stunden Kultur mit Sphäroiden waren die T-Zellen negativ für
Perforin, Granzym B und CD28 und sezernierten keine Zytokine mehr. Enthielten die
Sphäroide CD4+ T-Zellen, so wurden sie stärker von CD8
+ T-Zellen infiltriert und die
CD8+ T-Zellen zeigten höhere funktionelle Kapazität mit mehr degranulierenden T-
Zellen. Die CD8+ T-Zellen sezernierten zudem mehr Zytokine, während sie das in
Sphäroiden ohne CD4+ T-Zellen nicht taten. Die verbesserte CD8
+ T-Zellenreaktion
war von der Aktivierung der CD4+ T-Zellen im Sphäroid abhängig, da sie nur dann
auftrat, wenn die im Sphäroid anwesenden CD4+ T-Zellen einen tumorzell-
spezifischen TCR exprimierten.


________________________________________________________________ Introduction
1
1 Introduction
1.1 The T lymphocytes
T cells express a unique antigen-binding molecule on their membrane, the T cell
receptor (TCR). The TCR can recognize peptides that are bound to cell-membrane
proteins called major histocompatibility complex (MHC) molecules. MHC molecules
are polymorphic glycoproteins. There are two major classes of MHC molecules: class
I, expressed by nearly all nucleated cells, consists of a heavy chain non-covalently
associated with a small invariant protein called 2-microglobulin. Class II molecules
are heterodimers of and glycoprotein chains, and are expressed mainly by
antigen presenting cells (APC) [1].
In the adaptive immunity, T helper (Th) and cytotoxic T lymphocytes (CTL) are two
well defined subpopulations of T cells that participate in fighting diseases. They can
be distinguished from one another by the presence of either cluster of differentiation
(CD)4 (CD4+ T cell) or CD8 (CD8+ T cell) membrane glycoproteins on their surfaces,
respectively. Classically, the CD4+ T cells recognize, through their TCR, a peptide
that is presented by MHC class II proteins, whereas peptides recognized by CD8+ T
cells are presented by MHC class I proteins.
1.1.1 The TCR complex
The specificity of a T cell is defined by its TCR, a heterodimer consisting of a TCR α
and TCR β (Figure 1.1a) [2]. Both chains contain a variable (V) and a constant (C)
domain. Similar to antibody molecules, TCRs are generated by recombination of a
family of gene segments that form the diverse TCR repertoire (as high as to 1014
different sequences). 70 V and 52 V gene segments are used to constitute the first
two variable loops named complementarity determining regions (CDR1 and CDR2),
while the third variable loops (CDR3) are formed by the random joining of V and J (in
TCR ), or by V, D, and J (in TCR ) (Figure 1.1b). The joining process itself
generates further diversity both by removing nucleotides and by introducing non-
germline nucleotides at each junction [3].
Introduction________________________________________________________________
2
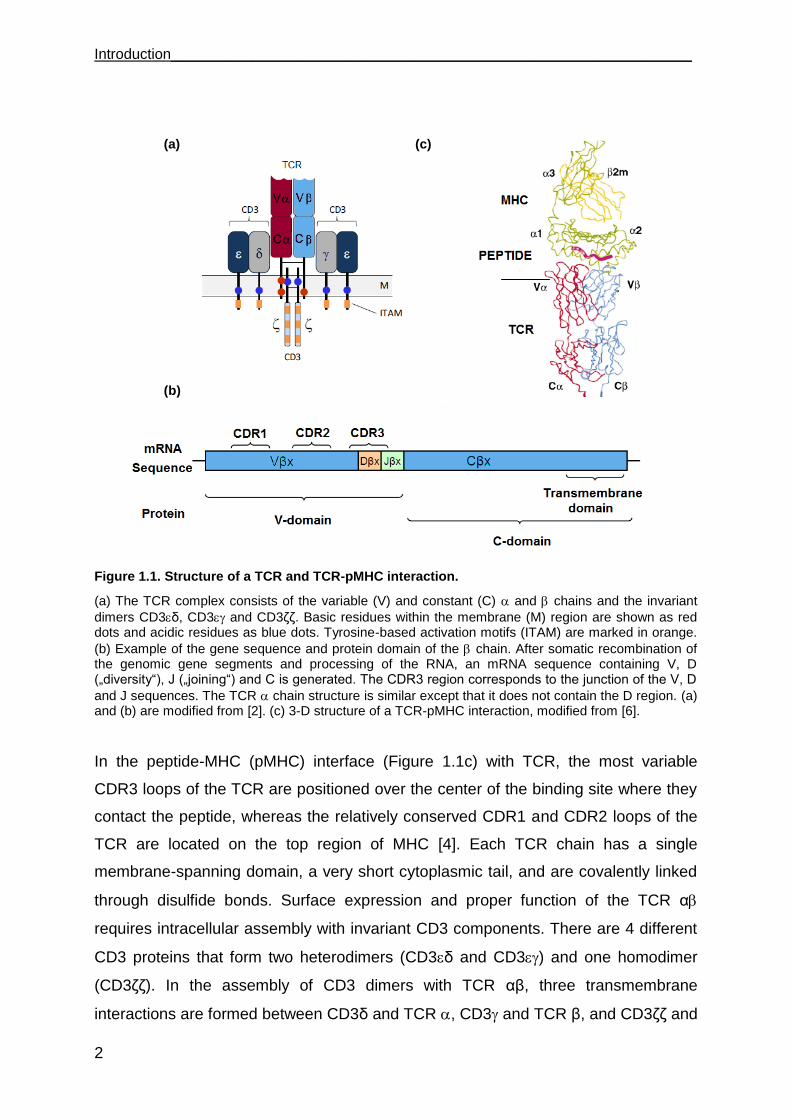
Figure 1.1. Structure of a TCR and TCR-pMHC interaction.
(a) The TCR complex consists of the variable (V) and constant (C) and chains and the invariant
dimers CD3δ, CD3 and CD3δδ. Basic residues within the membrane (M) region are shown as red dots and acidic residues as blue dots. Tyrosine-based activation motifs (ITAM) are marked in orange.
(b) Example of the gene sequence and protein domain of the chain. After somatic recombination of the genomic gene segments and processing of the RNA, an mRNA sequence containing V, D („diversity“), J („joining“) and C is generated. The CDR3 region corresponds to the junction of the V, D
and J sequences. The TCR chain structure is similar except that it does not contain the D region. (a) and (b) are modified from [2]. (c) 3-D structure of a TCR-pMHC interaction, modified from [6].
In the peptide-MHC (pMHC) interface (Figure 1.1c) with TCR, the most variable
CDR3 loops of the TCR are positioned over the center of the binding site where they
contact the peptide, whereas the relatively conserved CDR1 and CDR2 loops of the
TCR are located on the top region of MHC [4]. Each TCR chain has a single
membrane-spanning domain, a very short cytoplasmic tail, and are covalently linked
through disulfide bonds. Surface expression and proper function of the TCR α
requires intracellular assembly with invariant CD3 components. There are 4 different
CD3 proteins that form two heterodimers (CD3δ and CD3) and one homodimer
(CD3δδ). In the assembly of CD3 dimers with TCR αβ, three transmembrane
interactions are formed between CD3δ and TCR , CD3 and TCR β, and CD3δδ and
(a)
(b)
(c)

________________________________________________________________ Introduction
3
TCR , thereby CD3 molecules provide an acidic amino acid and TCR or β chains
provide a basic amino acid to form polar interactions [5]. CD3 components contain
immune receptor tyrosine-based activation motifs (ITAM) that endow the TCR/CD3
complex with means for intracellular signaling. Following pMHC binding, the
TCR/CD3 complex initiates synapse formation between T cell and APC resulting in T
cell activation [2] [5].
1.1.2 Effector functions of T lymphocytes
When a T cell recognizes a pMHC ligand on a target cell (an APC), the area of
apposition of the T cell with its target assembles into a well organized immunological
synapse [7] [8]. In the central region of the T cell synapse, the TCR, CD3, CD8 and
associated signaling molecules cluster and are surrounded by larger molecules, such
as CD2 and leukocyte function-associated antigen 1 (LFA1), that form circumferential
zones that stabilize the synapse. The synapse forms within minutes of the initial
interaction of the TCR with its APC and can last for more than an hour until the entire
TCR complex is internalized and degraded. The formation of a stable synapse in the
inductive phase of an immune response provides a stop signal for the migrating T
cell and allows cytokine secretion by the T cell to be focused on an APC or target cell
[9].
1.1.3 Secretion of cytokines
After a T cell recognizes and interacts with a pMHC, the T cell is activated and
becomes an effector T cell that secretes various growth factors known collectively as
cytokines. CD4+ T cells can be divided into two main categories: T helper 1 (Th1) and
Th2 depending on the cytokines they produce in response to antigen activation.
Secretion of cytokines by Th1 and CTL upon TCR engagement can include interferon
(IFN), tumor necrosis factor (TNF) and interleukin (IL), among others.

Introduction________________________________________________________________
4
1.1.3.1 The interferon family
The IFNs were originally discovered as agents that interfere with viral replication.
They are classified into type I and type II according to receptor specificity and
sequence homology. The type I IFNs are comprised of multiple IFN- subtypes, IFN-
, IFN-, and IFN-, all of which are structurally related and bind to a common
heterodimeric receptor (IFNAR, comprised of IFNAR1 and IFNAR2 chains). Although
type I IFNs can be secreted at low levels by almost all cell types, hematopoietic cells
are the major producers of IFN- and IFN-, whereas fibroblasts are a major cellular
source of IFN-. Viral infection is the classic stimulus for IFN- and IFN- expression.
IFN- is the sole type II IFN. It is structurally unrelated to type I IFNs, binds to a
different receptor, and is encoded by a separate chromosomal locus. Known
producers of IFN- are CD4+ Th1 lymphocytes, CD8+ CTLs, natural killer (NK) cells,
B cells, natural killer T cells (NKT) and professional APCs [2]. IFN- production by
professional APCs (monocytes/macrophages, dendritic cells (DCs)) acting locally
may be important in cell self-activation and activation of nearby cells. IFN- secretion
by NK cells and possibly professional APCs is likely to be important in early host
defense against infection, whereas T lymphocytes become the major source of IFN-
in the adaptive immune response [10].
1.1.3.2 TNF
TNF- is a 17-kDa protein that is a homotrimer in solution. In humans, the gene is
mapped to chromosome 6. Its bioactivity is mainly regulated by soluble TNF--
binding receptors. TNF- is mainly produced by activated macrophages, CTLs, Th1
lymphocytes and NK cells. Lower expression is known for a variety of other cells,
including fibroblasts, smooth muscle cells, and tumor cells. TNF- is synthesized as
pro-TNF (26 kDa), which is membrane-bound and is released upon cleavage of its
pro-domain by the TNF-converting enzyme (TACE). TNF- acts via two distinct
receptors. Although the affinity for TNF receptor 2 (TNFR-2) is five times higher than
that for TNFR-1, the latter initiates the majority of the biological activities of TNF-.
TNFR-1 (p60) is expressed on all cell types, while TNFR-2 (p80) expression is mainly
confined to immune cells. The major difference between the two receptors is the
________________________________________________________________ Introduction
5
death domain (DD) of TNFR-1 that is absent in TNFR-2. For this reason, TNFR-1 is a
member of the death receptor family that has the capability of inducing apoptotic cell
death. TNFR-1 has a dual role in that, in addition to inducing apoptosis, it also has
the ability to transduce cell survival signals [11]. The life-death switch signaling
regulation is still poorly understood [12].
1.1.3.3 IL-2 and IL-15
IL-2 binds to a heterotrimeric receptor composed of IL-2R, IL-2/15R, and c. IL-
2Rα is a receptor chain that is specific for IL-2, binds IL-2 with low affinity (Kd 8-10
M) and possesses a short cytoplasmic domain that does not appear to recruit intra-
cytoplasmic signaling molecules. IL-2/15R is a chain shared by the IL-15 receptor
that is responsible for stimulating JAK3-, STAT5-, and AKT-dependent signaling
pathways that support cellular survival and proliferation. The IL-15 receptor is thought
to be a heterotrimeric receptor that closely parallels the IL-2R, except that the IL-
15R chain substitutes for IL-2R in the complex with IL-2/15R and c. IL-15R
differs from IL-2R in that it alone binds IL-15 with high affinity (Kd 11-10 M).
Expression of IL-2, IL-2R, and IL-2/15R are all induced in T cells after TCR
engagement, and multiple in vitro studies demonstrate that T cell activation depends
on the presence of IL-2. Recently activated T cells are the predominant source of IL-
2 during immune responses and these cells increase surface expression of both IL-
2/15R and IL-2R. Although IL-15R expression is induced on both CD4+ and CD8+
T cells, the higher expression of IL-2/15R on activated CD8+ T cells compared with
activated CD4+ T cells renders CD8+ T cells more sensitive to IL-15. Multiple lines of
evidence suggest that IL-15 signals are important for maintaining memory CD8+ T
cells. Memory CD8+ T cells are selectively expanded by heterologous IL-15,
consistent with the higher expression levels of IL-2/15R on these cells compared
with naive CD8+ T cells or CD4+ T cells [13]. Memory phenotype of CD8+ T cells does
not develop in IL-15-/- mice, IL-15R-/- mice and in normal mice treated with blocking
antibodies against IL-2/15R (presumptively blocking both IL-2 and IL-15 signals) but
does develop in mice treated with antibodies against IL-2 or IL-2R (blocking IL-2)
[13].
Introduction________________________________________________________________
6
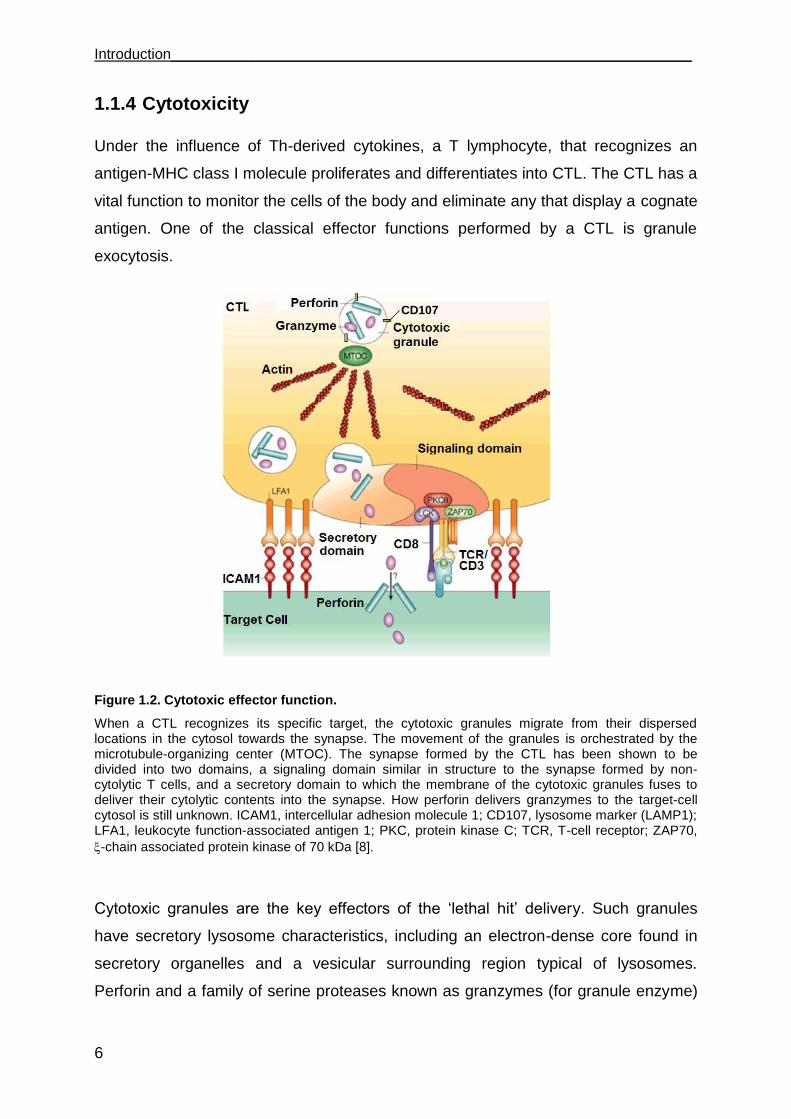
1.1.4 Cytotoxicity
Under the influence of Th-derived cytokines, a T lymphocyte, that recognizes an
antigen-MHC class I molecule proliferates and differentiates into CTL. The CTL has a
vital function to monitor the cells of the body and eliminate any that display a cognate
antigen. One of the classical effector functions performed by a CTL is granule
exocytosis.
Figure 1.2. Cytotoxic effector function.
When a CTL recognizes its specific target, the cytotoxic granules migrate from their dispersed locations in the cytosol towards the synapse. The movement of the granules is orchestrated by the microtubule-organizing center (MTOC). The synapse formed by the CTL has been shown to be divided into two domains, a signaling domain similar in structure to the synapse formed by non-cytolytic T cells, and a secretory domain to which the membrane of the cytotoxic granules fuses to deliver their cytolytic contents into the synapse. How perforin delivers granzymes to the target-cell cytosol is still unknown. ICAM1, intercellular adhesion molecule 1; CD107, lysosome marker (LAMP1); LFA1, leukocyte function-associated antigen 1; PKC, protein kinase C; TCR, T-cell receptor; ZAP70,
-chain associated protein kinase of 70 kDa [8].
Cytotoxic granules are the key effectors of the „lethal hit‟ delivery. Such granules
have secretory lysosome characteristics, including an electron-dense core found in
secretory organelles and a vesicular surrounding region typical of lysosomes.
Perforin and a family of serine proteases known as granzymes (for granule enzyme)
CD107
________________________________________________________________ Introduction
7
are the main cytotoxic components of the dense core [14]. Like lysosomes, cytotoxic
granules have a low pH and contain lysosomal proteins such as Lamp1 (CD107a),
Lamp2 (CD107b) and CD63 [8] [15]. As shown in Figure 1.2, after recognition of a
target cell, cytotoxic granules are transported along microtubules and cluster around
the microtubule-organizing center (MTOC) [16]. Then, after the polarized MTOC
contacts the plasma membrane, cytotoxic granules are delivered to the
immunological synapse where they fuse with the plasma membrane [17].
1.1.5 Lytic granule: perforin and granzymes
Mice genetically deficient in perforin have severe immunodeficiency and impaired
protection against viruses and tumors, because perforin is required to deliver
granyzmes into the cytosol of the target cell [18] [19]. The original model of how
perforin carries out this task involves homopolymerization in the plasma membrane in
a Ca2+-dependent manner to produce pores that act as a channel. Recently, this
model has been called into question. The revised hypothesis holds that although
perforin is not required for granzymes to get into cells, it is required for the release of
granzymes from the endocytic compartment into the cytosol and for trafficking to the
nucleus. This idea is supported by the ability of non-replicating adenovirus and
bacterial proteins that are known to facilitate endosomal exit to substitute for perforin
[20]. Perforin probably associates with its inhibitor calreticulin in the endoplasmic
reticulum and needs to be activated on route to or in the granules by a cysteine
protease, which removes a carboxy-terminal glycosylated peptide [21]. This protects
intracellular membranes from damage during biosynthesis and storage. Perforin is
also thought to bind to serglycin in the granules. After exocytosis, perforin dissociates
from calreticulin and serglycin, polymerizes and inserts in the plasma membrane [22].
What happens next is uncertain. Although the membrane barrier remains largely
intact as the cell initially remains impermeable to small extracellular dyes, perforin
clearly perturbs the plasma membrane, because fluorescently labeled plasma-
membrane lipids rapidly redistribute within a few minutes to other intracellular
membranes, including mitochondrial and nuclear membranes [22]. The granzymes
are processed either on route to or in the granules from inactive pro-enzymes into
active enzymes by cathepsin C. At the acidic pH of the granules, the granzymes are
Introduction________________________________________________________________
8
inactive. Granzymes are highly specific proteases, the substrate specificity of which
seems to be determined by an extended binding site around the cleavage site [23].
Granzyme A and B are the most abundant granzymes in mice and humans.
Granzyme B cuts after aspartate residues (similar to the caspases), activates
caspase-mediated apoptosis by cleaving caspase-3 and other caspases. However,
cell death induced by CTLs occurs in the presence of complete caspase blockade
[24]. This indicates that CTLs also activate caspase-independent cell death.
Recently, caspase-independent cell death pathways induced by three cytotoxic
granule mediators granzyme A, granzyme C and granulysin have begun to be
elucidated.
1.2 T lymphocytes in cancer therapy
Adoptive cell therapy (ACT) is currently being investigated as an approach to treat
malignant diseases in humans. Barnes and colleagues [25] proved the feasibility and
efficacy of transplanting homologous bone marrow after irradiation in an animal
model of leukemia. These preliminary murine experiments were crucial steps for a
large scale of early phase trials in humans that eventually led to the application of
allogeneic hematopoietic stem cell transplantation (HSCT) to a growing number of
hematologic [26] and some solid malignancies [27]. In view of the limitations of
allogeneic HSCT, such as low overall response rate, transplantation-associated
complications and the requirement for an HLA-matched family member to donate
stem cells, the attention was directed to autologous adoptive cell therapy.
Improved CTL cell culture technology [28] has permitted the first clinical tests of
adoptive transfer of CTLs. T cells used in adoptive therapy can be harvested from a
variety of sites, including peripheral blood, bone marrow, malignant effusions,
resected lymph nodes, and tumor biopsies [29].
Adoptive transfer of autologous tumor-infiltrating or peripheral blood T cells results in
clinical responses when treating melanoma [30-33] as well as virus infections and
virus-associated tumors [34] [35]. Objective response rates were as high as 51 %
when melanoma patients were treated with non-myeloablative chemotherapy prior to
transfer of autologous tumor-infiltrating lymphocytes (TILs) [36]. Recently,
________________________________________________________________ Introduction
9
myeloablative irradiation as a more stringent patient pre-conditioning regimen
resulted in response rates of up to 72 % [33].
The isolation and expansion of TILs for patient treatment is often laborious and,
depending on the localization of the solid tumor, tumor material may not be
accessible for TIL isolation. Most human tumor-associated antigens that are shared
between individuals consist of non-mutated self antigens [30] [37]. Consequently, the
endogenous T cell repertoire that reacts to these antigens will generally be small in
size and activity due to thymic selection and peripheral tolerance induction. If
adoptive therapy is to become a reality for a larger number of tumor patients, other
alternatives are needed.
TCR gene-modified T cells One alternative to circumvent the low number of reactive T cells and low levels of
endogenous anti-tumor reactivity is to infuse patients with ex vivo expanded T cells
that are selected for good tumor recognition. T cells harvested from the peripheral
blood can be engineered to express TCRs that have been selected for tumor
recognition. This approach enables the generation of therapeutic quantities of T cell
populations with defined anti-tumor characteristics in a relatively short period of time.
It also allows the introduction of tumor-specific TCRs that are not normally found
naturally, and hence provide a strategy to overcome the limitations of the
endogenous T cell repertoire.
Engineering T cells toward a desired reactivity against a targeted antigen has been
developed with some promising results [38-40]. It has been applied to melanoma
antigens [39], minor histocompatibility antigens [41] and common oncoproteins [42].
In vitro experiments show that following TCR gene transfer, redirected T cells acquire
the antigen specificity of the parent T cell clone, including production of IFN- in
response to antigen stimulation and lysis of tumor cells in coculture assays.
Additionally, mouse studies have shown that infusion of T cells transduced with
antigen-specific TCRs encofing vectors can eliminate tumors in vivo [40] [43].
The feasibility of this approach in the clinic has recently been demonstrated for the
treatment of metastatic melanoma [40] [44]. In the first study, Morgan et al. [44]
infused patients with T cells genetically modified with TCRs recognizing the MART-1
melanoma antigen and observed prolonged persistence of CTLs and objective

Introduction________________________________________________________________
10
regression of metastatic lesions in two patients. Nevertheless, the resulted objective
response rate was of only 12 % and thus much lower than that observed with TILs.
Reasons that might explain the observed drop in therapeutic effectiveness of TCR-
transduced T cells compared to TIL include sub-optimal surface expression, T cell
low avidity and limited TCR repertoire to fight the tumor, when compared with TILs
that have a heterogeneous TCR repertoire. A more reactive TCR recognizing MART-
1 was used in a recent study to engineer autologous T cells and treat melanoma
patients. Objective cancer regression was seen in 30 % of patients and thus
improved in comparison to the previous trial [40]. However, patients exhibit
destruction of normal melanocytes in the skin, eyes and ear.
The strategies for adoptive transfer of T cells that are currently being explored, like
TIL infusion into patients or transfer of PBLs engineered with new TCR specificities
are shown in Figure 1.3.
Figure 1.3. Strategies of adoptive transfer using autologous in vitro expanded T cells.
(i) TILs can be isolated from resected surgical specimens and expanded in vitro for adoptive transfer after lymphodepleting chemotherapy. (ii, red) Alternatively, autologous T cells are harvested from peripheral blood, undergo in vitro activation, transfer of a new TCR specificity (PBL-TCR engineered) and expansion, and are reinfused after lymphodepleting chemotherapy. Following most adoptive transfer therapy approaches, cytokines like IL-2 are given to the patients as a support for growth of the transferred T cells in vivo. Modified from [29].
________________________________________________________________ Introduction
11
1.2.1 TCR optimization strategies
TCR mispairing results in diluted surface expression of the therapeutic TCR and
consequently to a diminished functional sensitivity [45]. Recently, various genetic
strategies have been developed to optimize the expression and performance of TCR-
engineered T cells. The replacement of the human TCR constant gene segment (C)
C and C by the corresponding murine TCR C and C domains (Figure 1.4)
enhances the preferential pairing of the TCR chains containing the murine constant
region [46]. Gene transfer of TCR chains containing the murine constant region in
human T cells resulted in enhanced and more sustained levels of surface expression
when compared with fully human TCRs [47]. With regard to TCR function, human-
murine TCR chimeras with MART-1/A2 and p53/A2 specificities demonstrated
increased T cell activity in terms of cytotoxicity as well as IFN- secretion [46]. In
addition, there is evidence for a competitive advantage of TCRs containing the
murine constant regions for interacting with the human CD3 molecules from the
observation that murine TCR C domains bind more strongly to human CD3δ than
human TCR C domains [46].
An expected consequence of enhanced TCR pairing is a concomitantly decreased
TCR mispairing of the transferred TCR or chains with the TCR or chain
endogenously expressed by the recipient T cells [42]. Recently, proof of TCR
mispairing induced autoreactivity has been shown in mouse models of adoptive T cell
therapy (ATT) [48]. Notably, MART-1/A2 binding by human TCR or human-murine
TCR chimera in Jurkat T cells was reduced by 80 % and 20 %, respectively, upon
introduction of a second non-related human TCR suggesting that the presence of the
murine constant region reduces TCR mispairing.
The expression of TCR transgenes can be further enhanced by the use of codon-
optimized synthetic TCR encoding sequences. Redundancy in the genetic code
allows some amino acids to be encoded by more than one codon, but certain codons
are less „„optimal‟‟ for translation than others because of the relative availability of
matching tRNAs. Highly expressed mammalian genes share a similar codon usage
suggesting that codon usage can affect protein production. Modifying the TCR and
TCR gene sequences such that each amino acid is encoded by the optimal codon
Introduction________________________________________________________________
12
for mammalian gene expression, as well as eliminating mRNA instability motifs or
cryptic splice sites, has been shown to significantly enhance TCR expression [49-51].
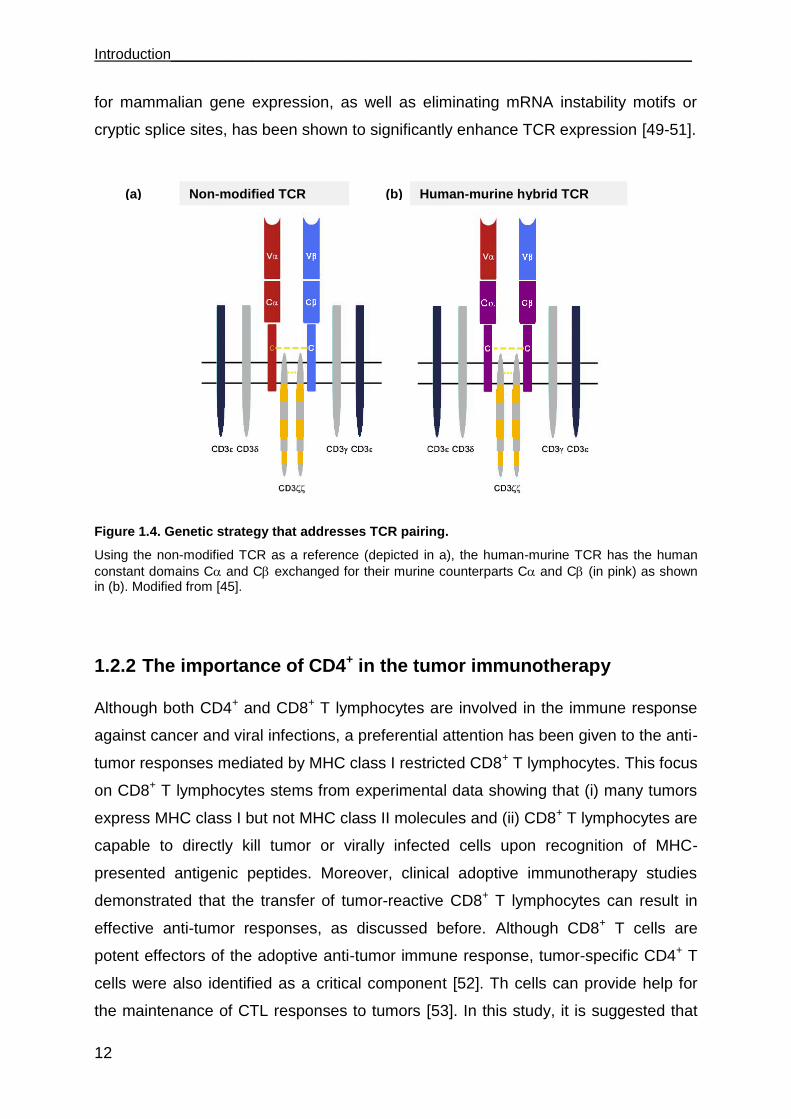
Figure 1.4. Genetic strategy that addresses TCR pairing.
Using the non-modified TCR as a reference (depicted in a), the human-murine TCR has the human
constant domains C and C exchanged for their murine counterparts C and C (in pink) as shown in (b). Modified from [45].
1.2.2 The importance of CD4+ in the tumor immunotherapy
Although both CD4+ and CD8+ T lymphocytes are involved in the immune response
against cancer and viral infections, a preferential attention has been given to the anti-
tumor responses mediated by MHC class I restricted CD8+ T lymphocytes. This focus
on CD8+ T lymphocytes stems from experimental data showing that (i) many tumors
express MHC class I but not MHC class II molecules and (ii) CD8+ T lymphocytes are
capable to directly kill tumor or virally infected cells upon recognition of MHC-
presented antigenic peptides. Moreover, clinical adoptive immunotherapy studies
demonstrated that the transfer of tumor-reactive CD8+ T lymphocytes can result in
effective anti-tumor responses, as discussed before. Although CD8+ T cells are
potent effectors of the adoptive anti-tumor immune response, tumor-specific CD4+ T
cells were also identified as a critical component [52]. Th cells can provide help for
the maintenance of CTL responses to tumors [53]. In this study, it is suggested that
(a) (b) Non-modified TCR Human-murine hybrid TCR
________________________________________________________________ Introduction
13
costimulatory receptors on CTLs such as CD27, CD134 and MHC class II molecules
are capable of directly interacting with the corresponding ligands on Th lymphocytes
resulting in enhanced proliferation and survival of the CTL during the effector phase
of anti-tumor immune responses. In addition, the adoptive transfer of tumor-specific
CD4+ T lymphocytes has resulted in de novo generation of tumor-specific CD8+ T
lymphocytes [54]. The importance of CD4+ T cells was recently consolidated with the
successful treatment of a melanoma patient using the adoptive transfer of autologous
tumor-specific CD4+ T cells specific for the NY-ESO-1 antigen [55]. Adoptive transfer
of CD4+ tumor-specific T lymphocytes is therefore clinically relevant for effective anti-
tumor responses.
Although CD4+ T cell recognition of peptide is normally restricted by MHC class II
molecules, CD4+ T cells that recognize peptides presented by MHC class I molecules
have been found. Nishimura et al [56] reported an MHC class I-restricted CD4+ T cell
isolated from TIL of a patient with metastatic melanoma. They showed that this TIL
was weakly cytolytic and secreted cytokines in a pattern consistent with a Th1 profile.
This finding demonstrates that CD4+ T cells recognizing a MHC class I presented
peptide, showing a Th1 profile, can be naturally found. MHC class I restricted Th
cells have the advantage over the classical Th cells that tumor cells normally express
MHC class I, but not MHC class II molecules. In this way, a direct recognition of
tumors by the CD4+ MHC class I-restricted cells is possible.
Recently, a new mechanism by which CD4+ T cells act in response to a virus
infection was discovered [57]. In this work, the authors found that CD4+ T cells recruit
CD8+ effector cells toward the site of virus infection, a mechanism that is dependent
on IFN- secretion by the Th cells.
1.3 Renal cell carcinoma
Renal cell carcinoma (RCC) accounts for 2 % of all new cancer cases worldwide,
with estimated 57760 new cases diagnosed in the United States in 2009 [58]. RCC is
a therapeutic challenge. Radical nephrectomy can be curative for early stage
disease; however, approximately one third of patients have metastatic disease at the
time of diagnose and a further third will relapse after initial surgery [59]. Metastatic
RCC (mRCC) is resistant to chemotherapy, hormone therapy, and radiotherapy with

Introduction________________________________________________________________
14
an objective response rate below 10 %. mRCC responds modestly to monoclonal
antibodies that block T cell regulation like CTLA4 [60] or PD1 [61] and tumor
vaccines [62]. New targeted agents such as tyrosine kinase inhibitors (sunitinib and
sorafenib), a mammalian target of rapamycin inhibitor (temsirolimus) and a
monoclonal antibody against vascular endothelial growth factor (bevacizumab) have
been developed and are currently the standard of care for most patients with mRCC.
Although these agents represent a major advance in the treatment of this disease,
they are palliative treatments and do not produce durable complete remissions [63].
Allogeneic HSCT in RCC showed extremely variable response rates, ranging from 0
to 57 % [64] [65]. Between July 1999 and September 2003, 124 patients with
metastatic RCC underwent HSCT at 21 European centers. Acute graft versus host
disease (GVHD) was seen in 40 % of the patients, chronic GVHD in 33 %.
Transplant-related mortality was 16 % and complete response was seen in 4 patients
[65]. Adoptive transfer of lymphocytes activated in vitro by IL-2 (named LAK) have
been assessed in many phase I/II trials for the treatment of patients with mRCC. The
objective response, as defined by either complete or partial response, of various
clinical trials using LAK cells in RCC varied remarkably, however the randomized
trials revealed no survival benefit of this approach in RCC patients [66]. Unlike for
melanoma, clinical trials with TILs in RCC did not yield substantial benefit [63] [67].
Cytokines such as IL-2 and IFN- were the standard of care before the advent of the
targeted agents and produced modest benefits [62] [63]. However, high-dose IL-2
can produce durable complete remissions in small numbers of patients, albeit at the
expense of considerable toxicity requiring careful patient selection and monitoring
[62] [64].
1.3.1 Tumor-associated antigens and antigen specific T cells for the immune therapy of RCC
In comparison to melanoma there are relatively few tumor-associated antigens (TAA)
identified in RCC, resulting in a paucity of reports on the use of HLA class I and II
restricted T cell epitopes in clinical trials of RCC patients [68] [69]. TAAs can be
classified into different groups: i) differentiation antigens, expressed by certain cell
lineages, that are overexpressed in the tumors and have a low level of expression in
________________________________________________________________ Introduction
15
normal cells (i.e. MART, tyrosinase, etc.); ii) cancer testis antigens expressed by
many different tumor types and not in normal cells except testis and iii)
overexpressed antigens (i.e. survivin) [69].
G250/carbonic anhydrase (CA)-IX is one of the most extensively studied RCC-
associated antigens [70]. It is considered a TAA, as it is expressed on > 75 % of clear
cell RCC (ccRCC) and less frequent on normal tissues [71]. CA-IX antigen has been
targeted using many forms of immunotherapy to treat mRCC patients. A clinical
benefit was achieved in some patients by the administration of chimeric monoclonal
antibody G250 [72]. A clinical trial of adoptive transfer of T cells transduced with a
CA-IX chimeric immune receptor was terminated at an early stage due to liver
toxicity, which seemed to occur as a result of “on-target” effects due to expression of
the G250 antigen on bile duct cells [73].
Human endogenous retrovirus type E (HERV-E) is the most recent RCC antigen to
be discovered [74]. It was identified using allogeneic T cells from an mRCC patient
who experienced a complete response following hematopoietic stem cell
transplantation. HERV-E appears to be a very promising TAA to target, because of
its expression in RCC but not in normal kidney. Despite of that, there are no HERV-E
specific T cells with restriction through a common MHC allele, thus limiting their
widespread application.
The difficulty in generating sufficient numbers of RCC-reactive T cells in vitro remains
the main drawback of the TIL therapy in RCC. To overcome this problem, genetic
engineering of T cells toward a desired reactivity against a targeted antigen has been
developed with promising results, attesting the feasibility of the generation of large
numbers of T cells recognizing RCC [75]. Despite of that, to date, there are no
completed clinical trials using T cells expressing recombinant TCRs for treating RCC
patients. The only known TCR with broad RCC recognition is now undergoing clinical
evaluation, even though it recognizes RCC in an unknown, non-MHC restricted
manner (www.clinicaltrials.gov: NCT00870389) [76].
Rationale of the PhD project
16
2 Rationale of the PhD project Clinical data on RCC trials include spontaneous remissions and response to cytokine
therapy [62] [77] [78], suggesting that this tumor type is susceptible to immune-
mediated effector mechanisms. T cells are found in tumors and blood of patients that
have reactivity against RCC lines when tested ex vivo. However, most RCC-reactive
T cells proliferate poorly, recognize antigens expressed only by a small set of tumors,
or use infrequent MHC-restriction elements [62]. As a consequence, there are few
suitable T cell specificities to spur clinical development. Because RCC tumors are
immune sensitive, it is conceivable that clinical benefit could be improved, if better
suited T cells can be identified.
The aims of this PhD project were:
1. to generate T cells expressing TCR specific for RCC; 2. to characterize the
functional capacity of these engineered T cells, including their functionality in a 3-D
environment that mimics the tumors more closely than 2-D monolayer cultures; 3. to
investigate whether PBLs of RCC patients can express the new specificity and be
functional and 4. to generate and characterize CD4+ T cells that recognize peptides
presented by MHC I on RCC.
Some reagents used in this thesis were generated by other PhD students of the
working group of Dr. Nößner and in collaboration with Prof. Uckert in Berlin. These
reagents and results are described in this chapter as “previous work”.
Previous work TILs were isolated from a primary ccRCC tumor of patient 53 (TIL-53) in 1993. The
specificity was analyzed by Michaela Rosmanit, who also identified the TCR
sequence [79]. TIL-53 was found to recognize its autologous tumor cell line RCC-53
and, additionally, allogeneic tumor lines, e.g. RCC-26, RCC-36 and MZ-1257,
indicating recognition of an antigen that is shared among RCC cell lines. HLA-A2
negative tumor lines were not recognized, suggesting HLA-A2 class I restricted
recognition. This was confirmed by blocking with an antibody directed against HLA-
A2. Importantly, normal kidney cultures were not recognized by TIL-53.
After limited dilution cloning, one T cell clone was identified (TIL-53.29) that
recapitulated HLA-A2 restriction and the TIL-53 reactivity pattern. Poor cell growth
___________________________________________________ Rationale of the PhD project
17
limited further detailed characterization of the parental TIL-53 and the derived T cell
clone TIL-53.29. The TCR sequences of TIL-53.29 revealed one in-frame TCR
sequence V20 and two in-frame TCR sequences V3.1 and V19, nomenclature
after Arden et al [80].
In the Diploma thesis of Leisegang [81] (collaboration group of Prof. Uckert) the TCR
V19 and TCR V20 chains were found to form the TCR53 heterodimer and were
first transduced in the TCR-deficient Jurkat 76 cells. TCR53 expression was seen in
most cells. Retroviral TCR transfer into primary human T cells, however, resulted in
very poor TCR53 expression with only 9 % CD8+TCRV20+ cells. Therefore, TCR
sequence modifications were performed, including codon optimization (GENEART,
Regensburg) and the replacement of the human TCR constant regions by their
mouse counterparts, thereby creating a human-murine chimera TCR. Using the
TCR53 sequences containing the murine constant regions (TCR53m) 19 % of
CD8+TCRV20+ cells were achieved and with the addition of codon optimization
(TCR53mc) 38 % of CD8+TCRV20+ cells was achieved. Importantly, TCR53
sequence optimization improved functionality of engineered PBLs, as seen by
superior target-specific cytokine response of PBLs transduced with MP71-TCR53mc.
The TCR53 used for engineering of PBL recipient cells analyzed in this thesis had
the optimized TCR53mc sequences.
To allow the analysis of a large panel of different tumor and non-malignant cell lines
a TCR53m-expressing indicator cell line was generated using the B3Z mouse T cell
hybridoma as the TCR53m recipient cell. The B3Z mouse T cell hybridoma is derived
from the fusion of Z.8, a derivative of the CD4+ BW5147, with the OVA/Kb-specific
cytolytic T cell clone B3 that expresses V5 endogenously [82]. TCR53m was
introduced into B3Z cells by retroviral transduction and function could be detected as
secretion of mouse IL-2 (mIL-2). Function was dependent on the expression of the
human CD8 protein, as B3Z-TCR53m that only expressed mouse CD8 did not
recognize RCC-26 [83].
Results
18
3 Results
3.1 The B3Z-TCR53m indicator cell line for the analysis of the TCR53-pMHC ligand prevalence among tumors and non-malignant cell lines
To investigate the prevalence of TCR53-pMHC ligand in a great number of cell lines,
it was important that the TCR53 recipient T cell would fulfill 3 important criteria. They
should be easily transfectable, should expand well and they should provide a reliabe
read out system for function. Because B3Z cells secrete mIL-2, are easy to cultivate
and to expand [82], they were chosen to be tranduced with the pMP71-TCR53m
retroviral vector to generate an indicator cell line named B3Z-TCR53m. To analyze
expression of the endogenous B3Z OVA-TCR after transduction of pMP71-TCR53m,
V5 on both B3Z and B3Z-TCR53m cells was analyzed by flow cytometry. The
expression level of the endogenous TCR V5 was slightly reduced after expression
of the V20+ TCR53m. B3Z-TCR53m showed uniform expression of TCR53m V20
with high MFI of positive cells. Shown is 1 representative of 2 stainings. The T2 cell
line, which does not express V5 nor V20, was used as control for the specificity of
both anti-V5 and anti-V20 antibodies (Figure 3.1a).
Even with the B3Z-TCR53m cells expressing both OVA-TCR and TCR53m, TCR53m
was functional as B3Z-TCR53m cells secreted mIL-2 in the supernatants of 24 h-
incubations with the tumor cell lines RCC-26 and RCC-53, which have the TCR53
ligand (TCR53-pMHC+), but not after coculture with NKC-26 cells, which are TCR53
pMHC-. In addition, no secretion of mIL-2 was detected in the supernatant when the
RCC cell lines or NKC-26 cells were incubated with the untransduced B3Z cells. Data
shown is the mean of 2 experiments (Figure 3.1b).

___________________________________________________________________ Results
19
Figure 3.1. Analysis of B3Z OVA-TCR (mouse V5) and TCR53 (human V20) in B3Z and B3Z-TCR53m cells and B3Z-TCR53 function.
Assessment of TCR expression in B3Z untransduced (B3Z) and B3Z transduced with pMP71-TCR53m (B3Z-TCR53m) and function of B3Z-TCR53m cells upon target recognition. (a) Using anti-
mouse V5 and anti-human V20, B3Z OVA-TCR (left) and TCR53 (right) were detected by flow cytometry. T2 cells served as negative control for both TCRs (traced line). b) Detection of mIL-2 on the 24 h supernatant of NKC-26 (white column), RCC-53 (grey column) and RCC-26 (black column) coincubations with B3Z (upper columns) or B3Z-TCR53m (lower columns) by ELISA. Data shown in (a) is a representative of two stainings and in (b) is the mean of 2 experiments. Error bars show the standard deviation. % of max (% of maximal projection) is a normalization of the y axis, where the number of cells in each bin on the x axis (256 bins) is divided by the number of cells in the bin that contains the largest number of cells.
3.1.1 High incidence of TCR53-pMHC ligand in RCC cells and in tumor cells of other histologies
T cells recognizing an antigen shared among many RCC cell lines is an important
criterium if T cell therapy is to be used for the benefit of a great number of patients.
Along the same line, the restriction of recognition by a common MHC class I allotype
would permit more patients to be considered for therapy. Furthermore, it is of great
importance that the T cells do not recognize non-malignant cells. Considering the
aspects mentioned, the frequency of TCR53-pMHC ligand occurrence in RCC and
tumors of other histologies as well as in non-transformed cell lines of normal tissue
was determined with the help of the B3Z-TCR53m cells. The distribution of the
TCR53-recognized antigen was analyzed in 33 RCC cell lines, 1 RCC primary
culture, 54 tumor cell lines of other histologies, 19 normal kidney primary cultures, 2
normal kidney cell lines and 10 other normal cell types. The method involved
0 100 200 300
mouse V5 human V20
9/110
B3Z B3Z-TCR53m T2
32/24 MFI: MFI:
% o
f m
ax
mIL-2 [pg/ml]
RCC-26 RCC-53 NKC-26
+ B3Z-
TCR53m
+ B3Z
(a) (b)
Results
20
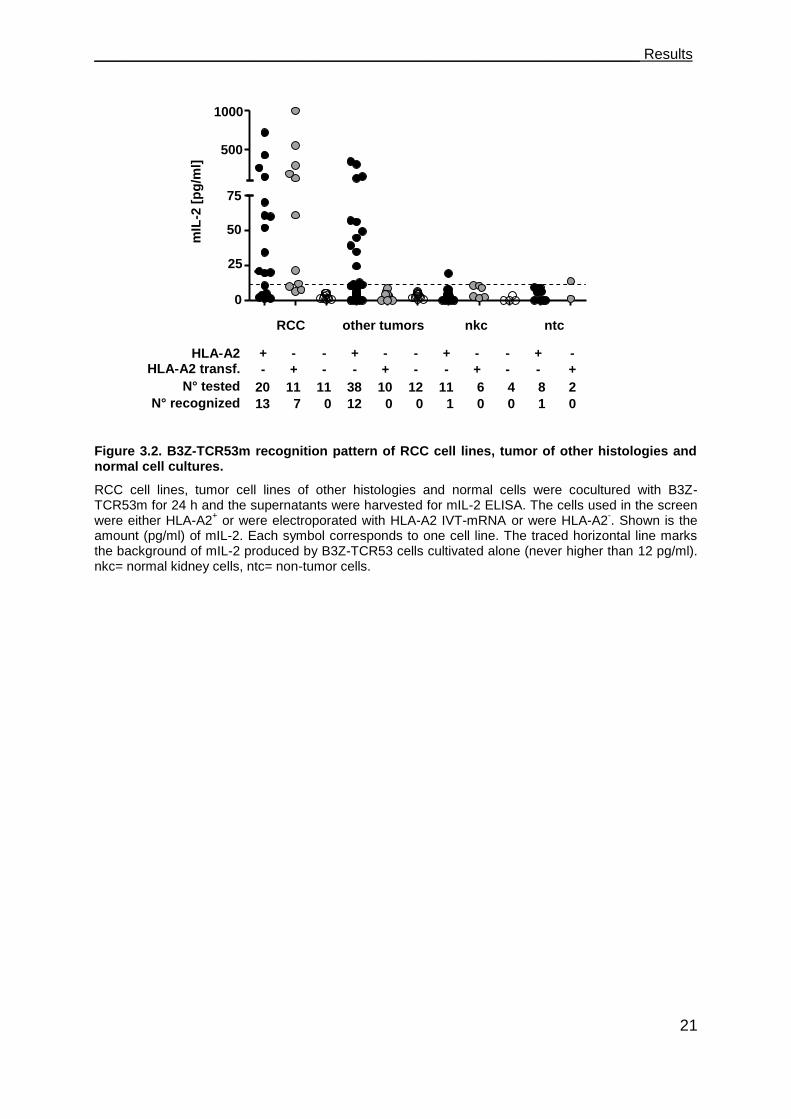
coculturing the B3Z-TCR53m with the respective cell types for 24 h after which the
cell culture supernatant was harvested and measured for the mIL-2 content by
ELISA. A summary of the results is given in Figure 3.2, details are listed in Table 1 to
4. Because the recognition of targets by the original TIL-53 population was HLA-A2
restricted, HLA-A2 status of the cell lines tested with the B3Z-TCR53m is given in the
figure and tables. 13 of 20 (65 %) HLA-A2+ RCC cell lines and the primary culture
tested were found to stimulate mIL-2 secretion above the background (12 pg/ml) after
coculture with B3Z-TCR53m cells (Figure 3.2, Table 1). None of the 11 HLA-A2- RCC
cell lines stimulated secretion of mIL-2 above the background. To determine how
many of the HLA-A2- RCC did express the TCR53 recognized antigen, HLA-A2- RCC
cell lines were electroporated with HLA-A2 in vitro transcribed (IVT)-mRNA. HLA-A2
expression was confirmed by flow cytometry (not shown). 7 of the 11 RCC lines
transfected with HLA-A2 IVT-mRNA (64 %) induced mIL-2 secretion of the B3Z-
TCR53m. Of the 30 HLA-A2+ RCC lines, 16 are of known clear cell histology. B3Z-
TCR53m recognition was observed for 11 (73 %) of the ccRCC (Figure 3.2, Table 1).
To determine whether the TCR53-pMHC ligand is present on healthy tissue cells, 27
human normal cell cultures, among 17 normal kidney cultures (primary cell cultures
and cell lines, Table 2), 7 PBMC from healthy donors, a brain microvascular
endothelial cell line (BMEC), a mesenchymal stem cell (MSC) and a fibroblast cell
line (K4IM), which either expressed HLA-A2 endogenously or after HLA-A2 IVT-
mRNA electroporation (Table 3), were tested for TCR53-pMHC ligand expression.
Only one of the normal kidney cells (NKC-33) induced marginal mIL-2 secretion (19
pg/ml). None of the PBMC were recognized. The fibroblast cell line K4IM induced
mIL-2 secretion (14 pg/ml) slightly over background.
To investigate if the TCR53-pMHC ligand is also present on other tumors than RCC,
55 tumor lines of other origins were tested. From the 48 cell lines expressing HLA-A2
endogenously or after electroporation with HLA-A2 IVT-mRNA, 12 (25 %) were
recognized by B3Z-TCR53m. Among the recognized tumor histologies were
lymphocytic malignancies like EBV-transformed B-lymphoblastoid cells (LCL-1 and
LCL-4) and B-lymphocytic lymphoma (Nalm-6, SKW-6, Granta-519), brain tumor
lines (glioblastoma U-373, neuroblastoma SK-NSH and astrocytoma U-251MG), 1
melanoma (BLM), 1 pancreatic adenocarcinoma (Panc-Tu1), and 1 squamous cell
carcinoma (UT-SCC-15) (Figure 3.2, Table 4).
___________________________________________________________________ Results
21
Figure 3.2. B3Z-TCR53m recognition pattern of RCC cell lines, tumor of other histologies and normal cell cultures.
RCC cell lines, tumor cell lines of other histologies and normal cells were cocultured with B3Z-TCR53m for 24 h and the supernatants were harvested for mIL-2 ELISA. The cells used in the screen were either HLA-A2
+ or were electroporated with HLA-A2 IVT-mRNA or were HLA-A2
-. Shown is the
amount (pg/ml) of mIL-2. Each symbol corresponds to one cell line. The traced horizontal line marks the background of mIL-2 produced by B3Z-TCR53 cells cultivated alone (never higher than 12 pg/ml). nkc= normal kidney cells, ntc= non-tumor cells.
+ - - + - - + - - + -
- + - - + - - + - - +
HLA-A2 HLA-A2 transf.
N° tested
N° recognized
RCC other tumors nkc ntc
1000
500
75
50
25
0
RCC A
2
RCC A
2tf
RCC A
2-
tum
ors A
2
tum
ors A
2tf
tum
r A2-
NKC A
2
NKC A
2trf
NKC A
2-
NCL A
2
NCL A
2tf
0
25
50
75
500
1000
mIL
-2 [
pg
/ml]
20 11 11 38 10 12 11 6 4 8 2
13 7 0 12 0 0 1 0 0 1 0
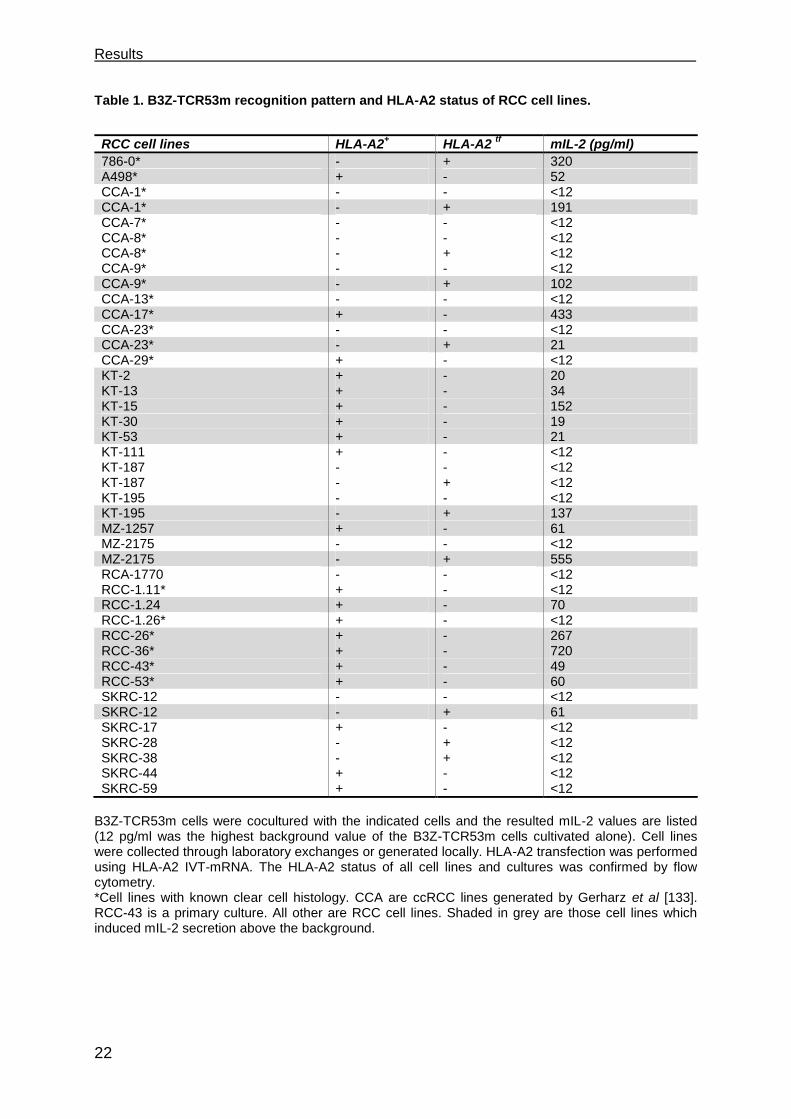
Results
22
Table 1. B3Z-TCR53m recognition pattern and HLA-A2 status of RCC cell lines.
RCC cell lines HLA-A2
+ HLA-A2
tf mIL-2 (pg/ml)
786-0* - + 320 A498* + - 52 CCA-1* - - <12 CCA-1* - + 191 CCA-7* - - <12 CCA-8* - - <12 CCA-8* - + <12 CCA-9* - - <12 CCA-9* - + 102 CCA-13* - - <12 CCA-17* + - 433 CCA-23* - - <12 CCA-23* - + 21 CCA-29* + - <12 KT-2 + - 20 KT-13 + - 34 KT-15 + - 152 KT-30 + - 19 KT-53 + - 21 KT-111 + - <12 KT-187 - - <12 KT-187 - + <12 KT-195 - - <12 KT-195 - + 137 MZ-1257 + - 61 MZ-2175 - - <12 MZ-2175 - + 555 RCA-1770 - - <12 RCC-1.11* + - <12 RCC-1.24 + - 70 RCC-1.26* + - <12 RCC-26* + - 267 RCC-36* + - 720 RCC-43* + - 49 RCC-53* + - 60 SKRC-12 - - <12 SKRC-12 - + 61 SKRC-17 + - <12 SKRC-28 - + <12 SKRC-38 - + <12 SKRC-44 + - <12 SKRC-59 + - <12
B3Z-TCR53m cells were cocultured with the indicated cells and the resulted mIL-2 values are listed (12 pg/ml was the highest background value of the B3Z-TCR53m cells cultivated alone). Cell lines were collected through laboratory exchanges or generated locally. HLA-A2 transfection was performed using HLA-A2 IVT-mRNA. The HLA-A2 status of all cell lines and cultures was confirmed by flow cytometry. *Cell lines with known clear cell histology. CCA are ccRCC lines generated by Gerharz et al [133]. RCC-43 is a primary culture. All other are RCC cell lines. Shaded in grey are those cell lines which induced mIL-2 secretion above the background.
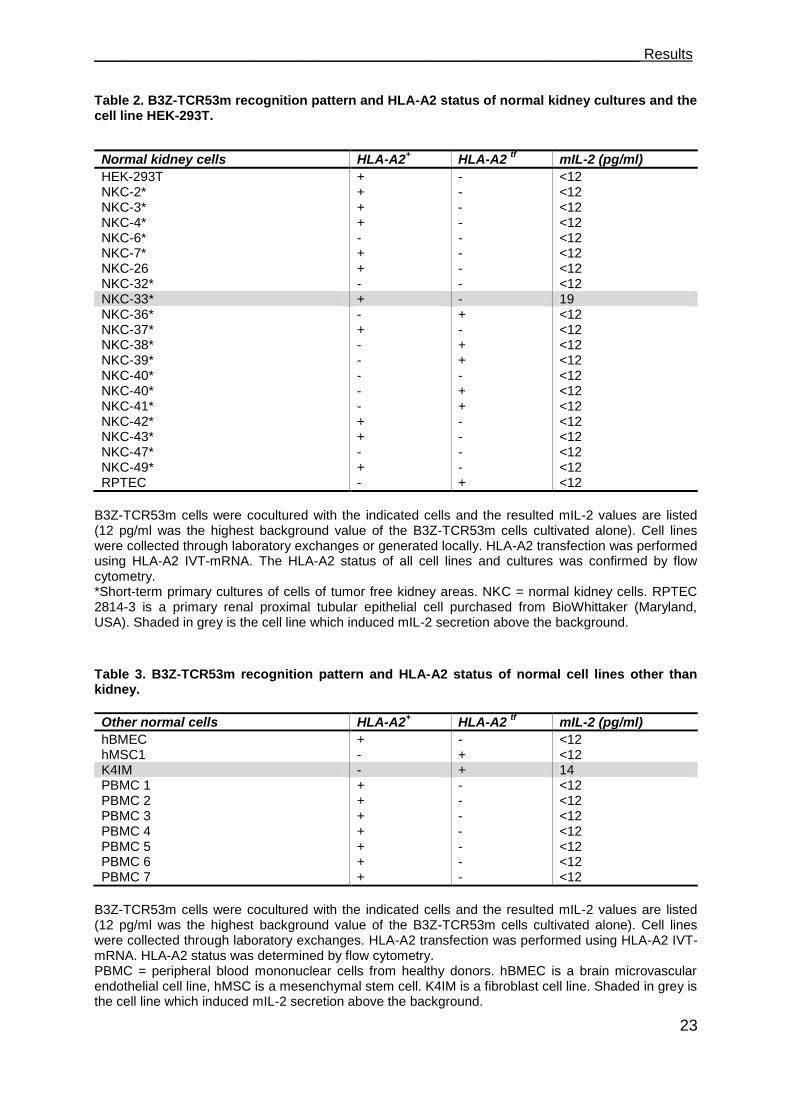
___________________________________________________________________ Results
23
Table 2. B3Z-TCR53m recognition pattern and HLA-A2 status of normal kidney cultures and the cell line HEK-293T.
Normal kidney cells HLA-A2
+ HLA-A2
tf mIL-2 (pg/ml)
HEK-293T + - <12 NKC-2* + - <12 NKC-3* + - <12 NKC-4* + - <12 NKC-6* - - <12 NKC-7* + - <12 NKC-26 + - <12 NKC-32* - - <12 NKC-33* + - 19 NKC-36* - + <12 NKC-37* + - <12 NKC-38* - + <12 NKC-39* - + <12 NKC-40* - - <12 NKC-40* - + <12 NKC-41* - + <12 NKC-42* + - <12 NKC-43* + - <12 NKC-47* - - <12 NKC-49* + - <12 RPTEC - + <12
B3Z-TCR53m cells were cocultured with the indicated cells and the resulted mIL-2 values are listed (12 pg/ml was the highest background value of the B3Z-TCR53m cells cultivated alone). Cell lines were collected through laboratory exchanges or generated locally. HLA-A2 transfection was performed using HLA-A2 IVT-mRNA. The HLA-A2 status of all cell lines and cultures was confirmed by flow cytometry. *Short-term primary cultures of cells of tumor free kidney areas. NKC = normal kidney cells. RPTEC 2814-3 is a primary renal proximal tubular epithelial cell purchased from BioWhittaker (Maryland, USA). Shaded in grey is the cell line which induced mIL-2 secretion above the background. Table 3. B3Z-TCR53m recognition pattern and HLA-A2 status of normal cell lines other than kidney.
Other normal cells HLA-A2+ HLA-A2
tf mIL-2 (pg/ml)
hBMEC + - <12 hMSC1 - + <12 K4IM - + 14 PBMC 1 + - <12 PBMC 2 + - <12 PBMC 3 + - <12 PBMC 4 + - <12 PBMC 5 + - <12 PBMC 6 + - <12 PBMC 7 + - <12
B3Z-TCR53m cells were cocultured with the indicated cells and the resulted mIL-2 values are listed (12 pg/ml was the highest background value of the B3Z-TCR53m cells cultivated alone). Cell lines were collected through laboratory exchanges. HLA-A2 transfection was performed using HLA-A2 IVT-mRNA. HLA-A2 status was determined by flow cytometry. PBMC = peripheral blood mononuclear cells from healthy donors. hBMEC is a brain microvascular endothelial cell line, hMSC is a mesenchymal stem cell. K4IM is a fibroblast cell line. Shaded in grey is the cell line which induced mIL-2 secretion above the background.
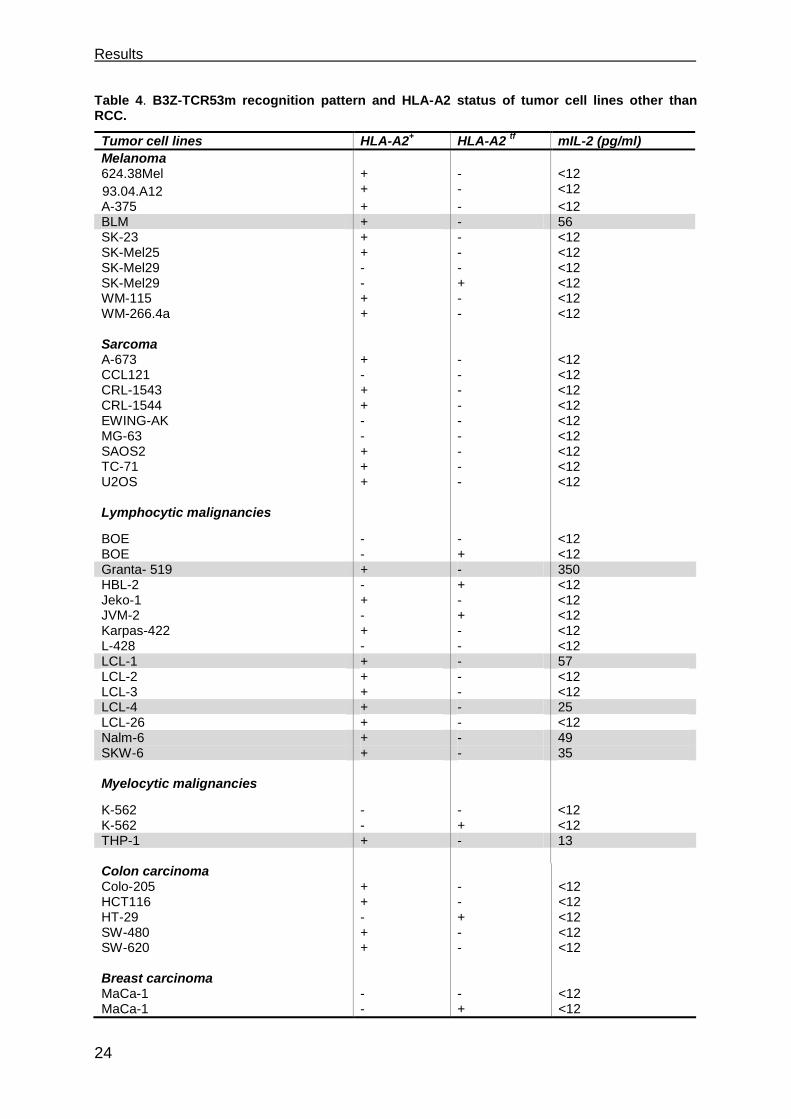
Results
24
Table 4. B3Z-TCR53m recognition pattern and HLA-A2 status of tumor cell lines other than RCC.
Tumor cell lines HLA-A2+ HLA-A2
tf mIL-2 (pg/ml)
Melanoma 624.38Mel + - <12
93.04.A12
+ - <12
A-375 + - <12 BLM + - 56 SK-23 + - <12 SK-Mel25 + - <12 SK-Mel29 - - <12 SK-Mel29 - + <12 WM-115 + - <12 WM-266.4a + - <12 Sarcoma A-673 + - <12 CCL121 - - <12 CRL-1543 + - <12 CRL-1544 + - <12 EWING-AK - - <12 MG-63 - - <12 SAOS2 + - <12 TC-71 + - <12 U2OS + - <12 Lymphocytic malignancies
BOE - - <12 BOE - + <12 Granta- 519 + - 350 HBL-2 - + <12 Jeko-1 + - <12 JVM-2 - + <12 Karpas-422 + - <12 L-428 - - <12 LCL-1 + - 57 LCL-2 + - <12 LCL-3 + - <12 LCL-4 + - 25 LCL-26 + - <12 Nalm-6 + - 49 SKW-6 + - 35 Myelocytic malignancies
K-562 - - <12 K-562 - + <12 THP-1 + - 13 Colon carcinoma Colo-205 + - <12 HCT116 + - <12 HT-29 - + <12 SW-480 + - <12 SW-620 + - <12 Breast carcinoma MaCa-1 - - <12 MaCa-1 - + <12
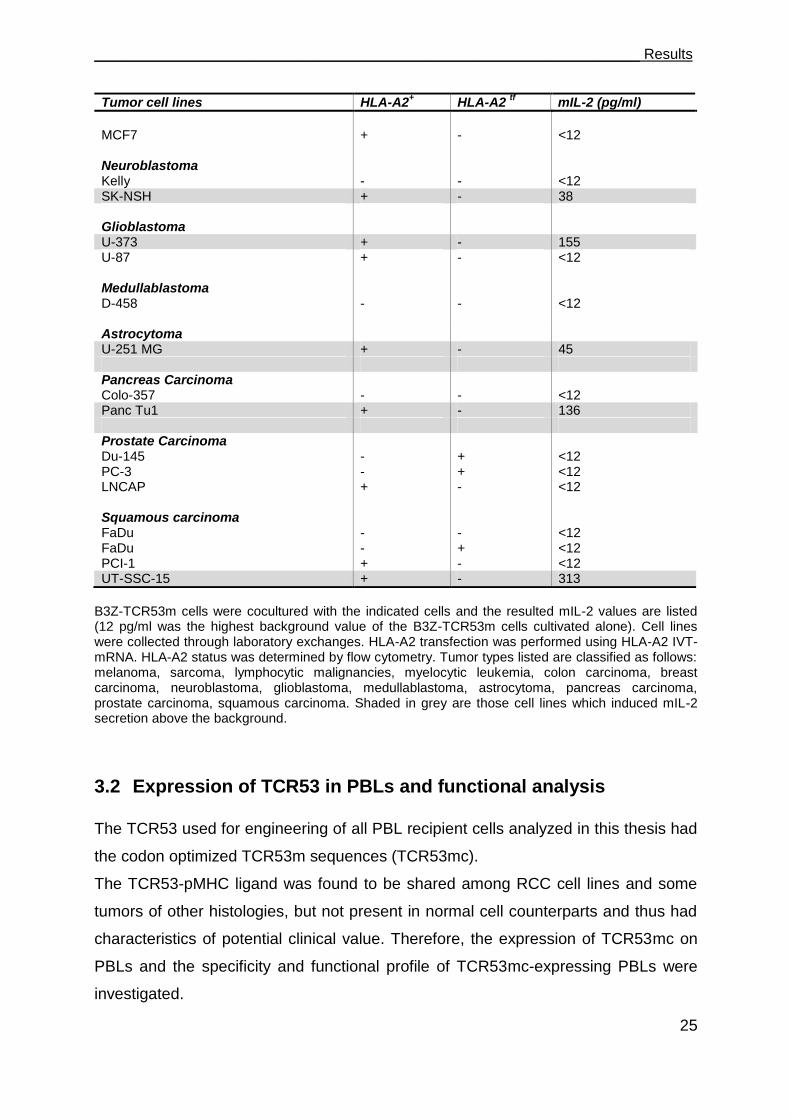
___________________________________________________________________ Results
25
Tumor cell lines HLA-A2+ HLA-A2
tf mIL-2 (pg/ml)
MCF7 + - <12 Neuroblastoma Kelly - - <12 SK-NSH + - 38 Glioblastoma U-373 + - 155 U-87 + - <12 Medullablastoma D-458 - - <12 Astrocytoma U-251 MG + - 45 Pancreas Carcinoma Colo-357 - - <12 Panc Tu1 + - 136 Prostate Carcinoma Du-145 - + <12 PC-3 - + <12 LNCAP + - <12 Squamous carcinoma FaDu - - <12 FaDu - + <12 PCI-1 + - <12 UT-SSC-15 + - 313
B3Z-TCR53m cells were cocultured with the indicated cells and the resulted mIL-2 values are listed (12 pg/ml was the highest background value of the B3Z-TCR53m cells cultivated alone). Cell lines were collected through laboratory exchanges. HLA-A2 transfection was performed using HLA-A2 IVT-mRNA. HLA-A2 status was determined by flow cytometry. Tumor types listed are classified as follows: melanoma, sarcoma, lymphocytic malignancies, myelocytic leukemia, colon carcinoma, breast carcinoma, neuroblastoma, glioblastoma, medullablastoma, astrocytoma, pancreas carcinoma, prostate carcinoma, squamous carcinoma. Shaded in grey are those cell lines which induced mIL-2 secretion above the background.
3.2 Expression of TCR53 in PBLs and functional analysis
The TCR53 used for engineering of all PBL recipient cells analyzed in this thesis had
the codon optimized TCR53m sequences (TCR53mc).
The TCR53-pMHC ligand was found to be shared among RCC cell lines and some
tumors of other histologies, but not present in normal cell counterparts and thus had
characteristics of potential clinical value. Therefore, the expression of TCR53mc on
PBLs and the specificity and functional profile of TCR53mc-expressing PBLs were
investigated.
Results
26
3.2.1 Cross-pairing of TCR53mc with endogenous TCR of PBLs.
A possible complication of the expression of additional TCR and β chains in PBL is
the formation of TCR hybrids between the newly introduced TCR chains with the
endogenous TCR chains. Unknown TCR specificities could be created that could
recognize epitopes on normal tissue leading to autoimmunity. The replacement of the
human TCR constant region by the murine TCR constant region is thought to
minimize the occurrence of hybrids by fostering the pairing between the two and
chains containing the murine constant region. To assess the formation of hybrid TCR
pairs of endogenous and TCR53mc chains in PBLs, IVT-mRNA of TCR53mc and β
chains were individually electroporated in PBLs of healthy donors. Electroporation of
both TCR53mc and β chains together served as positive control for the
electroporation and function of the PBLs examined. The detection on the cell surface
of TCRs formed with the TCR53mc β chain was done by staining with anti-murine
TCR chain antibody (anti-mTCR), labeled with APC. The anti-mTCR antibody
detects the murine constant region of the TCR53mc chain, but does not detect the
endogenous human TCR of the PBLs. Cross-pairing of the TCR53mc chain with
endogenous chains could not be analyzed because there are no antibodies to
detect neither the murine constant TCR chain nor the human TCR V19 of
TCR53mc. After electroporation of the TCR53mc chain IVT-mRNA into PBLs (left
plot Figure 3.3a), hardly any (2 %) of the PBLs were found positive for the mTCR
antibody indicating that pairing of endogenous TCR chains with the transfected
TCR53mc chain was a rare event. Electroporation of both the TCR53mc and
chain IVT-mRNA (right plot, Figure 3.3a) resulted in 25 % mTCR-expressing cells.
To investigate whether mixed pairs of the TCR53mc or chains with the
endogenous PBL TCR or chains, respectively, would have the specificity as the
TCR53mc heterodimer, PBLs electroporated with either TCR53mc or chains
IVT-mRNA or with TCR53mc plus chains IVT-mRNA (TCR53mc ) were
cocultured with the tumor cells RCC-26 for 5 hours in the presence of intracellular
transport blockers (monensin and brefeldin A (BFA)) to enrich cytokines in the
endoplasmatic reticulum. Staining with 7-AAD allowed the analysis of viable cells
(gated on 7-AAD-) and staining with anti-CD45 (conjugated with PE-Cy7)
discriminated the lymphocytes from the tumor cells (gated on CD45+). Recognition of
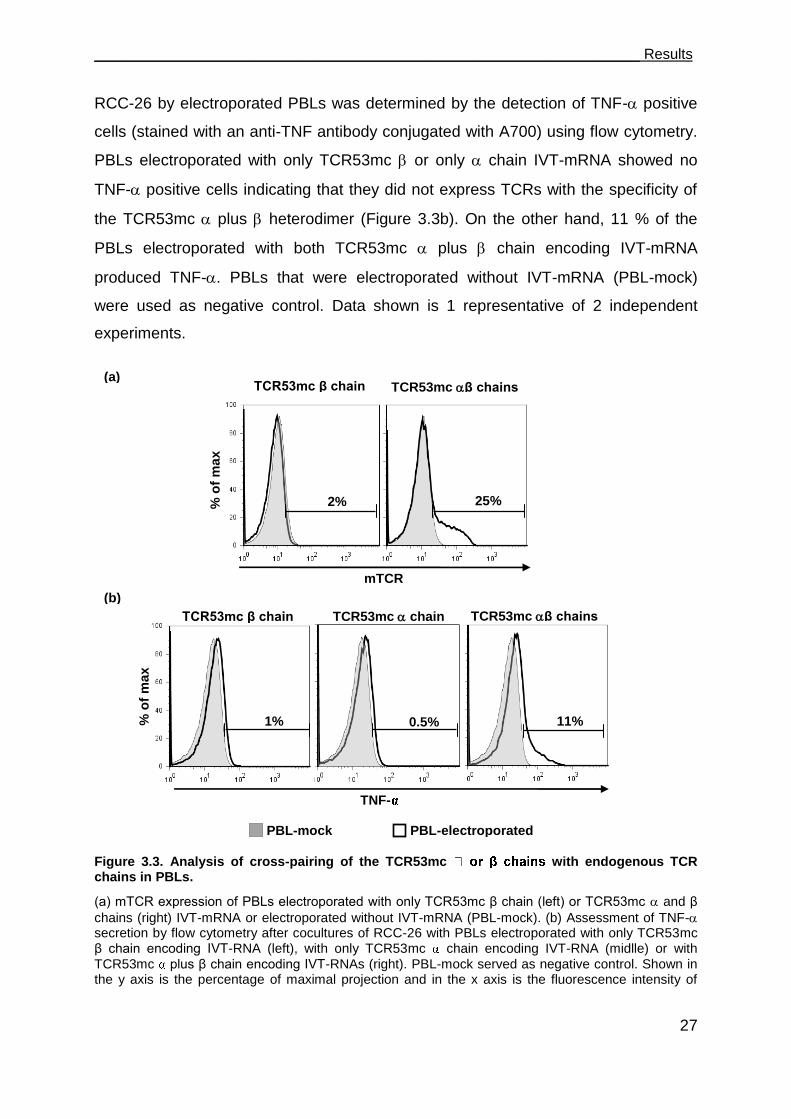
___________________________________________________________________ Results
27
RCC-26 by electroporated PBLs was determined by the detection of TNF- positive
cells (stained with an anti-TNF antibody conjugated with A700) using flow cytometry.
PBLs electroporated with only TCR53mc or only chain IVT-mRNA showed no
TNF- positive cells indicating that they did not express TCRs with the specificity of
the TCR53mc plus heterodimer (Figure 3.3b). On the other hand, 11 % of the
PBLs electroporated with both TCR53mc plus chain encoding IVT-mRNA
produced TNF-. PBLs that were electroporated without IVT-mRNA (PBL-mock)
were used as negative control. Data shown is 1 representative of 2 independent
experiments.
Figure 3.3. Analysis of cross-pairing of the TCR53mc with endogenous TCR chains in PBLs.
(a) mTCR expression of PBLs electroporated with only TCR53mc β chain (left) or TCR53mc and β
chains (right) IVT-mRNA or electroporated without IVT-mRNA (PBL-mock). (b) Assessment of TNF- secretion by flow cytometry after cocultures of RCC-26 with PBLs electroporated with only TCR53mc β chain encoding IVT-RNA (left), with only TCR53mc chain encoding IVT-RNA (midlle) or with
TCR53mc plus β chain encoding IVT-RNAs (right). PBL-mock served as negative control. Shown in the y axis is the percentage of maximal projection and in the x axis is the fluorescence intensity of
TCR53mc β chains TCR53mc β chain
mTCR
TNF-
PBL-mock PBL-electroporated
25% 2%
11% 0.5% 1%
% o
f m
ax
(a)
(b)
% o
f m
ax
TCR53mc β chains TCR53mc β chain TCR53mc chain
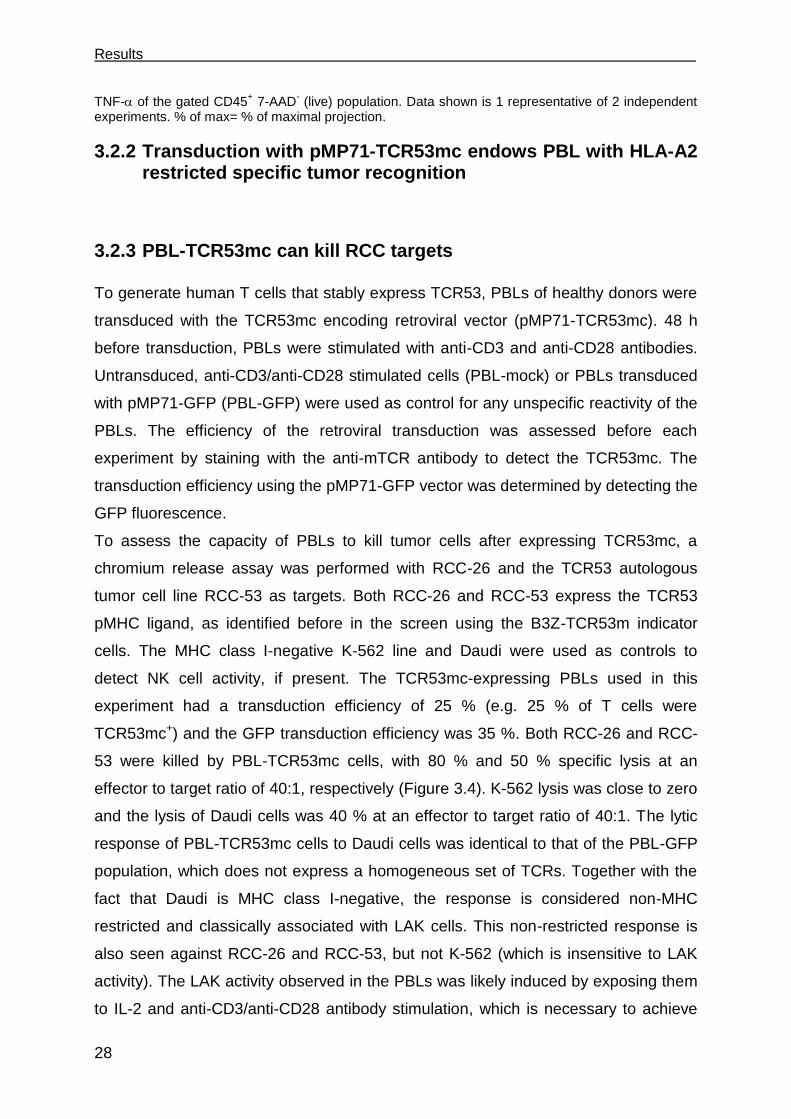
Results
28
TNF- of the gated CD45+ 7-AAD
- (live) population. Data shown is 1 representative of 2 independent
experiments. % of max= % of maximal projection.
3.2.2 Transduction with pMP71-TCR53mc endows PBL with HLA-A2 restricted specific tumor recognition
3.2.3 PBL-TCR53mc can kill RCC targets
To generate human T cells that stably express TCR53, PBLs of healthy donors were
transduced with the TCR53mc encoding retroviral vector (pMP71-TCR53mc). 48 h
before transduction, PBLs were stimulated with anti-CD3 and anti-CD28 antibodies.
Untransduced, anti-CD3/anti-CD28 stimulated cells (PBL-mock) or PBLs transduced
with pMP71-GFP (PBL-GFP) were used as control for any unspecific reactivity of the
PBLs. The efficiency of the retroviral transduction was assessed before each
experiment by staining with the anti-mTCR antibody to detect the TCR53mc. The
transduction efficiency using the pMP71-GFP vector was determined by detecting the
GFP fluorescence.
To assess the capacity of PBLs to kill tumor cells after expressing TCR53mc, a
chromium release assay was performed with RCC-26 and the TCR53 autologous
tumor cell line RCC-53 as targets. Both RCC-26 and RCC-53 express the TCR53
pMHC ligand, as identified before in the screen using the B3Z-TCR53m indicator
cells. The MHC class I-negative K-562 line and Daudi were used as controls to
detect NK cell activity, if present. The TCR53mc-expressing PBLs used in this
experiment had a transduction efficiency of 25 % (e.g. 25 % of T cells were
TCR53mc+) and the GFP transduction efficiency was 35 %. Both RCC-26 and RCC-
53 were killed by PBL-TCR53mc cells, with 80 % and 50 % specific lysis at an
effector to target ratio of 40:1, respectively (Figure 3.4). K-562 lysis was close to zero
and the lysis of Daudi cells was 40 % at an effector to target ratio of 40:1. The lytic
response of PBL-TCR53mc cells to Daudi cells was identical to that of the PBL-GFP
population, which does not express a homogeneous set of TCRs. Together with the
fact that Daudi is MHC class I-negative, the response is considered non-MHC
restricted and classically associated with LAK cells. This non-restricted response is
also seen against RCC-26 and RCC-53, but not K-562 (which is insensitive to LAK
activity). The LAK activity observed in the PBLs was likely induced by exposing them
to IL-2 and anti-CD3/anti-CD28 antibody stimulation, which is necessary to achieve
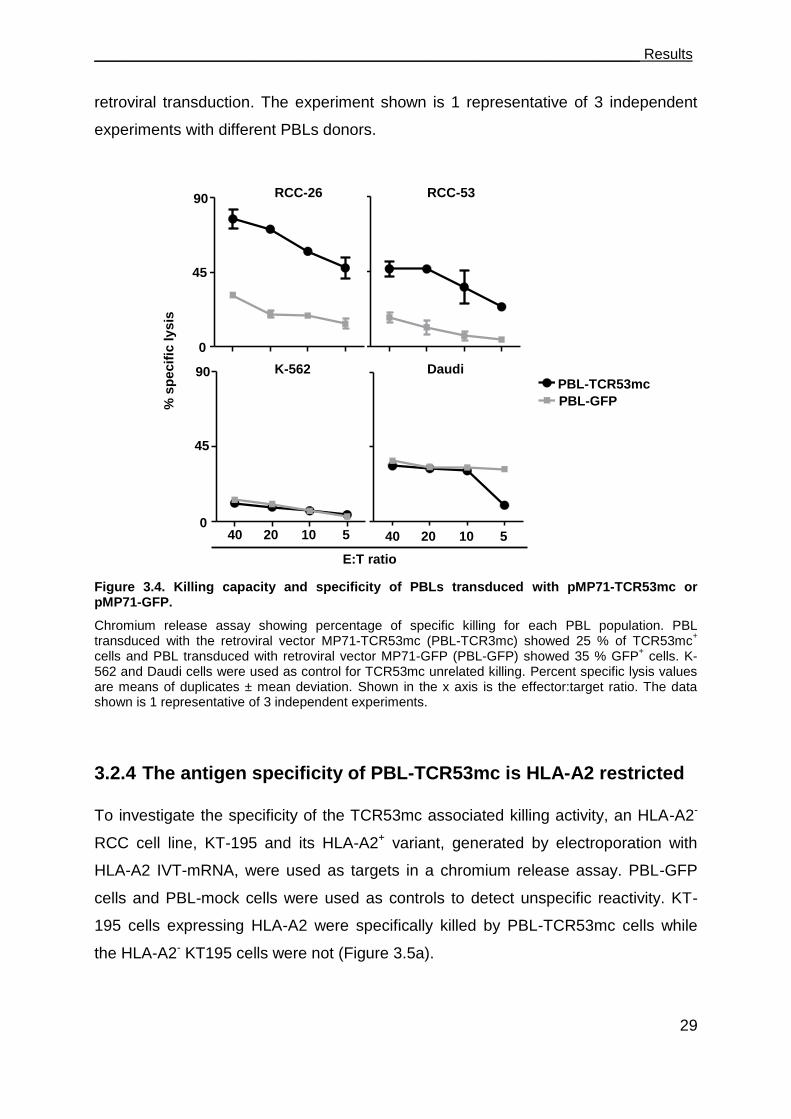
___________________________________________________________________ Results
29
retroviral transduction. The experiment shown is 1 representative of 3 independent
experiments with different PBLs donors.
Figure 3.4. Killing capacity and specificity of PBLs transduced with pMP71-TCR53mc or pMP71-GFP.
Chromium release assay showing percentage of specific killing for each PBL population. PBL transduced with the retroviral vector MP71-TCR53mc (PBL-TCR3mc) showed 25 % of TCR53mc
+
cells and PBL transduced with retroviral vector MP71-GFP (PBL-GFP) showed 35 % GFP+ cells. K-
562 and Daudi cells were used as control for TCR53mc unrelated killing. Percent specific lysis values are means of duplicates ± mean deviation. Shown in the x axis is the effector:target ratio. The data shown is 1 representative of 3 independent experiments.
3.2.4 The antigen specificity of PBL-TCR53mc is HLA-A2 restricted
To investigate the specificity of the TCR53mc associated killing activity, an HLA-A2-
RCC cell line, KT-195 and its HLA-A2+ variant, generated by electroporation with
HLA-A2 IVT-mRNA, were used as targets in a chromium release assay. PBL-GFP
cells and PBL-mock cells were used as controls to detect unspecific reactivity. KT-
195 cells expressing HLA-A2 were specifically killed by PBL-TCR53mc cells while
the HLA-A2- KT195 cells were not (Figure 3.5a).
RCC53
40 20 10 50
45
90RCC-53
GFP
K562
40 20 10 50
45
90K562
GFP
RCC-53
PBL-TCR53mc
PBL-GFP
RCC26
40 20 10 50
45
90RCC-26
GFP
40 20 10 50
45
90Daudi
GFP
RCC-26
K-562 Daudi
% s
pecif
ic ly
sis
0
45
90
0
45
90
40 20 10 5 40 20 10 5
E:T ratio

Results
30
Further substantiation of the HLA-A2 restricted specificity of TCR53mc was obtained
by blocking the HLA-A2-TCR53mc interaction using the anti-HLA-A2 antibody HB-54.
RCC-26 cells were used for the induction of IFN- secretion by the PBL-TCR53mc
cells. Detection of IFN- in the supernatant of 24 h effector-target cocultures was
done by ELISA. The isotype antibody was used as a specificity control and the
cocultures in the absence of antibody were the positive control for IFN- secretion by
the PBL-TCR53mc cells.
Figure 3.5: Analysis of HLA-A2 restriction of PBLs transduced with pMP71-TCR53mc.
(a) Specific killing of KT-195 HLA-A2- (left) or KT-195 transfected with HLA-A2 IVT-mRNA (right) by
PBL-TCR53mc, PBL-GFP or PBL-mock cells assessed by chromium release. Shown in the x axis is the effector:target ratio. The percentage of specific lysis values are means of duplicates ± mean
deviation. (b) IFN- detection by ELISA (pg/ml) of 24 h supernatants of PBL-TCR53mc cultivated with RCC-26 or NKC-26 without addition of antibodies ( no AB), with the IgG1 isotype antibody (Iso) or with the HLA-A2 specific antibody HB-54 (HB-54). Error bars are the mean deviation. The experiment shown is 1 representative of 3 independent experiments with PBLs of different donors.
no AB no AB Iso Iso HB-54
PBL-TCR53mc/RCC-26
cocultures
HB-54
80 40 20 100
45
90PBL-TCR53
PBL
GFP
% s
pecif
ic ly
sis
80 40 20 100
45
90PBL-TCR53
PBL
GFP
PBL-mock
PBL-GFP
PBL-TCR53mc
0
45
90
80 40 20 10 80 40 20 10
KT-195 KT-195 A2tf
0
1000
2000
(a)
(b)
IFN
-γ [
pg
/ml]
PBL-TCR53mc/NKC-26
cocultures
E:T ratio
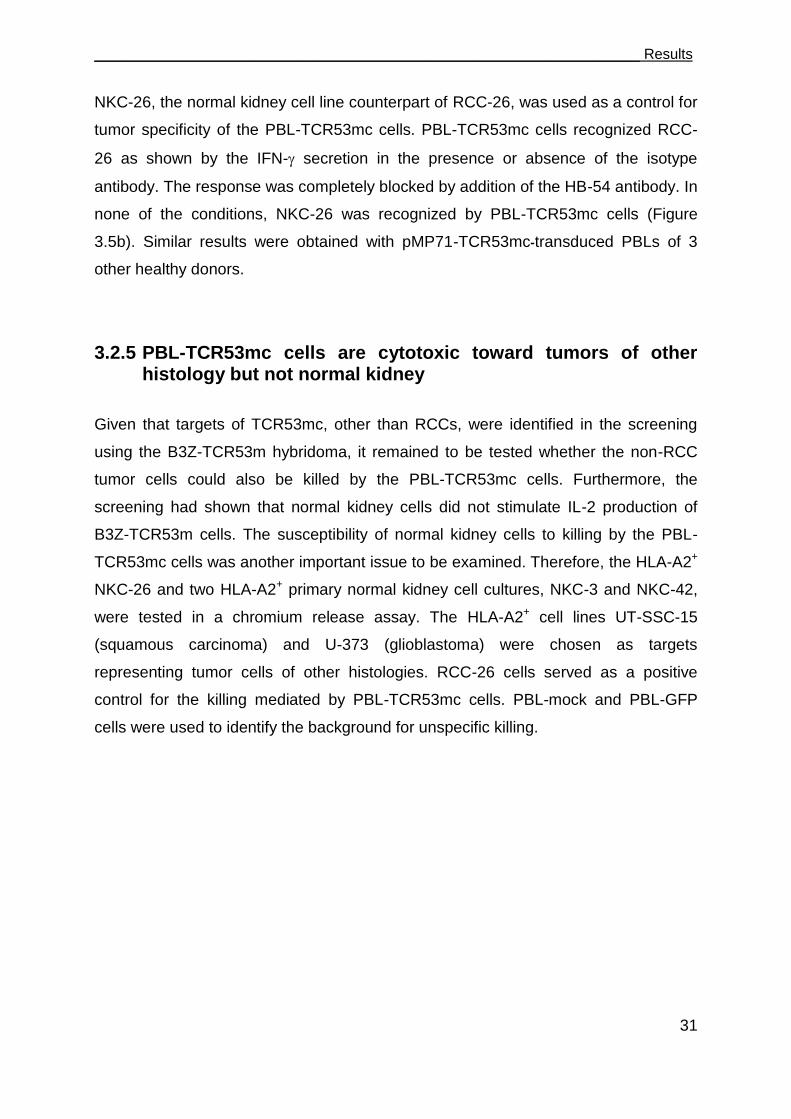
___________________________________________________________________ Results
31
NKC-26, the normal kidney cell line counterpart of RCC-26, was used as a control for
tumor specificity of the PBL-TCR53mc cells. PBL-TCR53mc cells recognized RCC-
26 as shown by the IFN- secretion in the presence or absence of the isotype
antibody. The response was completely blocked by addition of the HB-54 antibody. In
none of the conditions, NKC-26 was recognized by PBL-TCR53mc cells (Figure
3.5b). Similar results were obtained with pMP71-TCR53mc-transduced PBLs of 3
other healthy donors.
3.2.5 PBL-TCR53mc cells are cytotoxic toward tumors of other histology but not normal kidney
Given that targets of TCR53mc, other than RCCs, were identified in the screening
using the B3Z-TCR53m hybridoma, it remained to be tested whether the non-RCC
tumor cells could also be killed by the PBL-TCR53mc cells. Furthermore, the
screening had shown that normal kidney cells did not stimulate IL-2 production of
B3Z-TCR53m cells. The susceptibility of normal kidney cells to killing by the PBL-
TCR53mc cells was another important issue to be examined. Therefore, the HLA-A2+
NKC-26 and two HLA-A2+ primary normal kidney cell cultures, NKC-3 and NKC-42,
were tested in a chromium release assay. The HLA-A2+ cell lines UT-SSC-15
(squamous carcinoma) and U-373 (glioblastoma) were chosen as targets
representing tumor cells of other histologies. RCC-26 cells served as a positive
control for the killing mediated by PBL-TCR53mc cells. PBL-mock and PBL-GFP
cells were used to identify the background for unspecific killing.
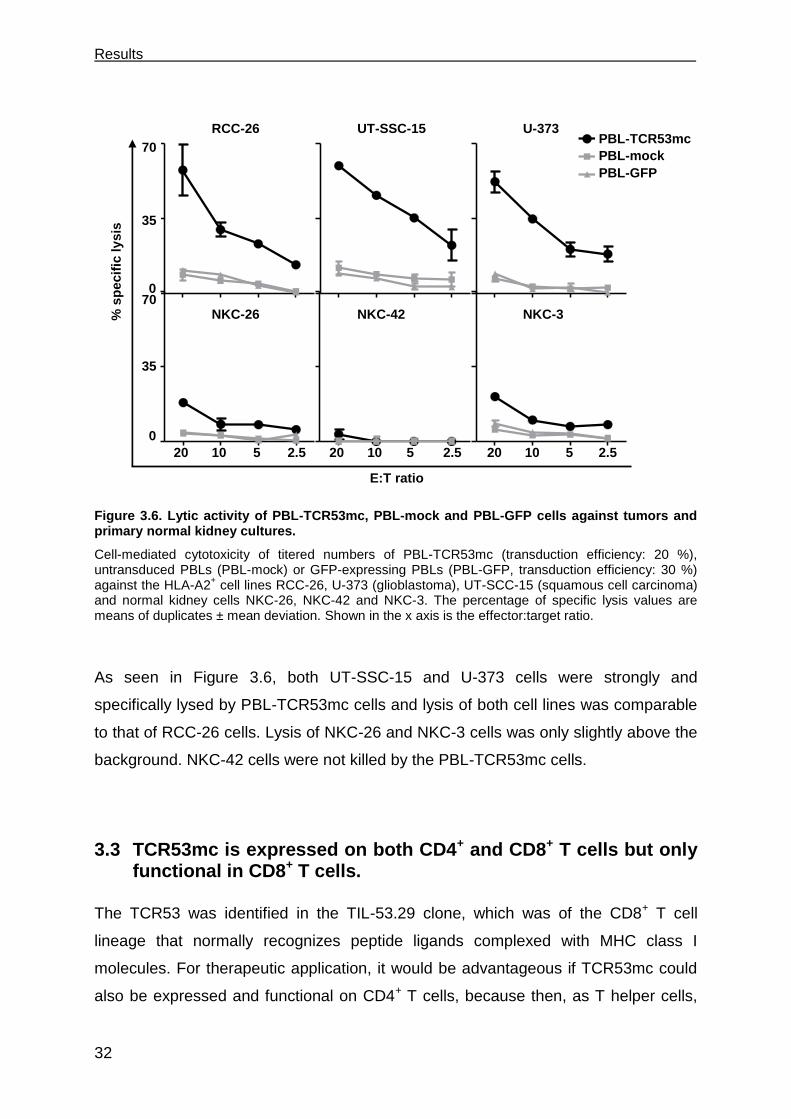
Results
32
Figure 3.6. Lytic activity of PBL-TCR53mc, PBL-mock and PBL-GFP cells against tumors and primary normal kidney cultures.
Cell-mediated cytotoxicity of titered numbers of PBL-TCR53mc (transduction efficiency: 20 %), untransduced PBLs (PBL-mock) or GFP-expressing PBLs (PBL-GFP, transduction efficiency: 30 %) against the HLA-A2
+ cell lines RCC-26, U-373 (glioblastoma), UT-SCC-15 (squamous cell carcinoma)
and normal kidney cells NKC-26, NKC-42 and NKC-3. The percentage of specific lysis values are means of duplicates ± mean deviation. Shown in the x axis is the effector:target ratio.
As seen in Figure 3.6, both UT-SSC-15 and U-373 cells were strongly and
specifically lysed by PBL-TCR53mc cells and lysis of both cell lines was comparable
to that of RCC-26 cells. Lysis of NKC-26 and NKC-3 cells was only slightly above the
background. NKC-42 cells were not killed by the PBL-TCR53mc cells.
3.3 TCR53mc is expressed on both CD4+ and CD8+ T cells but only functional in CD8+ T cells.
The TCR53 was identified in the TIL-53.29 clone, which was of the CD8+ T cell
lineage that normally recognizes peptide ligands complexed with MHC class I
molecules. For therapeutic application, it would be advantageous if TCR53mc could
also be expressed and functional on CD4+ T cells, because then, as T helper cells,
20 10 5 2,50
35
70PBL-TCR53
PBL
GFP
20 10 5 2,5
PBL-TCR53
PBL
GFP
20 10 5 2,5
PBL-TCR53
PBL
GFP
20 10 5 2,5
PBL-TCR53
PBL
GFP
20 10 5 2,5
PBL-TCR53
PBL
GFP
20 10 5 2,5
PBL-TCR53
PBL
GFP
0
35
70 0
35
70
20 10 5 2,5
PBL-TCR53
PBL
GFP
PBL-TCR53mc
PBL-mock
PBL-GFP
RCC-26 UT-SSC-15 U-373
NKC-26 NKC-42 NKC-3
20 10 5 2.5 20 10 5 2.5 20 10 5 2.5
% s
pecif
ic ly
sis
E:T ratio
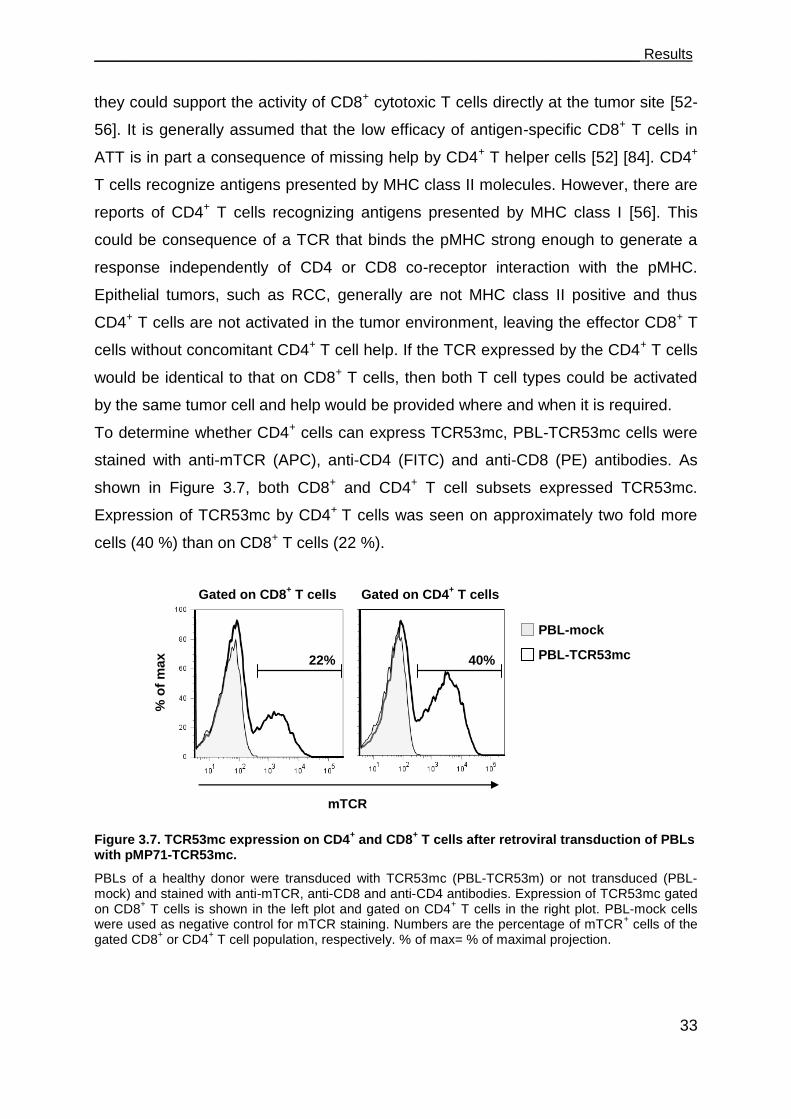
___________________________________________________________________ Results
33
they could support the activity of CD8+ cytotoxic T cells directly at the tumor site [52-
56]. It is generally assumed that the low efficacy of antigen-specific CD8+ T cells in
ATT is in part a consequence of missing help by CD4+ T helper cells [52] [84]. CD4+
T cells recognize antigens presented by MHC class II molecules. However, there are
reports of CD4+ T cells recognizing antigens presented by MHC class I [56]. This
could be consequence of a TCR that binds the pMHC strong enough to generate a
response independently of CD4 or CD8 co-receptor interaction with the pMHC.
Epithelial tumors, such as RCC, generally are not MHC class II positive and thus
CD4+ T cells are not activated in the tumor environment, leaving the effector CD8+ T
cells without concomitant CD4+ T cell help. If the TCR expressed by the CD4+ T cells
would be identical to that on CD8+ T cells, then both T cell types could be activated
by the same tumor cell and help would be provided where and when it is required.
To determine whether CD4+ cells can express TCR53mc, PBL-TCR53mc cells were
stained with anti-mTCR (APC), anti-CD4 (FITC) and anti-CD8 (PE) antibodies. As
shown in Figure 3.7, both CD8+ and CD4+ T cell subsets expressed TCR53mc.
Expression of TCR53mc by CD4+ T cells was seen on approximately two fold more
cells (40 %) than on CD8+ T cells (22 %).
Figure 3.7. TCR53mc expression on CD4+ and CD8
+ T cells after retroviral transduction of PBLs
with pMP71-TCR53mc.
PBLs of a healthy donor were transduced with TCR53mc (PBL-TCR53m) or not transduced (PBL-mock) and stained with anti-mTCR, anti-CD8 and anti-CD4 antibodies. Expression of TCR53mc gated on CD8
+ T cells is shown in the left plot and gated on CD4
+ T cells in the right plot. PBL-mock cells
were used as negative control for mTCR staining. Numbers are the percentage of mTCR+ cells of the
gated CD8+ or CD4
+ T cell population, respectively. % of max= % of maximal projection.
mTCR
Gated on CD8+ T cells Gated on CD4
+ T cells
PBL-mock
PBL-TCR53mc 22% 40%
% o
f m
ax
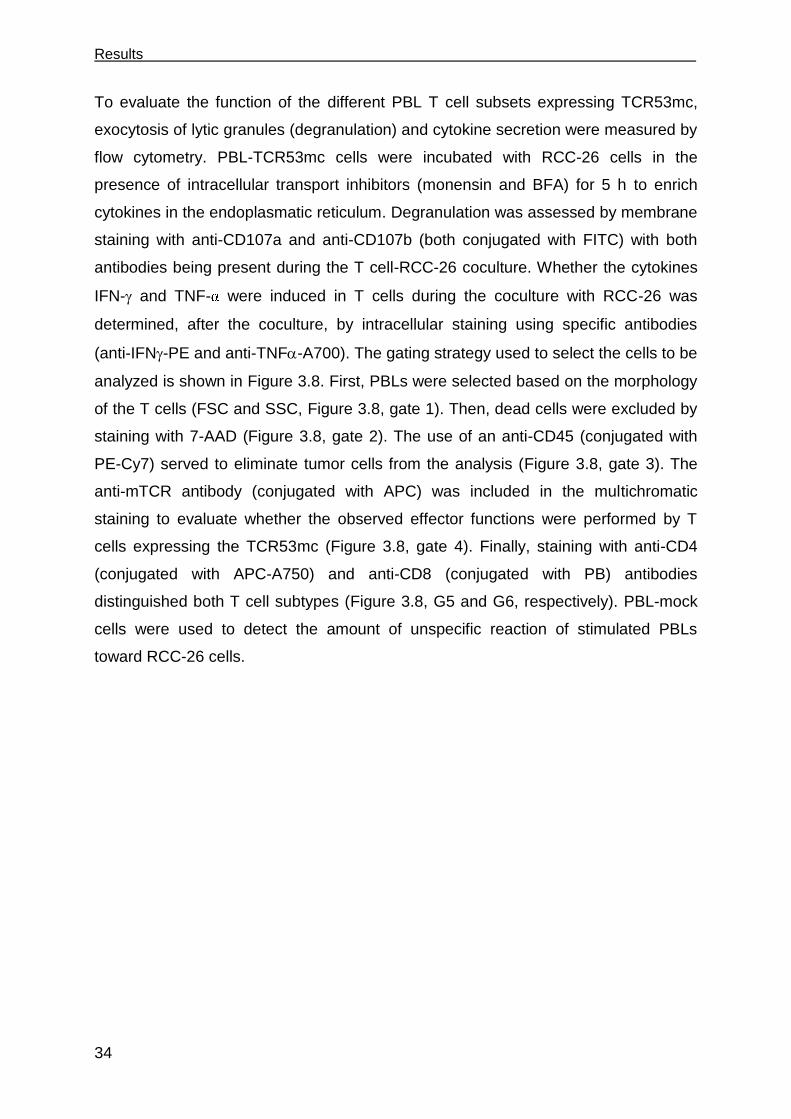
Results
34
To evaluate the function of the different PBL T cell subsets expressing TCR53mc,
exocytosis of lytic granules (degranulation) and cytokine secretion were measured by
flow cytometry. PBL-TCR53mc cells were incubated with RCC-26 cells in the
presence of intracellular transport inhibitors (monensin and BFA) for 5 h to enrich
cytokines in the endoplasmatic reticulum. Degranulation was assessed by membrane
staining with anti-CD107a and anti-CD107b (both conjugated with FITC) with both
antibodies being present during the T cell-RCC-26 coculture. Whether the cytokines
IFN- and TNF- were induced in T cells during the coculture with RCC-26 was
determined, after the coculture, by intracellular staining using specific antibodies
(anti-IFN-PE and anti-TNF-A700). The gating strategy used to select the cells to be
analyzed is shown in Figure 3.8. First, PBLs were selected based on the morphology
of the T cells (FSC and SSC, Figure 3.8, gate 1). Then, dead cells were excluded by
staining with 7-AAD (Figure 3.8, gate 2). The use of an anti-CD45 (conjugated with
PE-Cy7) served to eliminate tumor cells from the analysis (Figure 3.8, gate 3). The
anti-mTCR antibody (conjugated with APC) was included in the multichromatic
staining to evaluate whether the observed effector functions were performed by T
cells expressing the TCR53mc (Figure 3.8, gate 4). Finally, staining with anti-CD4
(conjugated with APC-A750) and anti-CD8 (conjugated with PB) antibodies
distinguished both T cell subtypes (Figure 3.8, G5 and G6, respectively). PBL-mock
cells were used to detect the amount of unspecific reaction of stimulated PBLs
toward RCC-26 cells.
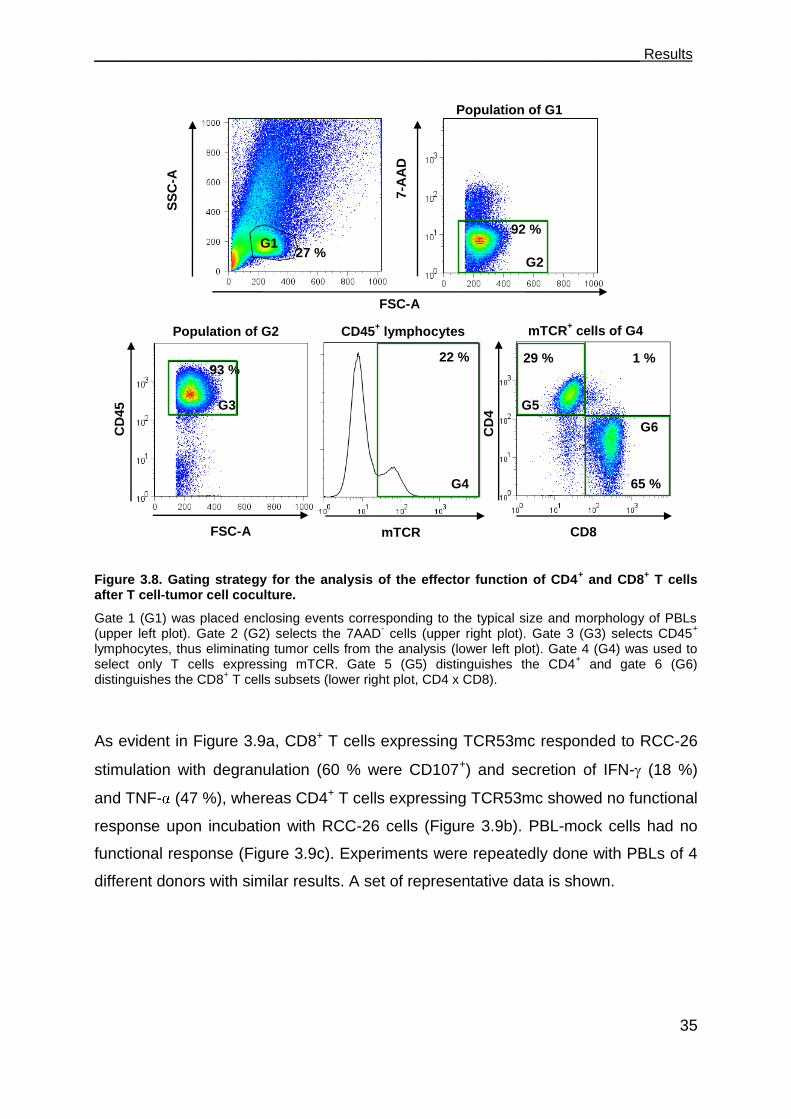
___________________________________________________________________ Results
35
Figure 3.8. Gating strategy for the analysis of the effector function of CD4+ and CD8
+ T cells
after T cell-tumor cell coculture.
Gate 1 (G1) was placed enclosing events corresponding to the typical size and morphology of PBLs (upper left plot). Gate 2 (G2) selects the 7AAD
- cells (upper right plot). Gate 3 (G3) selects CD45
+
lymphocytes, thus eliminating tumor cells from the analysis (lower left plot). Gate 4 (G4) was used to select only T cells expressing mTCR. Gate 5 (G5) distinguishes the CD4
+ and gate 6 (G6)
distinguishes the CD8+ T cells subsets (lower right plot, CD4 x CD8).
As evident in Figure 3.9a, CD8+ T cells expressing TCR53mc responded to RCC-26
stimulation with degranulation (60 % were CD107+) and secretion of IFN- (18 %)
and TNF- (47 %), whereas CD4+ T cells expressing TCR53mc showed no functional
response upon incubation with RCC-26 cells (Figure 3.9b). PBL-mock cells had no
functional response (Figure 3.9c). Experiments were repeatedly done with PBLs of 4
different donors with similar results. A set of representative data is shown.
27 %
93 %
92 %
29 % 1 %
65 %
SS
C-A
CD
45
7-A
AD
CD
4
FSC-A
FSC-A CD8 mTCR
G1
Population of G1
G2
G3
G4
G5
G6
Population of G2 CD45+ lymphocytes mTCR
+ cells of G4
22 %
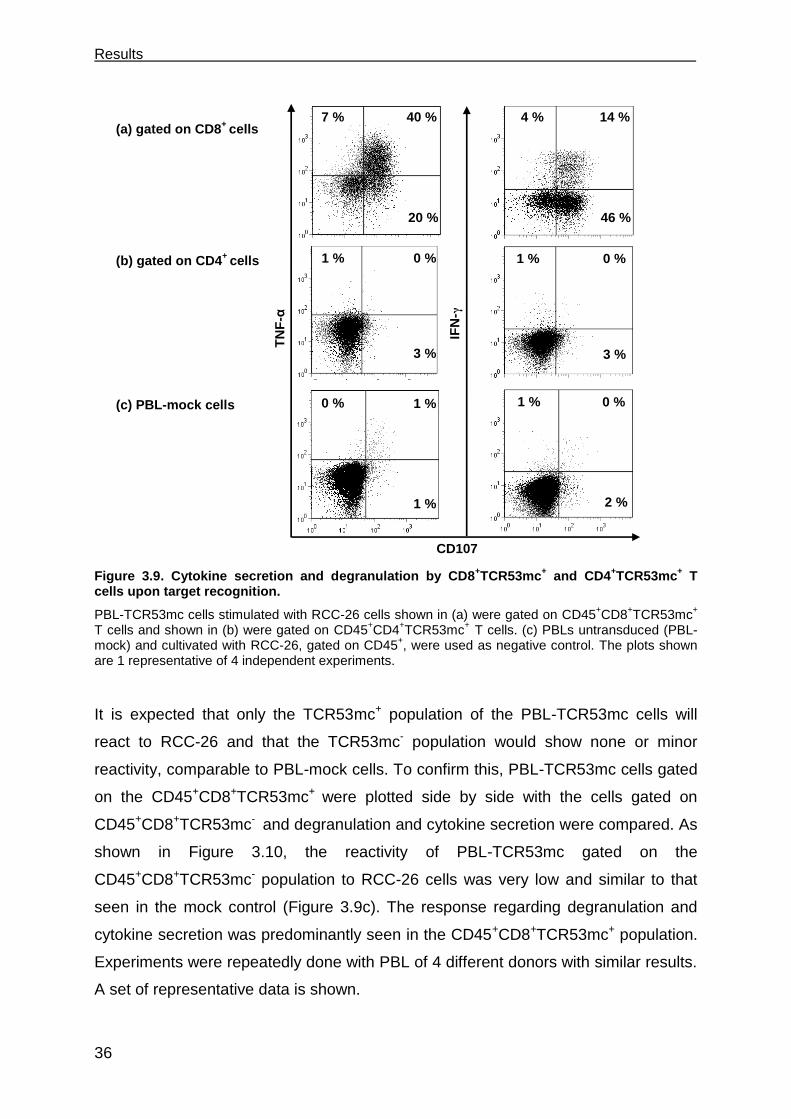
Results
36
Figure 3.9. Cytokine secretion and degranulation by CD8+TCR53mc
+ and CD4
+TCR53mc
+ T
cells upon target recognition.
PBL-TCR53mc cells stimulated with RCC-26 cells shown in (a) were gated on CD45+CD8
+TCR53mc
+ T cells and shown in (b) were gated on CD45
+CD4
+TCR53mc
+ T cells. (c) PBLs untransduced (PBL-mock) and cultivated with RCC-26, gated on CD45
+, were used as negative control. The plots shown
are 1 representative of 4 independent experiments.
It is expected that only the TCR53mc+ population of the PBL-TCR53mc cells will
react to RCC-26 and that the TCR53mc- population would show none or minor
reactivity, comparable to PBL-mock cells. To confirm this, PBL-TCR53mc cells gated
on the CD45+CD8+TCR53mc+ were plotted side by side with the cells gated on
CD45+CD8+TCR53mc- and degranulation and cytokine secretion were compared. As
shown in Figure 3.10, the reactivity of PBL-TCR53mc gated on the
CD45+CD8+TCR53mc- population to RCC-26 cells was very low and similar to that
seen in the mock control (Figure 3.9c). The response regarding degranulation and
cytokine secretion was predominantly seen in the CD45+CD8+TCR53mc+ population.
Experiments were repeatedly done with PBL of 4 different donors with similar results.
A set of representative data is shown.
4 % 14 %
46 %
40 % 7 %
20 %
1 % 0 %
3 %
IFN
-γ
TN
F-α
1 % 0 %
1 %
CD107
(a) gated on CD8+
cells
1 % 0 %
3 %
0 % 1 %
2 %
(b) gated on CD4+
cells
(c) PBL-mock cells
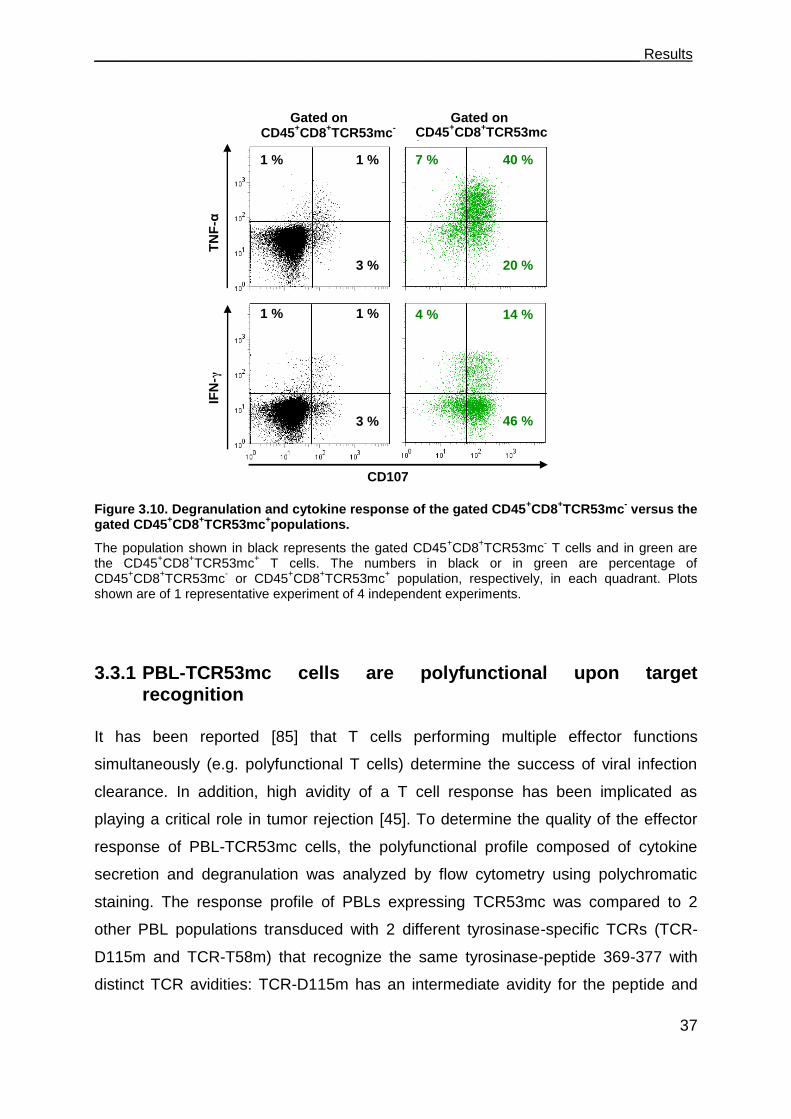
___________________________________________________________________ Results
37
Figure 3.10. Degranulation and cytokine response of the gated CD45+CD8
+TCR53mc
- versus the
gated CD45+CD8
+TCR53mc
+populations.
The population shown in black represents the gated CD45+CD8
+TCR53mc
- T cells and in green are
the CD45+CD8
+TCR53mc
+ T cells. The numbers in black or in green are percentage of
CD45+CD8
+TCR53mc
- or CD45
+CD8
+TCR53mc
+ population, respectively, in each quadrant. Plots
shown are of 1 representative experiment of 4 independent experiments.
3.3.1 PBL-TCR53mc cells are polyfunctional upon target recognition
It has been reported [85] that T cells performing multiple effector functions
simultaneously (e.g. polyfunctional T cells) determine the success of viral infection
clearance. In addition, high avidity of a T cell response has been implicated as
playing a critical role in tumor rejection [45]. To determine the quality of the effector
response of PBL-TCR53mc cells, the polyfunctional profile composed of cytokine
secretion and degranulation was analyzed by flow cytometry using polychromatic
staining. The response profile of PBLs expressing TCR53mc was compared to 2
other PBL populations transduced with 2 different tyrosinase-specific TCRs (TCR-
D115m and TCR-T58m) that recognize the same tyrosinase-peptide 369-377 with
distinct TCR avidities: TCR-D115m has an intermediate avidity for the peptide and
2
4 40 % 7 %
20 %
CD107
IFN
-γ
TN
F-α
1 % 1 %
3 %
14 % 4 %
46 %
1 % 1 %
3 %
CD45+CD8
+TCR53mc
- CD45
+CD8
+TCR53mc
+
Gated on Gated on
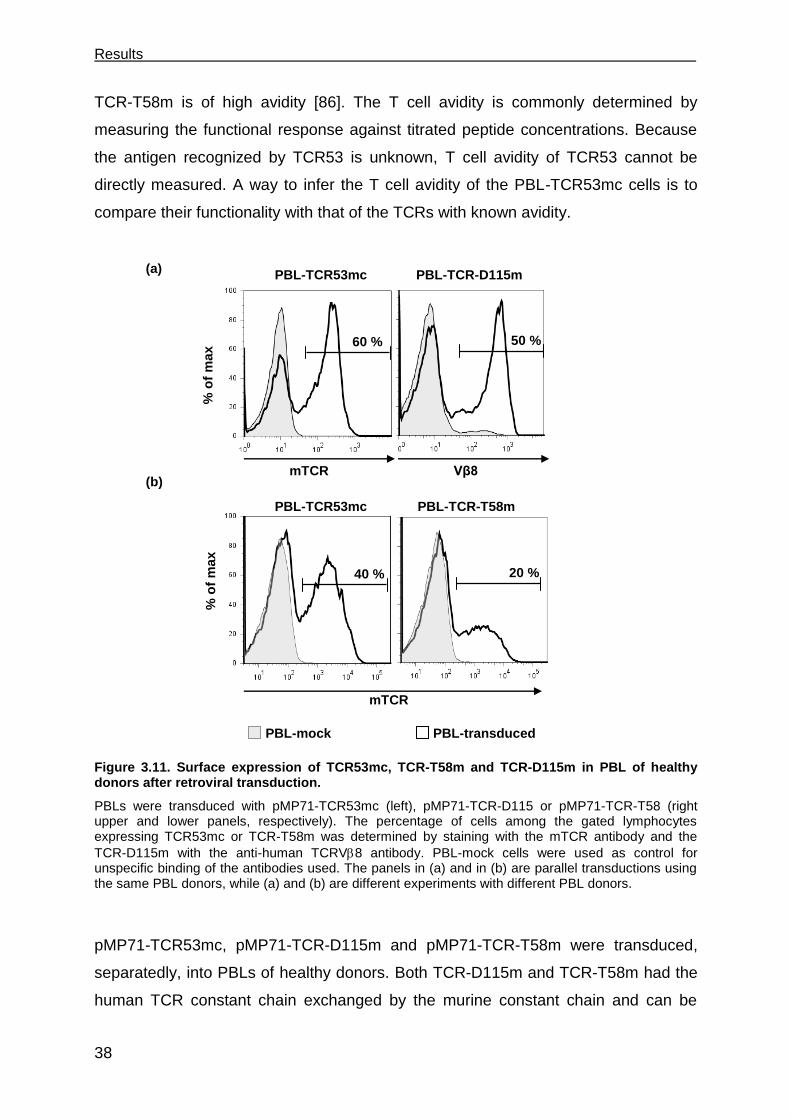
Results
38
TCR-T58m is of high avidity [86]. The T cell avidity is commonly determined by
measuring the functional response against titrated peptide concentrations. Because
the antigen recognized by TCR53 is unknown, T cell avidity of TCR53 cannot be
directly measured. A way to infer the T cell avidity of the PBL-TCR53mc cells is to
compare their functionality with that of the TCRs with known avidity.
Figure 3.11. Surface expression of TCR53mc, TCR-T58m and TCR-D115m in PBL of healthy donors after retroviral transduction.
PBLs were transduced with pMP71-TCR53mc (left), pMP71-TCR-D115 or pMP71-TCR-T58 (right upper and lower panels, respectively). The percentage of cells among the gated lymphocytes expressing TCR53mc or TCR-T58m was determined by staining with the mTCR antibody and the
TCR-D115m with the anti-human TCRV8 antibody. PBL-mock cells were used as control for unspecific binding of the antibodies used. The panels in (a) and in (b) are parallel transductions using the same PBL donors, while (a) and (b) are different experiments with different PBL donors.
pMP71-TCR53mc, pMP71-TCR-D115m and pMP71-TCR-T58m were transduced,
separatedly, into PBLs of healthy donors. Both TCR-D115m and TCR-T58m had the
human TCR constant chain exchanged by the murine constant chain and can be
50 % 60 %
PBL-TCR-D115m PBL-TCR53mc
% o
f m
ax
20 % 40 %
mTCR
PBL-TCR-T58m PBL-TCR53mc
PBL-mock PBL-transduced
% o
f m
ax
(a)
(b) mTCR Vβ8

___________________________________________________________________ Results
39
detected by the anti-mTCR antibody. TCR53mc and TCR-D115m were transduced in
parallel into PBLs from the same donor and a PBL-mock was used as control for both
of them. Retroviral transduction yielded 60 % TCR53mc+ T cells (detected with an
anti-mTCR) and 50 % of TCR-D115+ T cells (detected with the specific anti-V8)
(Figure 3.11a). In a different experiment, TCR53mc and TCR-T58m were transduced
in parallel into PBL derived from the same donor (who was different from the
previous transduction shown in Figure 3.11a) with a PBL-mock being used as control
for both of them. The percentage of TCR53mc+ T cells was 40 % and of TCR-T58+ T
cells was 20 % (Figure 3.11b).
To determine the functional response profile, each PBL population expressing the
recombinant TCR was cocultured with target cells, RCC-26 cells for PBL-TCR53mc
cells or Mel-93.04A12 cells for both PBL-TCR-D115 and PBL-TCR-T58 cells, for 5 h
in the presence of anti-CD107a+b antibodies (FITC) and BFA and monensin. After
the coculture, cells were subjected to polychromatic staining as follows: CD45-
AmCyan, mTCR-PE, CD8-PB, IFN--PE-Cy7, TNF--A700 and IL-2-APC. Anti-
mTCR was included to allow gating on the T cell population expressing TCR53mc,
TCR-D115m or TCR-T58m. The specific gating strategy focusing on the T cell
population expressing the mTCR (and setting this to 100 %) allowed to compare the
functional profile of the different transduced PBL populations even though the
percentages of CD8+ T cells with transgenic TCR expression was not the same (see
Figure 3.11). Compared in 3.12a is the functional response of PBL-TCR53mc and
the PBL-TCR-D115m cells. In 3.12b is the comparison between PBL-TCR53mc and
PBL-TCR-T58m cells, representing another experiment. Stimulation with RCC-26
cells (for PBL-TCR53mc cells) or Mel-93.04A12 cells (for PBL-TCR-D115m and PBL-
TCR-T58m cells) caused CD8+ T cells to degranulate and secrete cytokines.
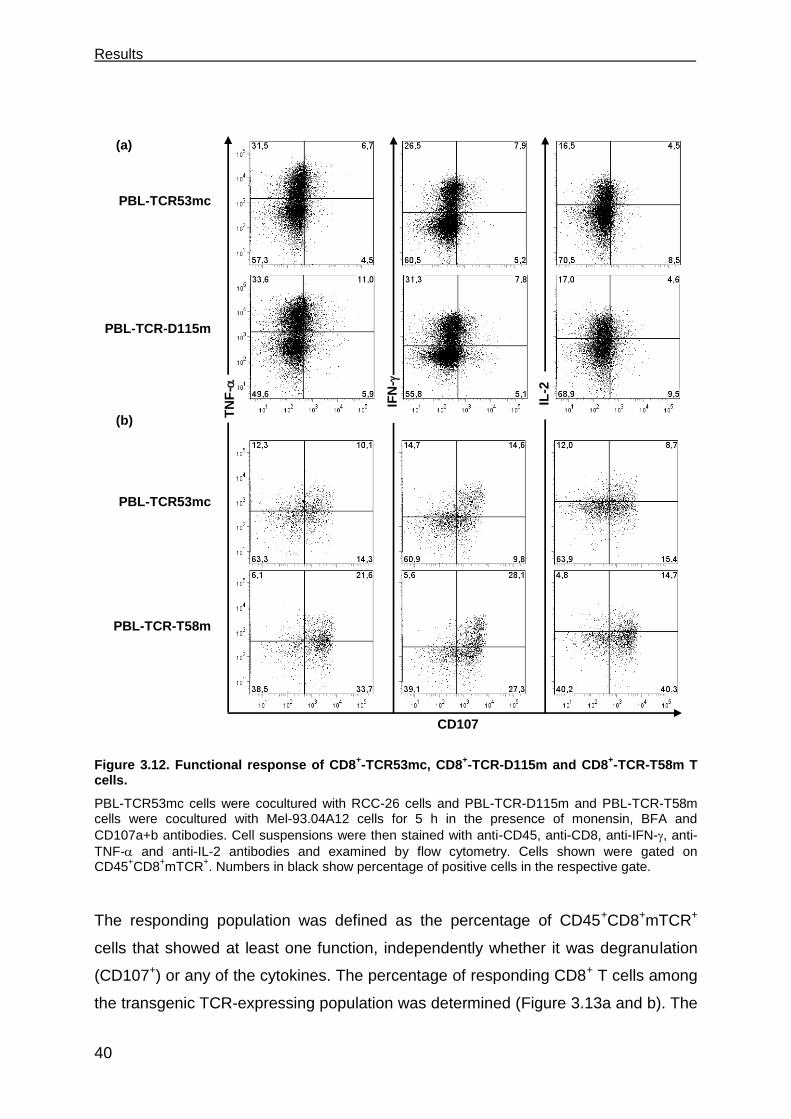
Results
40
Figure 3.12. Functional response of CD8+-TCR53mc, CD8
+-TCR-D115m and CD8
+-TCR-T58m T
cells.
PBL-TCR53mc cells were cocultured with RCC-26 cells and PBL-TCR-D115m and PBL-TCR-T58m cells were cocultured with Mel-93.04A12 cells for 5 h in the presence of monensin, BFA and
CD107a+b antibodies. Cell suspensions were then stained with anti-CD45, anti-CD8, anti-IFN-, anti-
TNF- and anti-IL-2 antibodies and examined by flow cytometry. Cells shown were gated on CD45
+CD8
+mTCR
+. Numbers in black show percentage of positive cells in the respective gate.
The responding population was defined as the percentage of CD45+CD8+mTCR+
cells that showed at least one function, independently whether it was degranulation
(CD107+) or any of the cytokines. The percentage of responding CD8+ T cells among
the transgenic TCR-expressing population was determined (Figure 3.13a and b). The
CD107
IFN
-
TN
F-
IL-2
PBL-TCR53mc
PBL-TCR-D115m
PBL-TCR-T58m
PBL-TCR53mc
(a)
(b)
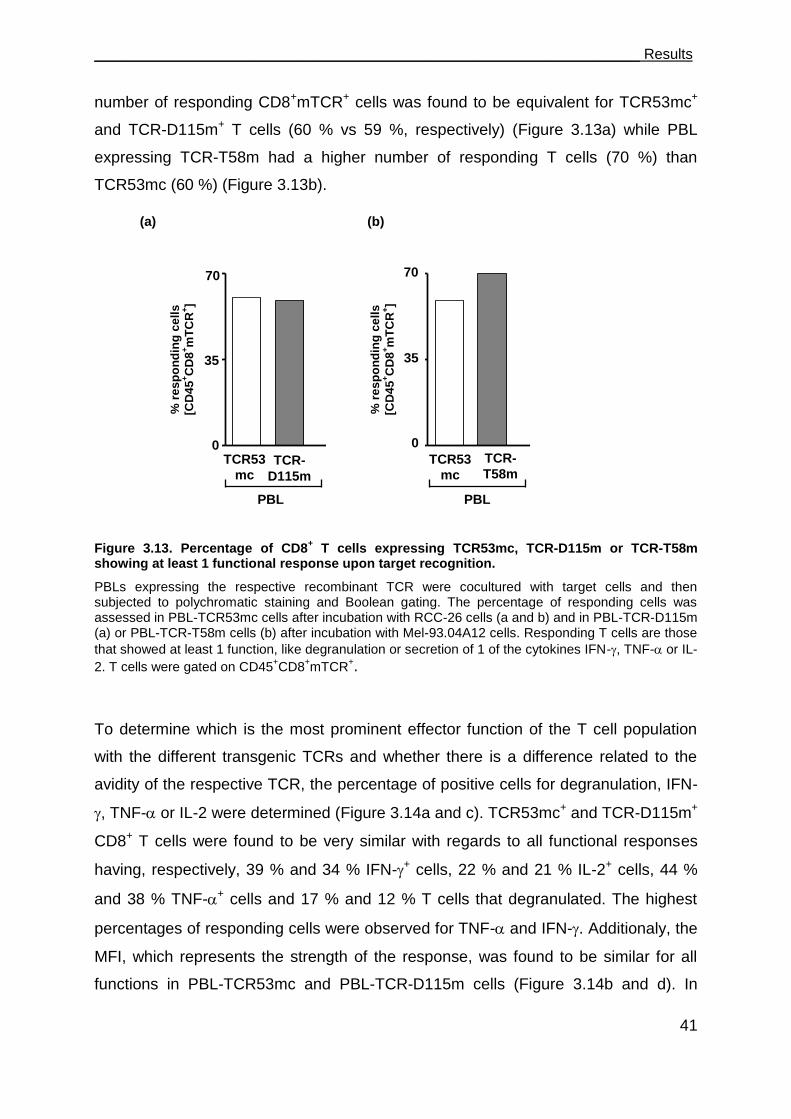
___________________________________________________________________ Results
41
number of responding CD8+mTCR+ cells was found to be equivalent for TCR53mc+
and TCR-D115m+ T cells (60 % vs 59 %, respectively) (Figure 3.13a) while PBL
expressing TCR-T58m had a higher number of responding T cells (70 %) than
TCR53mc (60 %) (Figure 3.13b).
Figure 3.13. Percentage of CD8+ T cells expressing TCR53mc, TCR-D115m or TCR-T58m
showing at least 1 functional response upon target recognition.
PBLs expressing the respective recombinant TCR were cocultured with target cells and then subjected to polychromatic staining and Boolean gating. The percentage of responding cells was assessed in PBL-TCR53mc cells after incubation with RCC-26 cells (a and b) and in PBL-TCR-D115m (a) or PBL-TCR-T58m cells (b) after incubation with Mel-93.04A12 cells. Responding T cells are those
that showed at least 1 function, like degranulation or secretion of 1 of the cytokines IFN-, TNF- or IL-
2. T cells were gated on CD45+CD8
+mTCR
+.
To determine which is the most prominent effector function of the T cell population
with the different transgenic TCRs and whether there is a difference related to the
avidity of the respective TCR, the percentage of positive cells for degranulation, IFN-
, TNF- or IL-2 were determined (Figure 3.14a and c). TCR53mc+ and TCR-D115m+
CD8+ T cells were found to be very similar with regards to all functional responses
having, respectively, 39 % and 34 % IFN-+ cells, 22 % and 21 % IL-2+ cells, 44 %
and 38 % TNF-+ cells and 17 % and 12 % T cells that degranulated. The highest
percentages of responding cells were observed for TNF- and IFN-. Additionaly, the
MFI, which represents the strength of the response, was found to be similar for all
functions in PBL-TCR53mc and PBL-TCR-D115m cells (Figure 3.14b and d). In
70
35
0 0
35
70PBL-TCR53
PBL-TCR-D115
TCR53
mc TCR-
D115m
70
35
0 0
35
70PBL-TCR53
PBL-TCR-T58
TCR-
T58m
(a) (b)
PBL PBL
% r
es
po
nd
ing
ce
lls
[CD
45
+C
D8
+m
TC
R+]
% r
es
po
nd
ing
ce
lls
[CD
45
+C
D8
+m
TC
R+]
TCR53
mc

Results
42
contrast, the response of PBL-TCR53mc and PBL-TCR-T58m cells differed in the
percentage of CD107+ T cells as well as in the strength of degranulation per cell (MFI
of CD107), both of which were significantly higher in TCR-T58m+ compared to
TCR53mc+ T cells (p=0.009 and p=0.03 respectively) (Figure 3.14c and d). The
secretion of cytokines was similar between TCR-T58m- and TCR53mc-expressing
PBLs. The experiments evaluating the comparison of PBL-TCR53mc and PBL-TCR-
T58m were done twice. Shown is the mean of two experiments.
Figure 3.14. IFN-, IL-2, TNF or CD107 positive cells among the gated CD45+CD8
+mTCR
+ T
cells in PBL-TCR53mc, PBL-D115m and PBL-T58m cells after coculture with targets.
Cytokine production or degranulation upon recognition of RCC-26 cells (PBL-TCR53mc cells) or Mel-93.04A12 cells (PBL-TCR-D115m and PBL-TCR-T58m cells). The percentage of positive cells for IFN-
, IL-2, TNF or CD107 within the gated CD45+CD8
+mTCR
+ PBL-TCR53mc and PBL-D115m cells (a)
or PBL-TCR53mc and PBL-T58m cells (c) assessed by flow cytometry. (b and d) The MFI of each cytokine or CD107 of the gated CD45
+CD8
+mTCR
+ populations was likewise assessed. The statistical
analysis to evaluate significant differences between TCR53mc and TCR-T58m was the unpaired Student T test (p values are shown in case of significance).
IFNy
IL2
TNFa
CD10
7
0
20
40
60PBL-TCR53
PBL-TCR-T58
% o
f to
tal C
D8
+T
CR
+
60
40
0
20
% +
cells
[C
D8
+m
TC
R+]
IFNy
IL2
TNFa
CD10
7
0
3000
6000PBL-TCR-D115
% o
f to
tal C
D8+
TC
R+
IFNy
IL2
TNFa
CD10
7
0
20
40
60PBL-TCR53
PBL-TCR-T58
% o
f to
tal C
D8+
TC
R+
PBL-TCR53mc
PBL-TCR-D115m
60
0
30
IFN- IL-2 TNF- CD107
MF
I [C
D8
+m
TC
R+]
(a) (b)
20
40
60
0
IFN- TNF- CD107 IL-2
(c) (d)
PBL-TCR53mc
0
500
1000
1500
2000
2500PBL-TCR53
PBL-TCR-T58
MF
I o
f C
D8+
TC
R+
PBL-TCR-T58m
0
1250
2500PBL-TCR53
PBL-TCR-T58
MF
I o
f C
D8+
TC
R+
25
12.5
0
[x102]
[x102]
IFN- TNF- CD107 IL-2
IFN- IL-2 TNF- CD107
% +
cell
s [
CD
45
+C
D8
+m
TC
R+]
MF
I [C
D45
+C
D8
+m
TC
R+]
**
p=0.03
*
p=0.009
IFNy
IL2
TNFa
CD10
7
0
20
40
60PBL-TCR53
PBL-TCR-T58
% o
f to
tal C
D8+
TC
R+
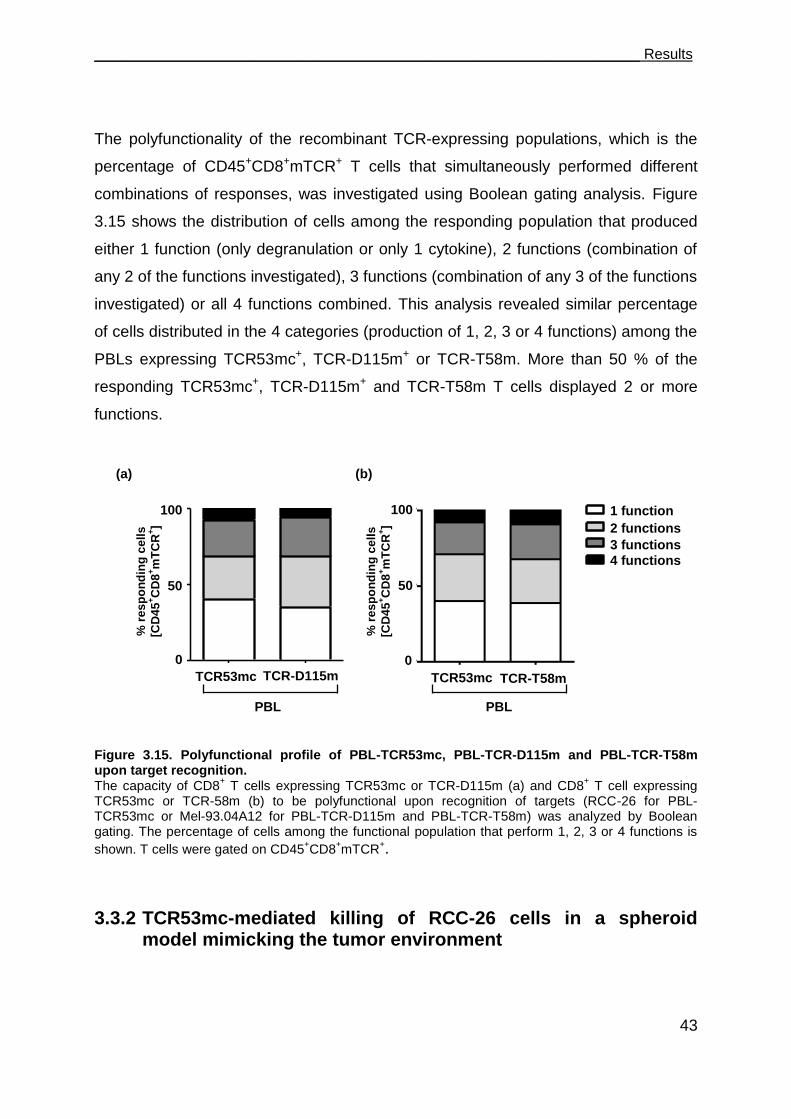
___________________________________________________________________ Results
43
The polyfunctionality of the recombinant TCR-expressing populations, which is the
percentage of CD45+CD8+mTCR+ T cells that simultaneously performed different
combinations of responses, was investigated using Boolean gating analysis. Figure
3.15 shows the distribution of cells among the responding population that produced
either 1 function (only degranulation or only 1 cytokine), 2 functions (combination of
any 2 of the functions investigated), 3 functions (combination of any 3 of the functions
investigated) or all 4 functions combined. This analysis revealed similar percentage
of cells distributed in the 4 categories (production of 1, 2, 3 or 4 functions) among the
PBLs expressing TCR53mc+, TCR-D115m+ or TCR-T58m. More than 50 % of the
responding TCR53mc+, TCR-D115m+ and TCR-T58m T cells displayed 2 or more
functions.
Figure 3.15. Polyfunctional profile of PBL-TCR53mc, PBL-TCR-D115m and PBL-TCR-T58m upon target recognition. The capacity of CD8
+ T cells expressing TCR53mc or TCR-D115m (a) and CD8
+ T cell expressing
TCR53mc or TCR-58m (b) to be polyfunctional upon recognition of targets (RCC-26 for PBL-TCR53mc or Mel-93.04A12 for PBL-TCR-D115m and PBL-TCR-T58m) was analyzed by Boolean gating. The percentage of cells among the functional population that perform 1, 2, 3 or 4 functions is
shown. T cells were gated on CD45+CD8
+mTCR
+.
3.3.2 TCR53mc-mediated killing of RCC-26 cells in a spheroid model mimicking the tumor environment
(a)
TCR53mc TCR-D115m TCR53 D1150
50
1001 function
3 functions
4 functions
2 functions
% o
f re
sp
on
din
g
100
50
0
1 function
2 functions
3 functions
4 functions
TCR53 D1150
50
1001 function
3 functions
4 functions
2 functions
% o
f re
sp
on
din
g
TCR-T58m TCR53mc
1 function
2 functions
3 functions
4 functions
100
50
0
(b)
PBL PBL
% r
es
po
nd
ing
ce
lls
[CD
45
+C
D8
+m
TC
R+]
% r
es
po
nd
ing
ce
lls
[CD
45
+C
D8
+m
TC
R+]
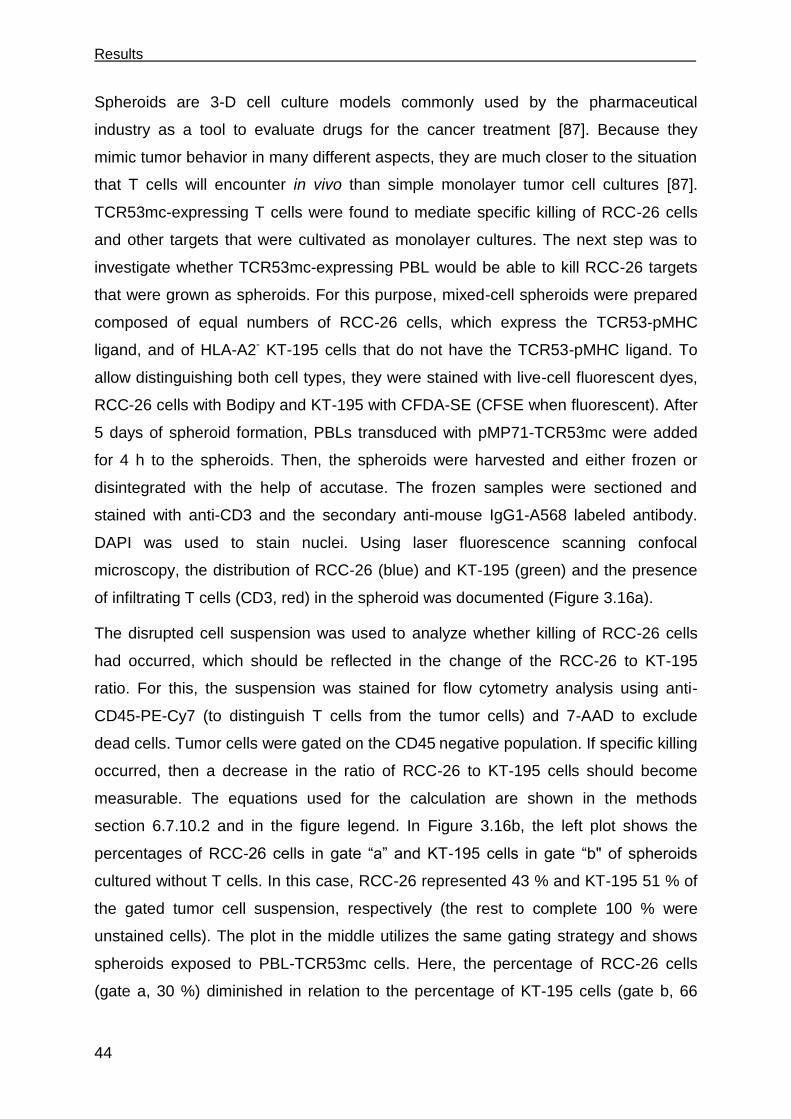
Results
44
Spheroids are 3-D cell culture models commonly used by the pharmaceutical
industry as a tool to evaluate drugs for the cancer treatment [87]. Because they
mimic tumor behavior in many different aspects, they are much closer to the situation
that T cells will encounter in vivo than simple monolayer tumor cell cultures [87].
TCR53mc-expressing T cells were found to mediate specific killing of RCC-26 cells
and other targets that were cultivated as monolayer cultures. The next step was to
investigate whether TCR53mc-expressing PBL would be able to kill RCC-26 targets
that were grown as spheroids. For this purpose, mixed-cell spheroids were prepared
composed of equal numbers of RCC-26 cells, which express the TCR53-pMHC
ligand, and of HLA-A2- KT-195 cells that do not have the TCR53-pMHC ligand. To
allow distinguishing both cell types, they were stained with live-cell fluorescent dyes,
RCC-26 cells with Bodipy and KT-195 with CFDA-SE (CFSE when fluorescent). After
5 days of spheroid formation, PBLs transduced with pMP71-TCR53mc were added
for 4 h to the spheroids. Then, the spheroids were harvested and either frozen or
disintegrated with the help of accutase. The frozen samples were sectioned and
stained with anti-CD3 and the secondary anti-mouse IgG1-A568 labeled antibody.
DAPI was used to stain nuclei. Using laser fluorescence scanning confocal
microscopy, the distribution of RCC-26 (blue) and KT-195 (green) and the presence
of infiltrating T cells (CD3, red) in the spheroid was documented (Figure 3.16a).
The disrupted cell suspension was used to analyze whether killing of RCC-26 cells
had occurred, which should be reflected in the change of the RCC-26 to KT-195
ratio. For this, the suspension was stained for flow cytometry analysis using anti-
CD45-PE-Cy7 (to distinguish T cells from the tumor cells) and 7-AAD to exclude
dead cells. Tumor cells were gated on the CD45 negative population. If specific killing
occurred, then a decrease in the ratio of RCC-26 to KT-195 cells should become
measurable. The equations used for the calculation are shown in the methods
section 6.7.10.2 and in the figure legend. In Figure 3.16b, the left plot shows the
percentages of RCC-26 cells in gate “a” and KT-195 cells in gate “b" of spheroids
cultured without T cells. In this case, RCC-26 represented 43 % and KT-195 51 % of
the gated tumor cell suspension, respectively (the rest to complete 100 % were
unstained cells). The plot in the middle utilizes the same gating strategy and shows
spheroids exposed to PBL-TCR53mc cells. Here, the percentage of RCC-26 cells
(gate a, 30 %) diminished in relation to the percentage of KT-195 cells (gate b, 66
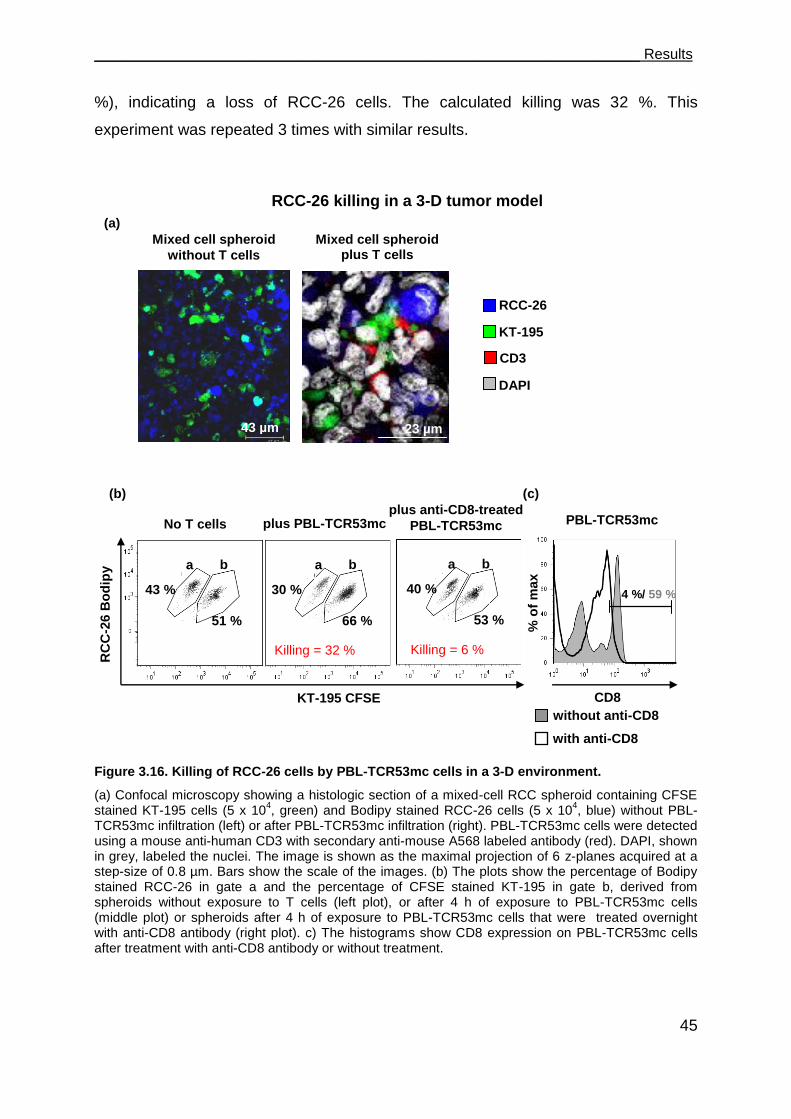
___________________________________________________________________ Results
45
%), indicating a loss of RCC-26 cells. The calculated killing was 32 %. This
experiment was repeated 3 times with similar results.
Figure 3.16. Killing of RCC-26 cells by PBL-TCR53mc cells in a 3-D environment.
(a) Confocal microscopy showing a histologic section of a mixed-cell RCC spheroid containing CFSE stained KT-195 cells (5 x 10
4, green) and Bodipy stained RCC-26 cells (5 x 10
4, blue) without PBL-
TCR53mc infiltration (left) or after PBL-TCR53mc infiltration (right). PBL-TCR53mc cells were detected using a mouse anti-human CD3 with secondary anti-mouse A568 labeled antibody (red). DAPI, shown in grey, labeled the nuclei. The image is shown as the maximal projection of 6 z-planes acquired at a step-size of 0.8 µm. Bars show the scale of the images. (b) The plots show the percentage of Bodipy stained RCC-26 in gate a and the percentage of CFSE stained KT-195 in gate b, derived from spheroids without exposure to T cells (left plot), or after 4 h of exposure to PBL-TCR53mc cells (middle plot) or spheroids after 4 h of exposure to PBL-TCR53mc cells that were treated overnight with anti-CD8 antibody (right plot). c) The histograms show CD8 expression on PBL-TCR53mc cells after treatment with anti-CD8 antibody or without treatment.
23 µm
43 µm
CD8
Mixed cell spheroid
without T cells
Mixed cell spheroid plus T cells
RCC-26
KT-195
CD3
KT-195 CFSE
No T cells plus PBL-TCR53mc plus anti-CD8-treated
PBL-TCR53mc
a b
Killing = 32 %
RC
C-2
6 B
od
ipy
Killing = 6 %
(a)
(b) (c)
PBL-TCR53mc %
of
max
DAPI
without anti-CD8
with anti-CD8
a b a b
43 %
51 %
30 %
66 %
40 %
53 %
RCC-26 killing in a 3-D tumor model
4 %/ 59 %
Results
46
100cells T without spheroidsin cells target %
cells T with spheroidsin cells target %-1killing %
Whereby the % of target cells (RCC-26) in the spheroid is derived from the formula:
SE -CFDA with stained cells % Bodipy with stained cells %
Bodipy with stained cells %spheroidin cells target %
To evaluate whether the loss of RCC-26 cells was mediated by the T cells
expressing TCR53mc, the property of TCR53mc to be dependent on the CD8
molecule for function was used. PBL-TCR53mc cells were incubated overnight with
an anti-human CD8 antibody resulting in the disruption of the CD8 surface
expression (Figure 3.16c, histogram). The PBL-TCR53mc cells treated with an anti-
CD8 antibody were incubated with the mixed-cell spheroids for 4 h. The ratio of RCC-
26 to KT-195 cells resembled that of spheroids that were not exposed to PBL-
TCR53mc cells, suggesting that the anti-CD8-treated PBL-TCR53mc cells no longer
performed cytotoxic activity against RCC-26 cells (Figure 3.16b, right plot). The
calculated killing was 6 %.
3.3.3 TCR53mc expression and functional performance after retroviral transduction of PBLs of RCC patients
PBMCs of sarcoma patients show deviations in the composition of T cell subsets
when compared to PBMCs of healthy donors [88]. In addition, the proliferation of
PBLs of head and neck carcinoma patients was shown to be deficient [89]. Because
systemic immune impairments are seen in PBMCs of cancer patients, it was not
certain that PBLs of RCC patients would be as successfully transduced with pMP71-
TCR53mc as the PBLs of healthy donors. An additional concern is that the pMP71-
TCR53mc-transduced PBLs of RCC patients would be functionally impaired. To test
whether PBLs of RCC patients can be used to generate large amounts of RCC-
specific T cells, PBL of 5 RCC patients were tested. All patients had progressive
metastatic disease and 2 of them had received several applications of IFN- and 5-
fluorouracil (5-FU) prior to blood donation (Table 5).
Table 5. Clinicopathologic status of the RCC patients and treatment condition.
RCC patient Treatment *TMN status/
RCC-histology IFN-/5-FU tumor grade
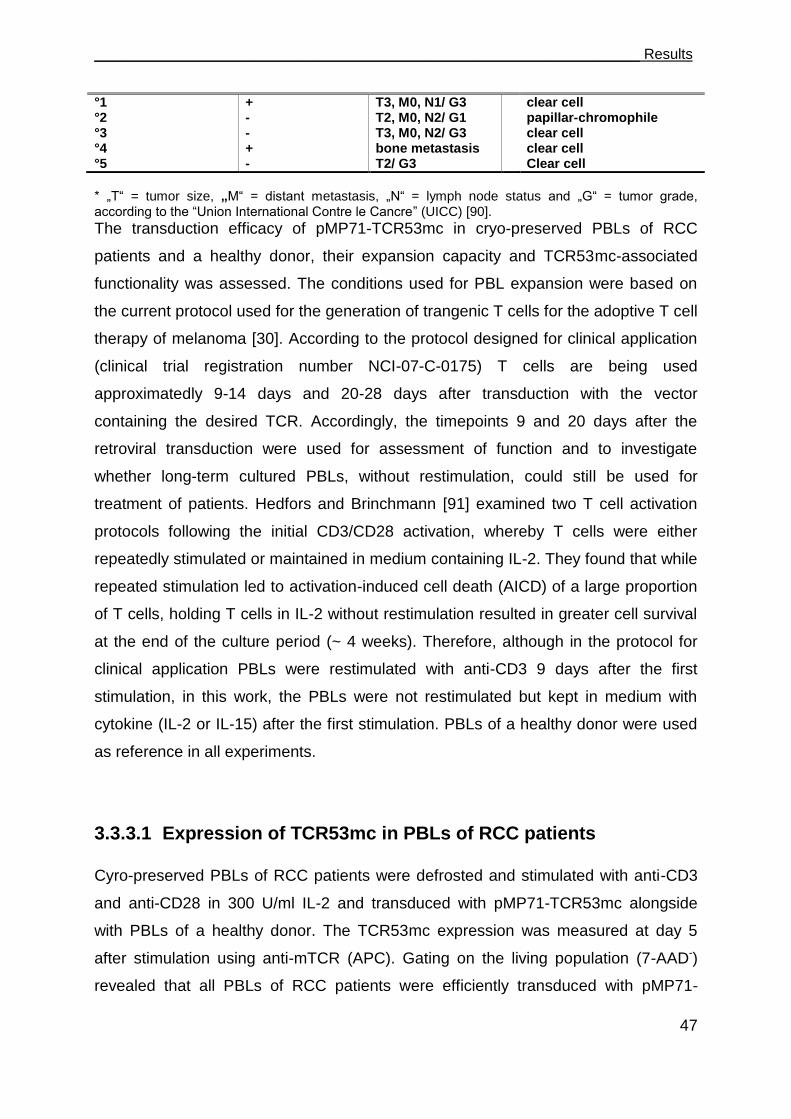
___________________________________________________________________ Results
47
°1 + T3, M0, N1/ G3 clear cell °2 - T2, M0, N2/ G1 papillar-chromophile °3 - T3, M0, N2/ G3 clear cell °4 + bone metastasis clear cell °5 - T2/ G3 Clear cell
* „T“ = tumor size, „M“ = distant metastasis, „N“ = lymph node status and „G“ = tumor grade, according to the “Union International Contre le Cancre” (UICC) [90].
The transduction efficacy of pMP71-TCR53mc in cryo-preserved PBLs of RCC
patients and a healthy donor, their expansion capacity and TCR53mc-associated
functionality was assessed. The conditions used for PBL expansion were based on
the current protocol used for the generation of trangenic T cells for the adoptive T cell
therapy of melanoma [30]. According to the protocol designed for clinical application
(clinical trial registration number NCI-07-C-0175) T cells are being used
approximatedly 9-14 days and 20-28 days after transduction with the vector
containing the desired TCR. Accordingly, the timepoints 9 and 20 days after the
retroviral transduction were used for assessment of function and to investigate
whether long-term cultured PBLs, without restimulation, could still be used for
treatment of patients. Hedfors and Brinchmann [91] examined two T cell activation
protocols following the initial CD3/CD28 activation, whereby T cells were either
repeatedly stimulated or maintained in medium containing IL-2. They found that while
repeated stimulation led to activation-induced cell death (AICD) of a large proportion
of T cells, holding T cells in IL-2 without restimulation resulted in greater cell survival
at the end of the culture period (~ 4 weeks). Therefore, although in the protocol for
clinical application PBLs were restimulated with anti-CD3 9 days after the first
stimulation, in this work, the PBLs were not restimulated but kept in medium with
cytokine (IL-2 or IL-15) after the first stimulation. PBLs of a healthy donor were used
as reference in all experiments.
3.3.3.1 Expression of TCR53mc in PBLs of RCC patients
Cyro-preserved PBLs of RCC patients were defrosted and stimulated with anti-CD3
and anti-CD28 in 300 U/ml IL-2 and transduced with pMP71-TCR53mc alongside
with PBLs of a healthy donor. The TCR53mc expression was measured at day 5
after stimulation using anti-mTCR (APC). Gating on the living population (7-AAD-)
revealed that all PBLs of RCC patients were efficiently transduced with pMP71-
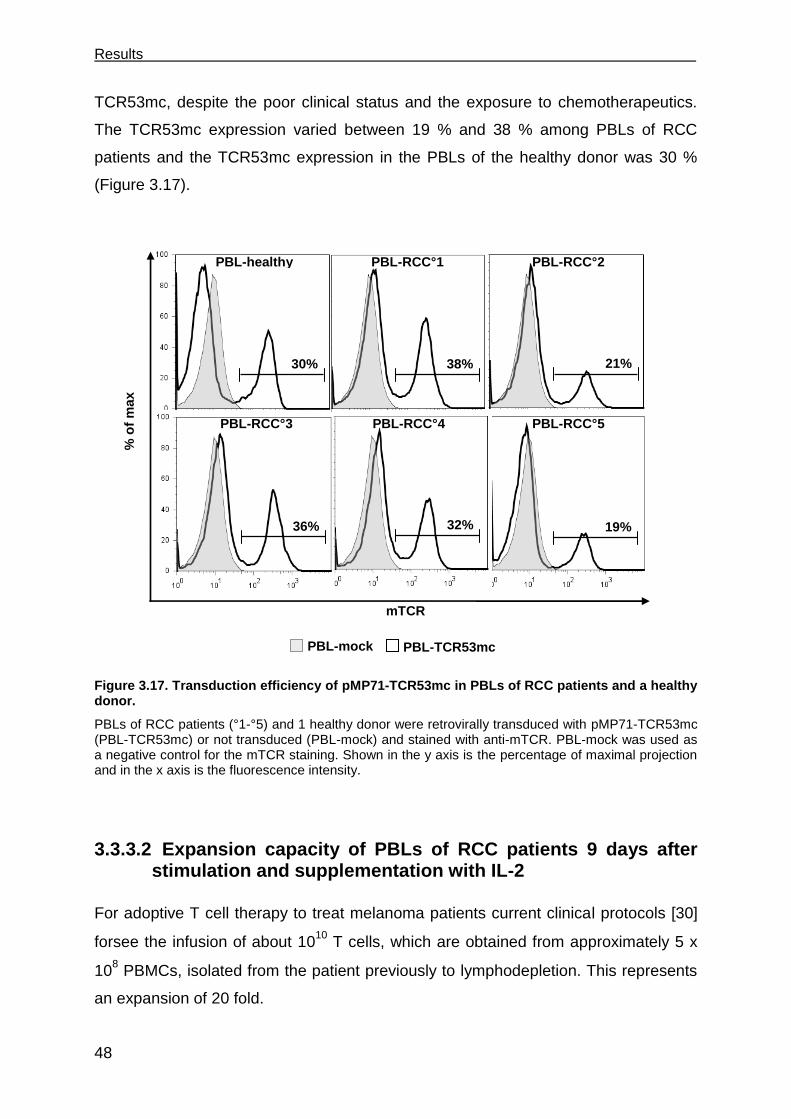
Results
48
TCR53mc, despite the poor clinical status and the exposure to chemotherapeutics.
The TCR53mc expression varied between 19 % and 38 % among PBLs of RCC
patients and the TCR53mc expression in the PBLs of the healthy donor was 30 %
(Figure 3.17).
Figure 3.17. Transduction efficiency of pMP71-TCR53mc in PBLs of RCC patients and a healthy donor.
PBLs of RCC patients (°1-°5) and 1 healthy donor were retrovirally transduced with pMP71-TCR53mc (PBL-TCR53mc) or not transduced (PBL-mock) and stained with anti-mTCR. PBL-mock was used as a negative control for the mTCR staining. Shown in the y axis is the percentage of maximal projection and in the x axis is the fluorescence intensity.
3.3.3.2 Expansion capacity of PBLs of RCC patients 9 days after stimulation and supplementation with IL-2
For adoptive T cell therapy to treat melanoma patients current clinical protocols [30]
forsee the infusion of about 1010 T cells, which are obtained from approximately 5 x
108 PBMCs, isolated from the patient previously to lymphodepletion. This represents
an expansion of 20 fold.
mTCR
30% 38% 21%
36% 19%
PBL-RCC°1 PBL-healthy
PBL-RCC°3
PBL-RCC°2
PBL-RCC°5
PBL-mock PBL-TCR53mc
% o
f m
ax
32%
PBL-RCC°4

___________________________________________________________________ Results
49
To determine the expansion capacity of PBL of RCC patients and 1 healthy donor,
PBMCs obtained from 5 RCC patients were stimulated with plate-coated anti-CD3
and anti-CD28 in T cell medium supplemented with IL-2. 9 days after stimulation the
cell expansion was evaluated. Cell counting of TCR-transduced PBLs was done
using a Neubauer chamber and trypan blue staining to distinguish dead cells. Both
PBLs of the healthy donor and the patients could be successfully expanded ex vivo
following the protocol utilized for clinical application (without restimulation), reaching
at least a 60 fold increase in cell number by day 9 after stimulation (Table 6).
Table 6. Expansion of pMP71-TCR53mc transduced PBLs of 5 RCC patients and of a healthy donor, 9 days after stimulation with anti-CD3 and anti-CD28.
Fold expansion at day 9 after initiation of culture PBL donors Expansion (x-fold*)
healthy 65 RCC°1 67 RCC°2 65 RCC°3 65 RCC°4 60 RCC°5 60
* The initial number of PBLs that were stimulated was 1 x 10
6
3.3.3.3 Expansion capacity of PBLs of RCC patients 20 days after stimulation in medium-containing IL-2 or IL-15
Although IL-2 is the main cytokine used for expansion and activation of tumor-
specific T cells [37], IL-2 possesses qualities that may preclude it from being the
optimal T cell growth-activation factor for the use in immunotherapy. IL-2 plays a
pivotal role in AICD of T cells [92] and inhibits memory CD8+ T cell proliferation and
survival [93]. IL-15 is a cytokine shown to overlap in function with IL-2, without having
the disadvantage of inducing early onset of apoptosis or impairing survival of CD8+
memory T cells. IL-15 was found to play an essential role in the development,
homeostasis, function, and survival of NK, NKT, and CD8+ T cells [94]. Thus, it was
of great interest to determine the responsiveness of CD8+ and CD4+ T cells over
long-term cultures to homeostatic cytokines like IL-15. To compare IL-2 and IL-15
regarding the expansion of PBLs of RCC patients and a healthy donor, these cells
were switched at day 9 after stimulation to medium containing IL-15 (10 ng/ml) or
kept in medium with 50 U/ml IL-2. The cell counts were determined on day 20 after
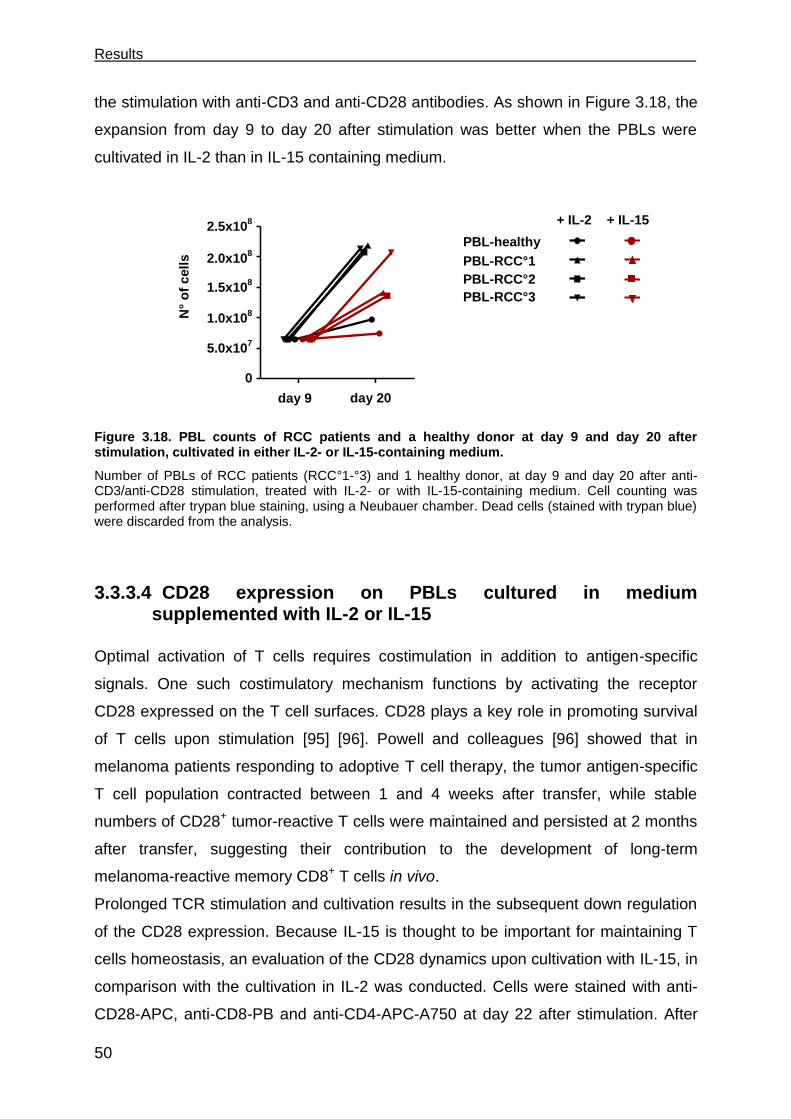
Results
50
the stimulation with anti-CD3 and anti-CD28 antibodies. As shown in Figure 3.18, the
expansion from day 9 to day 20 after stimulation was better when the PBLs were
cultivated in IL-2 than in IL-15 containing medium.
Figure 3.18. PBL counts of RCC patients and a healthy donor at day 9 and day 20 after stimulation, cultivated in either IL-2- or IL-15-containing medium.
Number of PBLs of RCC patients (RCC°1-°3) and 1 healthy donor, at day 9 and day 20 after anti-CD3/anti-CD28 stimulation, treated with IL-2- or with IL-15-containing medium. Cell counting was performed after trypan blue staining, using a Neubauer chamber. Dead cells (stained with trypan blue) were discarded from the analysis.
3.3.3.4 CD28 expression on PBLs cultured in medium supplemented with IL-2 or IL-15
Optimal activation of T cells requires costimulation in addition to antigen-specific
signals. One such costimulatory mechanism functions by activating the receptor
CD28 expressed on the T cell surfaces. CD28 plays a key role in promoting survival
of T cells upon stimulation [95] [96]. Powell and colleagues [96] showed that in
melanoma patients responding to adoptive T cell therapy, the tumor antigen-specific
T cell population contracted between 1 and 4 weeks after transfer, while stable
numbers of CD28+ tumor-reactive T cells were maintained and persisted at 2 months
after transfer, suggesting their contribution to the development of long-term
melanoma-reactive memory CD8+ T cells in vivo.
Prolonged TCR stimulation and cultivation results in the subsequent down regulation
of the CD28 expression. Because IL-15 is thought to be important for maintaining T
cells homeostasis, an evaluation of the CD28 dynamics upon cultivation with IL-15, in
comparison with the cultivation in IL-2 was conducted. Cells were stained with anti-
CD28-APC, anti-CD8-PB and anti-CD4-APC-A750 at day 22 after stimulation. After
Day 9 Day 200.0
5.01007
1.01008
1.51008
2.01008
2.51008
GS IL15
VO IL15
HO IL15
IG IL15
GS IL2
VO IL2
HO IL2
IG IL2
PBL-healthy
PBL-RCC°1
PBL-RCC°2
PBL-RCC°3
+ IL-2 + IL-15
Day 9 Day 200.0
5.01007
1.01008
1.51008
2.01008
2.51008
GS IL15
VO IL15
HO IL15
IG IL15
GS IL2
VO IL2
HO IL2
IG IL2
day 9 day 20
2.5x10⁸
2.0x10⁸
1.5x10⁸
1.0x10⁸
5.0x10⁷
0
N°
of
cell
s
Day 9 Day 200.0
5.01007
1.01008
1.51008
2.01008
2.51008
GS IL15
VO IL15
HO IL15
IG IL15
GS IL2
VO IL2
HO IL2
IG IL2

___________________________________________________________________ Results
51
gating on either CD4+ or CD8+ T cells, the CD28 expression was analyzed. As shown
in Figure 3.19, there was a tendency of lower percentages of CD28+CD8+ T cells
upon IL-15 cultivation when compared with IL-2 supplemented cultures. The CD28
expression on CD4+ T cells, on the other hand, either remained the same or even
more cells expressed upon IL-15 cultivation.
Figure 3.19. Percentage of CD28+ cells among CD8
+ and CD4
+ T cells of RCC patients and a
healthy donor cultivated in IL-2- or IL-15-containing medium.
Detection of CD28 by flow cytometry, on day 22 after stimulation, on PBL-TCR53mc of patients (RCC°1-°3) and 1 healthy donor. Shown is the percentage of CD28
+ gated on CD4
+ or CD8
+ T cells.
All PBLs were cultivated in IL-2 until day 9 after stimulation and then either kept in IL-2 or changed to IL-15 until day 20.
3.3.3.5 Cytotoxic capacity of PBLs of RCC patients transduced with pMP71-TCR53mc
Signaling defects in T cells were observed in PBLs of patients with cancer [89] [97].
Additionaly, the percentage of cells positive for the cytotoxic protein perforin was
found to be significantly lower in PBLs of sarcoma patients [88]. Thus, it was a
concern that PBLs of RCC patients would not be functional and therefore not suitable
for therapy. To investigate whether transduction of pMP71-TCR53mc into PBLs of
RCC patients confers TCR53mc associated specificity and functionality, PBL-
TCR53mc cells of RCC patients were analyzed for their cytotoxic capacity in a 4 h
chromium release assay. pMP71-TCR53mc-transduced or not transduced PBLs of
all donors were incubated with titrated amounts of chromium-labeled targets. All PBL-
TCR53mc of RCC patients and the healthy donor showed specific lytic activity
IL2
CD8
IL15
CD8
IL2
CD4
IL15
CD4
0
10
20
30
40
50PBL53 GS
PBL53 VO
PBL53 HO
PBL53 IG
IL-2 IL-15 IL-2 IL-15
CD8 CD4 0
20
40
60
80Healthy
IG
VO
HO
PBL-healthy
PBL-RCC°1
PBL-RCC°2
PBL-RCC°3
0
30
10
40
50
20
% o
f C
D2
8+
of
CD
8+ o
r C
D4
+
ga
ted
T c
ells

Results
52
against the of HLA-A2+ RCC-26 and CCA-17 cells, while the HLA-A2- KT-195 cell
line was not recognized (Figure 3.20), documenting the HLA-A2 restriction. Only
PBL-RCC°3 transduced with pMP71-TCR53mc showed overall less killing capacity
(30 % and 20 % killing of RCC-26 and CCA-17 cells at the E:T ratio 20:1,
respectively) than the PBL from the healthy donor. All PBL-mock cells showed only
marginal lytic activity against all cell lines.
Figure 3.20 Lytic capacity of pMP71-TCR53mc transduced PBLs of RCC patients and a healthy donor, assessed at day 9 after TCR stimulation.
Chromium release assay showing percentage of specific killing for PBL-RCC°1-°3 and 1 healthy donor, transduced with pMP71-TCR53mc (PBL-TCR53mc) or not (PBL-mock). The transduction efficiency was 38 % for PBL-RCC°1, 21 % for PBL-RCC°2, 36 % for PBL-RCC°3 and 30 % for PBL-healthy. PBLs were incubated with titrated numbers of chromium-labeled targets. Shown in the first row are PBLs incubated with RCC-26 cells, in the second row are PBLs incubated with CCA-17 cells and in the third row are PBLs incubated with the HLA-A2
- KT-195 cells, used as control for TCR53mc
unrelated killing. The percentage of specific lysis values are means of duplicates ± mean deviation. Shown in the x axis is the effector to target cell ratio.
20 10 5 2,50
20
40
60Healthy53
Mock healthy
20 10 5 2,50
20
40
60HO53
Mock HO
20 10 5 2,50
20
40
60VO53
Mock VO
20 10 5 2,5
0
20
40
60IG53
Mock IG
20 10 5 2,50
20
40
60Healthy53
Mock healthy
20 10 5 2,50
20
40
60IG53
Mock IG
20 10 5 2,50
20
40
60VO53
Mock VO
20 10 5 2,50
20
40
60IG53
Mock IG
20 10 5 2,50
20
40
60Healthy53
Mock healthy
20 10 5 2,50
20
40
60HO53
Mock HO
20 10 5 2,50
20
40
60VO53
Mock VO
20 10 5 2,50
20
40
60IG53
Mock IG
PBL-healthy PBL-RCC°2 PBL-RCC°1 PBL-RCC°3
RCC-26
CCA-17
KT-195
E:T ratio
% s
pecif
ic ly
sis
0
20
40
60
0
20
40
60
0
20
40
60
20 10 5 2.5 20 10 5 2.5 20 10 5 2.5 20 10 5 2.5
20 10 5 2,50
20
40
60IG53
Mock IG
PBL-TCR53mc
PBL-mock
___________________________________________________________________ Results
53
3.3.3.6 PBLs of RCC patients transduced with pMP71-TCR53mc are polyfunctional
To assess the polyfunctional response of PBLs of RCC patients transduced with
pMP71-TCR53mc, PBL-TCR53mc cells of the 5 RCC patient donors and of the
healthy donor were incubated with RCC-26 in the presence of the intracellular
transport inhibitors BFA and monensin and CD107a+b antibodies (FITC). After 5 h of
coculture, cytokine production and degranulation were analyzed by flow cytometry
using polychromatic staining. The staining panel was done as follows: CD45-
AmCyan, mTCR-PE, CD8-PB, IFN--PE-Cy7, TNF--A700 and IL-2-APC. For each
donor, PBL-mock cells were used as negative control. The gating strategy was as
follows: T cells were selected according to cell morphology, then CD45+ cells were
selected (excluding the tumor cells), then CD8+ and mTCR+ cells were selected.
The functional profile of PBL-TCR53mc cells of the different RCC donors was
compaired to that of PBL-TCR53mc cells of the healthy donor. Although there were
variations in the percentage of cells expressing TCR53mc among the samples
(Figure 3.17), these differences did not influence the analysis, as cells were gated on
mTCR positive cells.
Figure 3.21. TCR53mc-triggered response of T cells from RCC patients and a healthy donor.
Shown are responding T cells with at least 1 function, like secretion of 1 of the cytokines IFN-, TNF- and IL-2 or degranulation. The percentage of responding cells was assessed in PBL-TCR53mc gated
0
40
80healthy
VO
HO
IG
SC
LÜ
80
40
0 PBL
healthy
°1 °2 °3 °4 °5
% r
es
po
nd
ing
ce
lls
[CD
45
+C
D8
+m
TC
R+]
RCC PBL
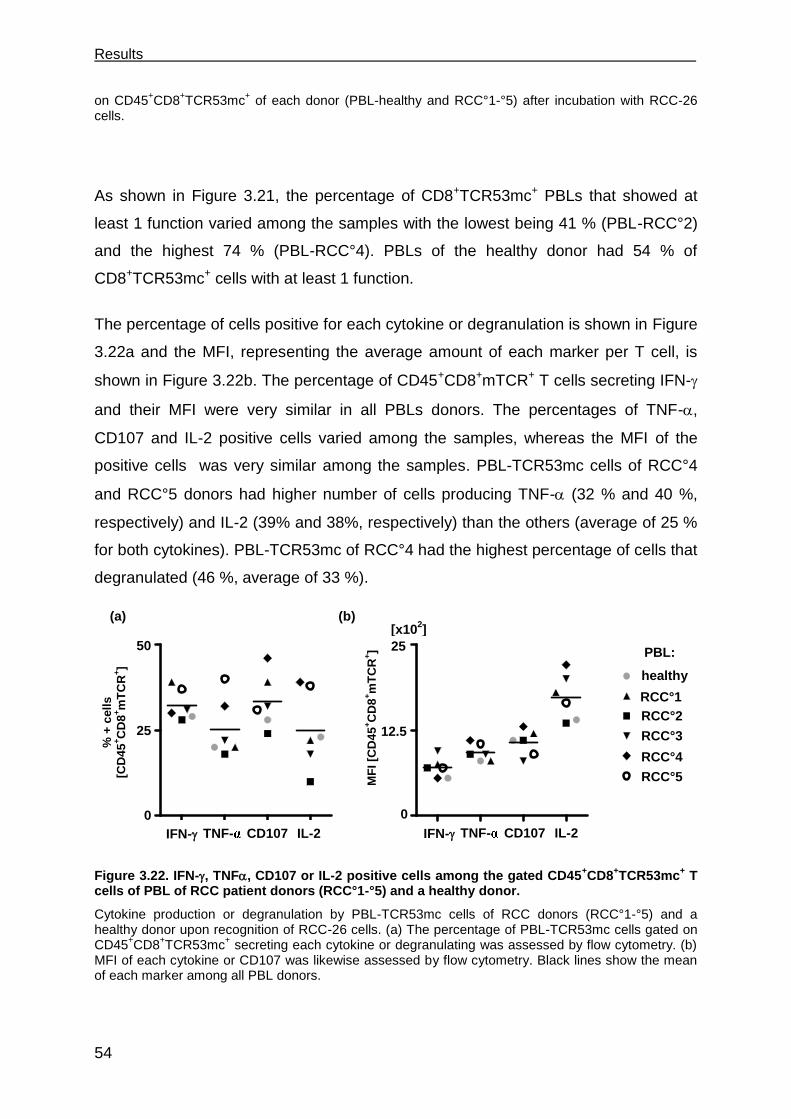
Results
54
on CD45+CD8
+TCR53mc
+ of each donor (PBL-healthy and RCC°1-°5) after incubation with RCC-26
cells.
As shown in Figure 3.21, the percentage of CD8+TCR53mc+ PBLs that showed at
least 1 function varied among the samples with the lowest being 41 % (PBL-RCC°2)
and the highest 74 % (PBL-RCC°4). PBLs of the healthy donor had 54 % of
CD8+TCR53mc+ cells with at least 1 function.
The percentage of cells positive for each cytokine or degranulation is shown in Figure
3.22a and the MFI, representing the average amount of each marker per T cell, is
shown in Figure 3.22b. The percentage of CD45+CD8+mTCR+ T cells secreting IFN-
and their MFI were very similar in all PBLs donors. The percentages of TNF-,
CD107 and IL-2 positive cells varied among the samples, whereas the MFI of the
positive cells was very similar among the samples. PBL-TCR53mc cells of RCC°4
and RCC°5 donors had higher number of cells producing TNF- (32 % and 40 %,
respectively) and IL-2 (39% and 38%, respectively) than the others (average of 25 %
for both cytokines). PBL-TCR53mc of RCC°4 had the highest percentage of cells that
degranulated (46 %, average of 33 %).
Figure 3.22. IFN-, TNF, CD107 or IL-2 positive cells among the gated CD45+CD8
+TCR53mc
+ T
cells of PBL of RCC patient donors (RCC°1-°5) and a healthy donor.
Cytokine production or degranulation by PBL-TCR53mc cells of RCC donors (RCC°1-°5) and a healthy donor upon recognition of RCC-26 cells. (a) The percentage of PBL-TCR53mc cells gated on CD45
+CD8
+TCR53mc
+ secreting each cytokine or degranulating was assessed by flow cytometry. (b)
MFI of each cytokine or CD107 was likewise assessed by flow cytometry. Black lines show the mean of each marker among all PBL donors.
CD107
25
0
12.5
IFNy
IL2
TNFa
CD10
7
0
1250
2500healthy
VO
HO
IG
SC
LÜ
MF
I o
f to
tal C
D8+
TC
R+
IFN- IL-2 TNF-
50
0
25
healthy
RCC°1
RCC°2
RCC°3
RCC°5 55
RCC°4
PBL:
[x102]
% +
cell
s
[CD
45
+C
D8
+m
TC
R+]
MF
I [C
D4
5+C
D8
+m
TC
R+]
(a) (b)
CD107 IFN- IL-2 TNF-
IFNy TNFa CD107 IL20
25
50healthy
VO
HO
IG
SC
LÜ
% o
f to
tal C
D8+
TC
R+
healthy
VO
HO
IG
SC
LÜ

___________________________________________________________________ Results
55
PBL-RCC°2 showed the lowest percentage of responding cells in all functions. The
function with the highest variation among the different PBL donors was IL-2
secretion. The MFI of each marker varied less among the PBL donors than the
percentage of positive cells, indicating that the amount of the response produced was
homogeneous among the responding PBL-TCR53mc of the different donors. The
PBLs of patient RCC°2 presented the lowest IL-2 content per cell (13.5 x 10²) and
the PBLs of patient RCC°4 presented the highest IL-2 content per cell (22 x102).
Figure 3.23. TCR53mc-mediated polyfunctional response of PBLs of RCC patients and a healthy donor. Polyfunctional response of PBL-TCR53mc of RCC donors (RCC°1-°5) and 1 healthy donor upon incubation with RCC-26 cells. The capacity of a CD45
+CD8
+ T cell expressing TCR53mc to exhibit 1,
2, 3 or 4 functions among secretion of the cytokines IL-2, IFN-, TNF- or degranulation was analyzed by Boolean gating.
The polyfunctional response, i.e the simultaneous secretion of multiple cytokines and
degranulation, calculated by Boolean gating, revealed a similar profile for all PBLs
donors (Figure 3.23). The PBLs of the patient donor RCC°5 exhibited the highest
number of cells capable of producing all 4 functions (11 %).
3.4 Maintenance of functionality of PBLs transduced with pMP71-TCR53mc
PBL-healthy
°1 °2 °3 °4 °5
Healthy VO HO IG SC LÜ0
50
1001 function
3 functions
4 functions
2 functions
% o
f re
sp
on
din
g
1 function
2 functions
3 functions
4 functions
% o
f re
sp
on
din
g c
ells
100
0
50
Helthy RCC1 RCC2 RCC3 RCC4 RCC5
PBL
% o
f re
sp
on
din
g c
ells
[CD
45
+C
D8
+m
TC
R+]
50
0
1 function
2 functions
3 functions
4 functions
TCR53 D1150
50
1001 function
3 functions
4 functions
2 functions
% o
f re
sp
on
din
g
100
RCC PBL

Results
56
Anergy refers to a state in which a viable, antigen-specific T cell is unable to respond
to an immunogenic stimulus. Anergy can be induced under normal antigenic
stimulation received in the absence of costimulation, or by altered and/or chronic
TCR stimulus and long-term culturing [98]. To investigate whether the functional
profile of the PBL-TCR53mc cells was affected by the long-term culture, the
functional response of PBLs of RCC patients and a healthy donor was assessed at
day 20 to 22 after the stimulation with anti-CD3 and anti-CD28, in IL-2 or IL-15
culturing conditions.
3.4.1 Cytotoxic response of PBLs of RCC patients and a healthy donor expressing TCR53mc at day 22 after stimulation.
To investigate whether the PBLs of RCC patients and one healthy donor expressing
TCR53mc maintain cytotoxic function after long-term culture, the killing of CCA-17
cells, which has the pMHC-ligand recognized by TCR53, was analyzed in a 4 h
chromium release assay. PBL-TCR53mc and PBL-mock cells of all donors cultivated
in IL-2- or IL-15-containing medium were incubated with titrated amounts of
chromium-labeled CCA-17 cells.
Figure 3.24. Lytic capacity of PBLs of RCC patients and a healthy donor transduced with pMP71-TCR53mc, assessed at day 22 after stimulation.
The specific killing was assessed by a 4 h chromium release assay using CCA-17 cells cultivated with the patient PBLs (RCC-PBL°1-°3) or healthy PBLs transduced with pMP71-TCR53mc (PBL-TCR53mc) or not transduced (PBL-mock). The percentage of specific lysis values are means of duplicates ± mean deviation. Shown in the x axis is the effector to target ratio.
20 10 5 2,50
20
40HO53
Mock HO
HO53
Mock HO
20 10 5 2,5
0
20
40Healthy53
Mock healthy
Healthy53
Mock healthy
20 10 5 2,5
0
20
40VO53
Mock VO
VO53
Mock VO
20 10 5 2,5
0
20
40IG53
Mock IG
IG53
Mock IG
E:T ratio
PBL-healthy PBL-RCC°2 PBL-RCC°1 PBL-RCC°3
0
20
40
20 10 5 2.5 20 10 5 2.5 20 10 5 2.5 20 10 5 2.5
% s
pecif
ic ly
sis
PBL-TCR53mc
PBL-mock
PBL-TCR53mc
PBL-mock IL-2 IL-15
20 10 5 2,50
20
40IG53
Moc k IG
IG53
Moc k IG
20 10 5 2,50
20
40IG53
Moc k IG
IG53
Moc k IG
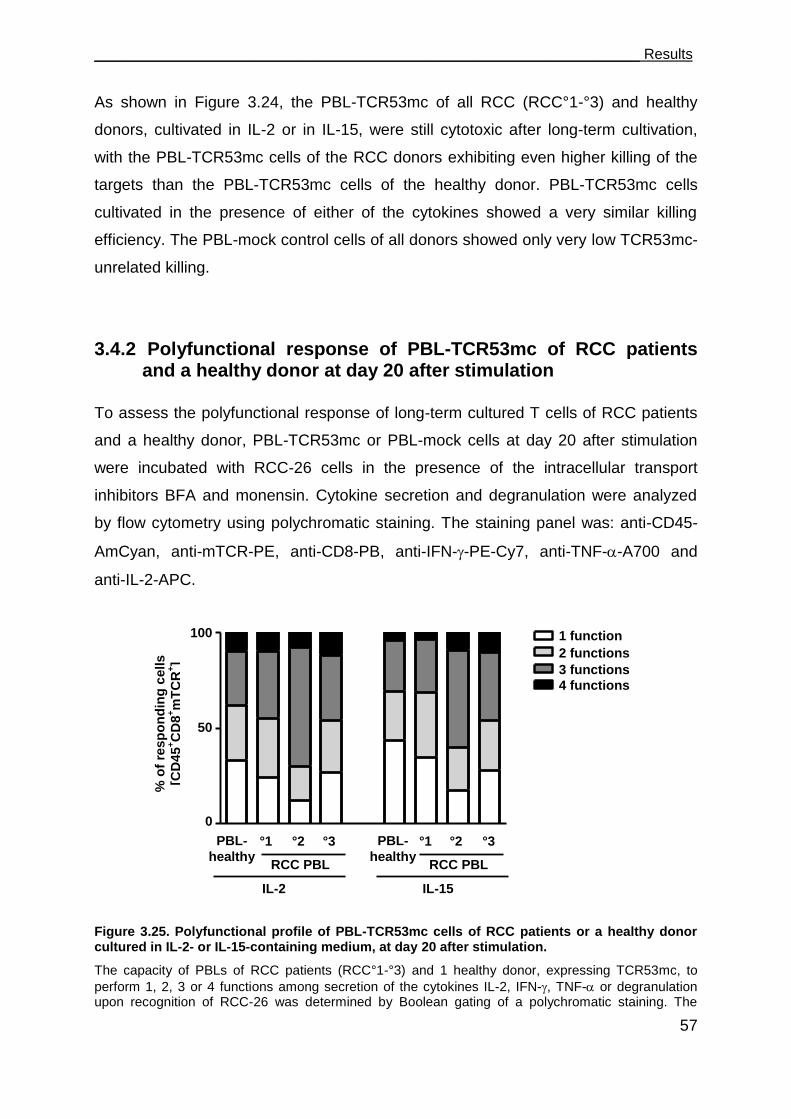
___________________________________________________________________ Results
57
As shown in Figure 3.24, the PBL-TCR53mc of all RCC (RCC°1-°3) and healthy
donors, cultivated in IL-2 or in IL-15, were still cytotoxic after long-term cultivation,
with the PBL-TCR53mc cells of the RCC donors exhibiting even higher killing of the
targets than the PBL-TCR53mc cells of the healthy donor. PBL-TCR53mc cells
cultivated in the presence of either of the cytokines showed a very similar killing
efficiency. The PBL-mock control cells of all donors showed only very low TCR53mc-
unrelated killing.
3.4.2 Polyfunctional response of PBL-TCR53mc of RCC patients and a healthy donor at day 20 after stimulation
To assess the polyfunctional response of long-term cultured T cells of RCC patients
and a healthy donor, PBL-TCR53mc or PBL-mock cells at day 20 after stimulation
were incubated with RCC-26 cells in the presence of the intracellular transport
inhibitors BFA and monensin. Cytokine secretion and degranulation were analyzed
by flow cytometry using polychromatic staining. The staining panel was: anti-CD45-
AmCyan, anti-mTCR-PE, anti-CD8-PB, anti-IFN--PE-Cy7, anti-TNF--A700 and
anti-IL-2-APC.
Figure 3.25. Polyfunctional profile of PBL-TCR53mc cells of RCC patients or a healthy donor cultured in IL-2- or IL-15-containing medium, at day 20 after stimulation.
The capacity of PBLs of RCC patients (RCC°1-°3) and 1 healthy donor, expressing TCR53mc, to
perform 1, 2, 3 or 4 functions among secretion of the cytokines IL-2, IFN-, TNF- or degranulation upon recognition of RCC-26 was determined by Boolean gating of a polychromatic staining. The
PBL-
healthy °1 °2 °3
100
0
50
% o
f re
sp
on
din
g c
ells
[CD
45
+C
D8
+m
TC
R+]
0
50
100
PBL-
healthy °1 °2 °3
RCC PBL RCC PBL
IL-2 IL-15
1 function
2 functions
3 functions
4 functions
TCR53 D1150
50
1001 function
3 functions
4 functions
2 functions
% o
f re
sp
on
din
g
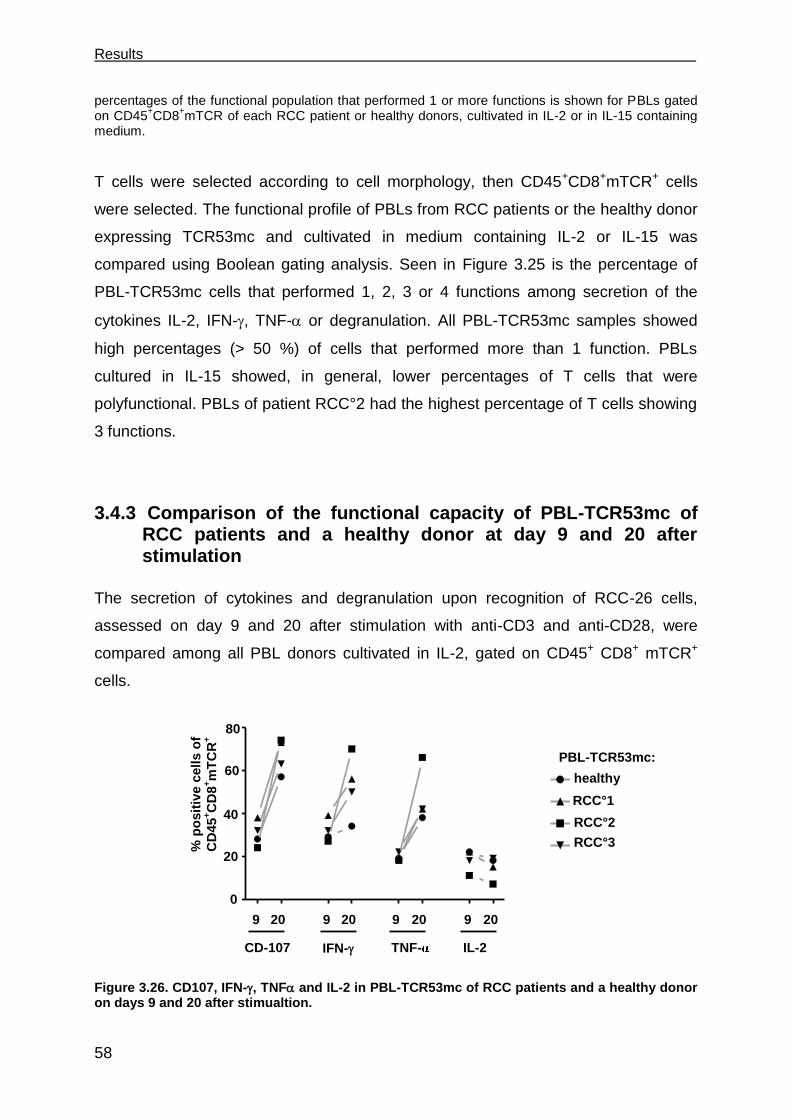
Results
58
percentages of the functional population that performed 1 or more functions is shown for PBLs gated on CD45
+CD8
+mTCR of each RCC patient or healthy donors, cultivated in IL-2 or in IL-15 containing
medium.
T cells were selected according to cell morphology, then CD45+CD8+mTCR+ cells
were selected. The functional profile of PBLs from RCC patients or the healthy donor
expressing TCR53mc and cultivated in medium containing IL-2 or IL-15 was
compared using Boolean gating analysis. Seen in Figure 3.25 is the percentage of
PBL-TCR53mc cells that performed 1, 2, 3 or 4 functions among secretion of the
cytokines IL-2, IFN-, TNF- or degranulation. All PBL-TCR53mc samples showed
high percentages (> 50 %) of cells that performed more than 1 function. PBLs
cultured in IL-15 showed, in general, lower percentages of T cells that were
polyfunctional. PBLs of patient RCC°2 had the highest percentage of T cells showing
3 functions.
3.4.3 Comparison of the functional capacity of PBL-TCR53mc of RCC patients and a healthy donor at day 9 and 20 after stimulation
The secretion of cytokines and degranulation upon recognition of RCC-26 cells,
assessed on day 9 and 20 after stimulation with anti-CD3 and anti-CD28, were
compared among all PBL donors cultivated in IL-2, gated on CD45+ CD8+ mTCR+
cells.
Figure 3.26. CD107, IFN-, TNF and IL-2 in PBL-TCR53mc of RCC patients and a healthy donor on days 9 and 20 after stimualtion.
0
20
40
60
80Healthy
IG
VO
HO
CD-107 IFN- TNF- IL-2
9 20 9 20 9 20 9 20
0
20
40
60
80Healthy
IG
VO
HO
0
80
% p
osit
ive c
ell
s o
f
CD
45
+C
D8
+m
TC
R+
20
40
60 healthy
RCC°1
RCC°2
RCC°3
PBL-TCR53mc:
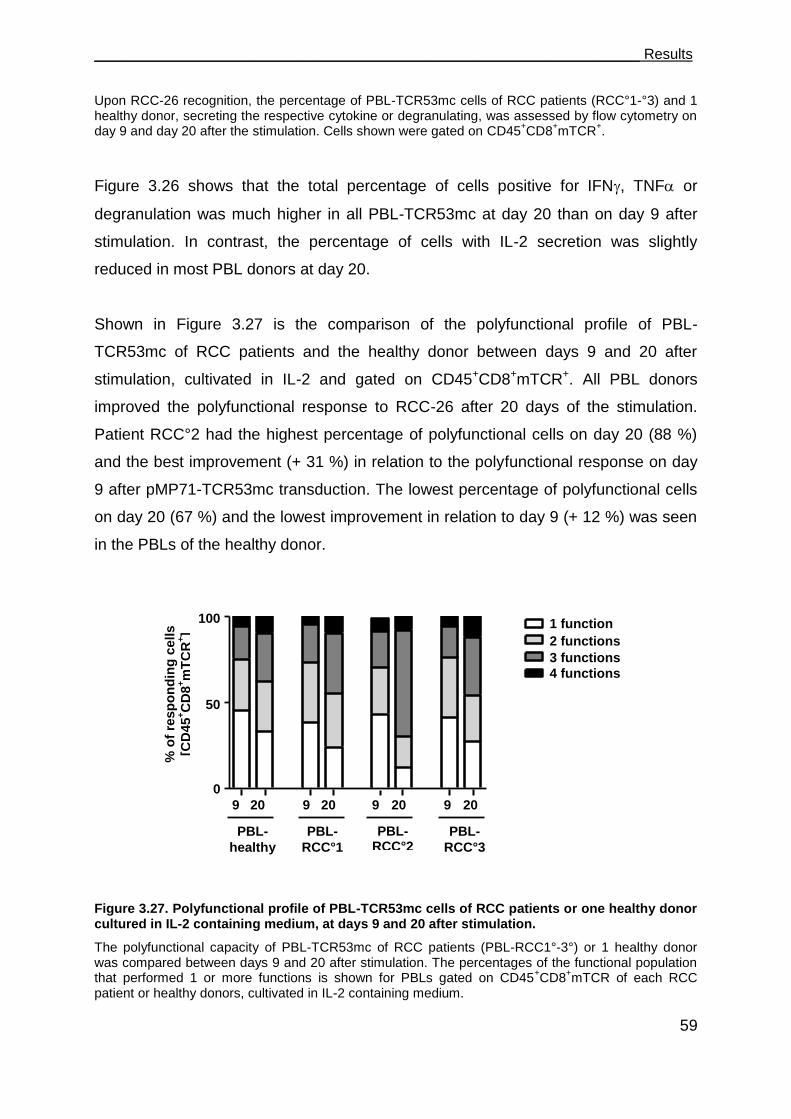
___________________________________________________________________ Results
59
Upon RCC-26 recognition, the percentage of PBL-TCR53mc cells of RCC patients (RCC°1-°3) and 1 healthy donor, secreting the respective cytokine or degranulating, was assessed by flow cytometry on day 9 and day 20 after the stimulation. Cells shown were gated on CD45
+CD8
+mTCR
+.
Figure 3.26 shows that the total percentage of cells positive for IFN, TNF or
degranulation was much higher in all PBL-TCR53mc at day 20 than on day 9 after
stimulation. In contrast, the percentage of cells with IL-2 secretion was slightly
reduced in most PBL donors at day 20.
Shown in Figure 3.27 is the comparison of the polyfunctional profile of PBL-
TCR53mc of RCC patients and the healthy donor between days 9 and 20 after
stimulation, cultivated in IL-2 and gated on CD45+CD8+mTCR+. All PBL donors
improved the polyfunctional response to RCC-26 after 20 days of the stimulation.
Patient RCC°2 had the highest percentage of polyfunctional cells on day 20 (88 %)
and the best improvement (+ 31 %) in relation to the polyfunctional response on day
9 after pMP71-TCR53mc transduction. The lowest percentage of polyfunctional cells
on day 20 (67 %) and the lowest improvement in relation to day 9 (+ 12 %) was seen
in the PBLs of the healthy donor.
Figure 3.27. Polyfunctional profile of PBL-TCR53mc cells of RCC patients or one healthy donor cultured in IL-2 containing medium, at days 9 and 20 after stimulation.
The polyfunctional capacity of PBL-TCR53mc of RCC patients (PBL-RCC1°-3°) or 1 healthy donor was compared between days 9 and 20 after stimulation. The percentages of the functional population that performed 1 or more functions is shown for PBLs gated on CD45
+CD8
+mTCR of each RCC
patient or healthy donors, cultivated in IL-2 containing medium.
0
50
1001 function
2 functions
3 functions
4 functions
1 function
2 functions
3 functions
4 functions
TCR53 D1150
50
1001 function
3 functions
4 functions
2 functions
% o
f re
sp
on
din
g
9 20 9 20 9 20 9 20
100
0
50
PBL-
healthy
PBL-
RCC°1
PBL-RCC°2
PBL-
RCC°3
% o
f re
sp
on
din
g c
ells
[CD
45
+C
D8
+m
TC
R+]
Results
60
3.4.4 IFN- treatment of target cells enhances TCR53-associated recognition
Until the present day, one of the most successful treatments of mRCC patients has
been accomplished with IL-2 and IFN- . One possible mechanism for the positive
outcome is that treatment with cytokines from the interferon type I family activates
antigen-presenting cells to perform better T cell stimulation [99]. Additionally, the
expression of tumor antigens can be modulated through upregulation of transporter
associated with antigen presentation (TAP)-1 [100]. To test whether IFN- or IFN-
would regulate the pMHC ligand recognized by TCR53, target cells were cultured for
48 h with IFN- or IFN- containing medium or medium without cytokines. Then,
HLA-A2 expression was determined by flow cytometry and the cells were cocultured
with B3Z-TCR53m cells. RCC-26, which was well recognized by B3Z-TCR53m and
RCC-53, which was weakly recognized, were used to investigate whether the
different IFNs would differentially modulate the expression of the TCR53-pMHC
ligand and, consequently, the response of B3Z-TCR53m cells. NKC-49, a primary
normal kidney cell line, and RCC-1.26, a RCC cell line that expresses HLA-A2
endogenously but did not stimulate B3Z-TCR53m (Table 2 and Table 1, respectively)
were used to monitor whether the IFNs would induce de novo TCR53 pMHC-ligand
expression enough for TCR53m recognition. Induced recognition of normal kidney
cultures would be undesirable because it would suggest that TCR53-pMHC ligand
expression could be induced on normal kidney tissues by inflammatory conditions
(such as IFN- ), raising concern about TCR53-associated autoreactivity in the clinical
application.
Shown in Figure 3.28a is the HLA-A2 expression for all cell lines after the treatment
with IFN- or IFN- . All cell lines treated with IFN- and IFN- showed an increase in
HLA-A2 surface expression when compared to incubation in medium without
cytokines. Figure 3.28b shows the mIL-2 secretion by the B3Z-TCR53m cells after
incubation with the IFN-treated or untreated RCC or NKC lines. Although almost all
IFN--treated cells had the highest HLA-A2 expression, the B3Z-TCR53m T cell

___________________________________________________________________ Results
61
response to IFN--treated RCC-26 cells was not higher than the response to the
same cells treated with IFN- or medium without cytokines. In contrast, IFN-
treatment reproducibly increased the B3Z-TCR53m response toward RCC-26
(p=0.04, Figure 3.29b, mean of 3 experiments). Neither IFN- nor IFN- treatment
induced recognition of RCC-1.26 or NKC-49 by B3Z-TCR53m cells, indicating that
IFNs are not able to induce de novo expression of the TCR53-pMHC ligand.
Figure 3.28. Recognition of IFN-- or IFN--treated or untreated cell lines by B3Z-TCR53m cells.
RCC cell lines expressing the TCR53-pMHC ligand (RCC-26 and RCC-53) and the HLA-A2+ cells that
were not recognized by B3Z-TCR53m (RCC-1.26 and NKC-49) were cultured in IFN-- or IFN--containing medium or in medium without cytokines for 48 h and then incubated with B3Z-TCR53m cells. (a) HLA-A2 detection by flow cytometry on RCC-26, RCC-53, NKC-49 and RCC-1.26 subjected
to IFN- or IFN- treatment or medium without cytokines. Numbers indicate the MFI for each population in the corresponding color of the treatment. Isotype antibodies showed the same
IFN-
RCC-26 RCC-53 NKC-49 RCC-1.26
600
300
0
* *
mIL
-2 [
pg
/ml]
(b) p=0.04
RCC-53 RCC-26 NKC-49 RCC-1.26
Isotype Medium Medium with IFN- Medium with IFN-
HLA-A2
% o
f m
ax
(a)
760 860
180 460
730 870
175 165
170 350 620 145
IFN- - + -
- - +
- + -
- - +
- + -
- - +
- + -
- - +
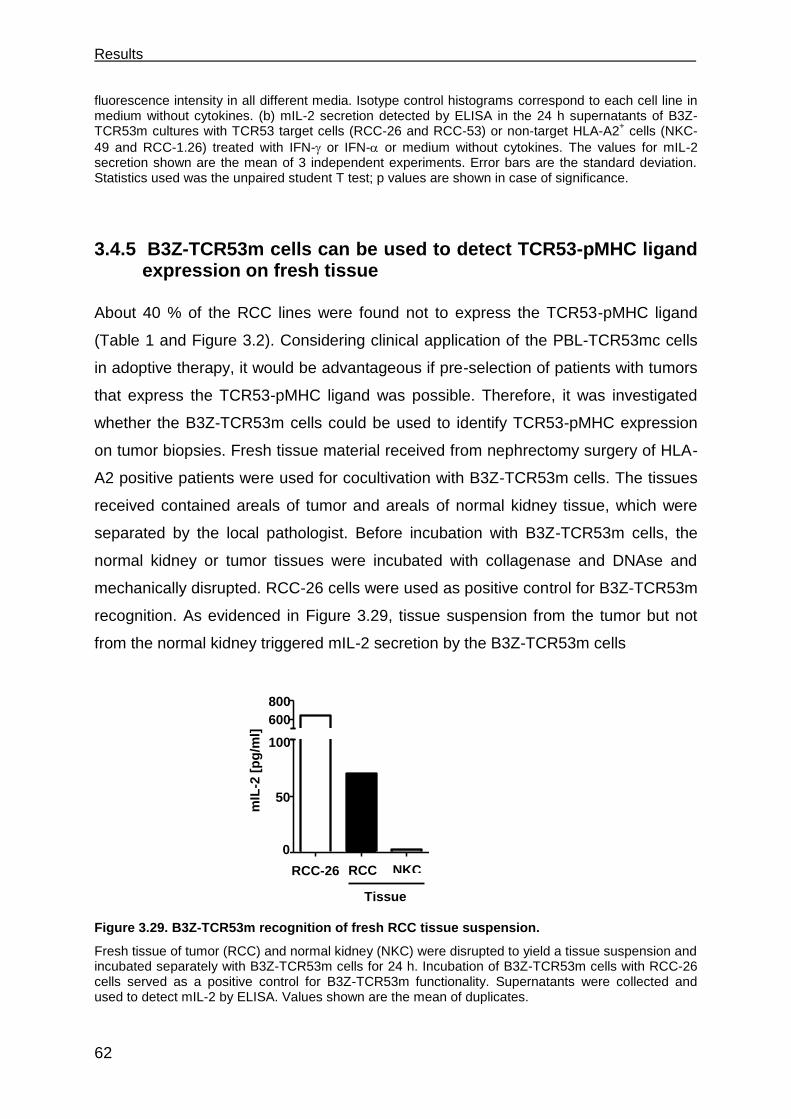
Results
62
fluorescence intensity in all different media. Isotype control histograms correspond to each cell line in medium without cytokines. (b) mIL-2 secretion detected by ELISA in the 24 h supernatants of B3Z-TCR53m cultures with TCR53 target cells (RCC-26 and RCC-53) or non-target HLA-A2
+ cells (NKC-
49 and RCC-1.26) treated with IFN- or IFN- or medium without cytokines. The values for mIL-2 secretion shown are the mean of 3 independent experiments. Error bars are the standard deviation. Statistics used was the unpaired student T test; p values are shown in case of significance.
3.4.5 B3Z-TCR53m cells can be used to detect TCR53-pMHC ligand expression on fresh tissue
About 40 % of the RCC lines were found not to express the TCR53-pMHC ligand
(Table 1 and Figure 3.2). Considering clinical application of the PBL-TCR53mc cells
in adoptive therapy, it would be advantageous if pre-selection of patients with tumors
that express the TCR53-pMHC ligand was possible. Therefore, it was investigated
whether the B3Z-TCR53m cells could be used to identify TCR53-pMHC expression
on tumor biopsies. Fresh tissue material received from nephrectomy surgery of HLA-
A2 positive patients were used for cocultivation with B3Z-TCR53m cells. The tissues
received contained areals of tumor and areals of normal kidney tissue, which were
separated by the local pathologist. Before incubation with B3Z-TCR53m cells, the
normal kidney or tumor tissues were incubated with collagenase and DNAse and
mechanically disrupted. RCC-26 cells were used as positive control for B3Z-TCR53m
recognition. As evidenced in Figure 3.29, tissue suspension from the tumor but not
from the normal kidney triggered mIL-2 secretion by the B3Z-TCR53m cells
Figure 3.29. B3Z-TCR53m recognition of fresh RCC tissue suspension.
Fresh tissue of tumor (RCC) and normal kidney (NKC) were disrupted to yield a tissue suspension and incubated separately with B3Z-TCR53m cells for 24 h. Incubation of B3Z-TCR53m cells with RCC-26 cells served as a positive control for B3Z-TCR53m functionality. Supernatants were collected and used to detect mIL-2 by ELISA. Values shown are the mean of duplicates.
0
50
100
600
800
0
50
100
600
800
RCC-26 RCC NKC
mIL
-2 [
pg
/ml]
Tissue
___________________________________________________________________ Results
63
3.5 T cells develop deficits when exposed to spheroids
Spheroids mimic tumor pathophysiology aspects, like resistance to drugs and
radiation, and are important tools to measure the therapeutical applicability of new
reagents used for cancer treatment [87]. PBL-TCR53mc cells were found to mediate
specific killing of RCC-26 cells cultivated as spheroids in a 4 h incubation assay
(Figure 3.16). Now, viability and phenotype of T cells that stayed in the spheroid
beyond the 4 h of incubation were studied.
3.5.1 T cell survival after 4 h and 24 h in spheroids
To study the viability and the phenotype of T cells that stayed in the spheroid beyond
4 h, PBL-TCR53mc cells of a healthy donor were allowed to enter the 3-D cultures (5
days-old spheroids) for 4 h or 24 h. After that, spheroids were harvested and washed
to remove non-adherent T cells, then they were either disrupted using accutase and
used for T cell characterization by flow cytometry, or they were frozen in liquid
nitrogen and then cut into 5 µm sections and used for immune staining to detect the
T cell infiltration. As shown in the histological section of a spheroid stained with anti-
CD8 antibody (Figure 3.30a), T cells strongly infiltrated spheroids after 4 h of
coincubation. The highest density of T cells was seen at the spheroid periphery (~
100 µm in width). Beyond this rim, in the spheroid center, the density of T cells
sharply dropped. After 24 h, the numbers of T cells visible in the periphery as well as
in the spheroid center were drastically reduced. The examples of immune staining
depicted in Figure 3.30a are representative of 3 independent experiments.
Hypoxic tissue areas, defined as areas with values of partial pressures of oxygen
(pO2) ≤ 2.5 mmHg, are a characteristic of locally advanced solid tumors and are
found across a wide range of human malignancies [101]. Sutherland and colleagues
[126] found severe hypoxia in the center of almost all tumor spheroids studied that
had a radius ranging from 300 µm to 500 µm. The RCC spheroids used in my
Results
64
experiments had a radius of approximately 360 µm. Therefore, the pO2 curve
obtained by Sutherland and colleagues can be applied to estimate their pO2 values.
Accordingly, the 100 µm rim of the RCC spheroid containing most T cells (Figure
3.30a) would have a pO2 value of ~ 30 mm Hg and thus normoxic. The center of the
spheroid would have a pO2 value of 0 mm Hg.
The cell suspension obtained from the PBL-TCR53mc-spheroid incubations was
stained with anti-CD45-PE-Cy7 to identify the T cells and 7-AAD to assess number of
dead cells and to gate on viable cells (7-AAD-). To obtain the number of CD45+ T
cells that were inside spheroids, counting beads were added to the stained cell
suspension immediately before acquisition by flow cytometry (for details of the
method, see section 6.1.7). The time points analyzed corresponded to T cells
cultivated for 4 h or 24 h in a hanging drop of medium with or without spheroid (for
details see section 6.7.9). T cells cultivated without spheroid for either 4 h or 24 h
always had identical characteristics. Therefore, only 1 time-point (24 h) is shown in
the graphs. For each time-point, 8 spheroids were taken. As shown in Figure 3.30b,
the number of CD45+ T cells inside the spheroids was significantly higher (p=0,001)
after 4 h than after 24 h, confirming the histological observation. The staining with 7-
AAD revealed an increased number of CD45+ 7-AAD+ cells after 24 h in spheroids
(Figure 3.30c), suggesting loss of T cell viability after long exposure to spheroids.
The results shown in Figure 3.30c are 1 representative example of 4 independent
experiments.

___________________________________________________________________ Results
65
Figure 3.30. Numbers and viability of PBL-TCR53mc cells after 4 h and 24 h of infiltration in RCC-26 spheroids.
PBL-TCR53mc cells (1 x 10⁵ cells per spheroid) were allowed to enter 5 days-old RCC-26 3-D
cultures for 4 h or 24 h, then spheroids were washed and used for analysis. Spheroids were analyzed histologically by APAAP staining (a) or they were disrupted and the cell suspension was used for flow cytometry (b and c). In (a) histological sections of cryo-preserved RCC-26 spheroids exposed to PBL-TCR53mc for 4 h (left) or 24 h (right) were stained with anti-CD8 antibody to detect CD8
+ T cells (red).
Pictures were taken at a magnification of 100 x. The distance „d1“ (102 µm) indicates the width of the rim of the spheroid where most T cells were found after 4 h. The spheroid radius (R) is 360 µm. In (b) 4 experiments are summarized in which PBL-TCR53mc cells were exposed to spheroids for 4 h or 24 h. The absolute number of CD45
+7-AAD
- T cells was calculated with the help of counting beads. The p
value was calculated by unpaired student T test. In (c) the histograms show the gated CD45+
population, values are the percentages of cells stained positively for 7-AAD. As a control, T cells were cultivated without spheroid for 24 h on the Petri-dish lid. The traced vertical line indicates the threshold considered to be 7-AAD positive. Shown is 1 representative of 3 experiments.
0
1.0104
2.0104
3.0104
n of cells CD8 4h in spheroids
n of cellsCD8 24h in spheroids
24 h
anti-CD8 staining of PBL-TCR53mc in RCC-26 spheroids
4 h
7-AAD
24 h w/o
spheroid
4 h
24 h
(a)
(b)
4 h 24 h
n°
of
CD
45
+ c
ells
(c)
p=0.001 **
5 %
10 %
65 %
R= 360 µm
d1 =102 µm 102 µm
R= 360 µm
1
0
2
3 [10
4] PBL-TCR53mc:
In s
ph
ero
id
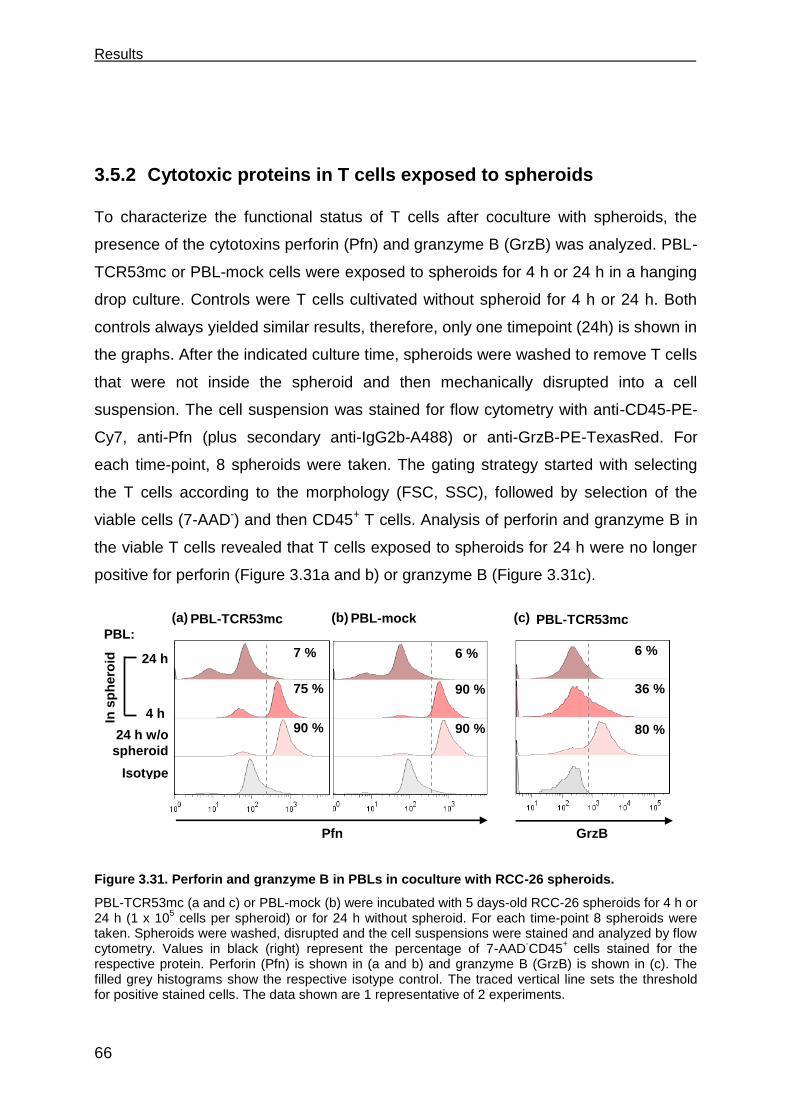
Results
66
3.5.2 Cytotoxic proteins in T cells exposed to spheroids
To characterize the functional status of T cells after coculture with spheroids, the
presence of the cytotoxins perforin (Pfn) and granzyme B (GrzB) was analyzed. PBL-
TCR53mc or PBL-mock cells were exposed to spheroids for 4 h or 24 h in a hanging
drop culture. Controls were T cells cultivated without spheroid for 4 h or 24 h. Both
controls always yielded similar results, therefore, only one timepoint (24h) is shown in
the graphs. After the indicated culture time, spheroids were washed to remove T cells
that were not inside the spheroid and then mechanically disrupted into a cell
suspension. The cell suspension was stained for flow cytometry with anti-CD45-PE-
Cy7, anti-Pfn (plus secondary anti-IgG2b-A488) or anti-GrzB-PE-TexasRed. For
each time-point, 8 spheroids were taken. The gating strategy started with selecting
the T cells according to the morphology (FSC, SSC), followed by selection of the
viable cells (7-AAD-) and then CD45+ T cells. Analysis of perforin and granzyme B in
the viable T cells revealed that T cells exposed to spheroids for 24 h were no longer
positive for perforin (Figure 3.31a and b) or granzyme B (Figure 3.31c).
Figure 3.31. Perforin and granzyme B in PBLs in coculture with RCC-26 spheroids.
PBL-TCR53mc (a and c) or PBL-mock (b) were incubated with 5 days-old RCC-26 spheroids for 4 h or 24 h (1 x 10
5 cells per spheroid) or for 24 h without spheroid. For each time-point 8 spheroids were
taken. Spheroids were washed, disrupted and the cell suspensions were stained and analyzed by flow cytometry. Values in black (right) represent the percentage of 7-AAD
-CD45
+ cells stained for the
respective protein. Perforin (Pfn) is shown in (a and b) and granzyme B (GrzB) is shown in (c). The filled grey histograms show the respective isotype control. The traced vertical line sets the threshold for positive stained cells. The data shown are 1 representative of 2 experiments.
6 %
90 %
90 %
7 %
75 %
90 %
80 %
36 %
6 %
GrzB
Isotype
Pfn
(a) (c) (b) PBL-TCR53mc PBL-mock PBL-TCR53mc
24 h w/o
spheroid
4 h
24 h
In s
ph
ero
id
PBL:
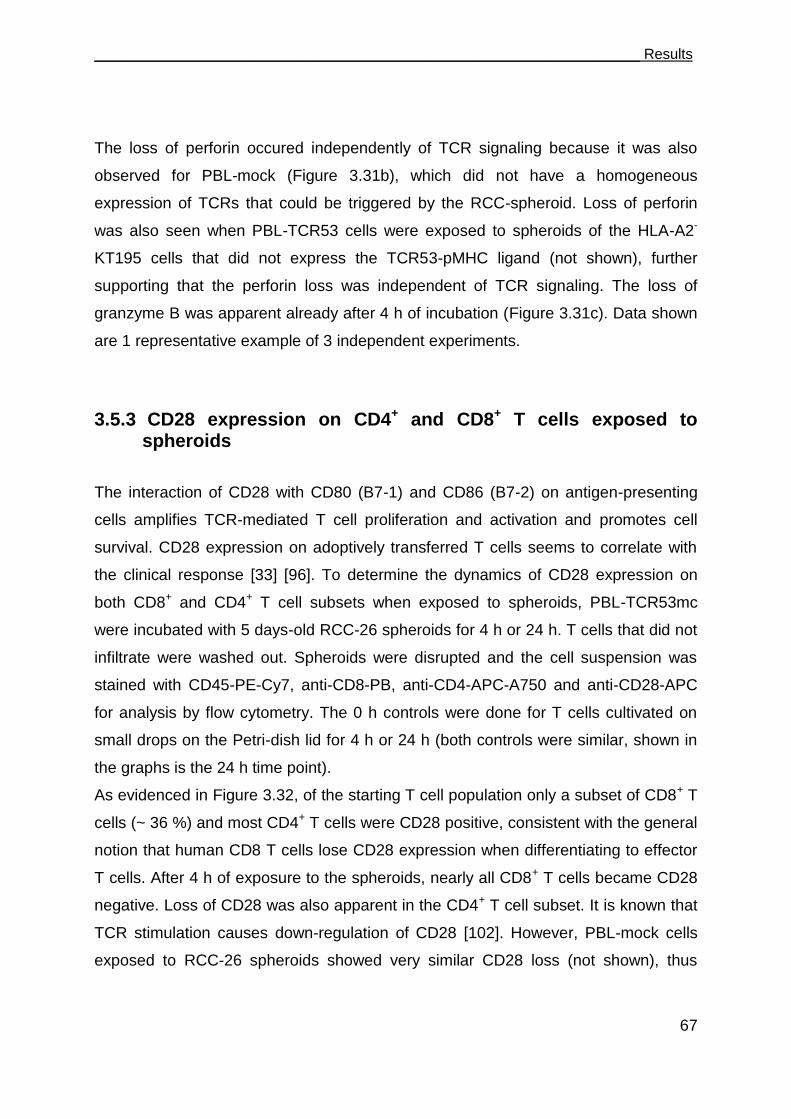
___________________________________________________________________ Results
67
The loss of perforin occured independently of TCR signaling because it was also
observed for PBL-mock (Figure 3.31b), which did not have a homogeneous
expression of TCRs that could be triggered by the RCC-spheroid. Loss of perforin
was also seen when PBL-TCR53 cells were exposed to spheroids of the HLA-A2-
KT195 cells that did not express the TCR53-pMHC ligand (not shown), further
supporting that the perforin loss was independent of TCR signaling. The loss of
granzyme B was apparent already after 4 h of incubation (Figure 3.31c). Data shown
are 1 representative example of 3 independent experiments.
3.5.3 CD28 expression on CD4+ and CD8+ T cells exposed to spheroids
The interaction of CD28 with CD80 (B7-1) and CD86 (B7-2) on antigen-presenting
cells amplifies TCR-mediated T cell proliferation and activation and promotes cell
survival. CD28 expression on adoptively transferred T cells seems to correlate with
the clinical response [33] [96]. To determine the dynamics of CD28 expression on
both CD8+ and CD4+ T cell subsets when exposed to spheroids, PBL-TCR53mc
were incubated with 5 days-old RCC-26 spheroids for 4 h or 24 h. T cells that did not
infiltrate were washed out. Spheroids were disrupted and the cell suspension was
stained with CD45-PE-Cy7, anti-CD8-PB, anti-CD4-APC-A750 and anti-CD28-APC
for analysis by flow cytometry. The 0 h controls were done for T cells cultivated on
small drops on the Petri-dish lid for 4 h or 24 h (both controls were similar, shown in
the graphs is the 24 h time point).
As evidenced in Figure 3.32, of the starting T cell population only a subset of CD8+ T
cells (~ 36 %) and most CD4+ T cells were CD28 positive, consistent with the general
notion that human CD8 T cells lose CD28 expression when differentiating to effector
T cells. After 4 h of exposure to the spheroids, nearly all CD8+ T cells became CD28
negative. Loss of CD28 was also apparent in the CD4+ T cell subset. It is known that
TCR stimulation causes down-regulation of CD28 [102]. However, PBL-mock cells
exposed to RCC-26 spheroids showed very similar CD28 loss (not shown), thus

Results
68
arguing that the observed effects can occur without TCR signaling. Data shown are 1
representative example of 2 experiments.
Figure 3.32 CD28 expression on PBL-TCR53mc cells in coculture with RCC-26 spheroids.
PBL-TCR53mc (1 x 10⁵ cells per spheroid) cells were allowed to enter 5 days-old RCC-26 spheroids
for 4 h or 24 h. As a control, T cells were cultivated without spheroid for 24 h on the Petri-dish lid. Spheroids were washed, disrupted and the cell suspensions were stained and analyzed by flow cytometry. T cells were gated on 7-AAD
-CD45
+CD8
+ (a) or 7-AAD
-CD45
+CD4
+ (b) and CD28
expression was assessed. Values in black (right) represent the percentage of cells stained for each marker in the 7-AAD
-CD45
+ population. The histogram tinted grey show the isotype control. Traced
vertical line sets the threshold for positive stained cells. Data shown is a representative example of 2 experiments.
3.5.4 Functional performance of PBL-TCR53mc cells in 3-D tumor cell spheroids
The functional capacity of PBL-TCR53mc cells was examined after they had been
exposed to RCC-26 spheroids for 24 h. RCC-26 cells express the pMHC ligand for
TCR53 and should induce a functional response such as secretion of cytokines. To
detect this response, 8 spheroids that were incubated with PBL-TCR53mc cells for
24 h were taken and mechanically disrupted to obtain a cell suspension. The cell
suspension was then incubated for additional 4 h with intracellular transport blockers
(monensin and BFA). As a control, PBL-TCR53mc cells were cultured in parallel with
RCC-26 cells from monolayer cultures for 24 h and then for additionally 4 h in the
presence of monensin and BFA. The secretion of cytokines was investigated by
staining the cell suspensions with IL-2-APC, IFN--PE-Cy7 and TNF--A700.
Staining with 7-AAD, CD45-AmCyan and anti-CD8-PB served to gate on the viable
CD8+ T cells and mTCR-PE to assess the TCR53 expression status. As shown in the
CD28
80 %
35 %
2 %
CD8+
T cells
36 %
16 %
3 %
Isotype
24 h w/o
spheroid
4 h
24 h
In s
ph
ero
id
CD4+
T cells PBL-TCR53:
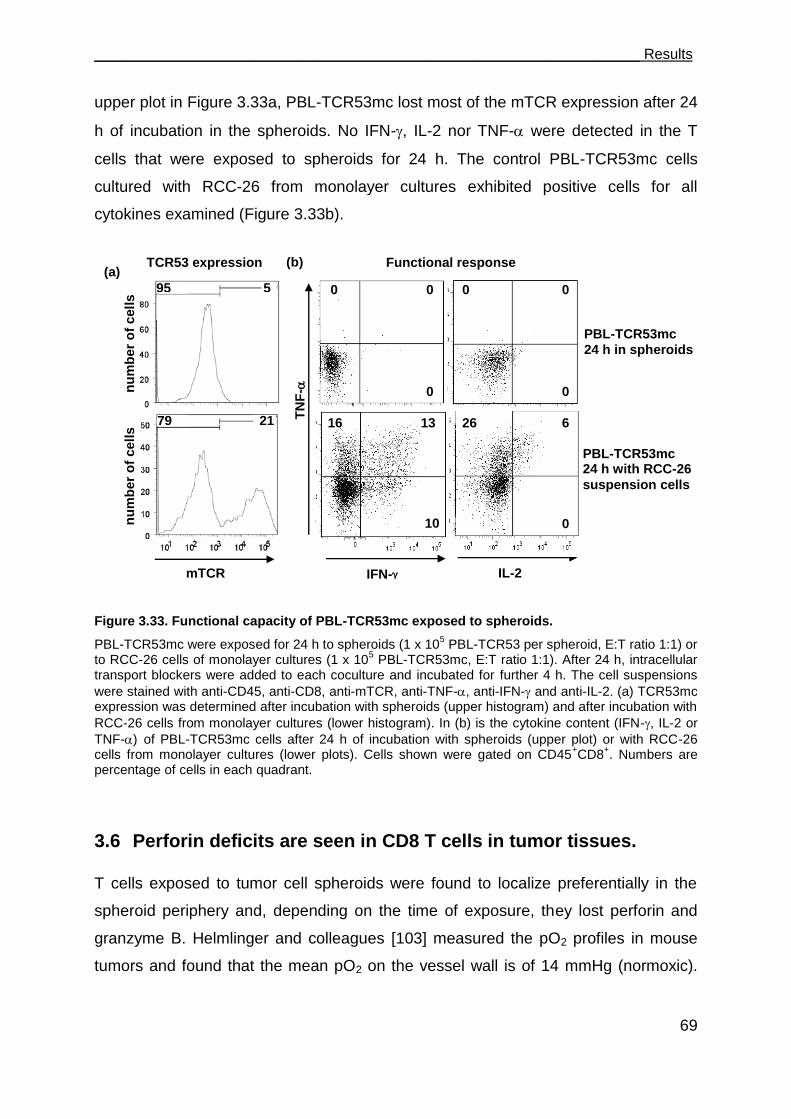
___________________________________________________________________ Results
69
upper plot in Figure 3.33a, PBL-TCR53mc lost most of the mTCR expression after 24
h of incubation in the spheroids. No IFN-, IL-2 nor TNF- were detected in the T
cells that were exposed to spheroids for 24 h. The control PBL-TCR53mc cells
cultured with RCC-26 from monolayer cultures exhibited positive cells for all
cytokines examined (Figure 3.33b).
Figure 3.33. Functional capacity of PBL-TCR53mc exposed to spheroids.
PBL-TCR53mc were exposed for 24 h to spheroids (1 x 10⁵ PBL-TCR53 per spheroid, E:T ratio 1:1) or
to RCC-26 cells of monolayer cultures (1 x 10⁵ PBL-TCR53mc, E:T ratio 1:1). After 24 h, intracellular
transport blockers were added to each coculture and incubated for further 4 h. The cell suspensions
were stained with anti-CD45, anti-CD8, anti-mTCR, anti-TNF-, anti-IFN- and anti-IL-2. (a) TCR53mc expression was determined after incubation with spheroids (upper histogram) and after incubation with
RCC-26 cells from monolayer cultures (lower histogram). In (b) is the cytokine content (IFN-, IL-2 or
TNF-) of PBL-TCR53mc cells after 24 h of incubation with spheroids (upper plot) or with RCC-26 cells from monolayer cultures (lower plots). Cells shown were gated on CD45
+CD8
+. Numbers are
percentage of cells in each quadrant.
3.6 Perforin deficits are seen in CD8 T cells in tumor tissues.
T cells exposed to tumor cell spheroids were found to localize preferentially in the
spheroid periphery and, depending on the time of exposure, they lost perforin and
granzyme B. Helmlinger and colleagues [103] measured the pO2 profiles in mouse
tumors and found that the mean pO2 on the vessel wall is of 14 mmHg (normoxic).
TN
F-
IFN- IL-2
13
10
16 6
0
26
0
0
0 0
0
0
(a) (b)
mTCR
PBL-TCR53mc
24 h in spheroids
PBL-TCR53mc 24 h with RCC-26
suspension cells
Functional response
TCR53 expression
nu
mb
er
of
cell
s
nu
mb
er
of
cell
s 5 95
21 79
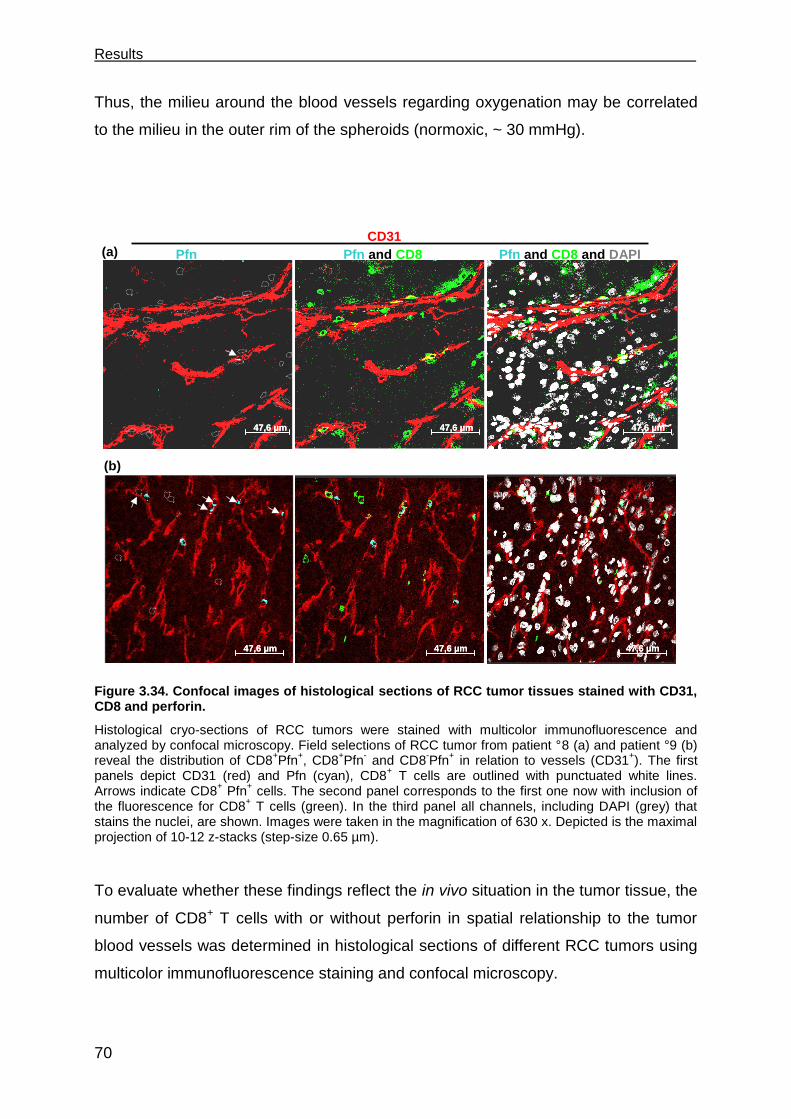
Results
70
Thus, the milieu around the blood vessels regarding oxygenation may be correlated
to the milieu in the outer rim of the spheroids (normoxic, ~ 30 mmHg).
Figure 3.34. Confocal images of histological sections of RCC tumor tissues stained with CD31, CD8 and perforin.
Histological cryo-sections of RCC tumors were stained with multicolor immunofluorescence and analyzed by confocal microscopy. Field selections of RCC tumor from patient °8 (a) and patient °9 (b) reveal the distribution of CD8
+Pfn
+, CD8
+Pfn
- and CD8
-Pfn
+ in relation to vessels (CD31
+). The first
panels depict CD31 (red) and Pfn (cyan), CD8+ T cells are outlined with punctuated white lines.
Arrows indicate CD8+ Pfn
+ cells. The second panel corresponds to the first one now with inclusion of
the fluorescence for CD8+ T cells (green). In the third panel all channels, including DAPI (grey) that
stains the nuclei, are shown. Images were taken in the magnification of 630 x. Depicted is the maximal projection of 10-12 z-stacks (step-size 0.65 µm).
To evaluate whether these findings reflect the in vivo situation in the tumor tissue, the
number of CD8+ T cells with or without perforin in spatial relationship to the tumor
blood vessels was determined in histological sections of different RCC tumors using
multicolor immunofluorescence staining and confocal microscopy.
(a)
(b)
Pfn Pfn and CD8 Pfn and CD8 and DAPI
47,6 µm47,6 µm 47,6 µm47,6 µm 47,6 µm47,6 µm
47,6 µm47,6 µm 47,6 µm47,6 µm 47,6 µm47,6 µm
CD31
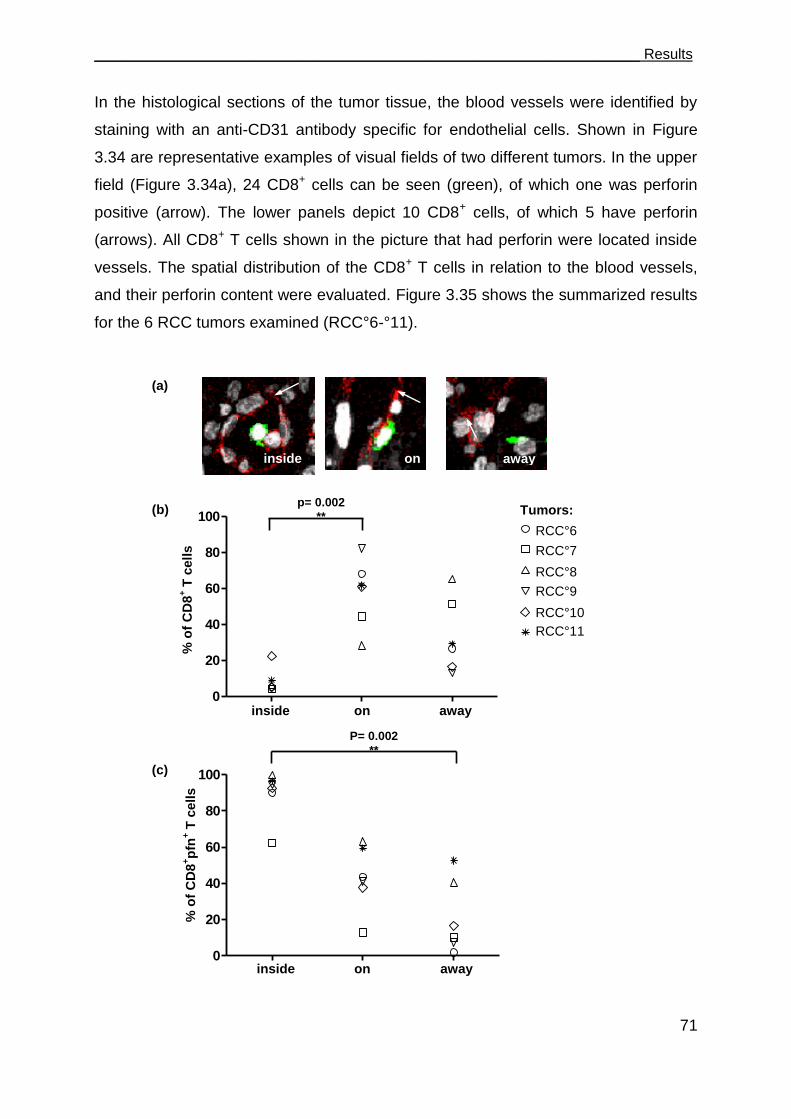
___________________________________________________________________ Results
71
In the histological sections of the tumor tissue, the blood vessels were identified by
staining with an anti-CD31 antibody specific for endothelial cells. Shown in Figure
3.34 are representative examples of visual fields of two different tumors. In the upper
field (Figure 3.34a), 24 CD8+ cells can be seen (green), of which one was perforin
positive (arrow). The lower panels depict 10 CD8+ cells, of which 5 have perforin
(arrows). All CD8+ T cells shown in the picture that had perforin were located inside
vessels. The spatial distribution of the CD8+ T cells in relation to the blood vessels,
and their perforin content were evaluated. Figure 3.35 shows the summarized results
for the 6 RCC tumors examined (RCC°6-°11).
0
20
40
60
80
100T7
T4
T5
T1
T28
T8
0
20
40
60
80
100T7
T4
T5
T1
T28
T8
inside away on
inside on away
% o
f C
D8
+ T
cell
s
Tumors:
(a)
(b)
(c)
inside on away
% o
f C
D8
+p
fn+ T
cells
p= 0.002
**
P= 0.002
**
RCC°6
RCC°7
RCC°8
RCC°9
RCC°10
RCC°11
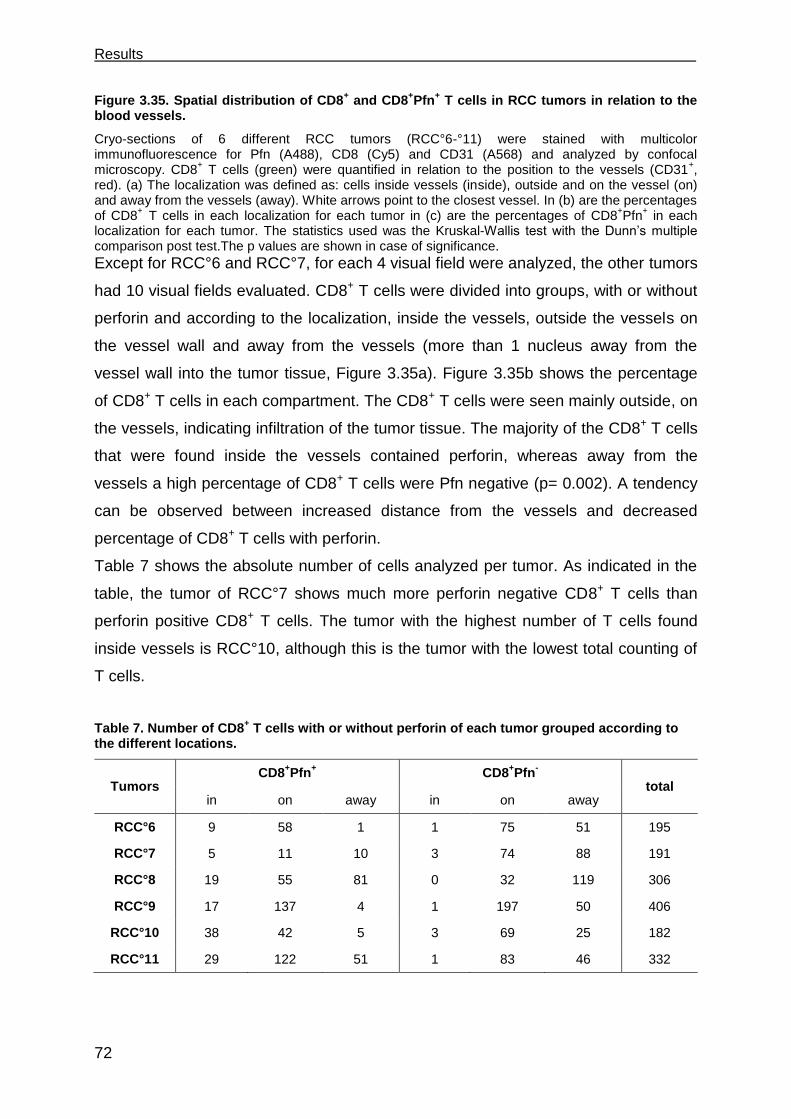
Results
72
Figure 3.35. Spatial distribution of CD8+ and CD8
+Pfn
+ T cells in RCC tumors in relation to the
blood vessels.
Cryo-sections of 6 different RCC tumors (RCC°6-°11) were stained with multicolor immunofluorescence for Pfn (A488), CD8 (Cy5) and CD31 (A568) and analyzed by confocal microscopy. CD8
+ T cells (green) were quantified in relation to the position to the vessels (CD31
+,
red). (a) The localization was defined as: cells inside vessels (inside), outside and on the vessel (on) and away from the vessels (away). White arrows point to the closest vessel. In (b) are the percentages of CD8
+ T cells in each localization for each tumor in (c) are the percentages of CD8+Pfn
+ in each
localization for each tumor. The statistics used was the Kruskal-Wallis test with the Dunn‟s multiple comparison post test.The p values are shown in case of significance.
Except for RCC°6 and RCC°7, for each 4 visual field were analyzed, the other tumors
had 10 visual fields evaluated. CD8+ T cells were divided into groups, with or without
perforin and according to the localization, inside the vessels, outside the vessels on
the vessel wall and away from the vessels (more than 1 nucleus away from the
vessel wall into the tumor tissue, Figure 3.35a). Figure 3.35b shows the percentage
of CD8+ T cells in each compartment. The CD8+ T cells were seen mainly outside, on
the vessels, indicating infiltration of the tumor tissue. The majority of the CD8+ T cells
that were found inside the vessels contained perforin, whereas away from the
vessels a high percentage of CD8+ T cells were Pfn negative (p= 0.002). A tendency
can be observed between increased distance from the vessels and decreased
percentage of CD8+ T cells with perforin.
Table 7 shows the absolute number of cells analyzed per tumor. As indicated in the
table, the tumor of RCC°7 shows much more perforin negative CD8+ T cells than
perforin positive CD8+ T cells. The tumor with the highest number of T cells found
inside vessels is RCC°10, although this is the tumor with the lowest total counting of
T cells.
Table 7. Number of CD8+ T cells with or without perforin of each tumor grouped according to
the different locations.
Tumors CD8
+Pfn
+ CD8
+Pfn
-
total in on away in on away
RCC°6 9 58 1 1 75 51 195
RCC°7 5 11 10 3 74 88 191
RCC°8 19 55 81 0 32 119 306
RCC°9 17 137 4 1 197 50 406
RCC°10 38 42 5 3 69 25 182
RCC°11 29 122 51 1 83 46 332

___________________________________________________________________ Results
73
3.7 The role of CD4+ T cells in supporting CD8+ CTLs
CD4+ T cells have multiple effects on the outcome of an immune response and are
thought to be required for optimal CD8+ T cell responses [52] [54] [55]. CD4+ T cells
of the Th1 type provide help to the differentiation of CD8+ T cell into effector CTLs,
which generally recognize peptides on MHC class I molecules on tumors and exert
lytic activity. CD4+ T cells are generally MHC class II restricted. In epithelial tumors,
where CD8+ CTLs have to exert function, MHC class II ligands for CD4+ T cells are
sparse as epithelial tumors mostly do not express MHC class II molecules. Thus,
stimulation of CD4+ T cells in the tumor is rare, and concomitantly sparse is the
support of the CD8+ T cell function by the CD4+ T cells. The few reports about CD4+
T cells recognizing peptides presented by MHC class I molecules [56] are particularly
interesting in the context of combating epithelial tumors, as these CD4+ T cells would
be stimulated at the site of the tumor and consequently would be able to provide
support for the CD8+ T cells. Therefore, an aim of this work was to characterize and
analyze the function of MHC class I-restricted CD4+ T cells and their potential
capacity in rescuing the deficits observed in the CD8+ T cells upon exposure to the
spheroid milieu. Given that TCR53mc was found to be non-functional on CD4+ T
cells, TCR26 was used to address this question.
3.7.1 TCR26 is expressed on CD8+ and CD4+ T cells and is functional in both
TCR26 was isolated from a CD8+ TIL (TIL-26) of a RCC tumor [104].
Characterization of TIL-26 showed that it recognizes an HLA-A2 restricted antigen,
expressed by its autologous RCC cell line (RCC-26) but not by the normal kidney
counterpart NKC-26 [104]. TIL-26 carried the TCR V20 and V22 chains,
nomenclature used after [105]. In this work, the functionality of CD8+ and CD4+ T
cells expressing TCR26 was investigated.
IVT-mRNA of TCR26 and β chains was electroporated into PBLs that had been
activated with anti-CD3 and anti-CD28 at least seven days before. To detect TCR26
expression on the different T cell subsets, PBLs were stained for CD4+ (anti-CD4-
FITC) and CD8+ (anti-CD8-PB) T cells and TCRV22 (anti-V22-PE) 4 h after

Results
74
electroporation. PBLs electroporated without IVT-mRNA were used as control (PBL-
mock). Figure 3.36 shows TCRV22 expression on CD8+ T cells and CD4+ T cells.
CD4+ T cells showed 12 % more V22+ cells than the CD8+ T cells.
Figure 3.36. Expression of TCR26 on CD8+ and CD4
+ T cell subsets.
PBLs were electroporated with IVT-mRNA of TCR26 and chains (PBL-TCR26) or without IVT-
mRNA (PBL-mock) and stained after 4 h with anti-CD8, anti-CD4 and anti-V22 antibodies to identify expression of TCR26 on the T cell subsets. Percentages of gated CD4
+ or CD8
+ Vβ22-expressing T
cells after subtraction of the endogenous Vβ22 are shown. % of max= % of maximal projection.
The capacity of TCR26 to trigger function in CD4+ and CD8+ T cells was then
analyzed by coculturing TCR26 transfected PBL with RCC-26 cells in the presence of
monensin and BFA and anti-CD107a+b (FITC) over 5 h. The control was PBL-mock
cells cocultured with RCC-26 cells. After 5 h of incubation, cells were stained with 7-
AAD, anti-IFN-PE-Cy7, anti-TNF--A700 and anti-IL-2-APC and with anti-CD45-
Amcyan, anti-CD8-PB and anti-CD4-APC-A750 antibodies to discriminate the T cell
subsets. Shown in Figure 3.37 is 1 representative example of 3 showing cytokines
and degranulation performed by PBL electroporated with TCR26 gated on CD45+
and CD8+ (a) or CD4+ (b) T cells. Shown in the first row of Figure 3.37a and b are
PBL-TCR26 cells cocultured with RCC-26 cells and in the second row are the PBL-
mock cells cocultured with RCC-26 cells. Evident is that the CD8+ T cells of PBL-
TCR26 degranulated more (~ 24 %) than the CD4+ T cells (~ 7.5 %) while the CD4+
T cells secreted more TNF- and IL-2 ( ~ 61 % and 11 %, respectively) than the
CD8+ T cells ( 25 % and 7 % respectively). Thus, both CD8+ and CD4+ T cells
CD8+ T cells
βLSG
CD4+ T cells
PBL-mock
PBL-TCR26
Vβ22
% o
f m
ax
20 % 32 %

___________________________________________________________________ Results
75
subsets, transfected with TCR26, recognized the RCC-26 cells. CD4+ and CD8+ T
cells of PBL-mock exhibited only a slight response to RCC-26 cells.
Figure 3.37. Functional performance of CD8+ and CD4
+ T cells electroporated with IVT-mRNA of
TCR26 and chains.
CD107
IFN
-
TN
F-
IL-2
(b) CD4+
T cells
(a) CD8+
T cells
PBL-TCR26
PBL-TCR26
PBL-mock
PBL-mock

Results
76
Activated PBLs were electroporated with the IVT-mRNA of TCR26 and chains or without IVT-mRNA (PBL-mock) and cocultured with RCC-26 cells for 5 h, then stained with 7-AAD to distinguish dead from viable cells, with anti-CD45 antibody to distinguish T cells from tumor cells and with anti-
CD8 and anti-CD4 antibodies to discern the T cell subsets. IFN-, IFN- and IL-2 were detected by intracellular staining and CD107 was detected by membrane staining during the incubation time. In (a) cell suspension was gated on CD45
+CD8
+ T cells and in (b), cell suspension was gated on
CD45+CD4
+ T cells.
To investigate how the TCR26 expressing CD4+ T cells (CD4+-TCR26) differ in their
functional profile from the TCR26 expressing CD8+ T cells (CD8+-TCR26),
degranulation and secretion of IFN-, TNF- and IL-2 upon RCC-26 recognition were
analyzed in the gated CD4+ or CD8+ population (Figure 3.37). CD4+-TCR26 T cells
exhibited a different profile than CD8+-TCR26 T cells under the same conditions of
cultivation and stimulation (Figure 3.38). Significant differences included lower
degranulation capacity (CD107, p=0.04), and higher TNF- secretion (p=0.04) per
cell (MFI) by CD4+-TCR26 T cells in comparison to CD8+-TCR26 T cells. A tendency
could be observed of CD4+-TCR26 secreting more IL-2 than the CD8+-TCR26 T
cells. IFN- secretion was similar for both T cells subsets. The data set shown is the
mean of 3 independent experiments.
Figure 3.38. Functional profile of CD8+-TCR26 and CD4
+-TCR26 cells.
PBLs electroporated with IVT-mRNA of TCR26 and chains were incubated with RCC-26. The functional analysis was performed as described in the Figure 3.37 legend. Shown is the MFI of
CD107, IFN-, TNF- and IL-2 positive T cells gated on CD45+CD8
+ or CD45
+CD4
+. Data shown
represents the mean of 3 independent experiments. Error bars are the standard deviation. Statistics
CD8
CD4
CD107 IFN- TNF- IL-2
MF
I
[CD
45
+C
D8
+o
r+C
D4
+] CD8
CD4
0
3
4
2
1
0
3
4
2
1
0
9
12
6
3
*
*
P=0.04
p=0.04
CD8
CD4
CD45+CD8
+ CD45
+CD4
+
[x102] [x10
3] [x10
3]
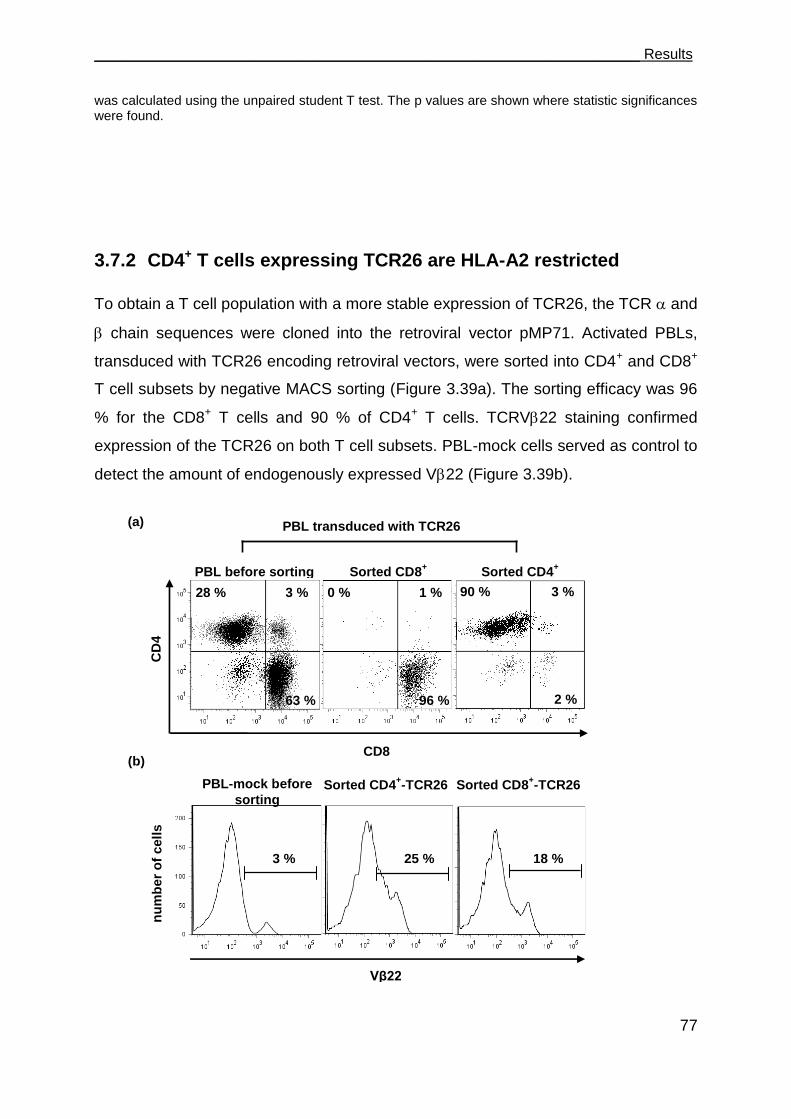
___________________________________________________________________ Results
77
was calculated using the unpaired student T test. The p values are shown where statistic significances were found.
3.7.2 CD4+ T cells expressing TCR26 are HLA-A2 restricted
To obtain a T cell population with a more stable expression of TCR26, the TCR and
chain sequences were cloned into the retroviral vector pMP71. Activated PBLs,
transduced with TCR26 encoding retroviral vectors, were sorted into CD4+ and CD8+
T cell subsets by negative MACS sorting (Figure 3.39a). The sorting efficacy was 96
% for the CD8+ T cells and 90 % of CD4+ T cells. TCRV22 staining confirmed
expression of the TCR26 on both T cell subsets. PBL-mock cells served as control to
detect the amount of endogenously expressed V22 (Figure 3.39b).
CD8
PBL before sorting Sorted CD8+ Sorted CD4
+
96 %
0 % 1 %
2 %
90 % 3 %
63 %
28 % 3 %
CD
4
PBL-mock before
sorting Sorted CD4
+-TCR26 Sorted CD8
+-TCR26
Vβ22
3 % 25 % 18 %
nu
mb
er
of
cell
s
(a)
(b)
PBL transduced with TCR26
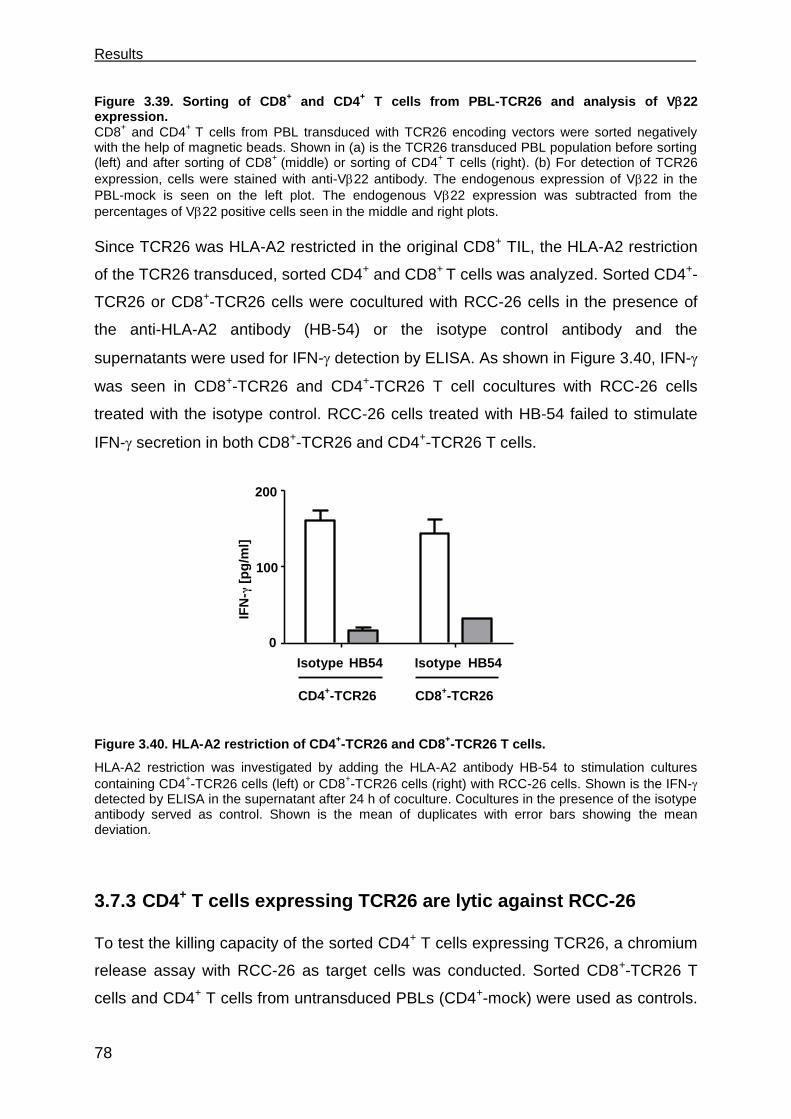
Results
78
Figure 3.39. Sorting of CD8+ and CD4
+ T cells from PBL-TCR26 and analysis of V22
expression. CD8
+ and CD4
+ T cells from PBL transduced with TCR26 encoding vectors were sorted negatively
with the help of magnetic beads. Shown in (a) is the TCR26 transduced PBL population before sorting (left) and after sorting of CD8
+ (middle) or sorting of CD4
+ T cells (right). (b) For detection of TCR26
expression, cells were stained with anti-V22 antibody. The endogenous expression of V22 in the
PBL-mock is seen on the left plot. The endogenous V22 expression was subtracted from the
percentages of V22 positive cells seen in the middle and right plots.
Since TCR26 was HLA-A2 restricted in the original CD8+ TIL, the HLA-A2 restriction
of the TCR26 transduced, sorted CD4+ and CD8+ T cells was analyzed. Sorted CD4+-
TCR26 or CD8+-TCR26 cells were cocultured with RCC-26 cells in the presence of
the anti-HLA-A2 antibody (HB-54) or the isotype control antibody and the
supernatants were used for IFN- detection by ELISA. As shown in Figure 3.40, IFN-
was seen in CD8+-TCR26 and CD4+-TCR26 T cell cocultures with RCC-26 cells
treated with the isotype control. RCC-26 cells treated with HB-54 failed to stimulate
IFN- secretion in both CD8+-TCR26 and CD4+-TCR26 T cells.
Figure 3.40. HLA-A2 restriction of CD4+-TCR26 and CD8
+-TCR26 T cells.
HLA-A2 restriction was investigated by adding the HLA-A2 antibody HB-54 to stimulation cultures
containing CD4+-TCR26 cells (left) or CD8
+-TCR26 cells (right) with RCC-26 cells. Shown is the IFN-
detected by ELISA in the supernatant after 24 h of coculture. Cocultures in the presence of the isotype antibody served as control. Shown is the mean of duplicates with error bars showing the mean deviation.
3.7.3 CD4+ T cells expressing TCR26 are lytic against RCC-26
To test the killing capacity of the sorted CD4+ T cells expressing TCR26, a chromium
release assay with RCC-26 as target cells was conducted. Sorted CD8+-TCR26 T
cells and CD4+ T cells from untransduced PBLs (CD4+-mock) were used as controls.
0
100
200Isotype
HB-54
IFN [
pg
/mL
]
Isotype HB54 Isotype HB54
CD4+-TCR26 CD8
+-TCR26
IFN
-γ [
pg
/ml]
0
100
200

___________________________________________________________________ Results
79
Both T cell populations could kill RCC-26, as shown in Figure 3.41. The lytic activity
of CD8+ T cells was about 1.5 fold higher than that of CD4+ T cells. Absence of lytic
activity with CD4+-mock T cells showed that the killing seen in the CD4+-TCR26 was
linked to the TCR26 expression.
Figure 3.41. Specific lysis of RCC-26 mediated by the sorted CD8+-TCR26 and CD4
+-TCR26 T
cells. The capacity of CD8
+-TCR26 and CD4
+-TCR26 T cells to kill RCC-26 cells was investigated in a
chromium release assay. CD8+-TCR26, CD4
+-TCR26 and CD4
+-mock T cells were incubated
individually with chromium labeled RCC-26 cells at the indicated effector:target ratios. Error bars show the mean deviation.
3.7.4 CD4+ T cells facilitate CD8+ T cell recruitment into spheroids
In a recent report [57], the capacity of CD4+ T helper cells to mobilize cytotoxic T
cells to infected tissue was demonstrated in a mouse model. To explore whether
CD4+-TCR26 T cells would enhance the number of CD8+ T cells that migrate into
spheroids, RCC-26 spheroids were first exposed to sorted CD4+-TCR26 or CD4+-
mock T cells or to medium without T cells in hanging drops. After 2 h, spheroids were
washed to get rid of non-integrated CD4+ T cells and transferred to wells of an agar-
coated 96-well plate and then sorted CD8+-TCR26 T cells were added. The CD8+-
TCR26 T cells were previously labeled with CFSE to allow discrimination from the
CD4+ T cells. After 4 h, spheroids were washed to remove T cells that did not
infiltrate, mechanically disrupted and incubated with accutase to completely free T
cells from the solid spheroid. The cell suspension was stained with anti-CD45-PE-
Cy7 and anti-CD4-APC-A750 antibodies. For flow cytometry, an equal amount of
40 20 10 50
10
20
30
CD4 LSG
CD4 Mock
CD8 LSG alone
CD4+-mock
CD8+-TCR26
40 20 10 50
10
20
30
CD4 LSG
CD4 Mock
CD8 LSG alone
E:T ratio
CD4+-TCR26
% s
pecif
ic ly
sis
0
10
20
30
40 20 10 5
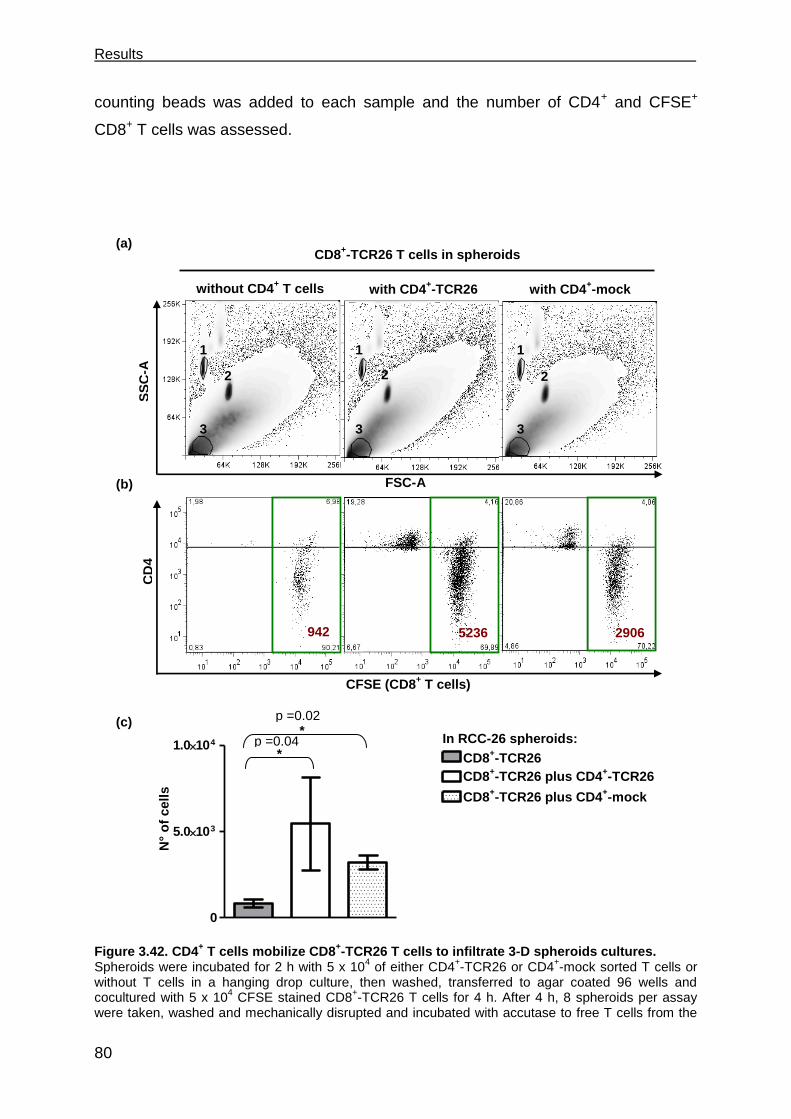
Results
80
counting beads was added to each sample and the number of CD4+ and CFSE+
CD8+ T cells was assessed.
Figure 3.42. CD4
+ T cells mobilize CD8
+-TCR26 T cells to infiltrate 3-D spheroids cultures.
Spheroids were incubated for 2 h with 5 x 10⁴ of either CD4
+-TCR26 or CD4
+-mock sorted T cells or
without T cells in a hanging drop culture, then washed, transferred to agar coated 96 wells and cocultured with 5 x 10
4 CFSE stained CD8
+-TCR26 T cells for 4 h. After 4 h, 8 spheroids per assay
were taken, washed and mechanically disrupted and incubated with accutase to free T cells from the
without CD4+ T cells with CD4
+-TCR26 with CD4
+-mock
5236 2906 942
CFSE (CD8+ T cells)
FSC-A
0
5.0103
1.0104
CD8-TCR53
CD8-TCR53+CD4-TCR26
CD8-TCR53+CD4-mock
0
5.0103
1.0104
CD8-TCR53
CD8-TCR53+CD4-TCR26
CD8-TCR53+CD4-mock
*
*
N°
of
cell
s
SS
C-A
C
D4
(a)
(c)
CD8+-TCR26
CD8+-TCR26 plus CD4
+-TCR26
CD8+-TCR26 plus CD4
+-mock
1 1 1
3 3 3
CD8+-TCR26 T cells in spheroids
(b)
p =0.02
p =0.04 In RCC-26 spheroids:
2 2 2
___________________________________________________________________ Results
81
solid spheroids. The cell suspension was stained with anti-CD45 and anti-CD4 antibodies and an equal amount of counting beads was added to each sample before flow cytometry, which allowed the calculation of absolute cell number of CD8
+-TCR26 T cells that infiltrated the spheroids. Shown in (a)
are FSC versus SSC scatter plots of one representative example of 3 independent experiments. The beads are indicated by the number 1 and 2, number 3 indicates the T cells. Plots in (b) depict the events of the gated lymphocytes after gating in CD45
+ cells. The numbers in red are the absolute
numbers of CD8+-TCR26 T (CFSE
+, green boxes). The graph in (c) shows the mean of the absolute
number of CD8+-TCR26 T cells assessed in 3 independent experiments. Statistics used was the
unpaired student T test; p values are shown where statistical significance was found.
Shown in Figure 3.42a is an FSC x SSC scatter plot of 1 representative example of
CD8 T cells cocultures with RCC-26 spheroids containing CD4+ T cells or without
CD4+ T cells. Figure 3.42b shows the CD8+ and CD4+ T cells in the different
incubation combinations. Spheroids that were pre-treated with CD4+ T cells
contained about 20 % of CD4+ T cells. In the example shown, the number of CD8+-
TCR26 T cells in spheroids without CD4+ T cells was 942 and it increased to 5236 or
2906 if spheroids contained CD4+-TCR26 or CD4+-mock T cells, respectively. Figure
3.42c shows the mean of 3 experiments and the statistics. The CD8+-TCR26 T cell
numbers in spheroids without CD4+ T cells was much lower than that of spheroids
with CD4+ T cells. These differences were found to be statistically significant.
3.7.5 CD4+ T cells support the functional response of CD8+ T cells
CD8+ T cells exposed to the spheroid milieu developed functional deficits. To analyze
whether CD4+ T cells engineered to express TCR26 impact positively on the
functional capacity of the CD8+ T cells, RCC-26 spheroids were pre-treated for 2 h
with either CD4+-TCR26 or with CD4+-mock sorted T cells or without T cells. After 2
h, non-infiltrated CD4+ T cells were washed away, the spheroids were transferred to
agar-coated 96-well plates and sorted CD8+-TCR26 T cells were added. After 4 h,
spheroids were washed and mechanically disrupted to free T cells from the solid
mass and the suspension was incubated with the intracellular transport blockers,
monensin and BFA, for additional 4 h. The cell suspension was then stained with
anti-CD45-Amcyan and anti-CD4-APC-A750, with antibodies to cytokines (IFN-,
TNF- and IL-2) and to CD107. Cells were gated on viable CD45+CD8+ (a) or on
CD45+CD4+ (b) (Figure 3.43). Shown in (a) are the functional responses of the CD8+-
TCR26 T cells, in (b) that of the CD4+-TCR26 T cells. The first row in (a) depicts the
condition where spheroids were cultivated only with sorted CD8+-TCR26 T cells, in
the second row are spheroids containing sorted CD4+-TCR26 and CD8+-TCR26 T

Results
82
cells and in the third row are spheroids with sorted CD4+-mock and CD8+-TCR26 T
cells.
Figure 3.43. Functional response of CD8+-TCR26 and CD4
+-TCR26 T cells in 3-D RCC-26
spheroid cultures.
CD8+-TCR26 T cells (5 x 10
4) were cocultured for 4 h with RCC-26 spheroids that were either
untreated (first row), treated with 5 x 10⁴ CD4
+TCR26 (second row in (a) and first row in (b)) or with 5 x
104 CD4
+-mock T cells (third row in (a) and second row in (b)). After non-infiltrated T cells were
(a) CD8+
T cell response
with CD4+-TCR26
Spheroids with
CD8-TCR26 and:
with CD4+-mock
with CD4+-TCR26
CD107
IFN
-
TN
F-
IL-2
with CD4+-mock
(b) CD4+ T cell response
w/o CD4+ T cells
___________________________________________________________________ Results
83
washed away, spheroids were mechanically disrupted and monensin, BFA and CD107a+b antibodies were added to the cell suspensions. After 4 h, the cell suspensions were stained with anti-CD45, anti-
CD4, anti-IFN-, anti-TNF- and anti-IL-2 antibodies and examined by flow cytometry. Shown in (a) are cells gated on CD45
+CD8
+ and in (b) are cells gated on CD45
+CD4
+. Numbers in black show
percentage of positive cells in the respective quadrant.
As shown in Figure 3.43a, the percentages of CD8+-TCR26 T cells that produced
IFN-, TNF- and CD107 was higher when spheroids were pre-incubated with sorted
CD4+-TCR26 T cells (~ 24 %, 17.5 % and 23.5 %, respectively) than without CD4+ T
cells (~ 9 %, 5.5 % and 16 %, respectively). This enhancement required the CD4+ T
cells to express TCR26, as no enhancement was seen when spheroids contained
CD4+-mock T cells (~ 10.6 %, 7.5 % and 16.5 %, respectively). No differences were
found in the amount of CD8+-TCR26 T cells secreting IL-2.
To characterize the CD4+ T cells that were in the spheroid, the stained cell
suspension was gated on the CD4+ population (Figure 3.43b). CD4+-TCR26 T cells
were found to secrete IFN- (~ 10.5 %) and TNF- (~ 10 %). Very few CD4+-TCR26
cells (but more than CD8+-TCR26 T cells) secreted IL-2 (~ 5 %). Approximately 10 %
of CD4+-TCR26 T cells degranulated. Some unspecific response (less than for each
function 3.5 %) was seen in the CD4-mock T cell population.
Discussion
84
4 Discussion RCC is a cancer type for which standard treatments do not result in a significant
benefit for the patients. Tyrosine kinase inhibitors are new treatments that, for the
first time, resulted in extended life expectancy. However, no cure is observed and
resistance eventually develops [62]. Immunotherapy has a long history and although
the objective responses are low, in some rare cases, durable complete remissions in
metastatic RCC patients treated with IL-2 are observed, suggesting an advantage of
immunotherapy over the other treatments in this cancer type. A better understanding
of the immune mechanisms involved in the positive responses observed in RCC
patients treated with IL-2 is necessary before immunotherapy is to become a widely
applicable beneficial therapy for RCC.
Immunotherapy using antigen-specific T cells is a promising approach because of the
intrinsic ability of the T cells to recognize specific antigens, giving the possibility of
selectively targeting tumor cells. Because of the immune sensitive properties of RCC,
adoptive T cell therapies using LAK cells and TILs were started in the early 1980s.
However, due to the difficulty of selecting and transferring T cells specific for the
tumors, the response rate was low [78]. In the subsequent years, advances in
proteomics and molecular biology allowed the identification of many tumor TAAs,
especially in melanoma. Later the advent of the tetramer staining allowed the
detection of antigen specific T cells, which moved the field forward. For melanoma,
adoptive T cell therapy with pre-selected TAA-reactive TIL resulted in success rates
higher than 50 %, demonstrating the power of this therapy [33] [36]. However, for
RCC this approach is hampered by the difficult task of finding TAA and
corresponding T cells that meet the criteria for clinical application. These criteria are:
i) a useful antigen must be processed and presented in an amount sufficient to
trigger a T cell response; ii) it should not be expressed in healthy tissues and iii) it
should be shared among tumors of many patients to allow its application to a wider
patient group. The lack of T cells recognizing RCC antigens that meet these criteria
poses a challenge to the application of T cell therapy for RCC.
In our group, aspects of the immune response toward RCC are investigated, such as
the possibility to use redirected RCC-specific T cells to boost the anti-tumor immune
response [75] [83]. For that, we seek the identification of TILs that display RCC
recognition in a pattern that meets the criteria of a good antigen. The initial
________________________________________________________________ Discussion
85
characterization of TIL-53, isolated in our group in 1993, pointed to a HLA-A2
restricted, shared recognition of RCC tumors without recognition of normal kidney
cells. Thus TIL-53 seemed to have the right features for clinical application. Due to
the impossibility of expansion of TIL-53, to preserve TIL-53 specificity, the TIL-53
TCR chains were identified, sequenced and inserted into cloning vectors. The recent
developments in the field of genetic engineering [38] now allow TCRs to be efficiently
transferred to T cells. Using these new technologies, the TCR of TIL-53 was now
further explored.
High incidence of TCR53-pMHC ligand in RCC cells and in tumor cells of other histologies The limited growth capacity of the parental TIL-53 and the derivative T cell clone,
TIL-53.29, was overcome through TCR cloning and transfer into recipient
lymphocytes. Thereby, unlimited numbers of T cells became available to perform
functional testing and address the question how widely the antigen of TIL-53 is
shared among different tumors and non-tumor cell lines. To perform the task of
screening a large panel of cell lines, the indicator cell line B3Z-TCR53m was
developed [83]. It stably expresses TCR53 and is easily cultivated. Because B3Z-
TCR53m cells do not recquire a specific cycle of restimulation, they can be used at
any time of cultivation and whenever tumor cells or primary material becomes
available. Using B3Z-TCR53m cells, over 119 different cell types including tumor and
normal cell lines and primary cell cultures from different histologies were tested for
the presence of the antigen recognized by TCR53. The results of the screen firmly
established the shared expression of the TCR53-pMHC ligand among RCC cells,
with 65 % of the HLA-A2+ RCC cells being recognized by B3Z-TCR53m. Tumor lines
of other histologies were rarely recognized, except for those of the B lymphoid
lineage like malignant B cell lines and B-LCL. There was no evidence of recognition
of sarcoma cell lines. At present, the molecular nature of the TCR53-stimulatory
antigen is not known. It can be assumed that its expression is not intrinsically linked
to the clear cell RCC (ccRCC) histology, which is the most common type of RCC and
considered to be the immunogenic one [69], as not all ccRCCs were recognized. The
TCR53 antigen does not seem to belong to the group of TAA called differentiation
antigens, such as MART-1, gp100 and tyrosinase [69], because then it should be
Discussion
86
expressed at low levels by normal cells. A second group of antigens called
cancer/testis antigens are generally shared among a variety of human tumors of
different histologies including melanoma, breast, RCC and prostate cancers [37]
[106]. Because TCR53 reactivity was rarely found in tumor types other than RCC, the
TCR53 antigen is likely not a cancer/testis antigen. The oncofetal antigen 5T4 is
described to be expressed by most RCC cell lines with no or only limited expression
in normal tissues, but it is also expressed in many other carcinomas [107-108]. This
pattern of expression does not correspond to the pattern of recognition of TCR53-
expressing cells. Furthermore, the cell line HT-29 which expresses 5T4 [109] was not
recognized by B3Z-TCR53m cells. Thus it is not likely that 5T4 is the antigen
recognized by TCR53.
Antigens that contain mutations, like the mutated tumor suppressor p53, can be
found in many carcinomas [110]. More than 60 % of RCC tumors have somatic
mutations in the von Hippel-Lindau (VHL) gene, which have been linked to the
development of sporadic ccRCC [111]. Because mutations are generally different
between different tumors, the shared recognition pattern of TCR53 is inconsistent
with a potential recognition of a mutated VHL protein form.
Because of the high incidence of recognition of B-lymphocytic tumors transformed by
EBV, we considered that the antigen recognized by TCR53 could be associated with
the EBV transformation. However, because the B-lymphocytic tumor cell line Nalm-6,
which is EBV negative [112] and was recognized by B3Z-TCR53m cells, and
because some B-lymphocytic cell lines with EBV (LCL-2 and LCL-3) were not
recognized, it is unlikely that the TCR53 antigen is associated with the presence of
EBV.
Recently HERV-E, a retroviral derived antigen was found to be expressed in many
RCC cell lines but not in normal kidney cells [74] [113] [114]. Using RT-PCR for the
HERV-E sequence [74] the pattern of expression of HERV-E among cell lines with or
without th TCR53-pMHC ligand was not consistent with that of recognition by B3Z-
TCR53m cells (data not shown).
The identification of the TCR53-pMHC ligand is underway and, if identified, it will
allow, in addition to the adoptive transfer of T cells expressing TCR53, the use of
corresponding peptides for vaccination.
________________________________________________________________ Discussion
87
Human T cells expressing TCR53 meet important requirements for T cell therapy In addition to determining the frequency of the TCR53 ligand, it is of importance to
define that the TCR is functional and specific in human T cells, i.e. PBLs of patients,
which will be the therapeutic T cell population applied in adoptive therapy. The
formation of TCR hybrids of the transfected TCR with the endogenous TCR chains is
a concern because it may create unknown TCR specificities that could recognize
epitopes on normal tissue leading to autoimmunity [38] [48]. In this work the
formation of hybrid TCRs, coming from the cross-pairing of the introduced codon
optimized human-murine hybrid TCR53 chain with endogenous TCR chains was
investigated and was found to be minimal.
PBLs retrovirally transduced with the retroviral vector containing the optimized
TCR53mc showed specific killing of RCC cell lines and some tumors of other
histologies that depended on the expression of the MHC class I molecule HLA-A2.
Importantly, normal primary kidney cultures were not killed.
In addition to tumor specific cell lysis, TCR53mc-expressing T cells also secreted the
cytokines IFN-, TNF-, IL-2 which in turn can activate other accessory components
of the immune system. T cells expressing TCR53mc could simultaneously exert
multiple effector functions upon target recognition. This polyfunctionality is
considered to be important for clinical efficacy [85].
Another important feature of a TCR is its functional avidity. T cell functional avidity is
defined as the sensitivity of a T cell to become activated by an antigenic peptide
bound by an MHC molecule. The sensitivity of a T cell to antigen is influenced by
multiple factors: the affinity of the TCR-peptide MHC interaction, the engagement of
multiple other receptors on T cells, and the density of these receptors on the T cell
surface. The combination of these binding interactions with an APC determines the
functional avidity of a T cell [116]. T cell functional avidity is frequently determined by
the relative capacity of T cells to produce effector cytokines or to lyse target cells in
an antigen-specific manner. It was found that the polyfunctional profile of TCR53mc-
expressing T cells was very similar to that of TCR-D115 expressing T cells, which
have a known intermediate avidity [86]. When compared to T cells expressing TCR-
T58, of known high avidity, T cells expressing TCR53mc showed much lower
degranulation capacity, thus it seems that the functional avidity of TCR53mc-
Discussion
88
expressing T cells is intermediate. High avidity T cells are thought to be superior in
tumor recognition and rejection than low avidity T cells [86] [85] [117]. However, a
recent report on high avidity CD8+ T cell clonotypes generated during early HIV
infection showed that these high avidity T cells were lost in the chronic infection due
to activation induced cell death, while CD8+ T cell clonotypes with intermediate or
lower TCR avidity persisted [118]. It is possible that TCR53mc-expressing T cells
would persist after repeated activation, however this remains to be tested.
Several groups identified high avidity TCRs specific for a peptide of Her-2/neu that
recognized peptide loaded targets but not tumors, rendering them clinically irrelevant
[119] [120]. The TCR53 was identified in a TIL, and thus, the TCR53-pMHC ligand is
naturally processed and presented. Further, the functionality of TCR53 expressing
cells was tested against targets with endogenous pMHC presentation and not with
cells loaded with peptides.
For clinical application, the T cells to be engineered with TCR53 will be patient PBLs.
It has been described that tumor growth can influence the phenotype and functional
capacity of peripheral immune cells. CD3 chain down regulation in PBLs of head
and neck and non-small lung carcinoma, melanoma and sarcoma cancer patients is
associated with the poor ability of these cells to proliferate in response to anti-CD3
antibody [88] [89] [121] [122]. From these reports, it can be reasoned that PBLs from
patients may prove difficult to be retrovirally transduced as such procedure requires
cell division for the entry of the viral integration complex into the nucleus. In this work,
no defects in the proliferation of PBLs of RCC patients was detected as, in response
to anti-CD3 stimulation, they proliferated as good as PBLs of a healthy donor. PBLs
of RCC patients were successfully transduced with pMP71-TCR53mc, with levels of
expression comparable to that achieved for a healthy donor PBLs. Also cytolytic
activity as well as cytokine secretion was comparable between PBLs of RCC patients
and a healthy after transduction with pMP71-TCR53mc. Functionality of PBLs-
expressing TCR53mc were kept and even enhanced after long-term culture after
activation and transduction. Because PBLs of RCC patients can be successfully
transduced and expanded in vitro, generating high numbers of functional T cells with
the specificity redirected toward tumors, it is conceivable that these cells can be
applied for the treatment of cancer patients.

________________________________________________________________ Discussion
89
Other relevant aspects to be considered for the application of T cells in therapy
concern the culture conditions that would be best to achieve maximal T cell
expansion with maintenance of the effector function.
CD28 on the surface of T cells enhances the magnitude of TCR signaling, thereby
decreasing the level of TCR ligation required for activation [123]. The signaling
cascade initiated by cross linking CD28 supports cell survival and the maintenance of
effector function [95] [96]. CD28 is lost on CD8 T cells with repeated TCR stimulation
and culturing with IL-2. Alternative culturing methods have been proposed [94]. In
this work, a comparison between IL-15 and IL-2 was undertaken.
IL-15 and IL-2 possess similar properties. Both cytokines bind to and signal through a
common, intermediate affinity receptor complex composed of (CD122) and c
receptor (CD132) subunits. Each cytokine, however, interacts with a unique, ligand-
specific chain receptor [13]. Despite similarities, it is clear that IL-2 and IL-15 can
play very different, and at times oppositional, roles in T cell biology [13]. Despite its
use and clinical success, IL-2 may not be the optimal T cell growth activation factor
for use in immunotherapy as it can promote activation-induced cell death of T cells
and inhibit memory CD8 T cell proliferation and survival. In contrast, signaling
through the IL-15R complex contributes to the maintenance of memory CD8+ T cells
[13] [94]. In this work, contrary to the expectation, no advantage of T cells cultured in
IL-15 medium was observed, not in expansion nor in the functional capacity. In fact,
IL-15 cultivated TCR53mc-expressing T cells showed slightly less percentages of
polyfunctional cells than IL-2 cultivated T cells. The CD28 expression in CD8+ T cells
cultured with IL-15 was lower than in T cells cultured with IL-2. This observation is in
line with results by Godlove and colleagues [102] who showed that IL-15 is capable
of inducing stable loss of CD28 expression in actively dividing CD28+CD8+ memory T
cells. Thus, growing CD8+ T cells with IL-15 may not only maintain CD28-CD8+ T
cells but may also generate CD28-CD8+ memory T cells from their CD28+
counterparts. More experiments should be done to clarify how IL-15 causes CD28
loss in CD8+ T cells and the use of IL-15 for the in vitro expansion of CD8+ T cells for
the purpose of T cell therapy should probably be rethought. In contrast to the results
observed for CD8+ T cells, CD4+ T cells of some donors exhibited a small
improvement in the expression of CD28 after cultivation with IL-15. This observation
is unique and more experiments should be done to confirm it.
Discussion
90
IFN- treatment may be beneficially combined with adoptive therapy of TCR53-expressing T cells
Treatment of RCC patients with IFN- or IL-2 gives an overall response of 12 % and
is one of the current treatments for metastatic RCC [62]. IFNs are known to exert
their anti-tumor effects directly through anti-proliferative activation and indirectly
through immunomodulation leading to a better stimulation of effector T cells. In this
work it was found that although both IFN- and IFN- induced similar up regulation of
HLA-A2 on target cells, only the IFN- treatment enhanced the recognition of tumor
cells by B3Z-TCR53m cells. The better response of B3Z-TCR53m cells against RCC
cells treated with IFN- is probably due to an up regulation of the TCR53 antigen.
Importantly, de novo induction of the TCR53-pMHC ligand on HLA-A2-expressing
cells that were previously not recognized by B3Z-TCR53m cells did not occur.
Greiner et al. [124] reported that IFNs could enhance the expression of various TAAs
in human breast and colon carcinoma and Brouwers and colleagues showed up
regulation of G250, a tumor associated antigen present in many RCC cell lines in the
presence of IFN- or IFN- [125]. The stronger recognition of IFN--treated RCC
cells by B3Z-TCR53m cells suggests that adoptive T cell therapy with TCR53-
expressing T cells could be successfully combined with IFN- therapy, improving the
clinical outcome.
Because the TCR53-pMHC ligand is not 100 % prevalent on RCC cell lines, not all
RCC patients would benefit from a therapy using T cells expressing TCR53. Besides
RCC cell lines, it was shown here that some tumors of other histologies also express
the ligand for TCR53. Therefore, it would be desirable to have means of selecting
patients to include only those with TCR53-pMHC ligand positive tumors, who would
most probably benefit from the treatment with TCR53-expressing T cells. By testing
B3Z-TCR53m cells against fresh kidney tumor or normal tissue, it could be shown
here that B3Z-TCR53m cells recognized the fresh tumor tissue. Therefore, B3Z-
TCR53m cells seem to be suitable to screen patients biopsies.
________________________________________________________________ Discussion
91
The 3-D spheroid model mimics tumor induced deficits in T cells and can be
used to develop strategies to prevent their development
The tumor milieu has gained attention recently as functional deficits in TILs from
human and mouse tumors are being reported [121]. As seen in this work, CD8+ T
cells in RCC tumor sections were perforin positive when located inside the lumen of
the blood vessels. However, CD8+ T cells located outside the vessel within the tumor
parenchyma were perforin negative to a large percentage. Thus, CD8+ T cells appear
to arrive in the tumor being positive for perforin and lose it when entering the tumor
parenchyma. However, it is not possible to determine how long the CD8+ T cells have
been in the tumor before losing perforin. Therefore we developed an in vitro system
using 3-D spheroids to better address questions related to the functional capacity
and the phenotype of T cells over time of exposure to a milieu that resembles that of
the tumor.
Spheroids mimic avascular sites of a tumor or of micrometastasis with respect to
growth kinetics, presence of an extracellular matrix, nutrient gradients, oxygen
tension, and pH [87]. Because of the diminished oxygenation, 3-D spheroid cultures,
like RCC tumors, are resistant to radiation and chemotherapeutic drugs [126]. RCC-
26 spheroids with a diameter of approximately 720 µm were strongly infiltrated by
TCR53mc expressing T cells with most T cells located within the peripheral rim of
about 100 µm in depth. After that perimeter T cell numbers strongly declined. 100 µm
is the estimated diffusion limit for oxygen [127]. Measuring oxygen concentration as
the partial pressure of oxygen (pO2), Sutherland at al. found that the center of
spheroids with diameters between 600 µm and 1000 µm were severely hypoxic
whereas the periphery (100 µm in depth) was mostly normoxic with pO2 values of
approximately 30 mm Hg [126]. This might be the reason why the T cells-expressing
TCR53mc were mostly seen in the periphery of the spheroids.
For the rejection of solid tumors, T cells must efficiently function in a 3-D tumor
environment. T cell cytotoxicity is commonly investigated with tumor cells grown as 2-
D monolayers, which only partially mimic the tumor microenvironment. T cells-
expressing TCR53mc could kill target cells growing as spheroids in a 4 h assay. This
result was comparable to the killing of targets grown as monolayer cultures. Thus,
after 4 h of exposure to spheroids, T cells were still functional and exerted lytic

Discussion
92
activity and cytokine secretion. However, after 24 h of exposure, T cells were no
longer functional. PBL-TCR53mc after 24 h of exposure to spheroids exhibited
increased cell death and T cells that were still alive showed loss of perforin and
granzyme B, independent of the presence of pMHC ligand on the tumor cells. CD28
expression was also lost in cultures with RCC-26 spheroids already after 4 h of
incubation. It can thus be assumed that TIL cannot survive in the tumor environment
for much longer than 24 h and if they still survive, they are probably impaired in
function. These results document a temporal relationship between the functional
capacity and survival upon exposure to a 3-D environment.
Hypoxia leads to the shift of cell metabolism towards glycolysis and production of
lactic acid. Upon exposure to low pH combined with lactic acid, CTL showed
impaired functionality with reduction of cytokine secretion [128]. The functional
defects seen in the T cells after 24 h of exposure to spheroids and loss of perforin
seen in CD8+ T cells in the tumor parenchyma, may, in part, be explained by the
combination of low pH and the presence of lactic acid observed in spheroids and
tumors. Preliminary results in our group indicate that lactic acid can lead to perforin
loss. These observations could motivate the study of possibilities to render T cells
more resistant to such environments.
Using the spheroid model it was possible to mimic the tumor milieu in vitro. This
model can be further explored to test strategies to prevent or to revert the
development of impairments observed in the T cells. In this work, one strategy was
explored asking whether CD4+ T cells could help the CD8+ T cells to better function
in the 3-D environment. It was found that recruitment of CD8+ T cells into spheroids
was strongly improved if CD4+ T cells were present. A recent report also found that
CD4+ T cells help the mobilization of CTLs toward inflammation sites in a mouse
model of infection. The mobilization of CTLs, in their case, was dependent on
secretion of IFN- by the CD4+ T cells [57]. Because in the spheroid model, the CD4+
mock T cells that do not recognize an antigen on the tumors cells also increased the
recruitment of CTL, it is possible that IFN- is not the only molecule involved in the
mobilization of the CTL. This observation needs more experiments like the
assessment of chemokine levels in the presence or absence of CD4+ T cells to clarify
how CD4+ T cells could influence the migration of CTL. CD8+ T cells showed
increased degranulation and secretion of cytokines if CD4+ T cells recognizing pMHC

________________________________________________________________ Discussion
93
ligand but not if CD4+ T cells mock were present in the spheroid, indicating that the
improvement of the CTL function depended on the activation of the CD4+ T cells. In
line with that, Schafer-Weaver et al. showed that sustained provision of activated
tumor-specific CD4+ T cells prevented CTL tolerization leading to the control of tumor
growth [84].
Altogether, it was observed here that T cells suffer impairments upon long exposure
to the spheroid milieu and similar impairments were seen in the T cells within the
RCC tumor tissue. The provision of CD4+ helper T cells could induce the recruitment
of CTL and supported their function. Thus, efforts to the development of T cell
therapy for RCC and other solid tumors should focus on infusing both tumor specific
CD8+ and CD4+ T cells. Because T cells are no longer functional after 24 h in the
suppressive tumor milieu, adoptive T cell therapy should probably consider the
administration of T cells repeatedly in short intervals to increase the presence of
functional T cells at the tumor site, thereby boosting the response to the tumor.
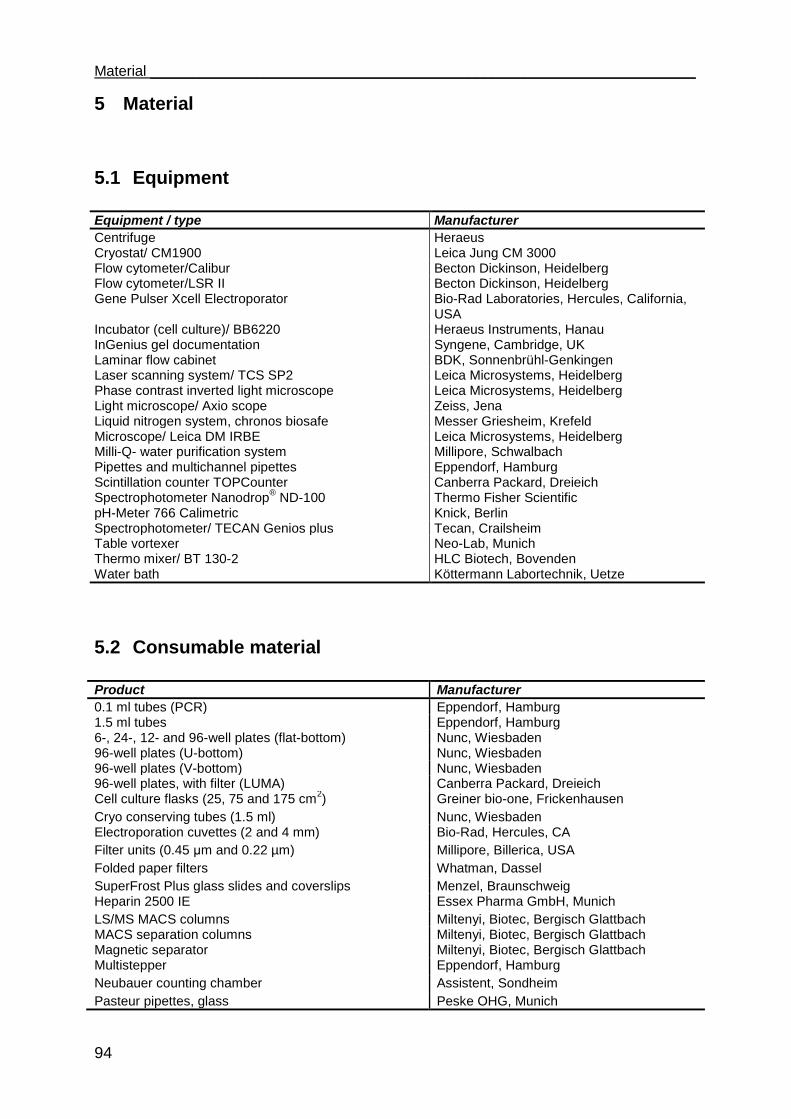
Material ___________________________________________________________________
94
5 Material
5.1 Equipment
Equipment / type Manufacturer
Centrifuge Heraeus Cryostat/ CM1900 Leica Jung CM 3000 Flow cytometer/Calibur Becton Dickinson, Heidelberg Flow cytometer/LSR II Becton Dickinson, Heidelberg Gene Pulser Xcell Electroporator Bio-Rad Laboratories, Hercules, California,
USA Incubator (cell culture)/ BB6220 Heraeus Instruments, Hanau InGenius gel documentation Syngene, Cambridge, UK Laminar flow cabinet BDK, Sonnenbrühl-Genkingen Laser scanning system/ TCS SP2 Leica Microsystems, Heidelberg Phase contrast inverted light microscope Leica Microsystems, Heidelberg Light microscope/ Axio scope Zeiss, Jena Liquid nitrogen system, chronos biosafe Messer Griesheim, Krefeld Microscope/ Leica DM IRBE Leica Microsystems, Heidelberg Milli-Q- water purification system Millipore, Schwalbach Pipettes and multichannel pipettes Eppendorf, Hamburg Scintillation counter TOPCounter Canberra Packard, Dreieich Spectrophotometer Nanodrop
® ND-100
pH-Meter 766 Calimetric Thermo Fisher Scientific Knick, Berlin
Spectrophotometer/ TECAN Genios plus Tecan, Crailsheim Table vortexer Neo-Lab, Munich Thermo mixer/ BT 130-2 HLC Biotech, Bovenden Water bath Köttermann Labortechnik, Uetze
5.2 Consumable material
Product Manufacturer
0.1 ml tubes (PCR) Eppendorf, Hamburg 1.5 ml tubes Eppendorf, Hamburg 6-, 24-, 12- and 96-well plates (flat-bottom) Nunc, Wiesbaden 96-well plates (U-bottom) Nunc, Wiesbaden 96-well plates (V-bottom) Nunc, Wiesbaden 96-well plates, with filter (LUMA) Canberra Packard, Dreieich Cell culture flasks (25, 75 and 175 cm
2) Greiner bio-one, Frickenhausen
Cryo conserving tubes (1.5 ml) Nunc, Wiesbaden Electroporation cuvettes (2 and 4 mm) Bio-Rad, Hercules, CA
Filter units (0.45 μm and 0.22 µm) Millipore, Billerica, USA
Folded paper filters Whatman, Dassel
SuperFrost Plus glass slides and coverslips Menzel, Braunschweig Heparin 2500 IE Essex Pharma GmbH, Munich
LS/MS MACS columns Miltenyi, Biotec, Bergisch Glattbach MACS separation columns Miltenyi, Biotec, Bergisch Glattbach Magnetic separator Miltenyi, Biotec, Bergisch Glattbach Multistepper Eppendorf, Hamburg
Neubauer counting chamber Assistent, Sondheim
Pasteur pipettes, glass Peske OHG, Munich
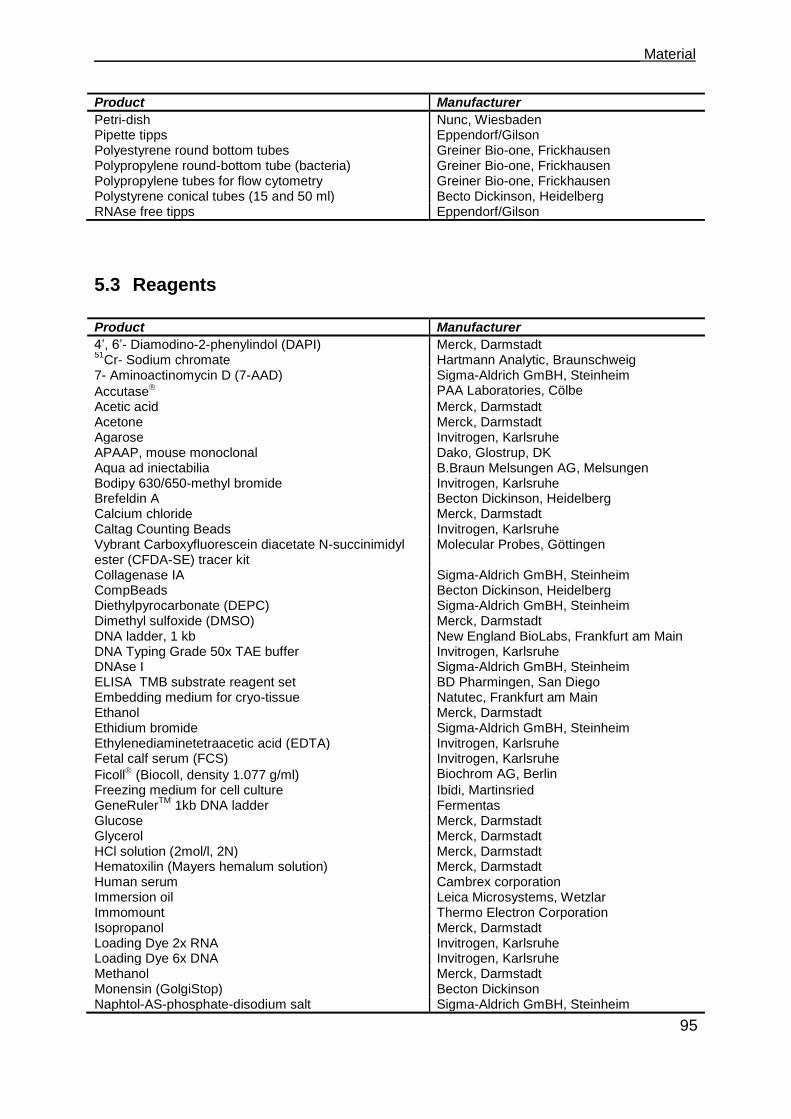
___________________________________________________________________ Material
95
Product Manufacturer
Petri-dish Nunc, Wiesbaden Pipette tipps Eppendorf/Gilson Polyestyrene round bottom tubes Greiner Bio-one, Frickhausen Polypropylene round-bottom tube (bacteria) Greiner Bio-one, Frickhausen Polypropylene tubes for flow cytometry Greiner Bio-one, Frickhausen Polystyrene conical tubes (15 and 50 ml) Becto Dickinson, Heidelberg RNAse free tipps Eppendorf/Gilson
5.3 Reagents
Product Manufacturer
4‟, 6‟- Diamodino-2-phenylindol (DAPI) Merck, Darmstadt 51
Cr- Sodium chromate Hartmann Analytic, Braunschweig 7- Aminoactinomycin D (7-AAD) Sigma-Aldrich GmBH, Steinheim
Accutase PAA Laboratories, Cölbe
Acetic acid Merck, Darmstadt Acetone Merck, Darmstadt Agarose Invitrogen, Karlsruhe APAAP, mouse monoclonal Dako, Glostrup, DK Aqua ad iniectabilia B.Braun Melsungen AG, Melsungen Bodipy 630/650-methyl bromide Invitrogen, Karlsruhe Brefeldin A Becton Dickinson, Heidelberg Calcium chloride Merck, Darmstadt Caltag Counting Beads Invitrogen, Karlsruhe Vybrant Carboxyfluorescein diacetate N-succinimidyl ester (CFDA-SE) tracer kit
Molecular Probes, Göttingen
Collagenase IA Sigma-Aldrich GmBH, Steinheim CompBeads Becton Dickinson, Heidelberg Diethylpyrocarbonate (DEPC) Sigma-Aldrich GmBH, Steinheim Dimethyl sulfoxide (DMSO) Merck, Darmstadt DNA ladder, 1 kb New England BioLabs, Frankfurt am Main DNA Typing Grade 50x TAE buffer Invitrogen, Karlsruhe DNAse I Sigma-Aldrich GmBH, Steinheim ELISA TMB substrate reagent set BD Pharmingen, San Diego Embedding medium for cryo-tissue Natutec, Frankfurt am Main Ethanol Merck, Darmstadt Ethidium bromide Sigma-Aldrich GmBH, Steinheim Ethylenediaminetetraacetic acid (EDTA) Invitrogen, Karlsruhe Fetal calf serum (FCS) Invitrogen, Karlsruhe
Ficoll (Biocoll, density 1.077 g/ml) Biochrom AG, Berlin
Freezing medium for cell culture Ibidi, Martinsried GeneRuler
TM 1kb DNA ladder Fermentas
Glucose Merck, Darmstadt Glycerol Merck, Darmstadt HCl solution (2mol/l, 2N) Merck, Darmstadt Hematoxilin (Mayers hemalum solution) Merck, Darmstadt Human serum Cambrex corporation Immersion oil Leica Microsystems, Wetzlar Immomount Thermo Electron Corporation Isopropanol Merck, Darmstadt Loading Dye 2x RNA Invitrogen, Karlsruhe Loading Dye 6x DNA Invitrogen, Karlsruhe Methanol Merck, Darmstadt Monensin (GolgiStop) Becton Dickinson Naphtol-AS-phosphate-disodium salt Sigma-Aldrich GmBH, Steinheim
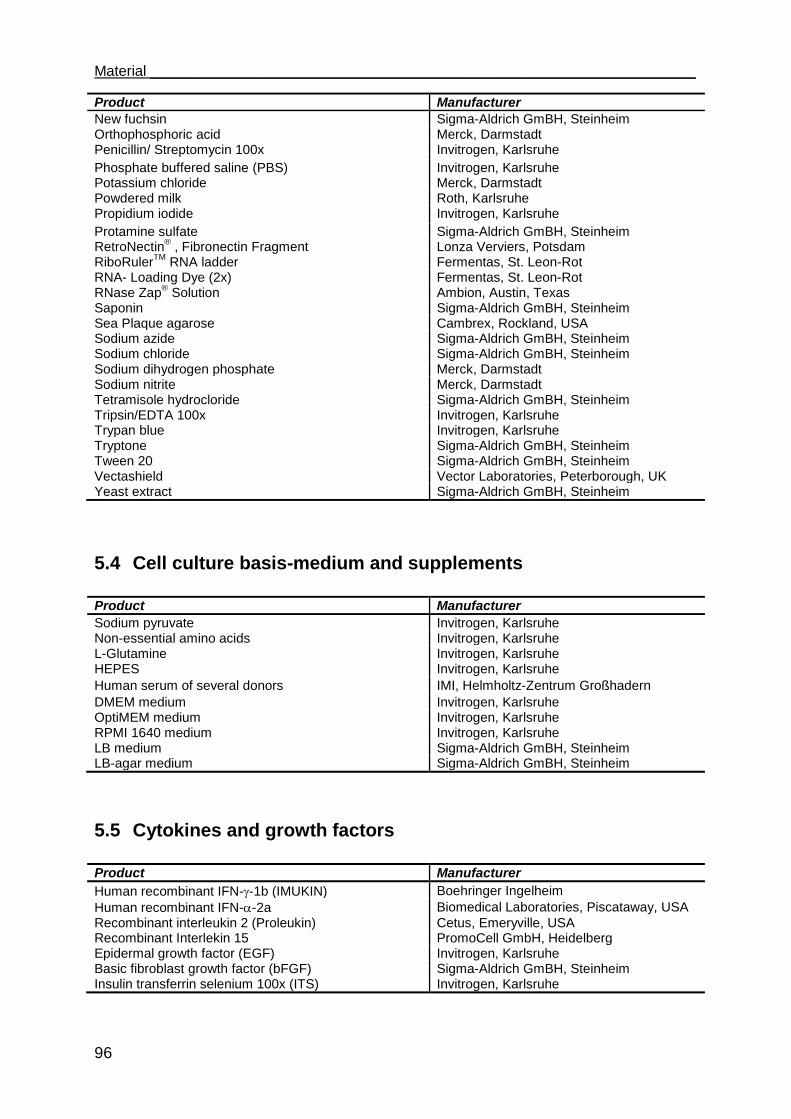
Material ___________________________________________________________________
96
Product Manufacturer
New fuchsin Sigma-Aldrich GmBH, Steinheim Orthophosphoric acid Merck, Darmstadt Penicillin/ Streptomycin 100x Invitrogen, Karlsruhe
Phosphate buffered saline (PBS) Invitrogen, Karlsruhe Potassium chloride Merck, Darmstadt Powdered milk Roth, Karlsruhe Propidium iodide Invitrogen, Karlsruhe
Protamine sulfate Sigma-Aldrich GmBH, Steinheim RetroNectin
® , Fibronectin Fragment Lonza Verviers, Potsdam
RiboRulerTM
RNA ladder Fermentas, St. Leon-Rot RNA- Loading Dye (2x) Fermentas, St. Leon-Rot RNase Zap
® Solution Ambion, Austin, Texas
Saponin Sigma-Aldrich GmBH, Steinheim Sea Plaque agarose Cambrex, Rockland, USA Sodium azide Sigma-Aldrich GmBH, Steinheim Sodium chloride Sigma-Aldrich GmBH, Steinheim Sodium dihydrogen phosphate Merck, Darmstadt Sodium nitrite Merck, Darmstadt Tetramisole hydrocloride Sigma-Aldrich GmBH, Steinheim Tripsin/EDTA 100x Invitrogen, Karlsruhe Trypan blue Invitrogen, Karlsruhe Tryptone Sigma-Aldrich GmBH, Steinheim Tween 20 Sigma-Aldrich GmBH, Steinheim Vectashield Vector Laboratories, Peterborough, UK Yeast extract Sigma-Aldrich GmBH, Steinheim
5.4 Cell culture basis-medium and supplements
Product Manufacturer
Sodium pyruvate Invitrogen, Karlsruhe Non-essential amino acids Invitrogen, Karlsruhe L-Glutamine Invitrogen, Karlsruhe HEPES Invitrogen, Karlsruhe
Human serum of several donors IMI, Helmholtz-Zentrum Großhadern
DMEM medium Invitrogen, Karlsruhe OptiMEM medium Invitrogen, Karlsruhe RPMI 1640 medium Invitrogen, Karlsruhe LB medium Sigma-Aldrich GmBH, Steinheim LB-agar medium Sigma-Aldrich GmBH, Steinheim
5.5 Cytokines and growth factors
Product Manufacturer
Human recombinant IFN--1b (IMUKIN) Boehringer Ingelheim
Human recombinant IFN--2a Biomedical Laboratories, Piscataway, USA
Recombinant interleukin 2 (Proleukin) Cetus, Emeryville, USA Recombinant Interlekin 15 PromoCell GmbH, Heidelberg Epidermal growth factor (EGF) Invitrogen, Karlsruhe Basic fibroblast growth factor (bFGF) Sigma-Aldrich GmBH, Steinheim Insulin transferrin selenium 100x (ITS) Invitrogen, Karlsruhe
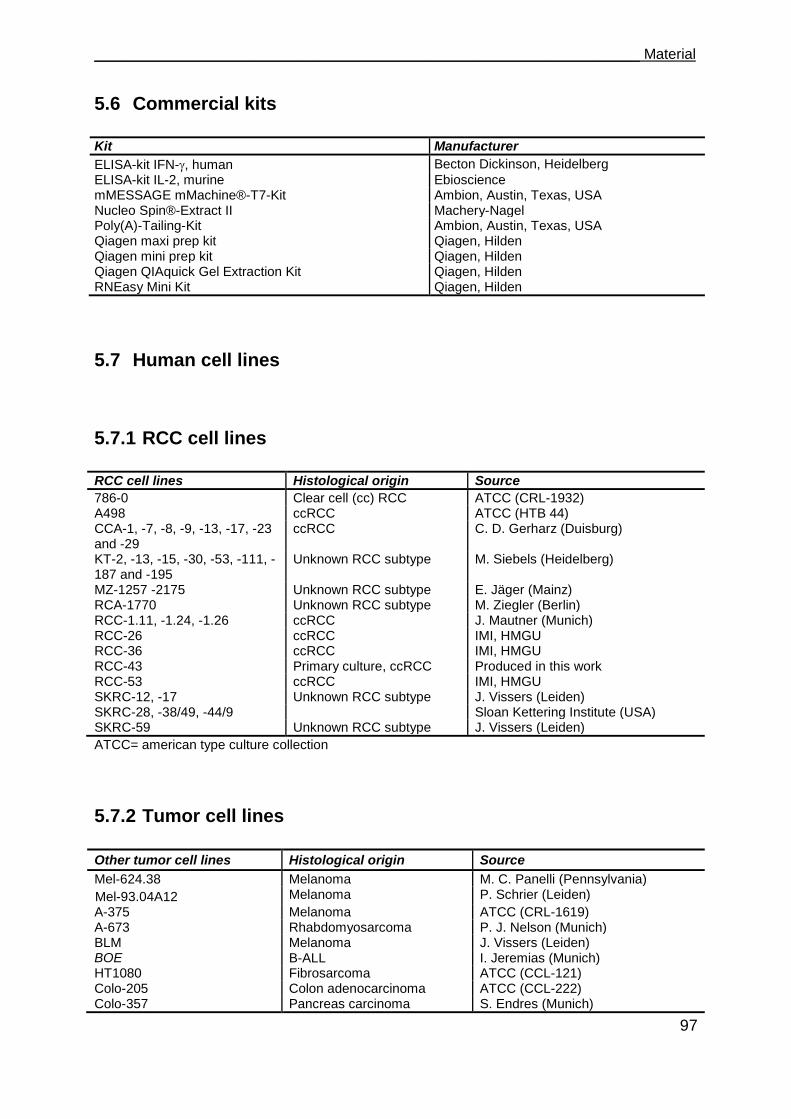
___________________________________________________________________ Material
97
5.6 Commercial kits
Kit Manufacturer
ELISA-kit IFN-, human Becton Dickinson, Heidelberg
ELISA-kit IL-2, murine Ebioscience mMESSAGE mMachine®-T7-Kit Ambion, Austin, Texas, USA Nucleo Spin®-Extract II Machery-Nagel Poly(A)-Tailing-Kit Ambion, Austin, Texas, USA Qiagen maxi prep kit Qiagen, Hilden Qiagen mini prep kit Qiagen, Hilden Qiagen QIAquick Gel Extraction Kit Qiagen, Hilden RNEasy Mini Kit Qiagen, Hilden
5.7 Human cell lines
5.7.1 RCC cell lines
RCC cell lines Histological origin Source
786-0 Clear cell (cc) RCC ATCC (CRL-1932) A498 ccRCC ATCC (HTB 44) CCA-1, -7, -8, -9, -13, -17, -23 and -29
ccRCC C. D. Gerharz (Duisburg)
KT-2, -13, -15, -30, -53, -111, -187 and -195
Unknown RCC subtype M. Siebels (Heidelberg)
MZ-1257 -2175 Unknown RCC subtype E. Jäger (Mainz) RCA-1770 Unknown RCC subtype M. Ziegler (Berlin) RCC-1.11, -1.24, -1.26 ccRCC J. Mautner (Munich) RCC-26 ccRCC IMI, HMGU RCC-36 ccRCC IMI, HMGU RCC-43 Primary culture, ccRCC Produced in this work RCC-53 ccRCC IMI, HMGU SKRC-12, -17 Unknown RCC subtype J. Vissers (Leiden) SKRC-28, -38/49, -44/9 Sloan Kettering Institute (USA) SKRC-59 Unknown RCC subtype J. Vissers (Leiden)
ATCC= american type culture collection
5.7.2 Tumor cell lines
Other tumor cell lines Histological origin Source
Mel-624.38 Melanoma M. C. Panelli (Pennsylvania)
Mel-93.04A12
Melanoma P. Schrier (Leiden)
A-375 Melanoma ATCC (CRL-1619) A-673 Rhabdomyosarcoma P. J. Nelson (Munich) BLM Melanoma J. Vissers (Leiden) BOE B-ALL I. Jeremias (Munich) HT1080 Fibrosarcoma ATCC (CCL-121) Colo-205 Colon adenocarcinoma ATCC (CCL-222) Colo-357 Pancreas carcinoma S. Endres (Munich)
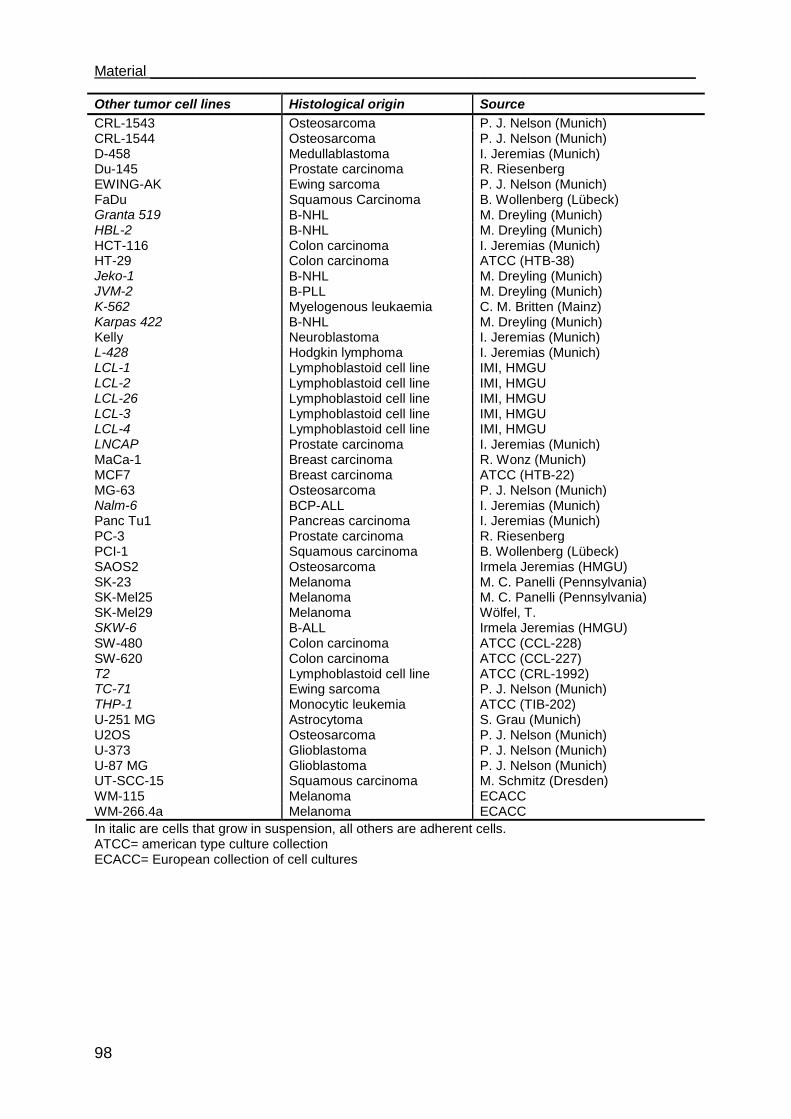
Material ___________________________________________________________________
98
Other tumor cell lines Histological origin Source
CRL-1543 Osteosarcoma P. J. Nelson (Munich) CRL-1544 Osteosarcoma P. J. Nelson (Munich) D-458 Medullablastoma I. Jeremias (Munich) Du-145 Prostate carcinoma R. Riesenberg EWING-AK Ewing sarcoma P. J. Nelson (Munich) FaDu Squamous Carcinoma B. Wollenberg (Lübeck) Granta 519 B-NHL M. Dreyling (Munich) HBL-2 B-NHL M. Dreyling (Munich) HCT-116 Colon carcinoma I. Jeremias (Munich) HT-29 Colon carcinoma ATCC (HTB-38) Jeko-1 B-NHL M. Dreyling (Munich) JVM-2 B-PLL M. Dreyling (Munich) K-562 Myelogenous leukaemia C. M. Britten (Mainz) Karpas 422 B-NHL M. Dreyling (Munich) Kelly Neuroblastoma I. Jeremias (Munich) L-428 Hodgkin lymphoma I. Jeremias (Munich) LCL-1 Lymphoblastoid cell line IMI, HMGU LCL-2 Lymphoblastoid cell line IMI, HMGU LCL-26 Lymphoblastoid cell line IMI, HMGU LCL-3 Lymphoblastoid cell line IMI, HMGU LCL-4 Lymphoblastoid cell line IMI, HMGU LNCAP Prostate carcinoma I. Jeremias (Munich) MaCa-1 Breast carcinoma R. Wonz (Munich) MCF7 Breast carcinoma ATCC (HTB-22) MG-63 Osteosarcoma P. J. Nelson (Munich) Nalm-6 BCP-ALL I. Jeremias (Munich) Panc Tu1 Pancreas carcinoma I. Jeremias (Munich) PC-3 Prostate carcinoma R. Riesenberg PCI-1 Squamous carcinoma B. Wollenberg (Lübeck) SAOS2 Osteosarcoma Irmela Jeremias (HMGU) SK-23 Melanoma M. C. Panelli (Pennsylvania) SK-Mel25 Melanoma M. C. Panelli (Pennsylvania) SK-Mel29 Melanoma Wölfel, T. SKW-6 B-ALL Irmela Jeremias (HMGU) SW-480 Colon carcinoma ATCC (CCL-228) SW-620 Colon carcinoma ATCC (CCL-227) T2 Lymphoblastoid cell line ATCC (CRL-1992) TC-71 Ewing sarcoma P. J. Nelson (Munich) THP-1 Monocytic leukemia ATCC (TIB-202) U-251 MG Astrocytoma S. Grau (Munich) U2OS Osteosarcoma P. J. Nelson (Munich) U-373 Glioblastoma P. J. Nelson (Munich) U-87 MG Glioblastoma P. J. Nelson (Munich) UT-SCC-15 Squamous carcinoma M. Schmitz (Dresden) WM-115 Melanoma ECACC WM-266.4a Melanoma ECACC
In italic are cells that grow in suspension, all others are adherent cells. ATCC= american type culture collection ECACC= European collection of cell cultures
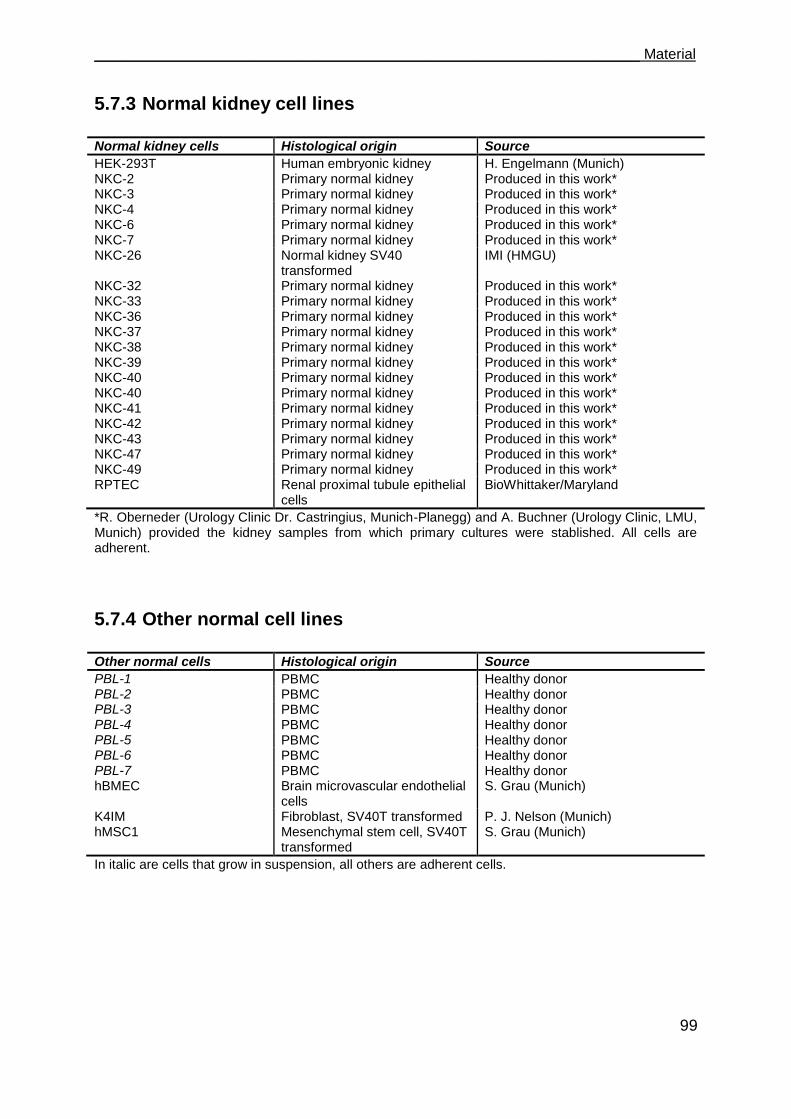
___________________________________________________________________ Material
99
5.7.3 Normal kidney cell lines
Normal kidney cells Histological origin Source
HEK-293T Human embryonic kidney H. Engelmann (Munich) NKC-2 Primary normal kidney Produced in this work*
NKC-3 Primary normal kidney Produced in this work*
NKC-4 Primary normal kidney Produced in this work*
NKC-6 Primary normal kidney Produced in this work*
NKC-7 Primary normal kidney Produced in this work*
NKC-26 Normal kidney SV40 transformed
IMI (HMGU)
NKC-32 Primary normal kidney Produced in this work*
NKC-33 Primary normal kidney Produced in this work* NKC-36 Primary normal kidney Produced in this work*
NKC-37 Primary normal kidney Produced in this work*
NKC-38 Primary normal kidney Produced in this work*
NKC-39 Primary normal kidney Produced in this work*
NKC-40 Primary normal kidney Produced in this work*
NKC-40 Primary normal kidney Produced in this work*
NKC-41 Primary normal kidney Produced in this work*
NKC-42 Primary normal kidney Produced in this work*
NKC-43 Primary normal kidney Produced in this work*
NKC-47 Primary normal kidney Produced in this work*
NKC-49 Primary normal kidney Produced in this work*
RPTEC Renal proximal tubule epithelial cells
BioWhittaker/Maryland
*R. Oberneder (Urology Clinic Dr. Castringius, Munich-Planegg) and A. Buchner (Urology Clinic, LMU, Munich) provided the kidney samples from which primary cultures were stablished. All cells are adherent.
5.7.4 Other normal cell lines
Other normal cells Histological origin Source
PBL-1 PBMC Healthy donor PBL-2 PBMC Healthy donor PBL-3 PBMC Healthy donor PBL-4 PBMC Healthy donor PBL-5 PBMC Healthy donor PBL-6 PBMC Healthy donor PBL-7 PBMC Healthy donor hBMEC Brain microvascular endothelial
cells S. Grau (Munich)
K4IM Fibroblast, SV40T transformed P. J. Nelson (Munich) hMSC1 Mesenchymal stem cell, SV40T
transformed S. Grau (Munich)
In italic are cells that grow in suspension, all others are adherent cells.
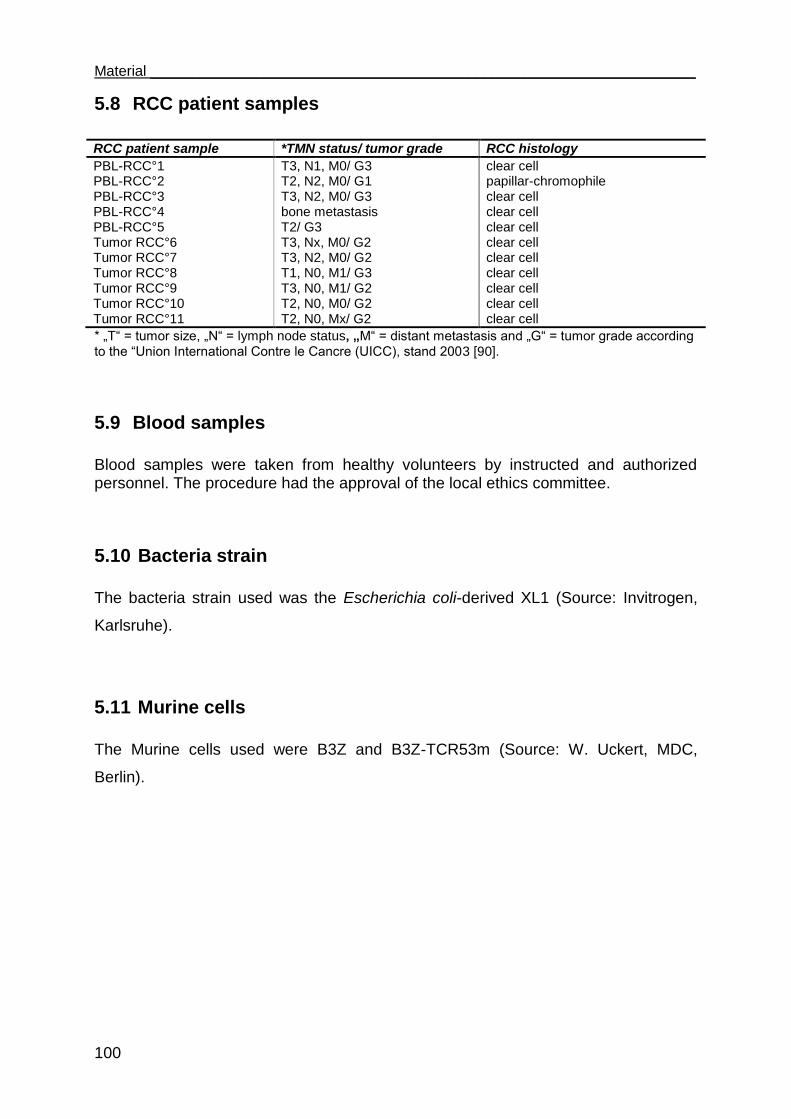
Material ___________________________________________________________________
100
5.8 RCC patient samples
RCC patient sample *TMN status/ tumor grade RCC histology
PBL-RCC°1 T3, N1, M0/ G3 clear cell PBL-RCC°2 T2, N2, M0/ G1 papillar-chromophile PBL-RCC°3 T3, N2, M0/ G3 clear cell PBL-RCC°4 bone metastasis clear cell PBL-RCC°5 T2/ G3 clear cell Tumor RCC°6 T3, Nx, M0/ G2 clear cell Tumor RCC°7 T3, N2, M0/ G2 clear cell Tumor RCC°8 T1, N0, M1/ G3 clear cell Tumor RCC°9 T3, N0, M1/ G2 clear cell Tumor RCC°10 T2, N0, M0/ G2 clear cell Tumor RCC°11 T2, N0, Mx/ G2 clear cell
* „T“ = tumor size, „N“ = lymph node status, „M“ = distant metastasis and „G“ = tumor grade according to the “Union International Contre le Cancre (UICC), stand 2003 [90].
5.9 Blood samples
Blood samples were taken from healthy volunteers by instructed and authorized personnel. The procedure had the approval of the local ethics committee.
5.10 Bacteria strain
The bacteria strain used was the Escherichia coli-derived XL1 (Source: Invitrogen,
Karlsruhe).
5.11 Murine cells
The Murine cells used were B3Z and B3Z-TCR53m (Source: W. Uckert, MDC,
Berlin).
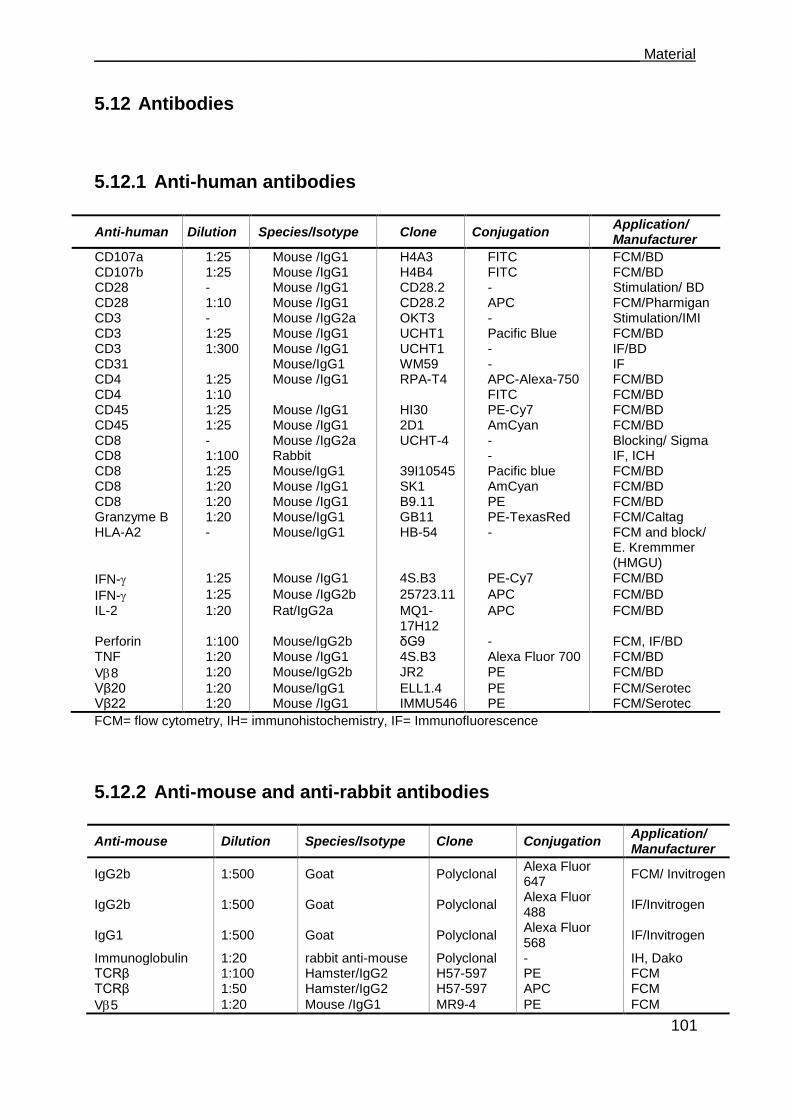
___________________________________________________________________ Material
101
5.12 Antibodies
5.12.1 Anti-human antibodies
Anti-human Dilution Species/Isotype Clone Conjugation Application/ Manufacturer
CD107a 1:25 Mouse /IgG1 H4A3 FITC FCM/BD CD107b 1:25 Mouse /IgG1 H4B4 FITC FCM/BD CD28 - Mouse /IgG1 CD28.2 - Stimulation/ BD CD28 1:10 Mouse /IgG1 CD28.2 APC FCM/Pharmigan CD3 - Mouse /IgG2a OKT3 - Stimulation/IMI CD3 1:25 Mouse /IgG1 UCHT1 Pacific Blue FCM/BD CD3 1:300 Mouse /IgG1 UCHT1 - IF/BD CD31 Mouse/IgG1 WM59 - IF CD4 1:25 Mouse /IgG1 RPA-T4 APC-Alexa-750 FCM/BD CD4 1:10 FITC FCM/BD CD45 1:25 Mouse /IgG1 HI30 PE-Cy7 FCM/BD CD45 1:25 Mouse /IgG1 2D1 AmCyan FCM/BD CD8 - Mouse /IgG2a UCHT-4 - Blocking/ Sigma CD8 1:100 Rabbit - IF, ICH CD8 1:25 Mouse/IgG1 39I10545 Pacific blue FCM/BD CD8 1:20 Mouse /IgG1 SK1 AmCyan FCM/BD CD8 1:20 Mouse /IgG1 B9.11 PE FCM/BD Granzyme B 1:20 Mouse/IgG1 GB11 PE-TexasRed FCM/Caltag HLA-A2 - Mouse/IgG1 HB-54 - FCM and block/
E. Kremmmer (HMGU)
IFN- 1:25 Mouse /IgG1 4S.B3 PE-Cy7 FCM/BD
IFN- 1:25 Mouse /IgG2b 25723.11 APC FCM/BD
IL-2 1:20 Rat/IgG2a MQ1-17H12
APC FCM/BD
Perforin 1:100 Mouse/IgG2b δG9 - FCM, IF/BD TNF 1:20 Mouse /IgG1 4S.B3 Alexa Fluor 700 FCM/BD
V8 1:20 Mouse/IgG2b JR2 PE FCM/BD
Vβ20 1:20 Mouse/IgG1 ELL1.4 PE FCM/Serotec Vβ22 1:20 Mouse /IgG1 IMMU546 PE FCM/Serotec
FCM= flow cytometry, IH= immunohistochemistry, IF= Immunofluorescence
5.12.2 Anti-mouse and anti-rabbit antibodies
Anti-mouse Dilution Species/Isotype Clone Conjugation Application/ Manufacturer
IgG2b 1:500 Goat Polyclonal Alexa Fluor 647
FCM/ Invitrogen
IgG2b 1:500 Goat Polyclonal Alexa Fluor 488
IF/Invitrogen
IgG1 1:500 Goat Polyclonal Alexa Fluor 568
IF/Invitrogen
Immunoglobulin 1:20 rabbit anti-mouse Polyclonal - IH, Dako TCRβ 1:100 Hamster/IgG2 H57-597 PE FCM TCRβ 1:50 Hamster/IgG2 H57-597 APC FCM
V5 1:20 Mouse /IgG1 MR9-4 PE FCM

Material ___________________________________________________________________
102
Anti-rabbit Dilution Species/Isotype Clone Conjugation Application/ Manufacturer
IgG2b 1:100 Goat Polyclonal Cy5 IF/ Jackson Immuno Research
FCM=flow cytometry, IH= immunohistochemistry, IF= Immunofluorescence
5.12.3 Isotype antibodies
Species/Isotype Clone Conjugation Application/ manufacturer
Mouse/IgG2b MOPC 141 - FCM/Sigma Mouse/IgG1 MOPC 21 - FCM/Sigma Mouse/IgG1 MOPC 21 FITC FCM/BD Mouse/IgG1 GB11 PE-TexasRed FCM/Caltag Mouse/IgG1 MOPC 21 APC FCM/BD Mouse/IgG1 MOPC 21 PE FCM/BD
FCM= flow cytometry
5.13 Enzymes
Enzyme Manufacturer
NotI and 10 x O-buffer Fermentas ClaI and 10 x Tango-buffer Fermentas T4 DNA Ligase NewEngland Biolabs, Schwalbach, Germany XbaI and 10 x Tango-buffer Fermentas XhoI and 10 x R-buffer
5.14 Cell culture medium
Medium Composition Application
CML
RPMI V
15 % FCS
Used to wash 51
Cr-labeled cells
HEK
DMEM (4.5 g/L Glucose) 10 % FCS 1 % L-glutamine 1 % non essential amino acids 1 % Sodium pyruvate 1 x Pen/Strep
Used for HEK-293T cells line
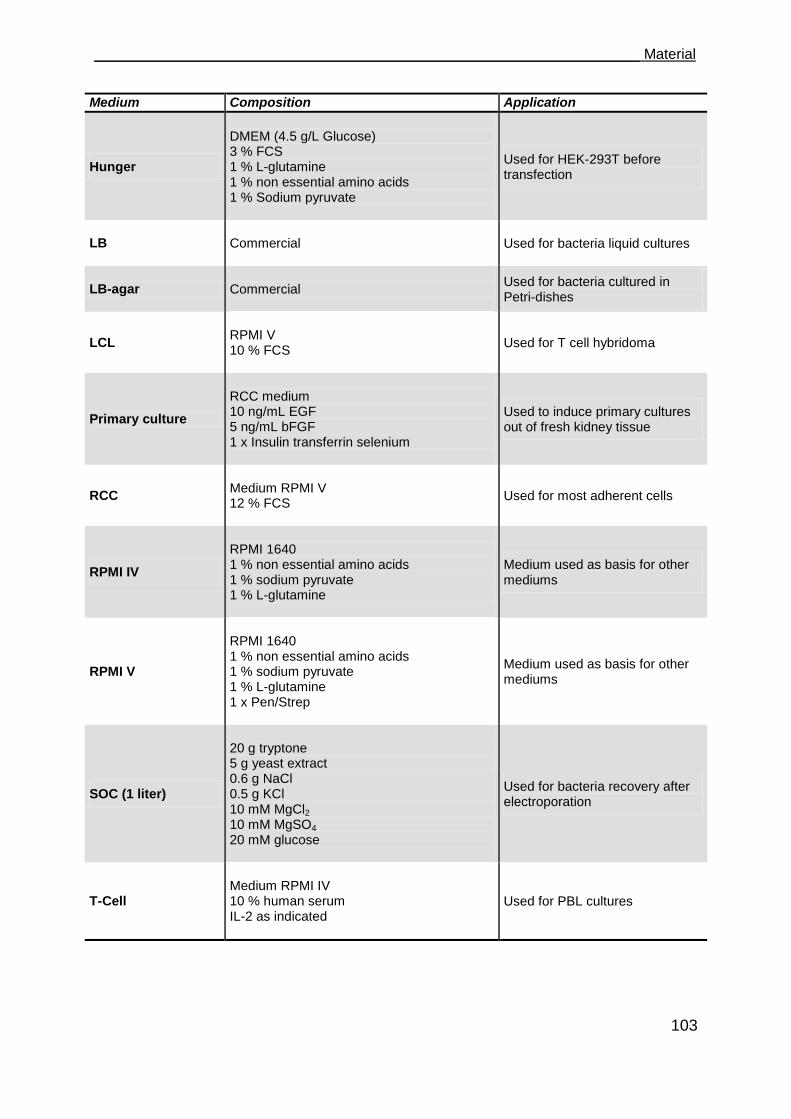
___________________________________________________________________ Material
103
Medium Composition Application
Hunger
DMEM (4.5 g/L Glucose) 3 % FCS 1 % L-glutamine 1 % non essential amino acids 1 % Sodium pyruvate
Used for HEK-293T before transfection
LB Commercial
Used for bacteria liquid cultures
LB-agar Commercial
Used for bacteria cultured in Petri-dishes
LCL
RPMI V 10 % FCS
Used for T cell hybridoma
Primary culture
RCC medium 10 ng/mL EGF 5 ng/mL bFGF 1 x Insulin transferrin selenium
Used to induce primary cultures out of fresh kidney tissue
RCC
Medium RPMI V 12 % FCS
Used for most adherent cells
RPMI IV
RPMI 1640 1 % non essential amino acids 1 % sodium pyruvate 1 % L-glutamine
Medium used as basis for other mediums
RPMI V
RPMI 1640 1 % non essential amino acids 1 % sodium pyruvate 1 % L-glutamine 1 x Pen/Strep
Medium used as basis for other mediums
SOC (1 liter)
20 g tryptone 5 g yeast extract 0.6 g NaCl 0.5 g KCl 10 mM MgCl2 10 mM MgSO4 20 mM glucose
Used for bacteria recovery after electroporation
T-Cell
Medium RPMI IV 10 % human serum IL-2 as indicated
Used for PBL cultures

Material ___________________________________________________________________
104
5.15 Buffers and other solutions
Solution Composition Comment
2 x HBSS buffer (100 mL)
1.64 g NaCl 0.075 g KCl 0.216 g Glucose 1.19 g HEPES 0.0267 g Na2HPO4*2H2O
Solution made and filtered moments before the transfection, pH adjusted to 7.06
Ampicillin stock
100 mg/ml Ampicillin in 70 % Ethanol, sterilized by filtration (0.22 µm).
For selection of bacteria carrying plasmids, stored at - 20°C
APAAP buffer
dissolve 12.1 g Tris-hydroxy (methyl) aminomethane (0.1 M) and 5.84 g Sodium chloride in 1 L Aqua ad iniectabilia
Component of APAAP-developing solution
APAAP-developing buffer
dissolve 1.21g Tris-hydroxy(methyl-) aminomethane (0.1 M) and 5.85 g Sodium chloride in 1 L Aqua ad iniectabilia
Component of APAAP-developing solution
APAAP-developing solution
A 30 mg tetramisole hydrocloride in 18.75 ml APAAP-buffer 52.5 ml APAAP developing-buffer B 30 mg sodium nitrite 150 μl new fuchsin stock solution 375 μl Aqua ad iniectabilia C 37.5 mg naphtol-AS-phosphate-disodium salt, 450 μl dimethylformamide Mixed in the order B, C and A
For immunohistochemistry, freshly prepared, filtered with folded whatman paper
CaCl2 (2M, 10 ml) 2.22 g in 10 mL H2O bidest
Solution made and filtered shortly before transfection
DEPC water
1:1000 diluted from a 97 % Stock-solution of DEPC in H2O. Incubated at 37°C overnight
Autoclaved, stored at room temperature
Digest solution
0.1 % BSA 100 µg/ml pen/strep 10 mM Hepes 218 U/ml Collagenase IA and 435 U/ml DNAse added freshly in RPMI
Used for the disruption of kidney tissue
ELISA blocking buffer 1 % pulvered milk in PBS
Freshly prepared
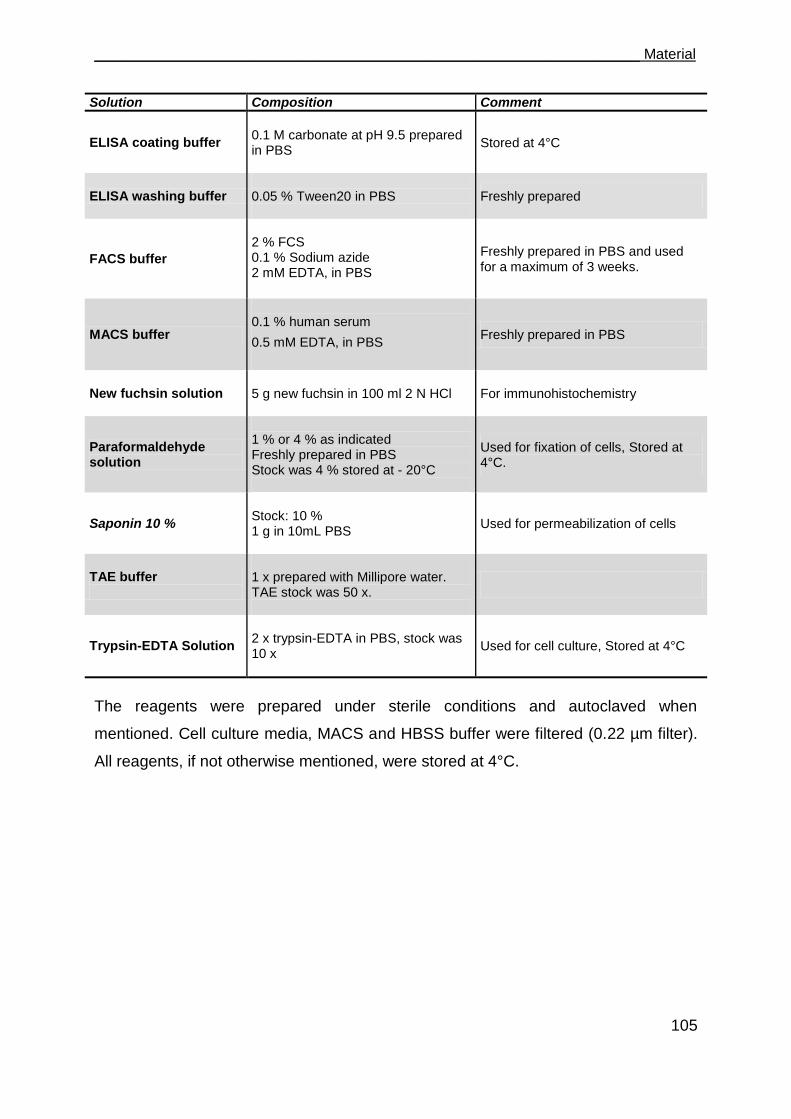
___________________________________________________________________ Material
105
Solution Composition Comment
ELISA coating buffer
0.1 M carbonate at pH 9.5 prepared in PBS
Stored at 4°C
ELISA washing buffer 0.05 % Tween20 in PBS
Freshly prepared
FACS buffer
2 % FCS 0.1 % Sodium azide 2 mM EDTA, in PBS
Freshly prepared in PBS and used for a maximum of 3 weeks.
MACS buffer
0.1 % human serum
0.5 mM EDTA, in PBS
Freshly prepared in PBS
New fuchsin solution 5 g new fuchsin in 100 ml 2 N HCl
For immunohistochemistry
Paraformaldehyde solution
1 % or 4 % as indicated Freshly prepared in PBS Stock was 4 % stored at - 20°C
Used for fixation of cells, Stored at 4°C.
Saponin 10 %
Stock: 10 % 1 g in 10mL PBS
Used for permeabilization of cells
TAE buffer
1 x prepared with Millipore water. TAE stock was 50 x.
Trypsin-EDTA Solution
2 x trypsin-EDTA in PBS, stock was 10 x
Used for cell culture, Stored at 4°C
The reagents were prepared under sterile conditions and autoclaved when
mentioned. Cell culture media, MACS and HBSS buffer were filtered (0.22 µm filter).
All reagents, if not otherwise mentioned, were stored at 4°C.
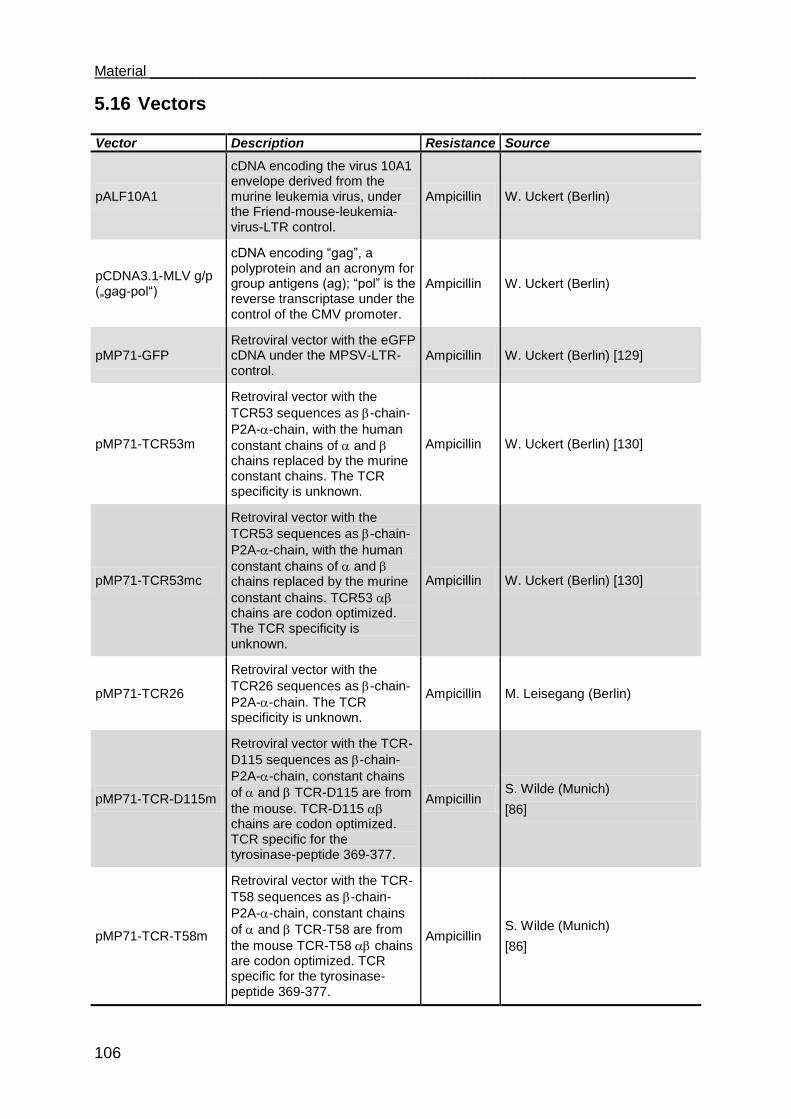
Material ___________________________________________________________________
106
5.16 Vectors
Vector Description Resistance Source
pALF10A1
cDNA encoding the virus 10A1 envelope derived from the murine leukemia virus, under the Friend-mouse-leukemia-virus-LTR control.
Ampicillin W. Uckert (Berlin)
pCDNA3.1-MLV g/p („gag-pol“)
cDNA encoding “gag”, a polyprotein and an acronym for group antigens (ag); “pol” is the reverse transcriptase under the control of the CMV promoter.
Ampicillin W. Uckert (Berlin)
pMP71-GFP Retroviral vector with the eGFP cDNA under the MPSV-LTR-control.
Ampicillin W. Uckert (Berlin) [129]
pMP71-TCR53m
Retroviral vector with the
TCR53 sequences as -chain-
P2A--chain, with the human
constant chains of and chains replaced by the murine constant chains. The TCR specificity is unknown.
Ampicillin W. Uckert (Berlin) [130]
pMP71-TCR53mc
Retroviral vector with the
TCR53 sequences as -chain-
P2A--chain, with the human
constant chains of and chains replaced by the murine
constant chains. TCR53 chains are codon optimized. The TCR specificity is unknown.
Ampicillin W. Uckert (Berlin) [130]
pMP71-TCR26
Retroviral vector with the
TCR26 sequences as -chain-
P2A--chain. The TCR specificity is unknown.
Ampicillin M. Leisegang (Berlin)
pMP71-TCR-D115m
Retroviral vector with the TCR-
D115 sequences as -chain-
P2A--chain, constant chains
of and TCR-D115 are from
the mouse. TCR-D115 chains are codon optimized. TCR specific for the tyrosinase-peptide 369-377.
Ampicillin S. Wilde (Munich)
[86]
pMP71-TCR-T58m
Retroviral vector with the TCR-
T58 sequences as -chain-
P2A--chain, constant chains
of and TCR-T58 are from
the mouse TCR-T58 chains are codon optimized. TCR specific for the tyrosinase-peptide 369-377.
Ampicillin S. Wilde (Munich)
[86]
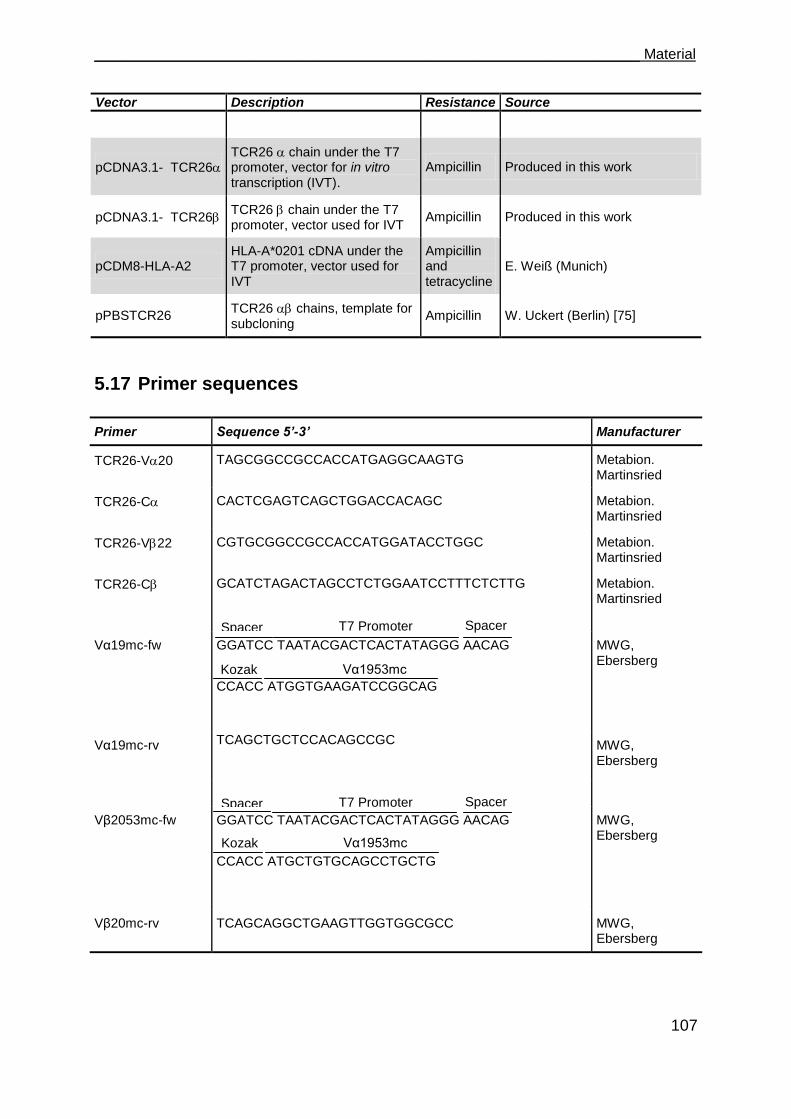
___________________________________________________________________ Material
107
Vector Description Resistance Source
pCDNA3.1- TCR26 TCR26 chain under the T7 promoter, vector for in vitro transcription (IVT).
Ampicillin Produced in this work
pCDNA3.1- TCR26 TCR26 chain under the T7 promoter, vector used for IVT
Ampicillin Produced in this work
pCDM8-HLA-A2 HLA-A*0201 cDNA under the T7 promoter, vector used for IVT
Ampicillin and tetracycline
E. Weiß (Munich)
pPBSTCR26 TCR26 chains, template for subcloning
Ampicillin W. Uckert (Berlin) [75]
5.17 Primer sequences
Primer Sequence 5’-3’ Manufacturer
TCR26-V20 TAGCGGCCGCCACCATGAGGCAAGTG Metabion. Martinsried
TCR26-C CACTCGAGTCAGCTGGACCACAGC Metabion. Martinsried
TCR26-V22 CGTGCGGCCGCCACCATGGATACCTGGC Metabion. Martinsried
TCR26-C GCATCTAGACTAGCCTCTGGAATCCTTTCTCTTG Metabion. Martinsried
Vα19mc-fw GGATCC TAATACGACTCACTATAGGG AACAG
CCACC ATGGTGAAGATCCGGCAG
MWG, Ebersberg
Vα19mc-rv TCAGCTGCTCCACAGCCGC
MWG, Ebersberg
Vβ2053mc-fw GGATCC TAATACGACTCACTATAGGG AACAG
CCACC ATGCTGTGCAGCCTGCTG
MWG, Ebersberg
Vβ20mc-rv TCAGCAGGCTGAAGTTGGTGGCGCC MWG, Ebersberg
Spacer T7 Promoter Spacer
Kozak Vα1953mc
Kozak Vα1953mc
Spacer T7 Promoter Spacer
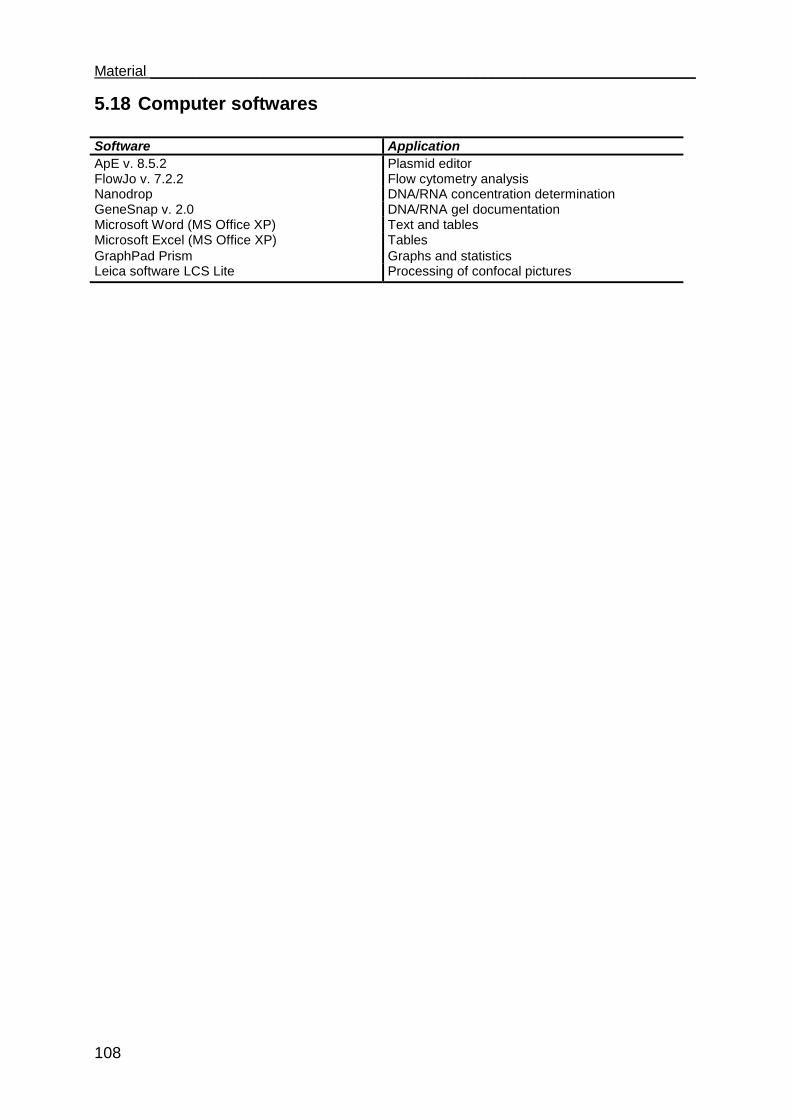
Material ___________________________________________________________________
108
5.18 Computer softwares
Software Application
ApE v. 8.5.2 Plasmid editor FlowJo v. 7.2.2 Flow cytometry analysis Nanodrop DNA/RNA concentration determination GeneSnap v. 2.0 DNA/RNA gel documentation Microsoft Word (MS Office XP) Text and tables Microsoft Excel (MS Office XP) Tables
GraphPad Prism Graphs and statistics Leica software LCS Lite Processing of confocal pictures
___________________________________________________________________Methods
109
6 Methods
6.1 Cell culture methods
6.1.1 General considerations
To avoid any contamination, the work with cell culture was performed under sterile
conditions. All cells were cultivated at 37°C with 6.5 % CO2 in a water vapor
saturated incubator. The work involving retroviral transduction of cells was performed
in a S2 laboratory with all S2 safety protocols being observed.
6.1.2 Thawing cells
A vial of cells was removed from the vapor phase of liquid nitrogen. The vial contents
were allowed to thaw at 37°C in a water bath until only a small ice pellet remained.
The vial was sprayed down with a 70 % alcohol solution which was allowed to
evaporate. 100 % of cold fetal calf serum (FCS) was added to the cell suspension
and resuspended. To remove residual DMSO, cells were centrifuged at 1500 rpm for
5 min at room temperature, the supernatant was discarded and an appropriate
medium was added to the cells.
6.1.3 Cell freezing procedure
Cryo-preservation is an efficient method by which cells are stored in liquid nitrogen
(-179°C) without significantly losing their viability. The following procedure describes
the method used to freeze cells.
A commercial freezing medium containing dimethyl sulfoxide (DMSO) was used.
Formation of ice crystals inside the cells is avoided by the addition of DMSO because
it diffuses into the cells at the expense of dehydration. Cells were harvested in mid-
logarithmic growth using standard procedures. Cells were counted after pelleting by
centrifugation and resuspending in FCS. After centrifuging, cells were carefully

Methods___________________________________________________________________
110
resuspended in freezing medium at the desired concentration (that ranged from
2 x 10⁶ to 1 x 10⁷) and aliquoted into sterile vials. The vials were wrapped in a dense
stack of towel paper and placed at - 80°C to freeze overnight. For long storing, they
were transferred from - 80°C into the vapor phase of liquid nitrogen.
6.1.4 Cell culture
Cell lines and primary cell cultures with the respective optimal medium are listed in
the section 5.7. Each medium utilized for cultures was taken out of the fridge and
allowed to adjust to room temperature before use. Cultures were observed using an
inverted phase contrast microscope. Cell growth was monitored by observing the
change in pH of the medium, indicated by change in color of the phenol in the
medium from red to yellow. In general, adherent cell lines were grown in 75 cm2
(T75) flasks in a horizontal position, supplemented with 10 ml of the optimal medium.
When expansion was needed, cells were cultivated in 175 cm2 flasks with 20 ml of
medium. At the desired growth confluence, adherent cells were harvested by EDTA
treatment and trypsination. In brief, culture medium was removed and cell layer was
washed once with 5 ml PBS without Ca2+/Mg2
+(for a T75 flask). Then the cells layer
was incubated with 1 ml of a 2x trypsin/EDTA solution for 2 min at room temperature.
Trypsin cleaves the adhesion proteins in cell-cell and cell-matrix interactions, and
EDTA is a chelator of calcium ions which integrins need to interact with other proteins
for cell adhesion. Fresh medium containing FCS or HS was added to the culture and
loose cells were resuspended carefully with the help of a 10 ml glass pipette. The
amount of medium removed depended on the number of cells needed. In order to
keep cells in culture, depending on the growth rate, the culture was split at a
minimum of 1:2 or a maximum of 1:10 every 3-5 days.
For cells growing in suspension, cultivation took place in T25 or T75 flasks. The
cultures were split according to necessity every 2-3 days by removing a certain
amount of cell suspension and replacing it with fresh medium. Peripheral blood
lymphocytes were cultured in 24-well plates placed into a humidified chamber in the
incubator.
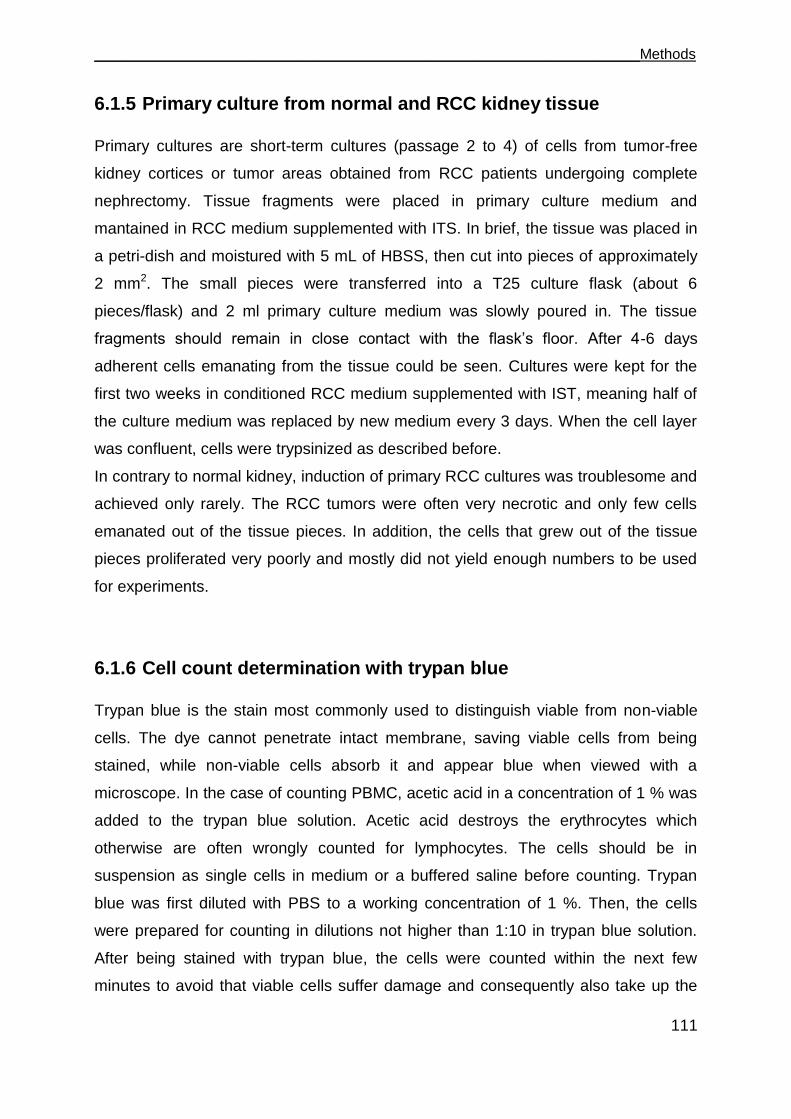
___________________________________________________________________Methods
111
6.1.5 Primary culture from normal and RCC kidney tissue
Primary cultures are short-term cultures (passage 2 to 4) of cells from tumor-free
kidney cortices or tumor areas obtained from RCC patients undergoing complete
nephrectomy. Tissue fragments were placed in primary culture medium and
mantained in RCC medium supplemented with ITS. In brief, the tissue was placed in
a petri-dish and moistured with 5 mL of HBSS, then cut into pieces of approximately
2 mm2. The small pieces were transferred into a T25 culture flask (about 6
pieces/flask) and 2 ml primary culture medium was slowly poured in. The tissue
fragments should remain in close contact with the flask‟s floor. After 4-6 days
adherent cells emanating from the tissue could be seen. Cultures were kept for the
first two weeks in conditioned RCC medium supplemented with IST, meaning half of
the culture medium was replaced by new medium every 3 days. When the cell layer
was confluent, cells were trypsinized as described before.
In contrary to normal kidney, induction of primary RCC cultures was troublesome and
achieved only rarely. The RCC tumors were often very necrotic and only few cells
emanated out of the tissue pieces. In addition, the cells that grew out of the tissue
pieces proliferated very poorly and mostly did not yield enough numbers to be used
for experiments.
6.1.6 Cell count determination with trypan blue
Trypan blue is the stain most commonly used to distinguish viable from non-viable
cells. The dye cannot penetrate intact membrane, saving viable cells from being
stained, while non-viable cells absorb it and appear blue when viewed with a
microscope. In the case of counting PBMC, acetic acid in a concentration of 1 % was
added to the trypan blue solution. Acetic acid destroys the erythrocytes which
otherwise are often wrongly counted for lymphocytes. The cells should be in
suspension as single cells in medium or a buffered saline before counting. Trypan
blue was first diluted with PBS to a working concentration of 1 %. Then, the cells
were prepared for counting in dilutions not higher than 1:10 in trypan blue solution.
After being stained with trypan blue, the cells were counted within the next few
minutes to avoid that viable cells suffer damage and consequently also take up the

Methods___________________________________________________________________
112
dye. Unstained cells were counted in at least two squares of 1 mm2. In the case of a
strong variation in the counted cell number, further quadrants were counted. Given
that a quadrant has an area of 1 mm2 and the height between the chamber and the
coverslip is 0.1 mm, the total volume is of 0.1 µl. The number of cells/ml was
calculated using the following equation:
6.1.7 Cell count determination with counting beads
Counting beads are a composition of two different fluorescent beads (A and B beads)
used for absolute cell counts by flow cytometry. The two fluorospheres are used as
double internal standards for volume calculation. A known volume of counting beads
is added to the same known volume of the sample. The beads are counted along
with the cells (for gating strategy see Figure 6.1). The accuracy of the data
acquisition is determined by verifying that the proportion of both types of beads
corresponds to the manufacturer‟s description. Bead A is a 6.4 μm sphere that, in
flow cytometry, presents a low forward scatter (FSC) signal, a lower side scatter
(SSC) signal, and emits broadly when excited with a 488 nm argon laser. Bead B is a
6.36 μm sphere that has a low FSC signal, a slightly higher SSC signal and a higher
fluorescent signal when excited with a 488 nm argon laser.
factordilution 10 counted square ofnumber
cells countedcells/ml viableofNumber 4

___________________________________________________________________Methods
113
Figure 6.1. Analysis of A and B bead proportion
A gate selecting all beads (type A and type B) in a FSC vs. SSC dot plot (Region R1) is created. For the cell subset of interest, a gate must be created (G1) and number of total events in the gate must be noted (a). In a FL2 vs. SSC dot plot, events of region R1 are displayed and a second gate (Region R2) is created to exclude debris (b). Two new gates on each bead type must be created (R3 and R4) to verify that the proportion of both beads agrees with the manufacturer‟s indicated proportions (c). For that, the gate statistic of both R3 and R4 must be verified for the number of events. Also the number of total beads (R2 in (b) must be noted for later calculations. The absolute number of the cell population of interest (in G1) is calculated according to the following formula:
µlper beads of nB))(A counted beads of n (total
counted cells of n(cells/µl)Count Cell Absolute o
o
o
6.1.8 Treatment of cells with IFN- and IFN-
For interferon treatment, tumor cell lines were split into its appropriate medium which
was then supplemented with either 1000 U/ml Interferon- or 500 U/ml Interferon- or
none and grown for a total of 3 days. On day 3, cells were counted and adjusted to
15000 cells /100 l in RCC medium and used for experiments (see section 6.1.11).
6.1.9 PBMC isolation by ficoll density centrifugation
Before blood collect, a 50 ml syringe was filled with 100 µl of heparin. Heparin is
used as an anticoagulant to avoid clumping of leukocytes. After blood collection, the
blood was gently mixed with an equal volume of RPMI medium and layered over 15
ml of ficoll in 50 ml conical tubes. The filled tubes were centrifuged at 2000 rpm for
20 min with the break turned off. Ficoll is an inert, high molecular weight polysucrose
A
B
A
B
(a) Total events (b) Events gated in R1 (c) Events gated in R2
G1

Methods___________________________________________________________________
114
with a density of 1077 g/ml. After centrifugation a greyish-white band forms at the
plasma-ficoll interface, separated from the underlying erythrocytes.
Using a 5 ml pipette, this layer, consisting of lymphocytes, monocytes and
thrombocytes with only few erythrocytes, was recovered and transferred to a new
tube. The cell suspension was diluted with 1 volume RPMI to wash out the ficoll and
centrifuged at 2000 rpm for 10 min with the break turned on. The supernatant was
discarded and the PBMC pellet resuspended in appropriate medium. After counting,
the cell suspension was adjusted to 1 x 10⁶/ml and transferred at 1 ml/well to a 24-
well plate and incubated in a humidified chamber in the incubator.
6.1.10 Anti-CD3 stimulation of PBMC
For the induction of proliferation of PBMC, anti-CD3 stimulation was carried out. The
stimulation was performed directly after isolating the PBMC through Ficoll gradient.
24-well plates were coated with 1 µg/well of anti-CD28 and 0.5 µg/well anti-CD3
(OKT3) in 500 µl PBS for 1 h at 37°C or overnight at 4°C. Isolated PBMC was
resuspended in T cell medium supplemented with 300 U/ml IL-2 at 1 x 10⁶ cells/ml
and added to the wells of the pre-coated anti-CD3/anti-CD28 plate (1 ml/well) and
were kept in a humified chamber in the incubator. After 48 h, PBLs were transferred
to a new 24-well plate and split if necessary. PBLs were generally split into two wells
every 2-3 days. In the first split, IL-2 concentration was kept at 300 U/ml. From the
second split on, with each split, the concentration of IL-2 was reduced to 200, then
100 U/ml and was finally kept at 50 U/ml. The intention of reducing the IL-2
concentration in the cultures was to avoid the generation of LAK cells that would
show unspecific killing of tumor cells. LAK cells are generated by long-term
cultivation of lymphocytes in a high concentration of IL-2.
6.1.11 T cell stimulation with tumor cell lines or fresh tissue suspension
For the detection of function unleashed by TCR-pMHC interaction, different tumor
cell lines (specified in the results) were used as targets for T cells expressing TCR53.
RCC-26 was used as target for T cells expressing TCR53 or TCR26 and Mel-

___________________________________________________________________Methods
115
93.04A12 was used as target for T cells expressing TCR-D115m or TCR-T58m. The
KT-195 cell line, was used as negative control for all TCRs mentioned above, as it
does not express the HLA-A2 allotype needed for presentation of the ligands
recognized by any of the TCRs used in this work. Effector to target cell ratio, if not
mentioned otherwise, was 1:1 (1 x 10⁵ cells of each type in 100 µl RCC medium).
Different read out systems were used to determine the functional response of T cells
and depending on the method, cocultures of effectors and targets were carried out
for 4 h (chromium release assay), 4 to 5 h (detection of cytokines and degranulation
by flow cytometry) or 24 h (if cytokines were to be determined in the supernatant by
immunosorbent assay). The different methods to detect function in the T cells
unleashed by target cells will be individually described in the next sections.
For the analysis of the TCR53-pMHC ligand detection in the cell lines treated with
IFN- or IFN-, the cell suspension (in RCC medium) was transferred into 96-well
round bottom plates at a cell density of 15000 cells/well in 200 µl cultured in the
presence of 75000 B3Z-TCR53m or without B3Z for 24 h in a humidified chamber in
the incubator. The supernatants were taken for analysis of the IL-2 content.
To investigate the presence of TCR53 pMHC on fresh tissue of RCC tumors or
normal kidney, the tissues were disrupted as follows. Tissue was washed with HBSS
buffer and cut into small pieces (10-15 pieces of about 1 mm2). After a second wash
with HBSS, tissue pieces were incubated with digestion solution (containing
collagenase IA and DNAse I) for 30 min. After the incubation, tissue pieces were
pressed vigorously with the back of a Petri-dish lid and the disrupted tissue was
washed again with HBSS and resuspended in 1 ml of RCC medium. For stimulation
of 1 x 10⁵ B3Z-TCR53mc cells in 100 µl RCC medium, 100 µl of the tissue
suspension (either RCC tissue or NKC tissue) was used.
6.1.12 Isolation of CD4+ and CD8+ T cells
Magnetic-activated cell sorting (MACS) technology utilizes tiny super-paramagnetic
microbeads for labeling targets; separation is achieved by using columns in which
magnetically labeled cells are retained and unlabeled cells can pass through.
For the isolation of untouched human CD8+ or CD4+ T cells, a magnetic labeling
system was used that indirectly sorted CD8+ or CD4+ T cells from PBLs by depletion
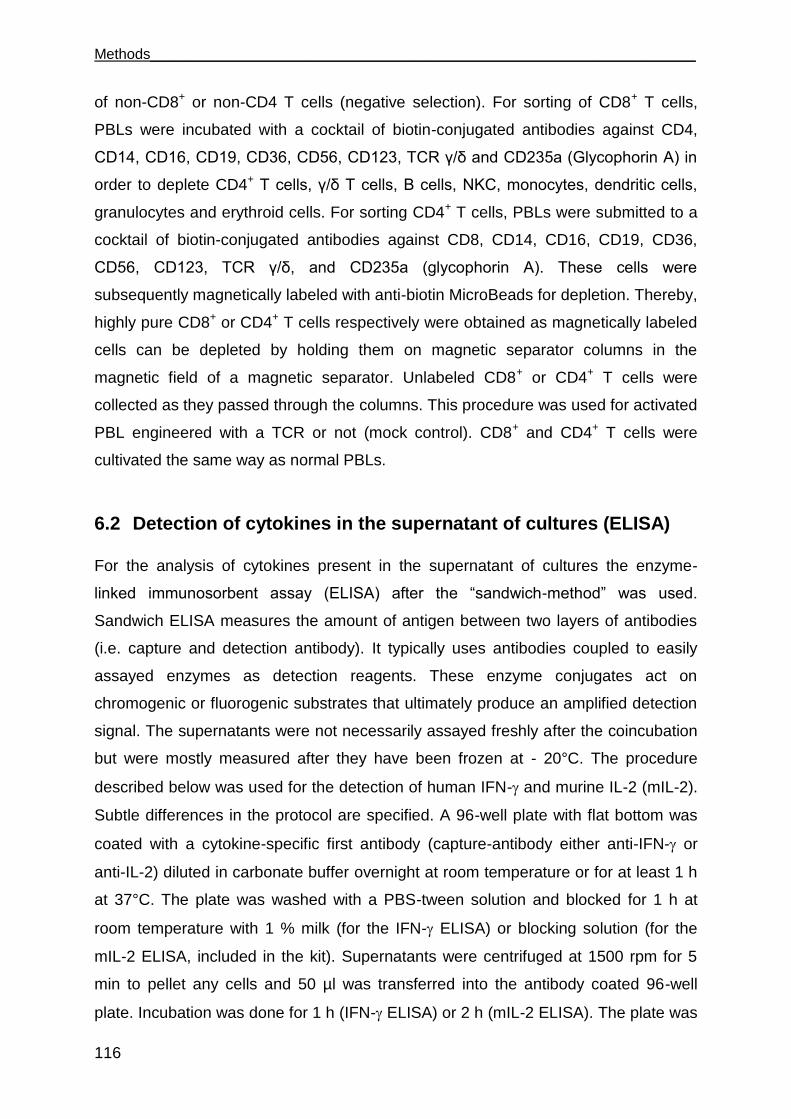
Methods___________________________________________________________________
116
of non-CD8+ or non-CD4 T cells (negative selection). For sorting of CD8+ T cells,
PBLs were incubated with a cocktail of biotin-conjugated antibodies against CD4,
CD14, CD16, CD19, CD36, CD56, CD123, TCR γ/δ and CD235a (Glycophorin A) in
order to deplete CD4+ T cells, γ/δ T cells, B cells, NKC, monocytes, dendritic cells,
granulocytes and erythroid cells. For sorting CD4+ T cells, PBLs were submitted to a
cocktail of biotin-conjugated antibodies against CD8, CD14, CD16, CD19, CD36,
CD56, CD123, TCR γ/δ, and CD235a (glycophorin A). These cells were
subsequently magnetically labeled with anti-biotin MicroBeads for depletion. Thereby,
highly pure CD8+ or CD4+ T cells respectively were obtained as magnetically labeled
cells can be depleted by holding them on magnetic separator columns in the
magnetic field of a magnetic separator. Unlabeled CD8+ or CD4+ T cells were
collected as they passed through the columns. This procedure was used for activated
PBL engineered with a TCR or not (mock control). CD8+ and CD4+ T cells were
cultivated the same way as normal PBLs.
6.2 Detection of cytokines in the supernatant of cultures (ELISA)
For the analysis of cytokines present in the supernatant of cultures the enzyme-
linked immunosorbent assay (ELISA) after the “sandwich-method” was used.
Sandwich ELISA measures the amount of antigen between two layers of antibodies
(i.e. capture and detection antibody). It typically uses antibodies coupled to easily
assayed enzymes as detection reagents. These enzyme conjugates act on
chromogenic or fluorogenic substrates that ultimately produce an amplified detection
signal. The supernatants were not necessarily assayed freshly after the coincubation
but were mostly measured after they have been frozen at - 20°C. The procedure
described below was used for the detection of human IFN- and murine IL-2 (mIL-2).
Subtle differences in the protocol are specified. A 96-well plate with flat bottom was
coated with a cytokine-specific first antibody (capture-antibody either anti-IFN- or
anti-IL-2) diluted in carbonate buffer overnight at room temperature or for at least 1 h
at 37°C. The plate was washed with a PBS-tween solution and blocked for 1 h at
room temperature with 1 % milk (for the IFN- ELISA) or blocking solution (for the
mIL-2 ELISA, included in the kit). Supernatants were centrifuged at 1500 rpm for 5
min to pellet any cells and 50 µl was transferred into the antibody coated 96-well
plate. Incubation was done for 1 h (IFN- ELISA) or 2 h (mIL-2 ELISA). The plate was
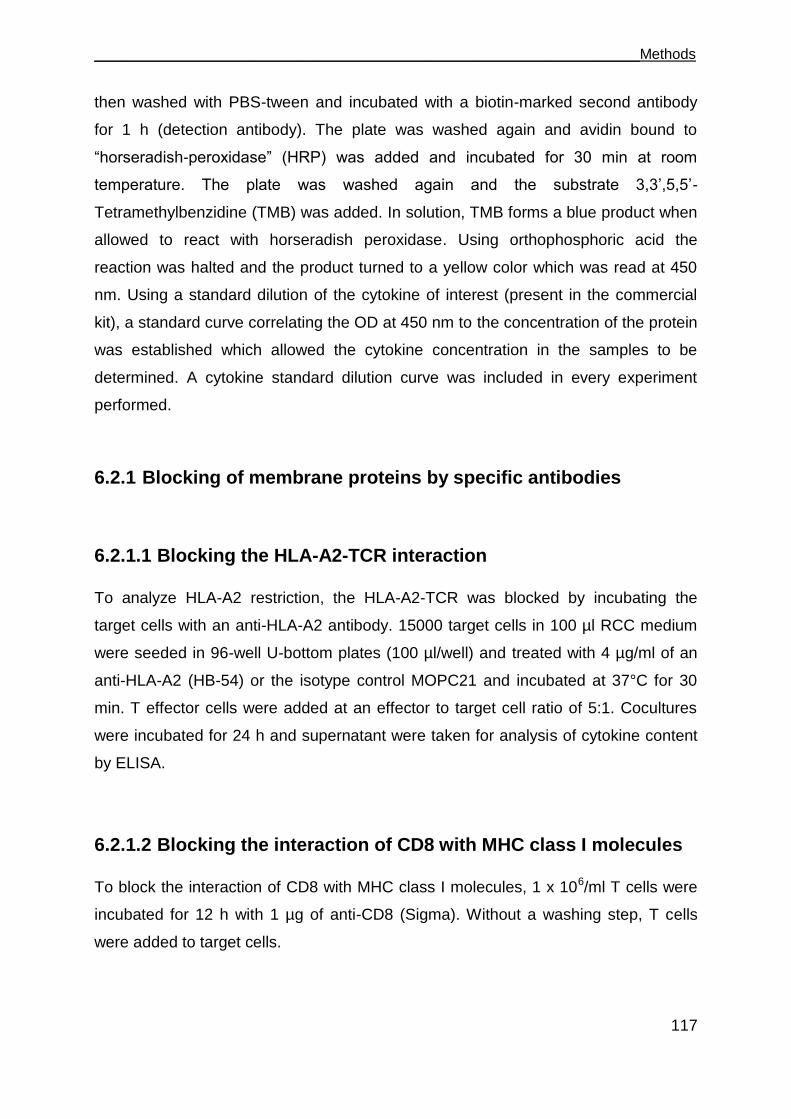
___________________________________________________________________Methods
117
then washed with PBS-tween and incubated with a biotin-marked second antibody
for 1 h (detection antibody). The plate was washed again and avidin bound to
“horseradish-peroxidase” (HRP) was added and incubated for 30 min at room
temperature. The plate was washed again and the substrate 3,3‟,5,5‟-
Tetramethylbenzidine (TMB) was added. In solution, TMB forms a blue product when
allowed to react with horseradish peroxidase. Using orthophosphoric acid the
reaction was halted and the product turned to a yellow color which was read at 450
nm. Using a standard dilution of the cytokine of interest (present in the commercial
kit), a standard curve correlating the OD at 450 nm to the concentration of the protein
was established which allowed the cytokine concentration in the samples to be
determined. A cytokine standard dilution curve was included in every experiment
performed.
6.2.1 Blocking of membrane proteins by specific antibodies
6.2.1.1 Blocking the HLA-A2-TCR interaction
To analyze HLA-A2 restriction, the HLA-A2-TCR was blocked by incubating the
target cells with an anti-HLA-A2 antibody. 15000 target cells in 100 µl RCC medium
were seeded in 96-well U-bottom plates (100 µl/well) and treated with 4 µg/ml of an
anti-HLA-A2 (HB-54) or the isotype control MOPC21 and incubated at 37°C for 30
min. T effector cells were added at an effector to target cell ratio of 5:1. Cocultures
were incubated for 24 h and supernatant were taken for analysis of cytokine content
by ELISA.
6.2.1.2 Blocking the interaction of CD8 with MHC class I molecules
To block the interaction of CD8 with MHC class I molecules, 1 x 10⁶/ml T cells were
incubated for 12 h with 1 µg of anti-CD8 (Sigma). Without a washing step, T cells
were added to target cells.
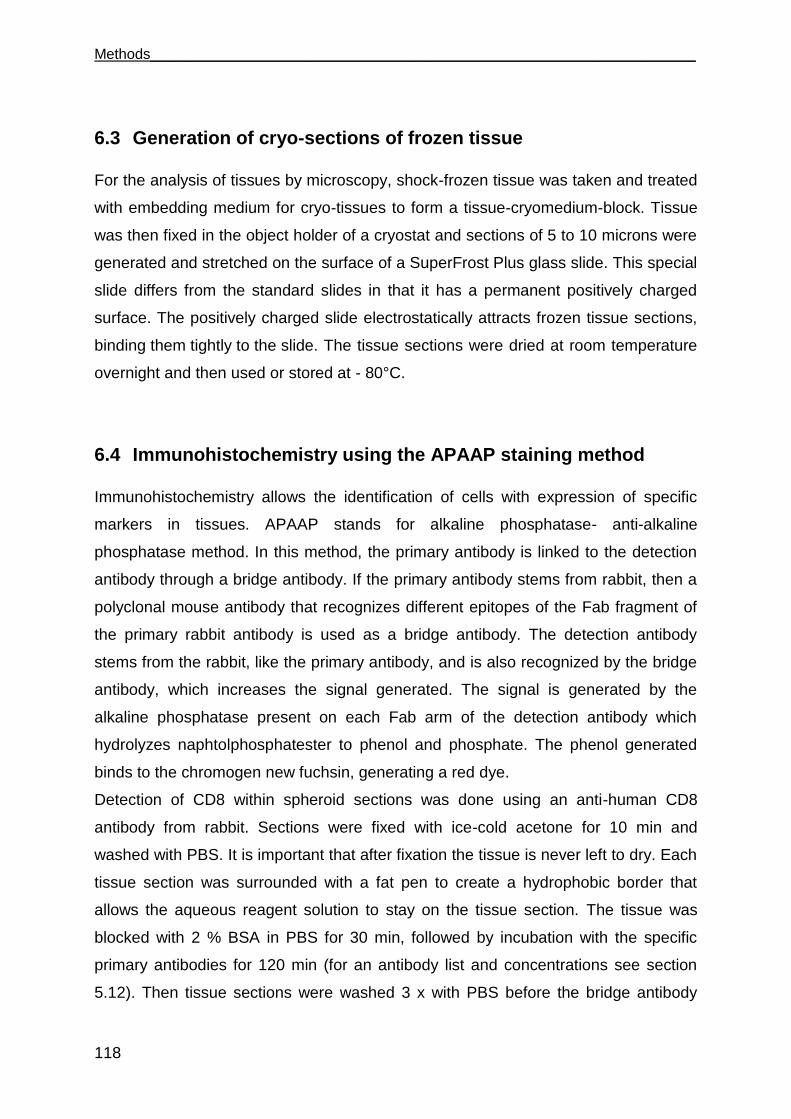
Methods___________________________________________________________________
118
6.3 Generation of cryo-sections of frozen tissue
For the analysis of tissues by microscopy, shock-frozen tissue was taken and treated
with embedding medium for cryo-tissues to form a tissue-cryomedium-block. Tissue
was then fixed in the object holder of a cryostat and sections of 5 to 10 microns were
generated and stretched on the surface of a SuperFrost Plus glass slide. This special
slide differs from the standard slides in that it has a permanent positively charged
surface. The positively charged slide electrostatically attracts frozen tissue sections,
binding them tightly to the slide. The tissue sections were dried at room temperature
overnight and then used or stored at - 80°C.
6.4 Immunohistochemistry using the APAAP staining method
Immunohistochemistry allows the identification of cells with expression of specific
markers in tissues. APAAP stands for alkaline phosphatase- anti-alkaline
phosphatase method. In this method, the primary antibody is linked to the detection
antibody through a bridge antibody. If the primary antibody stems from rabbit, then a
polyclonal mouse antibody that recognizes different epitopes of the Fab fragment of
the primary rabbit antibody is used as a bridge antibody. The detection antibody
stems from the rabbit, like the primary antibody, and is also recognized by the bridge
antibody, which increases the signal generated. The signal is generated by the
alkaline phosphatase present on each Fab arm of the detection antibody which
hydrolyzes naphtolphosphatester to phenol and phosphate. The phenol generated
binds to the chromogen new fuchsin, generating a red dye.
Detection of CD8 within spheroid sections was done using an anti-human CD8
antibody from rabbit. Sections were fixed with ice-cold acetone for 10 min and
washed with PBS. It is important that after fixation the tissue is never left to dry. Each
tissue section was surrounded with a fat pen to create a hydrophobic border that
allows the aqueous reagent solution to stay on the tissue section. The tissue was
blocked with 2 % BSA in PBS for 30 min, followed by incubation with the specific
primary antibodies for 120 min (for an antibody list and concentrations see section
5.12). Then tissue sections were washed 3 x with PBS before the bridge antibody
___________________________________________________________________Methods
119
(1:20) was added. After 30 min, the tissue was washed 3 x with PBS and incubation
for 30 min with the detection APAAP mouse monoclonal (1:40) antibody was done. A
second incubation with the bridge antibody followed and then the detection was
performed, each step lasting 15 min. Tissue sections were washed 3 x with PBS.
After that, the slides containing the tissue sections were incubated for 20 min in the
dark in a cuvette containing the APAAP developing solution (containing new fuchsin).
Tissue sections were washed with PBS and the nuclei were stained with a
hematoxilin solution for 30 s. The sections were washed with bidestilled water and
tap water, respectively. The ions present in the tap water react with the hematoxilin
stain, which can then bind negative charged molecules, like DNA, and therefore the
nuclei appear blue. Slides were covered with a drop of Immomount medium and
sealed with a coverslip and nail polish. For analysis, a light microscope was used.
6.5 Immunofluorescence staining
This technique is used to visualize different cell types or markers and their
subcellular distribution of a biomolecule of interest. Immunofluorescent labeled tissue
sections or cultured cells are studied using a fluorescence microscope or a confocal
microscopy. Most commonly, immunofluorescent staining employs two sets of
antibodies: a primary antibody is used against the antigen of interest; a subsequent,
secondary, dye-coupled antibody is introduced that recognizes the primary antibody.
Several primary antibodies that recognize different antigens can be combined if the
antibodies are derived from different species or are of different isotypes. In a second
step secondary fluorescent labeled antibodies directed against the species or the
isotype are added. In this work, a combination of 3 markers and 4´,6-Diamindino-2-
Phenylindol (DAPI) was mostly used. DAPI stains DNA and is used to visualize the
nuclei.
For the immunostaining of histological sections, slides containing the tissue sections
(stored at - 80°C) were thawed at room temperature for 1 h. Tissue was fixed with
ice-cold acetone for 10 min and blocked for 20 min with 2 % BSA in PBS. All primary
and secondary antibodies were diluted in PBD containing 12.5 % human serum
(Cambrex) and PBS. After fixation the tissue was washed 3 x with PBS and then
incubated for 1 h with the primary antibodies. The following antibody combinations
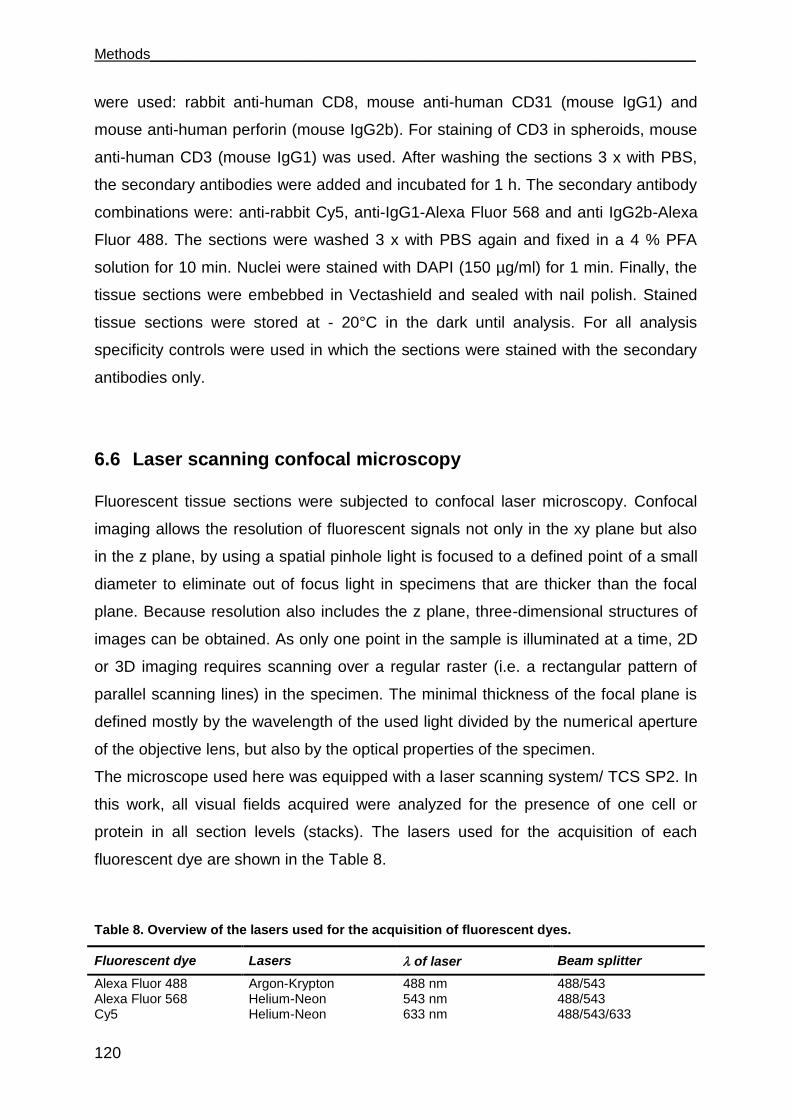
Methods___________________________________________________________________
120
were used: rabbit anti-human CD8, mouse anti-human CD31 (mouse IgG1) and
mouse anti-human perforin (mouse IgG2b). For staining of CD3 in spheroids, mouse
anti-human CD3 (mouse IgG1) was used. After washing the sections 3 x with PBS,
the secondary antibodies were added and incubated for 1 h. The secondary antibody
combinations were: anti-rabbit Cy5, anti-IgG1-Alexa Fluor 568 and anti IgG2b-Alexa
Fluor 488. The sections were washed 3 x with PBS again and fixed in a 4 % PFA
solution for 10 min. Nuclei were stained with DAPI (150 µg/ml) for 1 min. Finally, the
tissue sections were embebbed in Vectashield and sealed with nail polish. Stained
tissue sections were stored at - 20°C in the dark until analysis. For all analysis
specificity controls were used in which the sections were stained with the secondary
antibodies only.
6.6 Laser scanning confocal microscopy
Fluorescent tissue sections were subjected to confocal laser microscopy. Confocal
imaging allows the resolution of fluorescent signals not only in the xy plane but also
in the z plane, by using a spatial pinhole light is focused to a defined point of a small
diameter to eliminate out of focus light in specimens that are thicker than the focal
plane. Because resolution also includes the z plane, three-dimensional structures of
images can be obtained. As only one point in the sample is illuminated at a time, 2D
or 3D imaging requires scanning over a regular raster (i.e. a rectangular pattern of
parallel scanning lines) in the specimen. The minimal thickness of the focal plane is
defined mostly by the wavelength of the used light divided by the numerical aperture
of the objective lens, but also by the optical properties of the specimen.
The microscope used here was equipped with a laser scanning system/ TCS SP2. In
this work, all visual fields acquired were analyzed for the presence of one cell or
protein in all section levels (stacks). The lasers used for the acquisition of each
fluorescent dye are shown in the Table 8.
Table 8. Overview of the lasers used for the acquisition of fluorescent dyes.
Fluorescent dye Lasers of laser Beam splitter
Alexa Fluor 488 Argon-Krypton 488 nm 488/543 Alexa Fluor 568 Helium-Neon 543 nm 488/543 Cy5 Helium-Neon 633 nm 488/543/633
___________________________________________________________________Methods
121
DAPI Diode 405 nm Substrate
6.6.1 Image acquisition and processing
Acquisition of the images was done using a HCX PL APO 63 x 1.40 NA oil immersion
objective lens. Cells were imaged with a pinhole 1.0 Airy units, 512 x 512 pixel image
format, four frame averages and a TD488/568/633 dichroic beam splitter.
Simultaneous image acquisition of samples stained with multiple dyes can result in
crosstalk since all dyes will be excited at the same time. To avoid cross-talk of the
various fluorochromes, the width of the detection channels and filter settings were
carefully controlled, and images for Alexa Fluor 488, Alexa Fluor 568, Cy5 and DAPI
were acquired using sequential image recording. Besides avoiding a cross-talk
among fluorochromes, another advantage of this method is that each sequence can
be recorded using an individual parameter set with optimized performance for each
dye.
For each tissue section, images were recorded at a magnification of 400 x. Stacked
series of confocal single z-planes were taken with a step size of 0.6-0.8 µm to cover
the full thickness of the tissue section. To detect all CD8+ cells with perforin and to
detect whether they were on, inside or outside the vessels, all optical z-planes of
each CD8+ cell were evaluated. For the image presentation contrast and brightness
of the whole image were adjusted with the Leica confocal software LCS Lite.
6.7 Flow cytometry
Flow cytometry is a technique of quantitative single cell analysis. The flow cytometer
was developed in the 1970‟s and rapidly became an essential instrument for the
biologic sciences. The present “state-of-the art” flow cytometers are capable of
analyzing up to 13 parameters (forward scatter, side scatter, 11 colors of immuno-
fluorescence) per cell at rates up to 100,000 cells per second.
6.7.1 Principle of flow cytometry
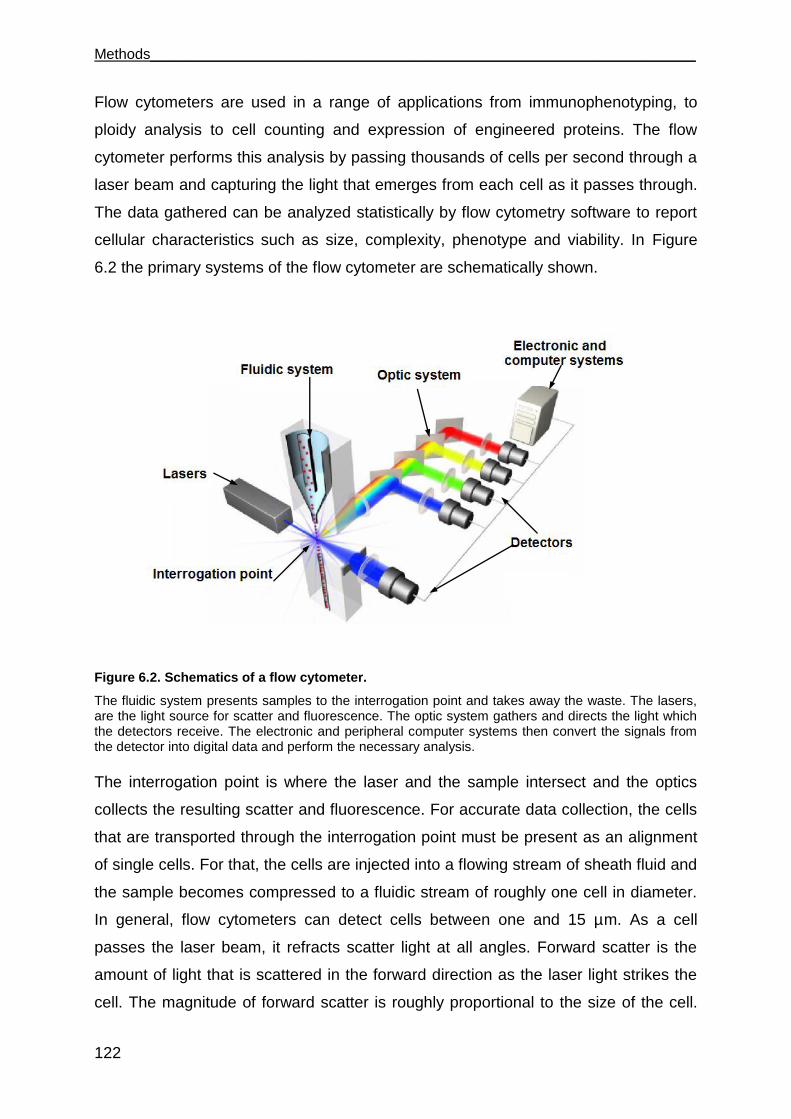
Methods___________________________________________________________________
122
Flow cytometers are used in a range of applications from immunophenotyping, to
ploidy analysis to cell counting and expression of engineered proteins. The flow
cytometer performs this analysis by passing thousands of cells per second through a
laser beam and capturing the light that emerges from each cell as it passes through.
The data gathered can be analyzed statistically by flow cytometry software to report
cellular characteristics such as size, complexity, phenotype and viability. In Figure
6.2 the primary systems of the flow cytometer are schematically shown.
Figure 6.2. Schematics of a flow cytometer.
The fluidic system presents samples to the interrogation point and takes away the waste. The lasers, are the light source for scatter and fluorescence. The optic system gathers and directs the light which the detectors receive. The electronic and peripheral computer systems then convert the signals from the detector into digital data and perform the necessary analysis.
The interrogation point is where the laser and the sample intersect and the optics
collects the resulting scatter and fluorescence. For accurate data collection, the cells
that are transported through the interrogation point must be present as an alignment
of single cells. For that, the cells are injected into a flowing stream of sheath fluid and
the sample becomes compressed to a fluidic stream of roughly one cell in diameter.
In general, flow cytometers can detect cells between one and 15 µm. As a cell
passes the laser beam, it refracts scatter light at all angles. Forward scatter is the
amount of light that is scattered in the forward direction as the laser light strikes the
cell. The magnitude of forward scatter is roughly proportional to the size of the cell.
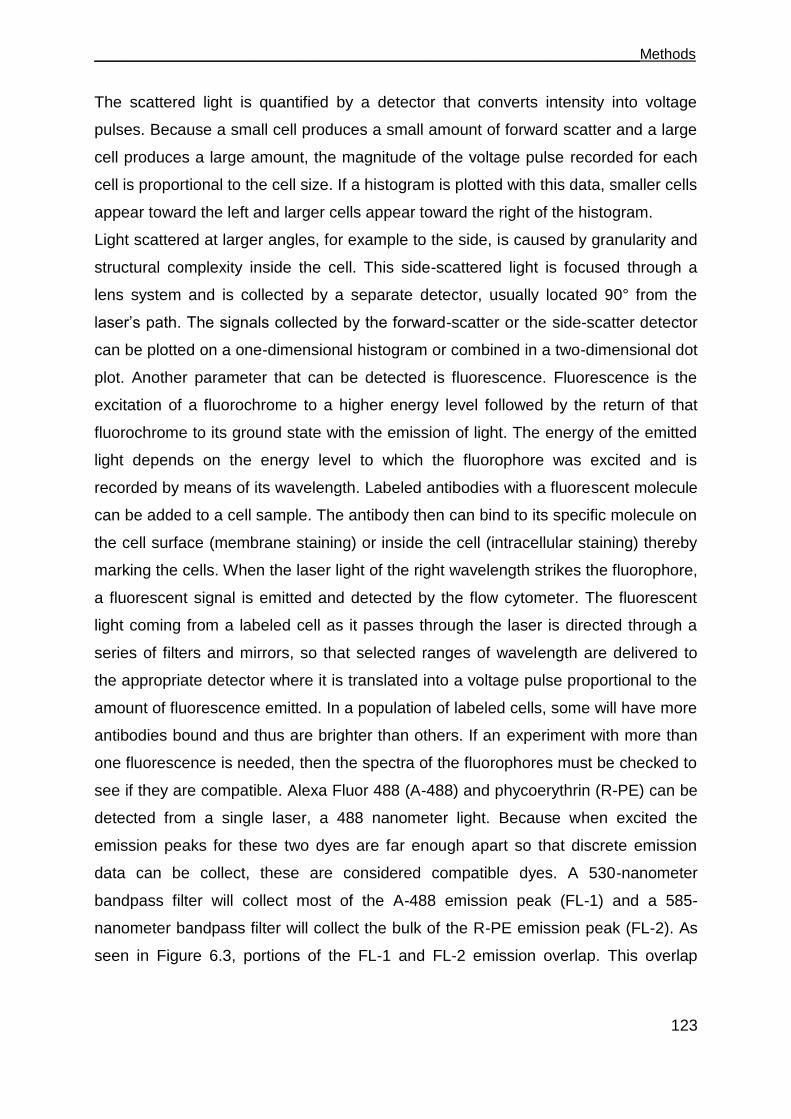
___________________________________________________________________Methods
123
The scattered light is quantified by a detector that converts intensity into voltage
pulses. Because a small cell produces a small amount of forward scatter and a large
cell produces a large amount, the magnitude of the voltage pulse recorded for each
cell is proportional to the cell size. If a histogram is plotted with this data, smaller cells
appear toward the left and larger cells appear toward the right of the histogram.
Light scattered at larger angles, for example to the side, is caused by granularity and
structural complexity inside the cell. This side-scattered light is focused through a
lens system and is collected by a separate detector, usually located 90° from the
laser‟s path. The signals collected by the forward-scatter or the side-scatter detector
can be plotted on a one-dimensional histogram or combined in a two-dimensional dot
plot. Another parameter that can be detected is fluorescence. Fluorescence is the
excitation of a fluorochrome to a higher energy level followed by the return of that
fluorochrome to its ground state with the emission of light. The energy of the emitted
light depends on the energy level to which the fluorophore was excited and is
recorded by means of its wavelength. Labeled antibodies with a fluorescent molecule
can be added to a cell sample. The antibody then can bind to its specific molecule on
the cell surface (membrane staining) or inside the cell (intracellular staining) thereby
marking the cells. When the laser light of the right wavelength strikes the fluorophore,
a fluorescent signal is emitted and detected by the flow cytometer. The fluorescent
light coming from a labeled cell as it passes through the laser is directed through a
series of filters and mirrors, so that selected ranges of wavelength are delivered to
the appropriate detector where it is translated into a voltage pulse proportional to the
amount of fluorescence emitted. In a population of labeled cells, some will have more
antibodies bound and thus are brighter than others. If an experiment with more than
one fluorescence is needed, then the spectra of the fluorophores must be checked to
see if they are compatible. Alexa Fluor 488 (A-488) and phycoerythrin (R-PE) can be
detected from a single laser, a 488 nanometer light. Because when excited the
emission peaks for these two dyes are far enough apart so that discrete emission
data can be collect, these are considered compatible dyes. A 530-nanometer
bandpass filter will collect most of the A-488 emission peak (FL-1) and a 585-
nanometer bandpass filter will collect the bulk of the R-PE emission peak (FL-2). As
seen in Figure 6.3, portions of the FL-1 and FL-2 emission overlap. This overlap
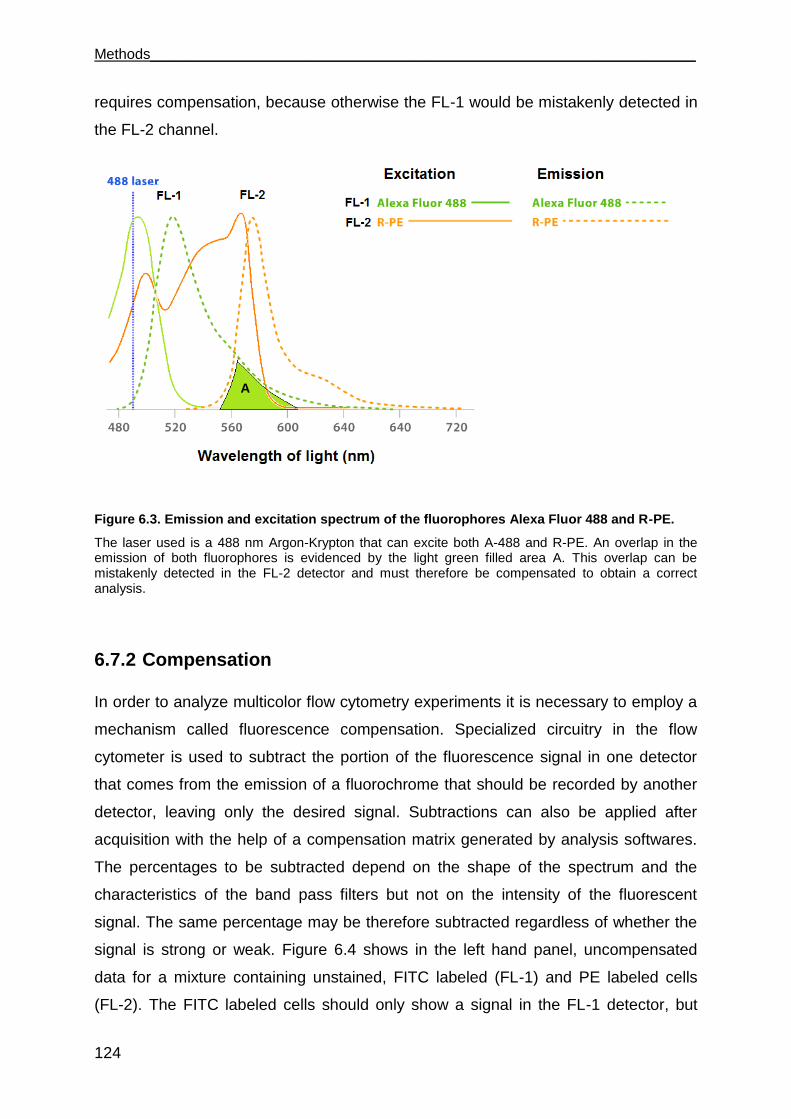
Methods___________________________________________________________________
124
requires compensation, because otherwise the FL-1 would be mistakenly detected in
the FL-2 channel.
Figure 6.3. Emission and excitation spectrum of the fluorophores Alexa Fluor 488 and R-PE.
The laser used is a 488 nm Argon-Krypton that can excite both A-488 and R-PE. An overlap in the emission of both fluorophores is evidenced by the light green filled area A. This overlap can be mistakenly detected in the FL-2 detector and must therefore be compensated to obtain a correct analysis.
6.7.2 Compensation
In order to analyze multicolor flow cytometry experiments it is necessary to employ a
mechanism called fluorescence compensation. Specialized circuitry in the flow
cytometer is used to subtract the portion of the fluorescence signal in one detector
that comes from the emission of a fluorochrome that should be recorded by another
detector, leaving only the desired signal. Subtractions can also be applied after
acquisition with the help of a compensation matrix generated by analysis softwares.
The percentages to be subtracted depend on the shape of the spectrum and the
characteristics of the band pass filters but not on the intensity of the fluorescent
signal. The same percentage may be therefore subtracted regardless of whether the
signal is strong or weak. Figure 6.4 shows in the left hand panel, uncompensated
data for a mixture containing unstained, FITC labeled (FL-1) and PE labeled cells
(FL-2). The FITC labeled cells should only show a signal in the FL-1 detector, but
A
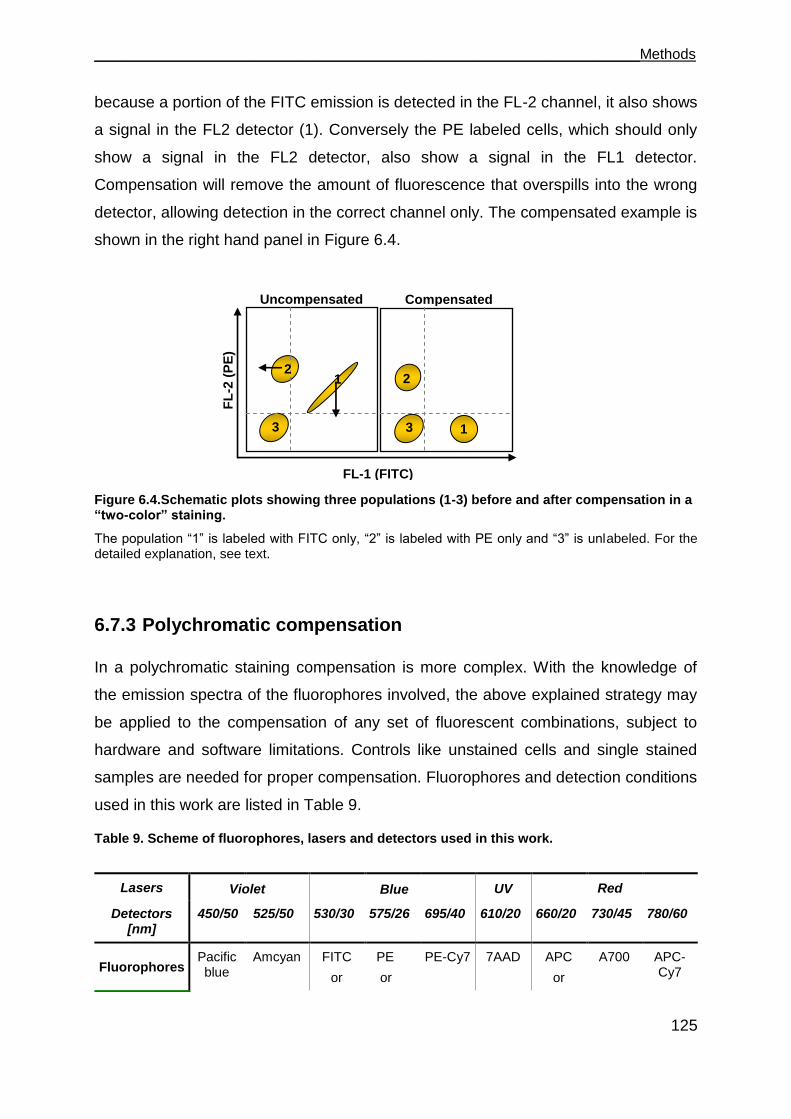
___________________________________________________________________Methods
125
because a portion of the FITC emission is detected in the FL-2 channel, it also shows
a signal in the FL2 detector (1). Conversely the PE labeled cells, which should only
show a signal in the FL2 detector, also show a signal in the FL1 detector.
Compensation will remove the amount of fluorescence that overspills into the wrong
detector, allowing detection in the correct channel only. The compensated example is
shown in the right hand panel in Figure 6.4.
Figure 6.4.Schematic plots showing three populations (1-3) before and after compensation in a “two-color” staining.
The population “1” is labeled with FITC only, “2” is labeled with PE only and “3” is unlabeled. For the detailed explanation, see text.
6.7.3 Polychromatic compensation
In a polychromatic staining compensation is more complex. With the knowledge of
the emission spectra of the fluorophores involved, the above explained strategy may
be applied to the compensation of any set of fluorescent combinations, subject to
hardware and software limitations. Controls like unstained cells and single stained
samples are needed for proper compensation. Fluorophores and detection conditions
used in this work are listed in Table 9.
Table 9. Scheme of fluorophores, lasers and detectors used in this work.
Lasers
Detectors [nm]
450/50 525/50 530/30 575/26 695/40 610/20 660/20 730/45 780/60
Fluorophores Pacific blue
Amcyan FITC
or
PE
or
PE-Cy7 7AAD APC
or
A700 APC-Cy7
Compensated
FL-1 (FITC)
2
2
1
1
3
3
Violet Red Blue UV
Uncompensated
FL
-2 (
PE
)
2 1
3
FL-1 (FITC)
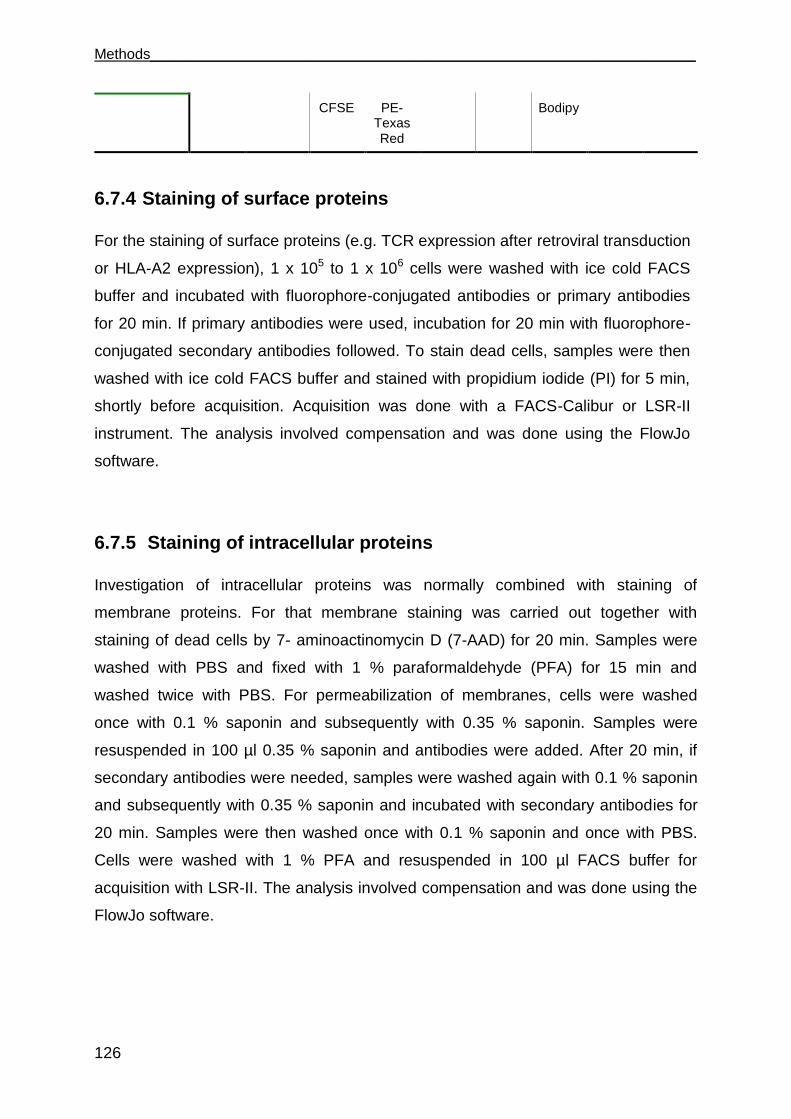
Methods___________________________________________________________________
126
CFSE PE-Texas Red
Bodipy
6.7.4 Staining of surface proteins
For the staining of surface proteins (e.g. TCR expression after retroviral transduction
or HLA-A2 expression), 1 x 10⁵ to 1 x 10⁶ cells were washed with ice cold FACS
buffer and incubated with fluorophore-conjugated antibodies or primary antibodies
for 20 min. If primary antibodies were used, incubation for 20 min with fluorophore-
conjugated secondary antibodies followed. To stain dead cells, samples were then
washed with ice cold FACS buffer and stained with propidium iodide (PI) for 5 min,
shortly before acquisition. Acquisition was done with a FACS-Calibur or LSR-II
instrument. The analysis involved compensation and was done using the FlowJo
software.
6.7.5 Staining of intracellular proteins
Investigation of intracellular proteins was normally combined with staining of
membrane proteins. For that membrane staining was carried out together with
staining of dead cells by 7- aminoactinomycin D (7-AAD) for 20 min. Samples were
washed with PBS and fixed with 1 % paraformaldehyde (PFA) for 15 min and
washed twice with PBS. For permeabilization of membranes, cells were washed
once with 0.1 % saponin and subsequently with 0.35 % saponin. Samples were
resuspended in 100 µl 0.35 % saponin and antibodies were added. After 20 min, if
secondary antibodies were needed, samples were washed again with 0.1 % saponin
and subsequently with 0.35 % saponin and incubated with secondary antibodies for
20 min. Samples were then washed once with 0.1 % saponin and once with PBS.
Cells were washed with 1 % PFA and resuspended in 100 µl FACS buffer for
acquisition with LSR-II. The analysis involved compensation and was done using the
FlowJo software.
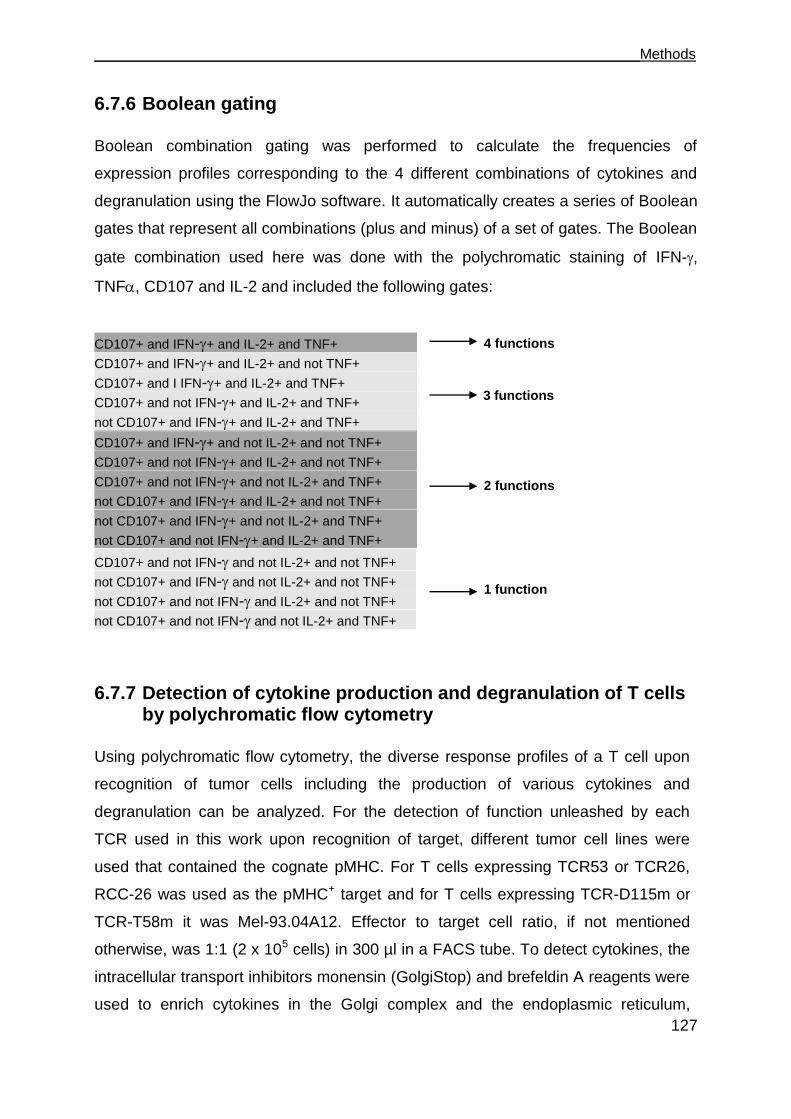
___________________________________________________________________Methods
127
6.7.6 Boolean gating
Boolean combination gating was performed to calculate the frequencies of
expression profiles corresponding to the 4 different combinations of cytokines and
degranulation using the FlowJo software. It automatically creates a series of Boolean
gates that represent all combinations (plus and minus) of a set of gates. The Boolean
gate combination used here was done with the polychromatic staining of IFN-,
TNF, CD107 and IL-2 and included the following gates:
CD107+ and IFN-+ and IL-2+ and TNF+
CD107+ and IFN-+ and IL-2+ and not TNF+
CD107+ and I IFN-+ and IL-2+ and TNF+
CD107+ and not IFN-+ and IL-2+ and TNF+
not CD107+ and IFN-+ and IL-2+ and TNF+
CD107+ and IFN-+ and not IL-2+ and not TNF+
CD107+ and not IFN-+ and IL-2+ and not TNF+
CD107+ and not IFN-+ and not IL-2+ and TNF+
not CD107+ and IFN-+ and IL-2+ and not TNF+
not CD107+ and IFN-+ and not IL-2+ and TNF+
not CD107+ and not IFN-+ and IL-2+ and TNF+
CD107+ and not IFN- and not IL-2+ and not TNF+
not CD107+ and IFN- and not IL-2+ and not TNF+
not CD107+ and not IFN- and IL-2+ and not TNF+
not CD107+ and not IFN- and not IL-2+ and TNF+
6.7.7 Detection of cytokine production and degranulation of T cells by polychromatic flow cytometry
Using polychromatic flow cytometry, the diverse response profiles of a T cell upon
recognition of tumor cells including the production of various cytokines and
degranulation can be analyzed. For the detection of function unleashed by each
TCR used in this work upon recognition of target, different tumor cell lines were
used that contained the cognate pMHC. For T cells expressing TCR53 or TCR26,
RCC-26 was used as the pMHC+ target and for T cells expressing TCR-D115m or
TCR-T58m it was Mel-93.04A12. Effector to target cell ratio, if not mentioned
otherwise, was 1:1 (2 x 10⁵ cells) in 300 µl in a FACS tube. To detect cytokines, the
intracellular transport inhibitors monensin (GolgiStop) and brefeldin A reagents were
used to enrich cytokines in the Golgi complex and the endoplasmic reticulum,
4 functions
3 functions
2 functions
1 function

Methods___________________________________________________________________
128
respectively. Both transport reagents were added at 2 µM to the target/effector cell
cultures. Incubation was done for 4 or 5 h in 300 µl RCC medium in the incubator.
To detect degranulation, the antibodies CD107a and CD107b were present during
the 4-5 h incubation time. The tubes were then removed from the incubator and
washed with ice cold FACS buffer and then stained with fluorescent labeled
antibodies to cell surface molecules (CD45 and CD4) and with 7-AAD for 20 min.
Cells were then fixed and made permeable (see section 6.7.5) and stained with
antibodies to IL-2, IFN-, TNF-, CD8 and TCR for 20 min. Acquisition was done
using the LSR II flow cytometer. The analysis involved compensation and was done
using the FlowJo software.
6.7.8 Generation of tumor cell spheroids
Spheroids were generated using the liquid overlay culture technique [131]. For that,
48-well plates were coated with 150 µl 1 % Seaplaque agarose in RPMI medium. To
generate a meniscus in which cells could aggregate, plates were rotated 360° in an
inclination of approximated 90° in a vertical orientation 15 times, while the agarose
was still fluid (Figure 6.5a and b). Then the plate was placed on a horizontal position
for 20 min to allow the agarose to become solid. RCC cells from exponentially
growing monolayers were detached from the culture flasks with 5 mM EDTA,
resuspended in RCC medium, centrifuged and washed once with RPMI medium.
Cells were resuspended at 1 x 10⁵ cells/500 µl RPMI medium and put into the wells
coated with agarose. Plates were centrifuged at 1500 rpm, for 5 min and placed in
the incubator. Spheroids were grown for 4-5 days at 37°C and 6.5 % CO2. After 4-5
days, cells had formed tight aggregates and they were ready to use for coculture with
T cells.
6.7.9 Coculture of T cells with tumor cell spheroids
On the inside of a petri-dish lid, circles were drawn with a fat pen and allowed to dry
for 5 min at room temperature. Spheroids were taken out of the 48-well plate,
washed carefully with RPMI medium to remove cells that did not attach and placed in
the fat circles on the lid of the petri-dish. A drop (20 µl) of T cell medium
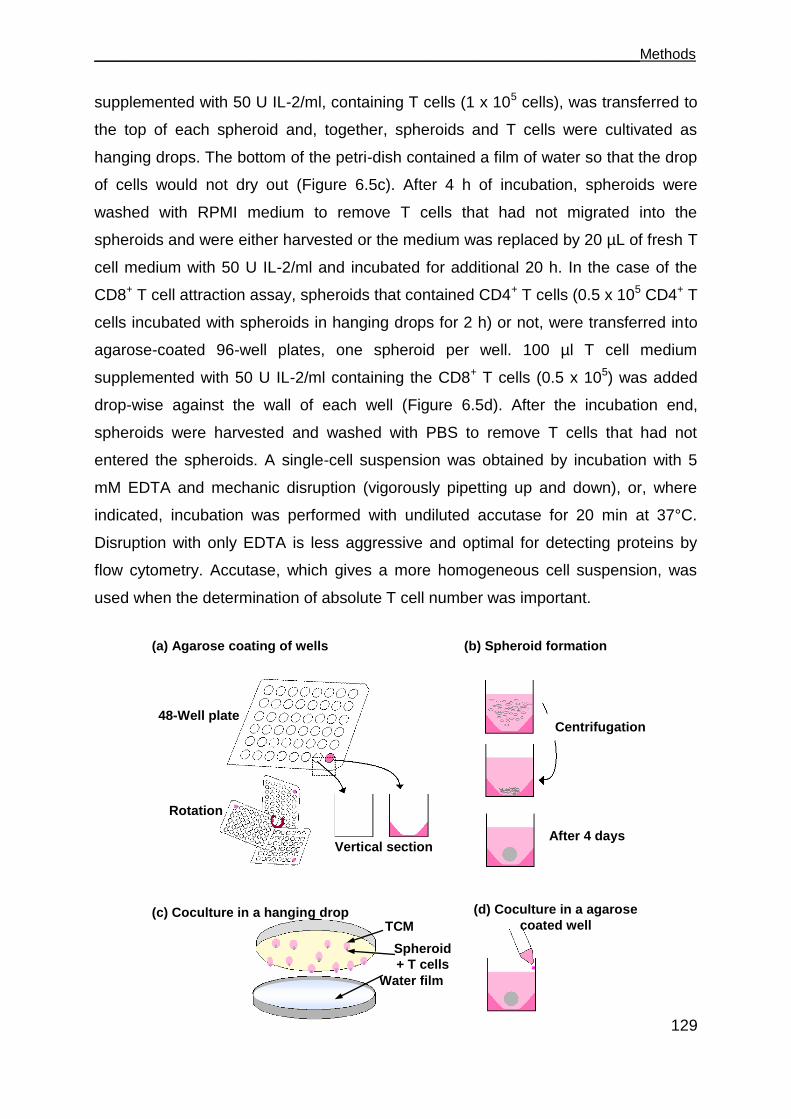
___________________________________________________________________Methods
129
supplemented with 50 U IL-2/ml, containing T cells (1 x 10⁵ cells), was transferred to
the top of each spheroid and, together, spheroids and T cells were cultivated as
hanging drops. The bottom of the petri-dish contained a film of water so that the drop
of cells would not dry out (Figure 6.5c). After 4 h of incubation, spheroids were
washed with RPMI medium to remove T cells that had not migrated into the
spheroids and were either harvested or the medium was replaced by 20 µL of fresh T
cell medium with 50 U IL-2/ml and incubated for additional 20 h. In the case of the
CD8+ T cell attraction assay, spheroids that contained CD4+ T cells (0.5 x 10⁵ CD4+ T
cells incubated with spheroids in hanging drops for 2 h) or not, were transferred into
agarose-coated 96-well plates, one spheroid per well. 100 µl T cell medium
supplemented with 50 U IL-2/ml containing the CD8+ T cells (0.5 x 10⁵) was added
drop-wise against the wall of each well (Figure 6.5d). After the incubation end,
spheroids were harvested and washed with PBS to remove T cells that had not
entered the spheroids. A single-cell suspension was obtained by incubation with 5
mM EDTA and mechanic disruption (vigorously pipetting up and down), or, where
indicated, incubation was performed with undiluted accutase for 20 min at 37°C.
Disruption with only EDTA is less aggressive and optimal for detecting proteins by
flow cytometry. Accutase, which gives a more homogeneous cell suspension, was
used when the determination of absolute T cell number was important.
48-Well plate
(a) Agarose coating of wells (b) Spheroid formation
(c) Coculture in a hanging drop (d) Coculture in a agarose
coated well
Rotation
Vertical section
Centrifugation
Water film
After 4 days
TCM
Spheroid
+ T cells
Methods___________________________________________________________________
130
Figure 6.5. Generation of spheroids and coculture with T cells.
In (a) the coating of 48-well plates with agarose is demonstrated. In (b), the formation of spheroids is depicted. In (c), the cultivation of spheroids with T cells in hanging drops is shown and in (d), the coculture of spheroids with T cells in wells is schematically shown. For detailed explanation see text.
6.7.9.1 Generation of multicellular spheroids using two RCC cell lines stained with two different fluorescent dyes
To stain RCC cells, Bodipy-methyl bromide and CFDA-SE dyes were used. Bodipy-
methyl bromide penetrates through the cell membrane of viable cells and diffuses
into the cytoplasm where it reacts with thiol groups to form a complex that can no
longer diffuse through the membrane anymore. The maximum emission of Bodipy
630/650-methyl bromide is 640 nm. CFDA-SE, due to its acetate groups, is highly
cell permeable, it is non-fluorescent but when it enters the cytoplasm of cells,
intracellular esterases remove the acetate groups and convert the molecule to the
fluorescent ester, CFSE, which is retained within cells and covalently couples, via its
succinimidyl group, to intracellular molecules. Due to this covalent coupling reaction
fluorescent CFSE can be retained within cells for extremely long periods. Also, due to
this stable linkage, once incorporated within cells the dye is not transferred to
adjacent cells.
RCC-26 and KT-195 cells from exponentially growing monolayer cultures were
detached from the culture flasks with 5 mM EDTA and washed once with RPMI. KT-
195 was stained in RPMI with 1 mM/ 2 x 10⁶/ ml cells carboxyfluorescein diacetate
succinimidyl ester (CFDA-SE) for 8 min at 37°C and RCC-26 was stained in RPMI
with 1 mM/ ml/ 1x10⁶ cells Bodipy, for 15 min at 37°C. Both stained RCC-26 and KT-
195 were incubated with 1 volume of FCS at room temperature for 5 min, then
washed with RPMI and resuspended in RCC medium. The stained cultures stayed in
the incubator, protected from light, for at least 2 hours before they were taken to
generate multicellular spheroids. The incubation with medium containing FCS was
necessary and indispensable to avoid the presence of residual dye in the medium
that would then label other cells in the subsequent coculture. Cells were washed
again with RPMI and 0.5 x 10⁵ cells of each RCC-26 and KT-195 were mixed and
resuspended in 500 µl RPMI medium and put in agarose coated wells and
centrifuged at 1500 rpm for 5 min to allow spheroid formation.
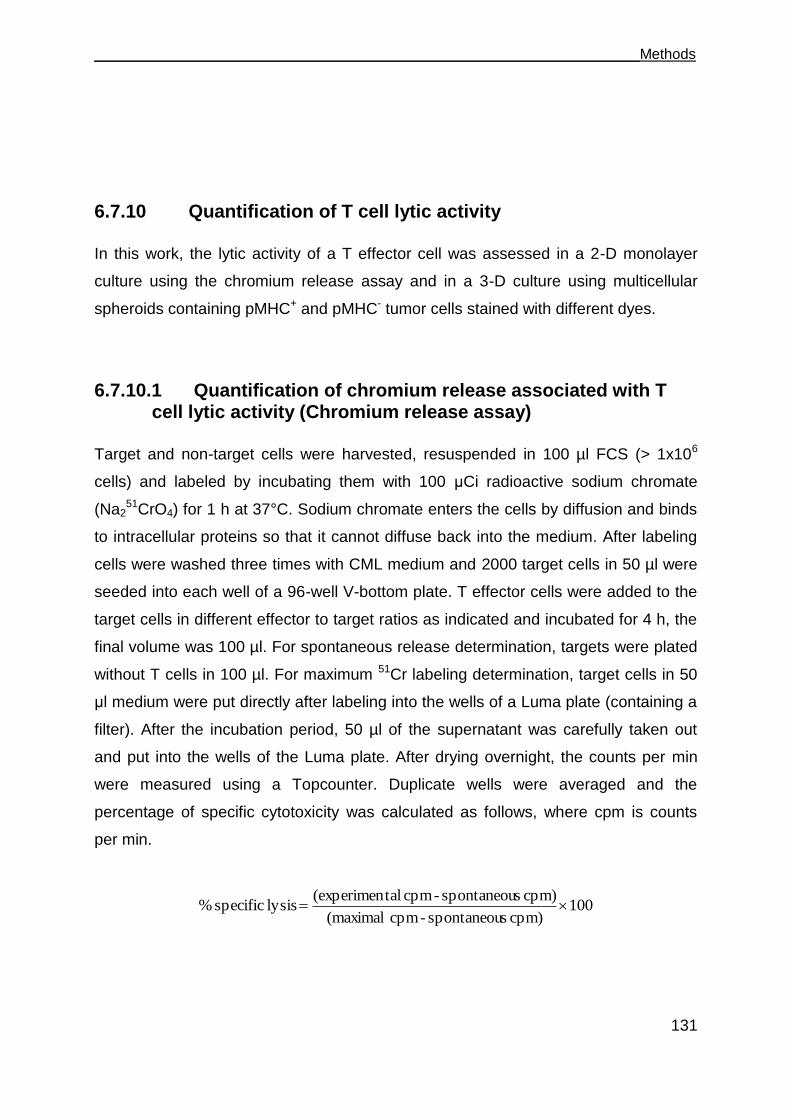
___________________________________________________________________Methods
131
6.7.10 Quantification of T cell lytic activity
In this work, the lytic activity of a T effector cell was assessed in a 2-D monolayer
culture using the chromium release assay and in a 3-D culture using multicellular
spheroids containing pMHC+ and pMHC- tumor cells stained with different dyes.
6.7.10.1 Quantification of chromium release associated with T cell lytic activity (Chromium release assay)
Target and non-target cells were harvested, resuspended in 100 µl FCS (> 1x10⁶
cells) and labeled by incubating them with 100 μCi radioactive sodium chromate
(Na251CrO4) for 1 h at 37°C. Sodium chromate enters the cells by diffusion and binds
to intracellular proteins so that it cannot diffuse back into the medium. After labeling
cells were washed three times with CML medium and 2000 target cells in 50 µl were
seeded into each well of a 96-well V-bottom plate. T effector cells were added to the
target cells in different effector to target ratios as indicated and incubated for 4 h, the
final volume was 100 µl. For spontaneous release determination, targets were plated
without T cells in 100 µl. For maximum 51Cr labeling determination, target cells in 50
μl medium were put directly after labeling into the wells of a Luma plate (containing a
filter). After the incubation period, 50 µl of the supernatant was carefully taken out
and put into the wells of the Luma plate. After drying overnight, the counts per min
were measured using a Topcounter. Duplicate wells were averaged and the
percentage of specific cytotoxicity was calculated as follows, where cpm is counts
per min.
100cpm) sspontaneou - cpm (maximal
cpm) sspontaneou - cpm tal(experimenlysis specific %
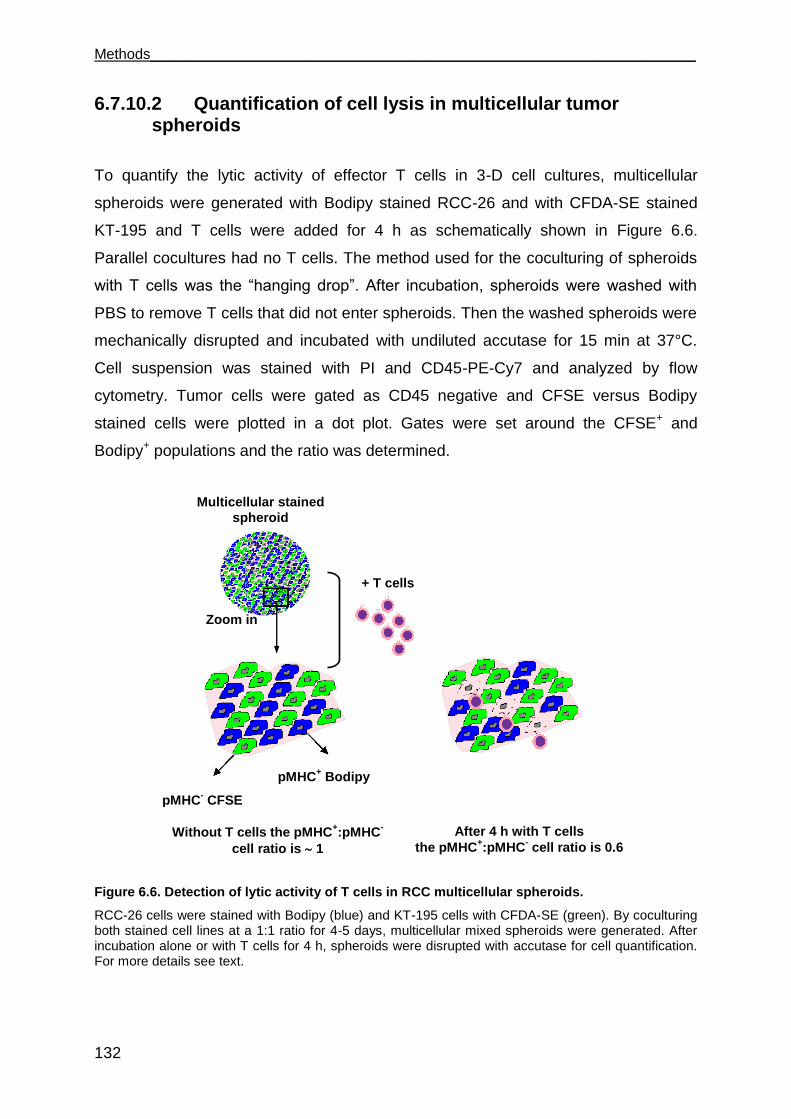
Methods___________________________________________________________________
132
6.7.10.2 Quantification of cell lysis in multicellular tumor spheroids
To quantify the lytic activity of effector T cells in 3-D cell cultures, multicellular
spheroids were generated with Bodipy stained RCC-26 and with CFDA-SE stained
KT-195 and T cells were added for 4 h as schematically shown in Figure 6.6.
Parallel cocultures had no T cells. The method used for the coculturing of spheroids
with T cells was the “hanging drop”. After incubation, spheroids were washed with
PBS to remove T cells that did not enter spheroids. Then the washed spheroids were
mechanically disrupted and incubated with undiluted accutase for 15 min at 37°C.
Cell suspension was stained with PI and CD45-PE-Cy7 and analyzed by flow
cytometry. Tumor cells were gated as CD45 negative and CFSE versus Bodipy
stained cells were plotted in a dot plot. Gates were set around the CFSE+ and
Bodipy+ populations and the ratio was determined.
Figure 6.6. Detection of lytic activity of T cells in RCC multicellular spheroids.
RCC-26 cells were stained with Bodipy (blue) and KT-195 cells with CFDA-SE (green). By coculturing both stained cell lines at a 1:1 ratio for 4-5 days, multicellular mixed spheroids were generated. After incubation alone or with T cells for 4 h, spheroids were disrupted with accutase for cell quantification. For more details see text.
Multicellular stained
spheroid
Zoom in
+ T cells
pMHC+ Bodipy
pMHC- CFSE
Without T cells the pMHC+:pMHC
-
cell ratio is 1
After 4 h with T cells
the pMHC+:pMHC
- cell ratio is 0.6
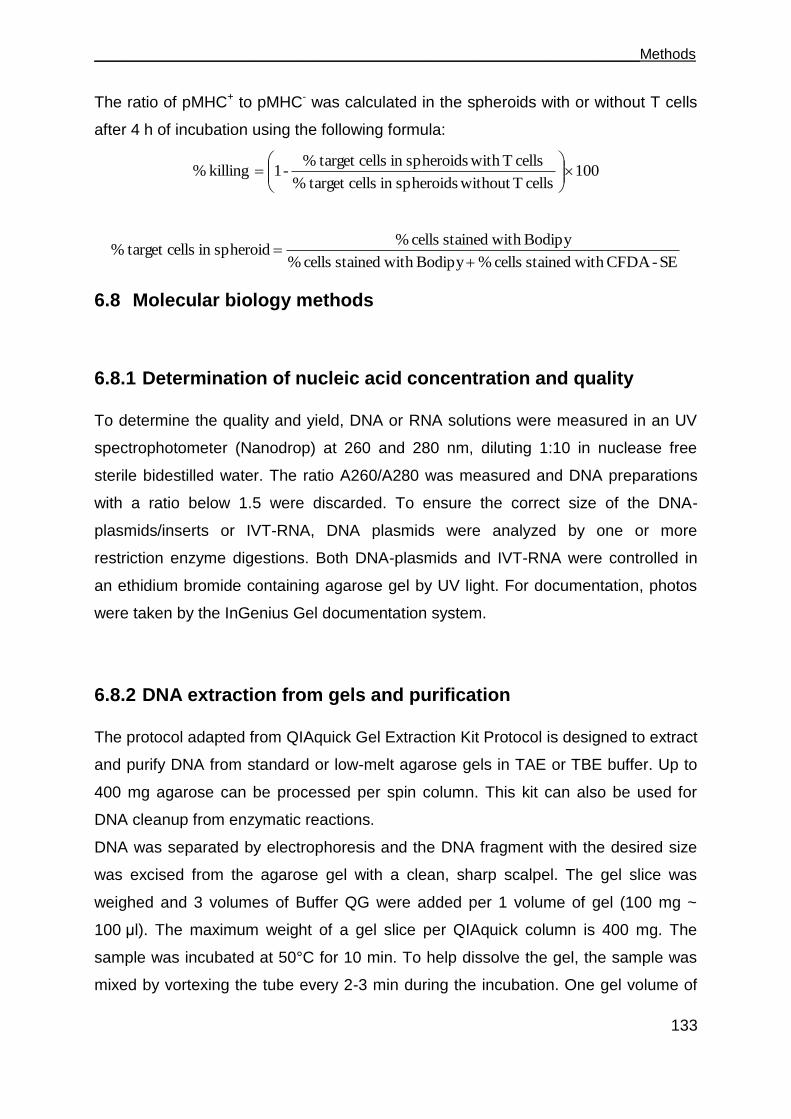
___________________________________________________________________Methods
133
The ratio of pMHC+ to pMHC- was calculated in the spheroids with or without T cells
after 4 h of incubation using the following formula:
100cells T without spheroidsin cells target %
cells T with spheroidsin cells target %-1killing %
SE -CFDA with stained cells % Bodipy with stained cells %
Bodipy with stained cells %spheroidin cells target %
6.8 Molecular biology methods
6.8.1 Determination of nucleic acid concentration and quality
To determine the quality and yield, DNA or RNA solutions were measured in an UV
spectrophotometer (Nanodrop) at 260 and 280 nm, diluting 1:10 in nuclease free
sterile bidestilled water. The ratio A260/A280 was measured and DNA preparations
with a ratio below 1.5 were discarded. To ensure the correct size of the DNA-
plasmids/inserts or IVT-RNA, DNA plasmids were analyzed by one or more
restriction enzyme digestions. Both DNA-plasmids and IVT-RNA were controlled in
an ethidium bromide containing agarose gel by UV light. For documentation, photos
were taken by the InGenius Gel documentation system.
6.8.2 DNA extraction from gels and purification
The protocol adapted from QIAquick Gel Extraction Kit Protocol is designed to extract
and purify DNA from standard or low-melt agarose gels in TAE or TBE buffer. Up to
400 mg agarose can be processed per spin column. This kit can also be used for
DNA cleanup from enzymatic reactions.
DNA was separated by electrophoresis and the DNA fragment with the desired size
was excised from the agarose gel with a clean, sharp scalpel. The gel slice was
weighed and 3 volumes of Buffer QG were added per 1 volume of gel (100 mg ~
100 μl). The maximum weight of a gel slice per QIAquick column is 400 mg. The
sample was incubated at 50°C for 10 min. To help dissolve the gel, the sample was
mixed by vortexing the tube every 2-3 min during the incubation. One gel volume of
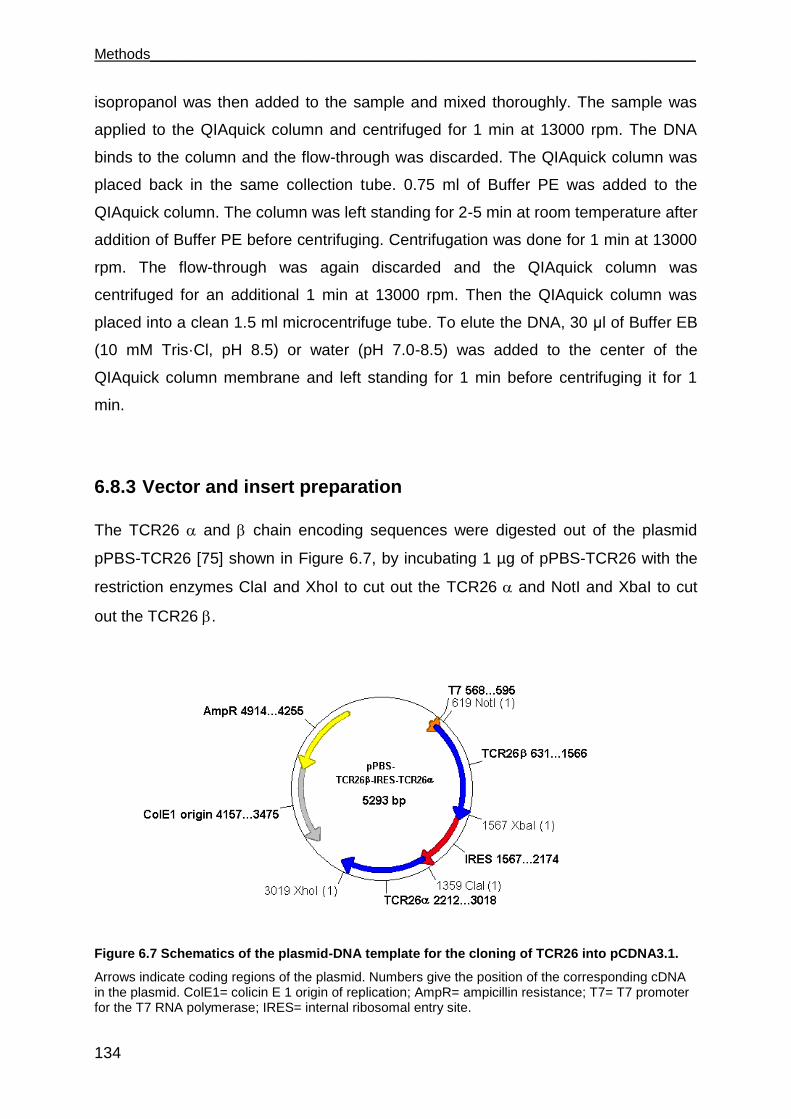
Methods___________________________________________________________________
134
isopropanol was then added to the sample and mixed thoroughly. The sample was
applied to the QIAquick column and centrifuged for 1 min at 13000 rpm. The DNA
binds to the column and the flow-through was discarded. The QIAquick column was
placed back in the same collection tube. 0.75 ml of Buffer PE was added to the
QIAquick column. The column was left standing for 2-5 min at room temperature after
addition of Buffer PE before centrifuging. Centrifugation was done for 1 min at 13000
rpm. The flow-through was again discarded and the QIAquick column was
centrifuged for an additional 1 min at 13000 rpm. Then the QIAquick column was
placed into a clean 1.5 ml microcentrifuge tube. To elute the DNA, 30 μl of Buffer EB
(10 mM Tris·Cl, pH 8.5) or water (pH 7.0-8.5) was added to the center of the
QIAquick column membrane and left standing for 1 min before centrifuging it for 1
min.
6.8.3 Vector and insert preparation
The TCR26 and chain encoding sequences were digested out of the plasmid
pPBS-TCR26 [75] shown in Figure 6.7, by incubating 1 µg of pPBS-TCR26 with the
restriction enzymes ClaI and XhoI to cut out the TCR26 and NotI and XbaI to cut
out the TCR26 .
Figure 6.7 Schematics of the plasmid-DNA template for the cloning of TCR26 into pCDNA3.1.
Arrows indicate coding regions of the plasmid. Numbers give the position of the corresponding cDNA in the plasmid. ColE1= colicin E 1 origin of replication; AmpR= ampicillin resistance; T7= T7 promoter for the T7 RNA polymerase; IRES= internal ribosomal entry site.
___________________________________________________________________Methods
135
The enzymes and the buffer system used were from fermentas. pCDNA3.1, the
plasmid in which TCR26 chain or chain sequences were to be cloned, was
digested with ClaI and XhoI (to receive TCR26 ) or with NotI and XbaI (to receive
TCR26 ). The plasmid digestion reaction was done with 1 μg of plasmid-DNA. 5-10
U of restriction enzymes, 1 x enzyme buffer and sterile water up to 30 μl were added
to the plasmid in a 1.5 ml tube and incubated in a thermo block at 37°C overnight.
After digestion, inactivation of the enzyme was performed at 65°C for 15 min.
Digested pPBS-TCR26 and pCDNA3.1 were run in a gel electrophoresis and purified
from the agarose gels using the QIAquick gel extraction kit protocol (for details see
section 6.8.2), performed according to the manufacturer‟s instructions. The DNA was
precipitated with 2 vol of 100 % Ethanol, 1/10 vol of a 3 M sodium acetate pH 5.3
solution and mixed thoroughly. The reaction was chilled at - 20°C for 20 min. The
reaction was then pelleted for 15 min at 13000 rpm at 4°C. The supernatant was
carefully taken out and washed with 100 µl of 70 % ethanol. The washed DNA was
centrifuged at 13000 4°C for 10 min and then the fluid was removed and the pellet
dried at RT for 10-20 min. The DNA pellet was resuspended in nucleic acid free
sterile water and stored at - 20°C until use.
6.8.4 Ligation of plasmid vector and insert DNAs
After the vector and insert DNAs were purified, the concentration of DNA was
estimated by agarose gel electrophoresis in comparison to a molecular weight
standard. The ligation was performed using T4 DNA Ligase at room temperature for
2 h or at 16°C overnight, with a molar ratio of vector to insert of 1:3 in a final volume
of 10 µl as follows:
1-2 µl of vector (50 to 200 ng)
1-2 µl of insert (1:3 molar ratio of vector to insert)
2 µl of DNA Ligase buffer (5 x)
1 µl T4 DNA Ligase
DEPC treated water to 10 µl

Methods___________________________________________________________________
136
6.8.5 Transformation of ligation products into bacteria
2 µl of the ligation reaction of pCDNA3.1 and TCR26 chain or pCDNA3.1 and
TCR26 chain was electroporated into electrocompetent XLI E. coli. To monitor the
frequency of auto-ligation of the vector pCDNA3.1, the linear vector was transformed
in the absence of the DNA insert. To control the quality of the selection plates,
bacteria were electroporated in the absence of any DNA.
6.8.5.1 Preparation of electrocompetent bacteria cells
LB Medium (250 ml) was inoculated with a starter culture of XLI (a single bacterial
colony that had been cultured in 3 ml LB medium overnight) and grown at 37°C
shaking (200-300 rpm). OD600 measurement was carried out every hour. Once the
OD600 reading was in the range 0.5-0.6, the flask was taken out of the shaker and
chilled in an ice-water bath for 10 min. The culture was then distributed in 4 (50 ml
each) conical bottles and pelleted at 4500 g for 5 min at 4°C. The supernatant was
discarded and cells were resuspended in 40 ml ice cold water by pooling pellet from
all tubes into one tube and subsequently centrifuged at 4500 x g for 5 min at 4°C.
The supernatant was again discarded and cells were resuspended in 40 ml ice cold
water. Further centrifugation was carried out at 4500 g for 5 min at 4°C. After
discarding the supernatant, cells were washed in 40 ml of 10 % glycerol (prepared by
mixing with ice cold water) and centrifuged at 4500 g for 5 min at 4°C. The
supernatant was discarded and the pellet was resuspended again in 40 ml of 10 %
glycerol and centrifuged at 4500 g for 5 min at 4°C. Finally, 50 μl aliquots were
transferred to 1.5 ml tubes. The aliquots were immediately frozen in liquid nitrogen
and later stored at - 80°C.
6.8.5.2 Electroporation of DNA into bacteria
The electroporation method of transforming E. coli can produce efficiencies greater
than those obtained with the best chemical methods. Briefly, subjecting a mixture of
cells and DNA to intense electrical fields of exponential decay waveform
(electroporation) routinely results in more than 109 transformants/µg of DNA. The

___________________________________________________________________Methods
137
precise protocol is as follows. Frozen electrocompetent bacterial cells were thawed
on ice and 25 µl were mixed with the required amount of DNA (2 µl of the plasmid
ligation or 50-100 ng of a plasmid mini preparation, in a volume not bigger than 5 µl)
and incubated further on ice for 1 min. The mixture was pipetted into an
electroporation cuvette (2 mm) and put on the electroporation device. The
electroporation apparatus was set to 2.5 kV and 25 µF and the sample was pulsed
and immediately transferred to 2 ml of antibiotic free SOC medium in a polypropylene
round-bottom tube and incubated for 1 h at 37°C in an incubator with a horizontal
shaker set to 220 rpm. SOC is a rich medium, important for the reconstitution of the
membrane of electro-competent bacteria immediately after transformation and to
allow expression of transferred resistance genes before exposing cells to selective
conditions. The bacterial sample was later pelleted by centrifugation and
resuspended in 100 µl of LB medium and plated on an LB-agar plate in the
appropriate dilution and with antibiotic selection.
6.8.6 Plasmid DNA preparations from bacteria
6.8.6.1 Plasmid DNA mini preparation
The protocol used is based on the QIAGEN plasmid purification handbook.
Approximately 1.5 ml of a bacterial overnight culture was centrifuged at 11000 rpm
for approximately 1 min. The supernatant was decanted and the pellet was
resuspended with 300 μl Buffer P1. 300 μl P2 was immediately added and the
mixture was left at room temperature for 5 min. Following the 5 min incubation, 300 μl
P3 was added and samples were centrifuged at 13000 rpm for 10 min. 900 μl of the
supernatant was taken and transferred to a fresh tube. Plasmid DNA was
precipitated by adding 0.7 volume isopropanol. Tubes were kept at -20°C for 30 min
and were then centrifuged at 13000 rpm for 30 min at 4°C. The supernatant was
discarded and the pellet was washed with 70 % ethanol by centrifuging at 13000 rpm
for 15 min. The supernatant was discarded and the pellet was dried at room
temperature for 10 min. The pellet was resuspended with 20 μl of 1 x TE buffer and
kept at - 20 °C for future use.
Methods___________________________________________________________________
138
6.8.6.2 Plasmid DNA maxi preparation
The protocol used is based on the QIAGEN Plasmid Purification Handbook. A single
bacterial colony was picked from a freshly selective plate and a starter culture of 2-5
ml LB medium containing the appropriate selective antibiotic was inoculated. The
starter culture was incubated overnight at 37°C with vigorous shaking (approx. 300
rpm). A tube or flask was used with a volume of at least 4 times the volume of the
culture. 250 ml LB medium was inoculated with 250-500 μl of the starter culture. The
culture was grown at 37°C for 12-16 h with vigorous shaking (approx. 300 rpm). A
flask with a volume of at least 4 times the volume of the culture was used. The
culture usually reaches a density of approximately 3-4 x 10⁹ cells/ml, which typically
corresponds to a pellet wet weight of approximately 3 g/l medium. For bacteria
stocks, 1 ml of the bacteria culture was centrifuged at 4000 g for 5 min and
resuspended in a solution of 15 % glycerol and LB medium and frozen at - 80°C. The
rest of the bacteria culture was harvested by centrifugation at 6000 g for 15 min at
4°C. If there was a need to interrupt the procedure, cells were frozen at - 20°C. The
bacterial pellet was resuspended in 10 ml Buffer P1. For efficient lysis it is important
to use a vessel that is large enough to allow complete mixing of the bacterial pellet
with the lysis buffers. The pellet was resuspended completely by vortexing or
pipetting up and down until no cell clumps remained. Following resuspension, 10 ml
Buffer P2 was added and mixed thoroughly by vigorously inverting the sealed tube 4-
6 times, and incubated at room temperature (15-25°C) for 5 min. During the
incubation the QIAfilter Cartridge was prepared. 10 ml of pre-chilled Buffer P3 was
added to the lysate and mixed immediately and thoroughly by vigorously inverting 4-6
times. Precipitation is enhanced by using chilled Buffer P3. The lysate was poured
into the barrel of the QIAfilter Cartridge and incubated at room temperature (15-25°C)
for 10 min. 2.5 ml buffer ER was added to the filtered lysate and was mixed by
inverting the tube 6 times and incubating on ice for 30 min. QIAGEN-tip 500 was
equilibrated by applying 10 ml Buffer QBT and the column was allowed to empty by
gravity flow. The filtered lysate was applied to the QIAGEN-tip and allowed to enter
the resin by gravity flow. The QIAGEN-tip was washed with 2 x 30 ml Buffer QC.
Buffer QC was allowed to move through the QIAGEN-tip by gravity flow. DNA was
___________________________________________________________________Methods
139
eluted with 15 ml Buffer QN. DNA was precipitated by adding 0.7 volumes of room-
temperature isopropanol to the eluted DNA. The mixture was centrifuged immediately
at ≥ 15000 g for 30 min at 4°C. The supernatant was carefully decanted. The DNA
pellet was washed with 5 ml of 70 % ethanol and centrifuged at ≥ 15000 g for 10 min.
Again, the supernatant was carefully decanted without disturbing the pellet. The
pellet was air-dried for 5-10 min, and re-dissolved in a suitable volume of TE buffer.
For long-term storage, plasmid DNA was kept at - 80°C.
6.8.7 Restriction analysis of plasmid DNA
pCDNA3.1 plasmids with TCR26 or chain sequences recovered from bacteria
were controlled for the insert size by digesting with the restrictions enzymes ClaI and
XhoI for the TCR26 and NotI and XbaI for the TCR26 . The enzymes and the
buffer system used were from Fermentas. The digested products were visualized in
agarose gel after electrophoresis.
6.8.8 Electrophoresis
6.8.8.1 DNA electrophoresis
DNA electrophoresis is a technique by which DNA fragments in a gel are separated
by the application of an electric current. The separation, as DNA is negatively
charged, is based on size whereby larger fragments move slower than smaller
fragments. The Tris acetate EDTA (TAE) buffer system was used. The agarose
concentration for a clear separation of DNA fragments > 2 kb was 0.8 % and for DNA
fragments up to 300 bp it was 1.5 %. Gels were prepared by mixing the agarose at
the desired concentration with 1 x TAE, melting it in a microwave device and adding
ethidium bromide from a 10 mg/ml stock at a concentration of 0.3 µg/ml after the
temperature of the gel was such that the gel beaker could be held with bare hands
for more than 5 sec. The liquid agarose was poured into a horizontal tray and left to
solidify at room temperature for 15 to 20 min. Samples to be loaded were mixed with
loading dye (1x final concentration) and loaded on the gel after submerging the gel in
Methods___________________________________________________________________
140
the same buffer used for preparing it. Running conditions usually were 30 to 45 min
at 90 Volts, depending on the size of DNA to be analyzed.
6.8.8.2 RNA electrophoresis
The gel preparation for RNA electrophoresis was 1.2 % agarose in 1 x TAE treated
with DEPC and autoclaved. Samples were mixed with RNA loading dye (1 x final
concentration) and incubated for 10 min at 70°C in order to denature secondary
structures and loaded into the gel. Electrophoresis was conducted at 90 Volts for 30
min.
6.8.9 Cloning of TCR26 and chain sequences into pCDNA3.1
The plasmids generated in this work were prepared by subcloning the already
existent TCR26 and chain cDNAs from the plasmid pPBS-TCR26 [75] into
pCDNA3.1. The restriction sites surrounding the TCR26 and chains were
digested and cloned into the recipient vector. The strategy used is described below,
for detailed explanation see the correspondent section.
1) Vector and insert were digested with restriction enzymes (section 6.8.3);
2) Preparative gel/DNA extraction and purification (section 6.8.2);
3) Vector and insert were ligated (section 6.8.4);
4) Ligation products were electroporated into E. coli electrocompetent cells and
plated on appropriate selection plates (sections 6.8.5.1 and 6.8.5.2);
5) Bacteria colonies were picked and mini preparations were done to amplify
plasmid DNA (section 6.8.6.1);
6) Restriction analysis was done to identify the clones containing the correct size
of the DNA insert (6.8.7);
7) The plasmids containing the correct insert sizes were sequenced;
8) Maxi preparation of the correct plasmids was performed and the plasmids were
stored as DNA and bacteria glycerol stock at - 20°C (6.8.6.2).
The schematics of the pCDNA plasmids containing the TCR26 and TCR26
sequences generated in this work is shown in Figure 6.8.
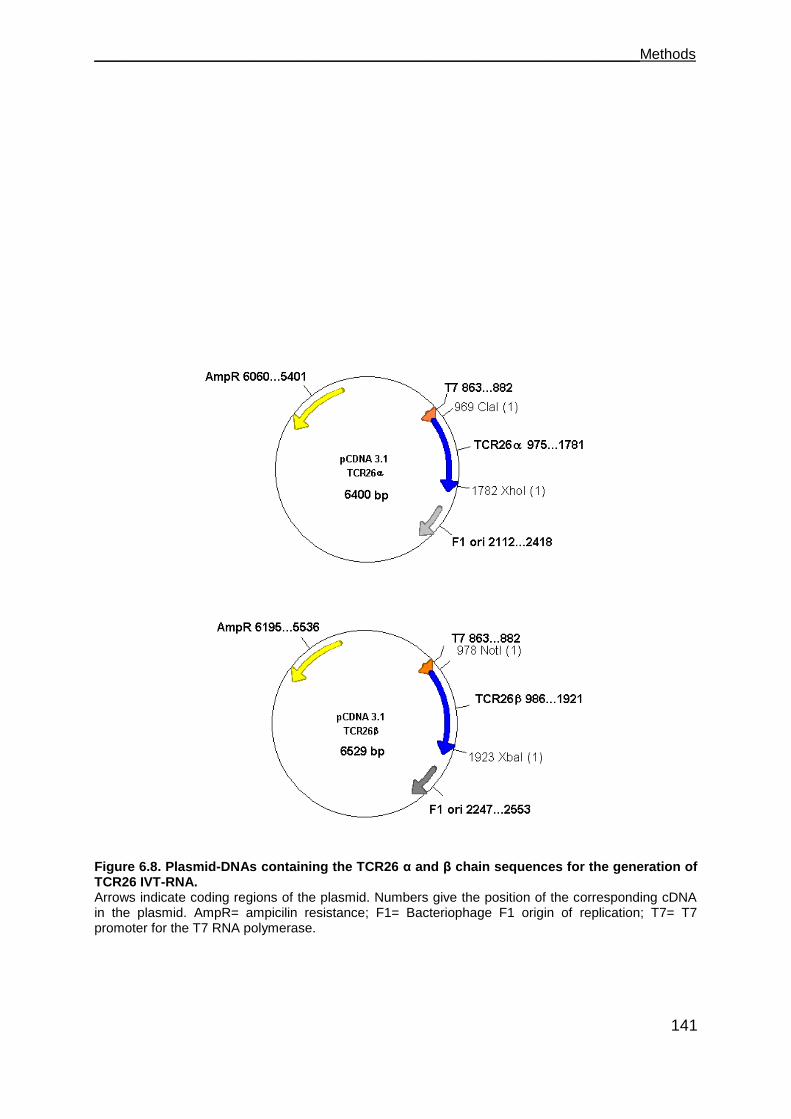
___________________________________________________________________Methods
141
Figure 6.8. Plasmid-DNAs containing the TCR26 α and β chain sequences for the generation of TCR26 IVT-RNA. Arrows indicate coding regions of the plasmid. Numbers give the position of the corresponding cDNA in the plasmid. AmpR= ampicilin resistance; F1= Bacteriophage F1 origin of replication; T7= T7 promoter for the T7 RNA polymerase.
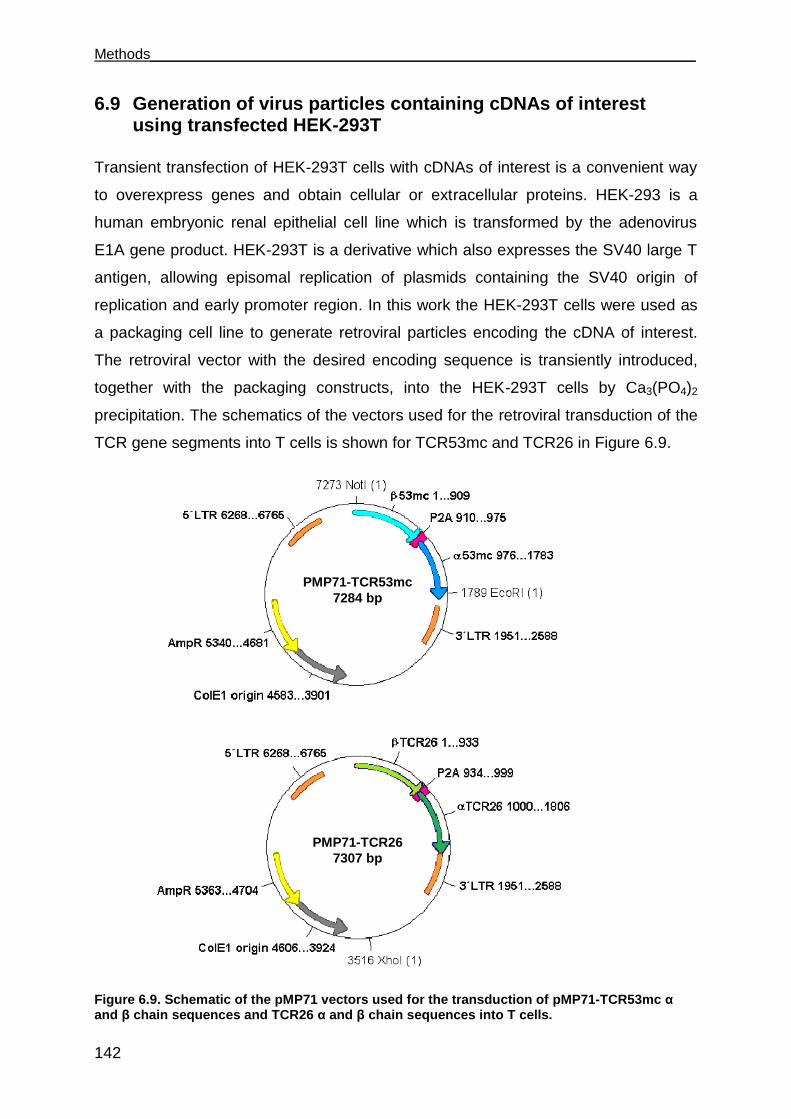
Methods___________________________________________________________________
142
6.9 Generation of virus particles containing cDNAs of interest using transfected HEK-293T
Transient transfection of HEK-293T cells with cDNAs of interest is a convenient way
to overexpress genes and obtain cellular or extracellular proteins. HEK-293 is a
human embryonic renal epithelial cell line which is transformed by the adenovirus
E1A gene product. HEK-293T is a derivative which also expresses the SV40 large T
antigen, allowing episomal replication of plasmids containing the SV40 origin of
replication and early promoter region. In this work the HEK-293T cells were used as
a packaging cell line to generate retroviral particles encoding the cDNA of interest.
The retroviral vector with the desired encoding sequence is transiently introduced,
together with the packaging constructs, into the HEK-293T cells by Ca3(PO4)2
precipitation. The schematics of the vectors used for the retroviral transduction of the
TCR gene segments into T cells is shown for TCR53mc and TCR26 in Figure 6.9.
Figure 6.9. Schematic of the pMP71 vectors used for the transduction of pMP71-TCR53mc α and β chain sequences and TCR26 α and β chain sequences into T cells.
PMP71-TCR53mc
7284 bp
PMP71-TCR26
7307 bp
___________________________________________________________________Methods
143
Arrows indicate coding regions of the plasmid. Numbers give the position of the corresponding cDNA in the plasmid. AmpR= ampicilin resistance;ColE1= colicin E 1 origin of replication; LTR= long terminal repeats; P2A= porcine teschovirus 2A element.
One day prior to the transfection, 0.7 × 10⁶ HEK-293T cells in 4 ml HEK medium
were plated in wells of a 6-well plate. On the next day, 1 h prior to the transfection,
the medium was carefully removed from the cells and replaced by 4 ml of hunger
medium. The transfection solution was then prepared. For the plasmid solution, 6 µg
of each plasmid-DNA (pMP71 encoding TCR and sequences or GFP, pALF10A1
and pCDNA3.1-MLV g/p) and 15 μl of a 2 M CaCl2 (freshly prepared) were added to
a 15 ml polystyrene falcon tube containing sterile deionized water to a final volume of
150 µl and mixes. In a second step, 150 μL of 2 x HBSS saline buffer, added to a
second 15 ml polystyrene falcon, was hold under mild vortexing and the plasmid
solution was added drop-wise. After incubation at room temperature for 15-30 min,
the transfection solution was added to the cells drop-wise. The plates were swirled to
distribute the precipitate evenly over the cells. After 6 h, the culture medium was
changed to fresh HEK medium and the cells were incubated at 37°C for 48 h. Then
the supernatant was collected for the transduction of PBLs (Figure 6.10).
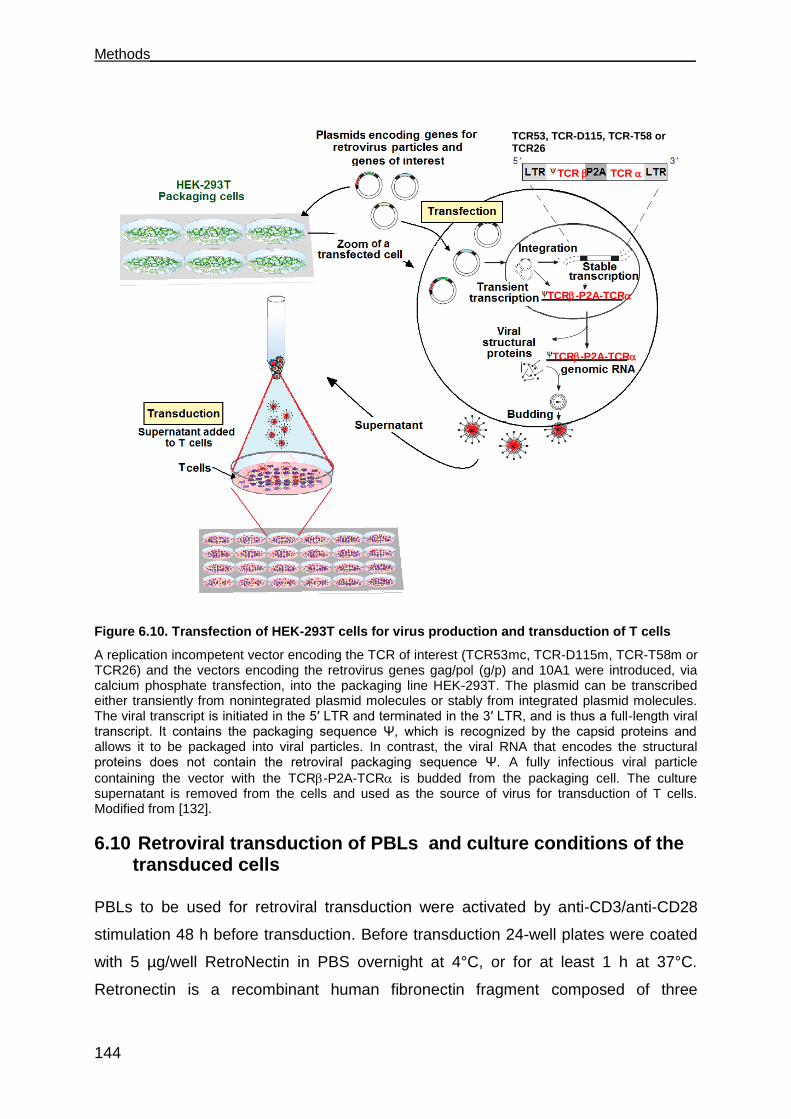
Methods___________________________________________________________________
144
Figure 6.10. Transfection of HEK-293T cells for virus production and transduction of T cells
A replication incompetent vector encoding the TCR of interest (TCR53mc, TCR-D115m, TCR-T58m or TCR26) and the vectors encoding the retrovirus genes gag/pol (g/p) and 10A1 were introduced, via calcium phosphate transfection, into the packaging line HEK-293T. The plasmid can be transcribed either transiently from nonintegrated plasmid molecules or stably from integrated plasmid molecules. The viral transcript is initiated in the 5′ LTR and terminated in the 3′ LTR, and is thus a full-length viral transcript. It contains the packaging sequence Ψ, which is recognized by the capsid proteins and allows it to be packaged into viral particles. In contrast, the viral RNA that encodes the structural proteins does not contain the retroviral packaging sequence Ψ. A fully infectious viral particle
containing the vector with the TCR-P2A-TCR is budded from the packaging cell. The culture supernatant is removed from the cells and used as the source of virus for transduction of T cells. Modified from [132].
6.10 Retroviral transduction of PBLs and culture conditions of the transduced cells
PBLs to be used for retroviral transduction were activated by anti-CD3/anti-CD28
stimulation 48 h before transduction. Before transduction 24-well plates were coated
with 5 µg/well RetroNectin in PBS overnight at 4°C, or for at least 1 h at 37°C.
Retronectin is a recombinant human fibronectin fragment composed of three
Virus secreted in the
supernatant
TCR 10A1
g/p
TCR TCR
TCR53, TCR-D115, TCR-T58 or TCR26
TCR-P2A-TCR
TCR-P2A-TCR
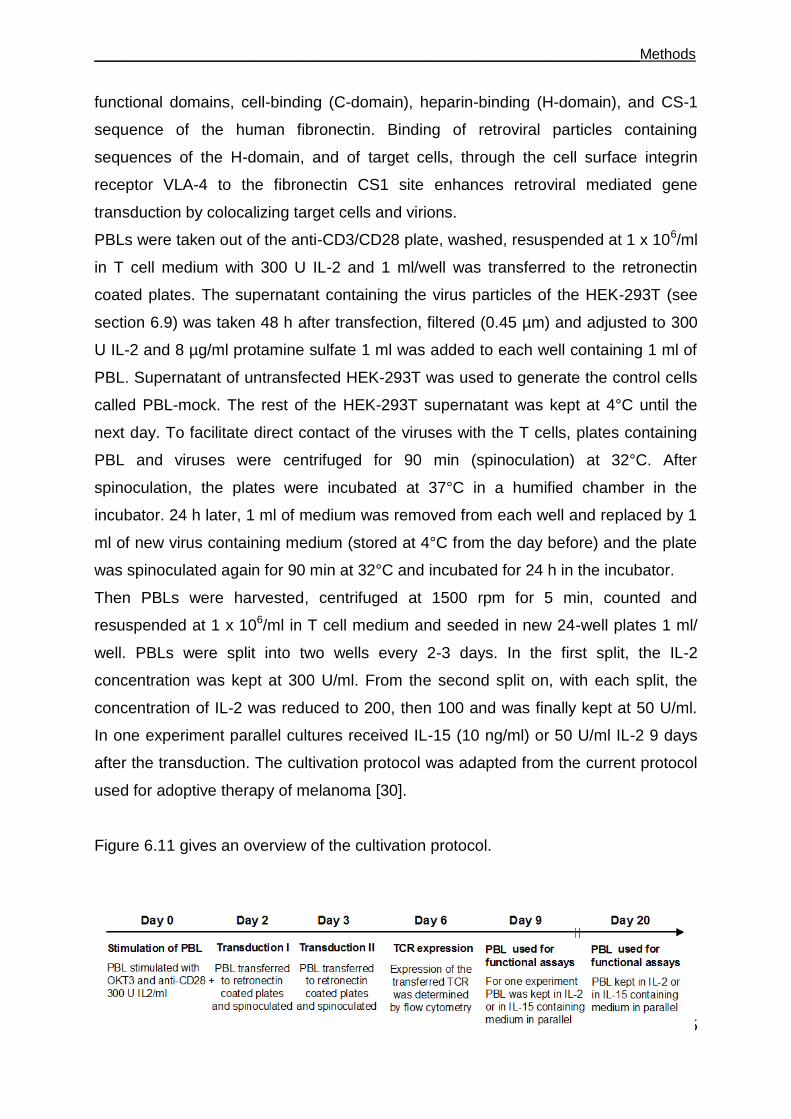
___________________________________________________________________Methods
145
functional domains, cell-binding (C-domain), heparin-binding (H-domain), and CS-1
sequence of the human fibronectin. Binding of retroviral particles containing
sequences of the H-domain, and of target cells, through the cell surface integrin
receptor VLA-4 to the fibronectin CS1 site enhances retroviral mediated gene
transduction by colocalizing target cells and virions.
PBLs were taken out of the anti-CD3/CD28 plate, washed, resuspended at 1 x 10⁶/ml
in T cell medium with 300 U IL-2 and 1 ml/well was transferred to the retronectin
coated plates. The supernatant containing the virus particles of the HEK-293T (see
section 6.9) was taken 48 h after transfection, filtered (0.45 µm) and adjusted to 300
U IL-2 and 8 µg/ml protamine sulfate 1 ml was added to each well containing 1 ml of
PBL. Supernatant of untransfected HEK-293T was used to generate the control cells
called PBL-mock. The rest of the HEK-293T supernatant was kept at 4°C until the
next day. To facilitate direct contact of the viruses with the T cells, plates containing
PBL and viruses were centrifuged for 90 min (spinoculation) at 32°C. After
spinoculation, the plates were incubated at 37°C in a humified chamber in the
incubator. 24 h later, 1 ml of medium was removed from each well and replaced by 1
ml of new virus containing medium (stored at 4°C from the day before) and the plate
was spinoculated again for 90 min at 32°C and incubated for 24 h in the incubator.
Then PBLs were harvested, centrifuged at 1500 rpm for 5 min, counted and
resuspended at 1 x 10⁶/ml in T cell medium and seeded in new 24-well plates 1 ml/
well. PBLs were split into two wells every 2-3 days. In the first split, the IL-2
concentration was kept at 300 U/ml. From the second split on, with each split, the
concentration of IL-2 was reduced to 200, then 100 and was finally kept at 50 U/ml.
In one experiment parallel cultures received IL-15 (10 ng/ml) or 50 U/ml IL-2 9 days
after the transduction. The cultivation protocol was adapted from the current protocol
used for adoptive therapy of melanoma [30].
Figure 6.11 gives an overview of the cultivation protocol.
Methods___________________________________________________________________
146
Figure 6.11. Overview of the protocol used for the generation and cultivation of retrovirally transduced PBL.
6.11 Synthesis of in vitro transcribed RNA (IVT-RNA)
The work with RNA requires great care due to the risk of contamination with
ubiquitous RNases. Therefore, to avoid degradation by contamination, the working
surface and the material involved were cleaned with RNase Zap solution. In addition,
only RNase-free filter-tips were used.
The cDNAs of TCR26 and HLA-A2 were in two different plasmids, pCDNA3.1 for
TCR26 and pCDM8 for HLA-A2. Both plasmids contain the T7 promoter and the
Kozak sequence that make them optimal templates for in vitro transcription (IVT) and
subsequent translation after IVT-RNA is electroporated into cells.
Before IVT, the plasmids were linearized by digesting the next restriction site after
the cDNA of interest (XbaI for TCR26 and NotI for HLA-A2). For the digestion, 12 μg
of plasmid-DNA was used. 3 μl of 10 x tango-buffer and 2 μl of XbaI enzyme for
TCR26 or 10 x O-buffer and 2 µl NotI enzyme for HLA-A2 and for both DEPC H2O
was added to a final volume of 30 µl. Digestion was performed overnight at 37°C.
Thereafter enzymes were deactivated at 65°C for 15 min and DNA was precipitated
as described in section 6.8.3. The DNA-Pellet was eluted in TE-buffer (Qiagen-kit)
and 1 µl was taken for the IVT reaction.
For the generation of IVT-RNA of TCR53mc, specific primers for TCR53mc
containing the T7 promoter and the Kozak sequence were used to amplify the
TCR53mc from the pMP71-TCR53mc plasmid, which was used as template for the
transcription in vitro. IVT was performed according to the instructions of the
manufacturer (mMESSAGE mMachine®-T7-Kit, Ambion). Reactions were done as
follows, scaled to a double reaction:
Added to 40 μL nuclease-free Water 20 μl 2 x NTP/CAP 4 μl 10 x Reaction Buffer 2 μg linear template DNA 4 μl enzyme mix
___________________________________________________________________Methods
147
The reaction was mixed and incubated at 37°C for 2 h in a thermo mixer. After 2 h,
1.5 μl of TURBO DNase (present in the kit) was added and the reaction was
incubated at 37°C for 30 min.
To enhance RNA stability once inside cells, polyadenylation of IVT-RNA was
performed with the help of the Poly(A)-Tailing-Kit. Reactions were scaled to a double
reaction and done as follows, according to the manual instructions:
40 μL mMESSAGE mMACHINE reaction 72 μL Nuclease-free Water 40 μL 5X E-PAP Buffer 20 μL 25 mM MnCl2 20 μL 10 mM ATP 8 μL of E-PAP added The reaction was mixed gently and incubated at 37°C for 1 h. After polyadenylation,
purification of the mRNA was done with the help of the RNeasy Mini Kit (Qiagen).
The quality of the polyA-IVT RNA was controlled in a RNA-agarose gel. The
concentration of the RNA was measured using the nanodrop photometer as
described in section 6.8.1.
6.12 Electroporation of cells with IVT-RNA
T cells usually are poorly transfected by common chemical methods like calcium
phosphate. Besides retroviral transduction, another method to transfer genes of
interest into T cells, not involving an S2 laboratory, is the electroporation with IVT-
RNA. A second advantage of this method is the prompt avaiability of engineered T
cells, as they express the gene of interest as soon as 2 h after electroporation.
Before electroportion, cells were washed 2 x with 10 ml cold OptiMEM medium and
resuspended in the same medium at 2 x 10⁶/200 µl, placed in a 0.4 cm
electroporation cuvette and briefly incubated on ice. Polyadenylated IVT-RNA (15 µg
for HLA-A2 or 8 µg for each chain of the TCR26 or TCR53mc) was added and mixed
carefully by pipetting up and down. Cells that were electroporated with water only
were used as mock controls. Electroporation was performed with the Gene Pulser
Xcell at 800 V and 5 ms for PBL or 400 V and 5 ms for adherent cells. Immediately
after electroporation, cells were returned to pre-warmed culture medium. In the case
of TCR IVT-RNA, cells were taken for functional assays after a minimum of 2 h of
Methods___________________________________________________________________
148
incubation at 37°C. For adherent cells electroporated with HLA-A2 IVT-RNA, cells
were taken for assays after 12 h of incubation at 37°C. Cell surface expression was
determined by flow cytometry using an TCR-specific or HLA-A2-specific antibody.
________________________________________________________________References
149
References
[1] Zinkernagel R.M. and Doherty P.C. The discovery of MHC restriction. Immunol. Today, 18:14–27, 1997. [2] Murphey K., Travers P. and Walport M. Janeway`s immunobiology, Garland Science, New York and London, 7th edition, 2008. [3] Lewis, S.M. The mechanism of V(D)J joining: lessons from molecular, immunological and comparative analyses. Adv. Immunol. 56:27-150, 1994. [4] Chen Y., Shi Y., Cheng H., An Y.Q. and Gao G.F. Structural immunology and crystallography help immunologists see the immune system in action: how T and NK cells touch their ligands. IUBMB Life 61:579-90, 2009.
[5] Call, M.E., Pyrdol J., Wiedmann M. and Wucherpfennig K.W. The organizing principle in the formation of the T cell receptor-CD3 complex. Cell 111:967-979, 2002.
[6] Garcia KC, Degano M, Pease LR, Huang M, Peterson PA, Teyton L, Wilson IA. Structural basis of plasticity in T cell receptor recognition of a self peptide-MHC antigen. Science 279:1166-72,1998. [7] Grakoui, Bromley S.K., Sumen C., Davis M.M., Shaw A.S., Allen P.M. and Dustin M.L. The immunological synapse: A molecular machine controlling T cell activation. Science 285:221-227, 1999. [8] Lieberman J. The ABCs of granule-mediated cytotoxicity: new weapons in the arsenal. Nat. Rev. Immunol. 3:361-370, 2003. [9] Dustin M.L. and Cooper J.A. The immunological synapse and the actin cytoskeleton: molecular hardware for T cell signalling. Nat. Immunol. 1:23-29, 2000. [10] Schroder K., Hertzog P.J., Ravasi T. and Hume D.A. Interferon-gamma: an overview of signals, mechanisms and functions. J. Leukoc. Biol. 75:163-189, 2004.
[11] van Horssen R., Ten Hagen T.L., Eggermont A.M. TNF-alpha in cancer treatment: molecular insights, antitumor effects, and clinical utility. Oncologist 11:397-408, 2006.
[12] Muppidi J.R., Tschopp J. and Siegel R.M. Life and death decisions: secondary complexes and lipid rafts in TNF receptor family signal transduction. Immunity 21:461-5, 2004. [13] Ma A., Koka R. and Burkett P. Diverse Functions of IL-2, IL-15, and IL-7 in lymphoid homeostasis. Annu. Rev. Immunol. 24:657-79, 2006.
References
150
[14] Peters P.J., Borst J., Oorschot V., Fukuda M., Krähenbühl O., Tschopp J., Slot J.W. and Geuze H.J. Cytotoxic T lymphocyte granules are secretory lysosomes, containing both perforin and granzymes. J. Exp. Med. 173:1099-1109, 1991.
[15] Davis, D.M. Assembly of the immunological synapse for T cells and NK cells. Trends. Immunol. 23:356-363, 2002.
[16] Kuhn J. R. and Poenie M. Dynamic polarization of the microtubule cytoskeleton during CTL-mediated killing. Immunity 16:111-121, 2002.
[17] Menager M.M., Menasche G., Romao M., Knapnougel P., Ho C.H., Garfa M., Raposo G., Feldmann J., Fischer A. and de Saint Basile G. Basile. Secretory cytotoxic granule maturation and exocytosis require the effector protein hMunc13-4. Nat. Immunol. 8:257-267, 2007.
[18] Kägi D., Ledermann B., Bürki K., Seiler P., Odermatt B., Olsen K.J., Podack E.R., Zinkernagel R.M. and Hengartner H. Cytotoxicity mediated by T cells and natural killer cells is greatly impaired in perforin-deficient mice. Nature 369:31-37, 1994.
[19] Trapani J.A. and Smyth M.J. Functional significance of the perforin/granzyme cell death pathway. Nat. Rev. Immunol. 2:735-747, 2002.
[20] Browne K.A., Blink E., Sutton V.R., Froelich C.J., Jans D.A. and Trapani J.A. Cytosolic delivery of granzyme B by bacterial toxins: evidence that endosomal disruption, in addition to transmembrane pore formation, is an important function of perforin. Mol. Cell. Biol. 19:8604-8615, 1999.
[21] Uellner R., Zvelebil M.J., Hopkins J., Jones J., MacDougall L.K., Morgan B.P., Podack E., Waterfield M.D. and Griffiths G.M. Perforin is activated by a proteolytic cleavage during biosynthesis which reveals a phospholipidbinding C2 domain. EMBO J. 16:7287-7296, 1997. [22] Masson D., Peters P.J., Geuze H.J., Borst J. and Tschopp J. Interaction of chondroitin sulfate with perforin and granzymes of cytolytic T-cells is dependent on pH. Biochemistry 29:11229-11235, 1990. [23] Rotonda J., Garcia-Calvo M., Bull H.G., Geissler W.M., McKeever B.M., Willoughby C.A., Thornberry N.A. and Becker J.B. The three-dimensional structure of human granzyme B compared to caspase-3, key mediators of cell death with cleavage specificity for aspartic acid in P1. Chem. Biol. 8:357-368, 2001. [24] Sarin A., Williams M.S., Alexander-Miller M.A., Berzofsky J.A., Zacharchuk C.M. and Henkart P.A. Target cell lysis by CTL granule exocytosis is independent of ICE/Ced-3 family proteases. Immunity 6:209–215, 1997.

________________________________________________________________References
151
[25] Barnes D.W., Corp M.J., Loutit J.F. and Neal F.E. Treatment of murine leukaemia with X rays and homologous bonemarrow; preliminary communication. Br.
Med. J. 2:626–627, 1956.
[26] Thomas E.D. and Blume K.G. Historical markers in the development of
allogeneic hematopoietic cell transplantation. Biol. Blood Marrow Transplant. 5:341–346, 1999. [27] Childs R.W. and Barrett J. Nonmyeloablative allogeneic immunotherapy for solid
tumors. Annu. Rev. Med. 55:459–475, 2004.
[28] Jotereau, F., Pandolfino M.C., Boudart D., Diez E., Dreno B., Douillard J.Y., Muller J.Y. and LeMevel B. High-fold expansion of human cytotoxic T-lymphocytes specific for autologous melanoma cells for use in immunotherapy. J. Immunother. 10:405-411, 1991.
[29] June C.H. Adoptive T cell therapy for cancer in the clinic. J. Clin. Invest. 117:1466-1476, 2007. [30] Johnson L.A., Morgan R.A., Dudley M.E., Cassard L., Yang J.C., Hughes M.S., Kammula U.S., Royal R.E., Sherry R.M., Wunderlich J.R., Lee C.C., Restifo N.P., Schwarz S.L., Cogdill A.P., Bishop R.J., Kim H., Brewer C.C., Rudy S.F., VanWaes C., Davis J.L., Mathur A., Ripley R.T., Nathan D.A., Laurencot C.M. and Rosenberg S.A. Gene therapy with human and mouse T-cell receptors mediates cancer regression and targets normal tissues expressing cognate antigen. Blood 16;114:535-46, 2009. [31] Dudley, M.E., Wunderlich J.R., Robbins P.F., Yang J.C., Hwu P., Schwartzentruber D.J., Topalian S.L., Sherry R., Restifo N.P., Hubicki A.M., Robinson M.R., Raffeld M., Duray P., Seipp C.A., Rogers-Freezer L., Morton K.E., Mavroukakis S.A., White D.E. and Rosenberg S.A. Cancer regression and autoimmunity in patients after clonal repopulation with antitumor lymphocytes. Science 298:850-854, 2002. [32] Yee C., Thompson J.A., Byrd D., Riddell S.R., Roche P., Celis E. and Greenberg P.D. Adoptive T cell therapy using antigen-specific CD8+ T cell clones for the treatment of patients with metastatic melanoma: in vivo persistence, migration, and antitumor effect of transferred T cells. Proc. Natl. Acad. Sci. U. S. A. 99:16168-16173, 2002. [33] Dudley M.E. Yang J.C., Sherry R., Hughes M.S., Royal R., Kammula U., Robbins P.F., Huang J., Citrin D.E., Leitman S.F., Wunderlich J., Restifo N.P., Thomasian A., Downey S.G., Smith F.O., Klapper J., Morton K., Laurencot C., White D.E. and Rosenberg S.A. Adoptive cell therapy for patients with metastatic melanoma: evaluation of intensive myeloablative chemoradiation preparative regimens. J. Clin. Oncol. 26:5233-5239, 2008. [34] Bollard C.M., Aguilar L., Straathof K.C., Gahn B., Huls M.H., Rousseau A., Sixbey J., Gresik M.V., Carrum G., Hudson M., Dilloo D., Gee A., Brenner M.K.,
References
152
Rooney C.M. and Heslop H.E. Cytotoxic T lymphocyte therapy for Epstein-Barr virus+ Hodgkin‟s disease. J. Exp. Med. 200:1623–1633, 2004. [35] Comoli P., Pedrazzoli P., Maccario R., Basso S., Carminati O., Labirio M., Schiavo R., Secondino S., Frasson C., Perotti C., Moroni M., Locatelli F. and Siena S. Cell therapy of stage IV nasopharyngeal carcinoma with autologous Epstein–Barr virus-targeted cytotoxic T lymphocytes. J. Clin. Oncol. 23:8942-8949, 2005. [36] Dudley M.E., Wunderlich J.R., Yang J.C., Sherry R.M., Topalian S.L., Restifo N.P., Royal R.E., Kammula U., White D.E., Mavroukakis S.A., Rogers L.J., Gracia G.J., Jones S.A., Mangiameli D.P., Pelletier M.M., Gea-Banacloche J., Robinson M.R., Berman D.M., Filie A.C., Abati A. and Rosenberg S.A. Adoptive cell transfer therapy following non-myeloablative but lymphodepleting chemotherapy for the treatment of patients with refractory metastatic melanoma. J. Clin. Oncol. 23:2346-2357, 2005. [37] Rosenberg, S.A. Progress in human tumour immunology and immunotherapy. Nature 411:380-4, 2001.
[38] Schumacher T.N. T-cell-receptor gene therapy. Nat. Rev. Immunol. 2:512–519,
2002
[39] Morgan R.A., Dudley M.E., Yu Y.Y., Zheng Z., Robbins P.F., Theoret M.R., Wunderlich J.R., Hughes M.S., Restifo N.P. and Rosenberg S.A. High efficiency TCR gene transfer into primary human lymphocytes affords avid recognition of melanoma tumor antigen glycoprotein 100 and does not alter the recognition of autologous melanoma antigens. J. Immunol. 171:3287–3295, 2003.
[40] Johnson L.A., Morgan R.A., Dudley M.E., Cassard L., Yang J.C., Hughes M.S., Kammula U.S., Royal R.E., Sherry R.M., Wunderlich J.R., Lee C.C., Restifo N.P., Schwarz S.L., Cogdill A.P., Bishop R.J., Kim H., Brewer C.C., Rudy S.F., VanWaes C., Davis J.L., Mathur A., Ripley R.T., Nathan D.A., Laurencot C.M., Rosenberg S.A. Gene therapy with human and mouse T-cell receptors mediates cancer regression and targets normal tissues expressing cognate antigen. Blood 114:535-546, 2009.
[41] Mutis T., Blokland E., Kester M., Schrama E. and Goulmy E. Generation of minor histocompatibility antigen HA-1-specific cytotoxic T cells restricted by nonself HLA molecules: a potential strategy to treat relapsed leukemia after HLA-mismatched stem cell transplantation. Blood 100:547–552, 2002. [42] Cohen C.J., Zheng Z., Bray R., Zhao Y., Sherman L.A., Rosenberg S.A. and Morgan R.A. Recognition of fresh human tumor by human peripheral blood lymphocytes transduced with a bicistronic retroviral vector encoding a murine anti-p53 TCR. J. Immunol. 175:5799–5808, 2005.
[43] Xue S.A., Gao L., Hart D., Gillmore R., Qasim W., Thrasher A., Apperley J., Engels B., Uckert W., Morris E. and Stauss H. Elimination of human leukemia cells in
________________________________________________________________References
153
NOD/SCID mice by WT1-TCR gene-transduced human T cells. Blood 106:3062-3067, 2005.
[44] Morgan R.A., Dudley M.E., Wunderlich J.R., Hughes M.S., Yang J.C., Sherry R.M., Royal R.E., Topalian S.L., Kammula U.S., Restifo N.P., Zheng Z., Nahvi A., de Vries C.R., Rogers-Freezer L.J., Mavroukakis S.A. and Rosenberg S.A. Cancer regression in patients after transfer of genetically engineered lymphocytes. Science 314:126-29, 2006.
[45] Govers C., Sebestyén Z., Coccoris M., Willemsen R.A. and Debets R. T cell receptor gene therapy: strategies for optimizing transgenic TCR pairing. Trends Mol. Med. 16:77-87, 2010.
[46] Cohen C.J., Zhao Y., Zheng Z., Rosenberg S.A. and Morgan R.A. Enhanced antitumor activity of murine-human hybrid T-cell receptor (TCR) in human lymphocytes is associated with improved pairing and TCR/CD3 stability. Cancer Res. 66:8878–8886, 2006.
[47] Thomas S., Xue S.A., Cesco-Gaspere M., San José E., Hart D.P., Wong V., Debets R., Alarcon B., Morris E. and Stauss H.J. Targeting the Wilms tumor antigen 1 by TCR gene transfer: TCR variants improve tetramer binding but not the function of gene modified human T cells. J. Immunol. 179:5803-5810, 2007.
[48] Bendle G.M., Linnemann C., Hooijkaas A.I., Bies L., de Witte M.A., Jorritsma A., Kaiser A.D., Pouw N., Debets R., Kieback E., Uckert W., Song J.Y., Haanen J.B. and Schumacher T.N. Lethal graft-versus-host disease in mouse models of T cell receptor gene therapy. Nat. Med. 16:565-70, 1p following 570, 2010.
[49] Ross J. mRNA stability in mammalian cells. Microbiol. Rev. 59:423–450, 1995.
[50] Jorritsma A., Gomez-Eerland R., Dokter M., van de Kasteele W., Zoet Y.M., Doxiadis II, Rufer N., Romero P., Morgan R.A., Schumacher T.N. and Haanen J.B. Selecting highly affinity and well-expressed TCRs for gene therapy of melanoma. Blood 110:3564–3572, 2007.
[51] Scholten K.B., Kramer D., Kueter E.W., Graf M., Schoedl T., Meijer C.J., Schreurs M.W. and Hooijberg E. Codon modification of T cell receptors allows enhanced functional expression in transgenic human T cells. Clin. Immunol. 119:135–145, 2006.
[52] Pardoll D.M. and Topalian S.L. The role of CD4+ T cell responses in antitumor
immunity. Curr. Opin. Immunol. 10:588–594, 1998.

References
154
[53] Giuntoli R.L. 2nd, Lu J., Kobayashi H., Kennedy R., Celis E. Direct costimulation of tumor-reactive CTL by helper T cells potentiate their proliferation, survival, and effector function. Clin. Cancer Res. 8:922-31, 2002. [54] Surman D.R., Dudley M.E., Overwijk W.W. and Restifo N.P. CD4+ T cell control of CD8+ T cell reactivity to a model tumor antigen. J. Immunol. 164:562–565, 2000.
[55] Hunder N.N., Wallen H., Cao J., Hendricks D.W., Reilly J.Z., Rodmyre R., Jungbluth A., Gnjatic S., Thompson J.A. and Yee C. Treatment of metastatic melanoma with autologous CD4+ T cells against NY-ESO-1. N. Engl. J. Med.
358:2698–2703, 2008.
[56] Nishimura M.I., Avichezer D., Custer M.C., Lee C.S., Chen C., Parkhurst M.R., Diamond R.A,. Robbins P.F., Schwartzentruber D.J. and Rosenberg S.A. MHC Class I-restricted Recognition of a Melanoma Antigen by a Human CD4 Tumor Infiltrating Lymphocyte. Cancer Res. 59:6230–6238, 1999.
[57] Nakanishi Y., Lu B., Gerard C. and Iwasaki A. CD8(+) T lymphocyte mobilization to virus-infected tissue requires CD4(+) T-cell help. Nature 462:510-3, 2009.
[58] Jemal A., Siegel R., Ward E., Hao Y., Xu J. and Thun M.J. Cancer statistics,
2009. CA Cancer J. Clin. 59:225–249, 2009.
[59] Motzer R.J., Mazumdar M., Bacik J., Berg W., Amsterdam A. and Ferrara J. Survival and prognostic stratification of 670 patients with advanced renal cell
carcinoma. J. Clin. Oncol. 17:2530–2540, 1999.
[60] Yang J.C., Hughes M., Kammula U., Royal R., Sherry R.M., Topalian S.L., Suri K.B., Levy C., Allen T., Mavroukakis S., Lowy I., White D.E. and Rosenberg S.A. Impilimumab (anti-CLTA4 antibody) causes regression of metastatic renal cell cancer associated with enteritis and hypophysitis. J. Immunother. 30:825-30, 2007.
[61] Brahmer J.R., Topalian S., Wollner I., et al. Safety and activity of MDX-1106 (ONO-4538), an anti-PD-1 monoclonal antibody, in patients with selected refractory or relapsed malignancies [abstract]. J. Clin. Oncol. 26(suppl), 2008.
[62] McDermott D.F. Immunotherapy of metastatic renal cell carcinoma. Cancer
115:2298–2305, 2009.
[63] Shablak A., Hawkins R.E., Rothwell D.G. and Elkord E. T cell-Based Immunotherapy of Metastatic Renal Cell Carcinoma: Modest Success and Future Perspective. Clin. Cancer Res. 15: 6503-6510, 2009.
________________________________________________________________References
155
[64] Harris D.T. Hormonal therapy and chemotherapy of renal-cell carcinoma. Semin.
Oncol. 10:422–430, 1983.
[65] Barkholt L., Bregni M., Remberger M., Blaise D., Peccatori J., Massenkeil G., Pedrazzoli P., Zambelli A., Bay J.O., Francois S., Martino R., Bengala C., Brune M., Lenhoff S., Porcellini A., Falda M., Siena S., Demirer T., Niederwieser D., Ringdén O; French ITAC group and the EBMT Solid Tumour Working Party.Ann Oncol. Allogeneic haematopoietic stem cell transplantation for metastatic renal carcinoma in Europe. Ann. Oncol. 17:1134-40, 2006.
[66] Rosenberg S.A., Lotze M.T., Yang J.C., Topalian S.L., Chang A.E., Schwartzentruber D.J., Aebersold P., Leitman S., Linehan W.M., Seipp C.A., et al. Prospective randomized trial of high-dose interleukin-2 alone or in conjunction with lymphokineactivated killer cells for the treatment of patients with advanced cancer. J.
Natl. Cancer Inst. 85:622–32, 1993.
[67] Kradin R.L., Kurnick J.T., Lazarus D.S., Preffer F.I., Dubinett S.M., Pinto C.E., Gifford J., Davidson E., Grove B. and Callahan R.J. Tumour-infiltrating lymphocytes and interleukin-2 in treatment of advanced cancer. Lancet 1:577-580, 1989.
[68] Vieweg J. and Jackson A. Antigenic targets for renal cell carcinoma
immunotherapy. Expert. Opin. Biol. Ther. 4:1791–1801, 2004.
[69] Gouttefangeas C., Stenzl A., Stevanovic S. and Rammensee H.G.
Immunotherapy of renal cell carcinoma. Cancer Immunol. Immunother. 56:117–128,
2007.
[70] Oosterwijk E., Ruiter D.J., Hoedemaeker P.J., Pauwels E.K., Jonas U., Zwartendijk J. and Warnaar S.O. Monoclonal antibody G 250 recognizes a determinant present in renal-cell carcinoma and absent from normal kidney. Int. J.
Cancer 38:489–494, 1986.
[71] Michael A. and Pandha H.S. Renal-cell carcinoma: tumour markers, T-cell
epitopes, and potential for new therapies. Lancet Oncol. 4:215–223, 2003.
[72] Bleumer I., Knuth A., Oosterwijk E., Hofmann R., Varga Z., Lamers C., Kruit W., Melchior S., Mala C., Ullrich S., De Mulder P., Mulders P.F. and Beck J. A phase II trial of chimeric monoclonal antibody G250 for advanced renal cell carcinoma
patients. Br. J. Cancer 90:985–990, 2004.
[73] Lamers C.H., Sleijfer S. Vulto A.G., Kruit W.H., Kliffen M., Debets R. Gratama J.W., Stoter G. and Oosterwijk E.. Treatment of metastatic renal cell carcinoma with
References
156
autologous T-lymphocytes genetically retargeted against carbonic anhydrase IX: first
clinical experience. J. Clin. Oncol. 24:e20–22, 2006.
[74] Takahashi Y., Harashima N., Kajigaya S., Yokoyama H., Cherkasova E., McCoy J.P., Hanada K., Mena O., Kurlander R., Tawab A., Srinivasan R., Lundqvist A., Malinzak E., Geller N., Lerman M.I. and Childs R.W. Regression of human kidney cancer following allogeneic stem cell transplantation is associated with recognition of
an HERV-E antigen by T cells. J. Clin. Invest. 118:1099–1109, 2008.
[75] Engels B., Noessner E., Frankenberger B., Blankenstein T., Schendel D.J. and Uckert W. Redirecting human T lymphocytes toward renal cell carcinoma specificity
by retroviral transfer of T cell receptor genes. Hum. Gene Ther. 16:799–810, 2005.
[76] Wang QJ, Hanada K, Yang JC. Characterization of a novel nonclassical T cell clone with broad reactivity against human renal cell carcinomas. J. Immunol. 181:3769-76, 2008.
[77] Cohen H.T. and McGovern F.J. Renal-cell carcinoma. N. Engl. J. Med.
353:2477–2490, 2005.
[78] Rosenberg S.A. Interleukin 2 for patients with renal cancer. Nat. Clin. Pract. Oncol. 4:497, 2007.
[79] Rosmanit M. In-vitro- und In-Situ-Untersuchungen an Tumor-infiltrierenden Lymphozyten aus Patienten mit Nierenzellkarzinom. Doktorarbeit der Ludwig-Maximilians-Universität, 2002.
[80] Arden. B., Clark. S.P., Kabelitz D. and Mak T.W. Human T cell receptor variable gene segment families. Immunogenetics 42:455-500, 1995.
[81] Leisegang M. Neuausrichtung der Spezifität humaner T-Zellen gegen ein Nierenzellkarzinom-assoziiertes Antigen durch retroviralen Transfer von TCR-Ketten-Genen. Diplomarbeit der Humboldt Universität zu Berlin, 2005
[82] Karttunen J., Sanderson S. and Shastri N. Detection of rare antigen-presenting cells by the lacZ T-cell activation assay suggests an expression cloning strategy for T-cell antigens. Proc. Natl. Acad. Sci. USA 1;89:6020-4, 1992.
[83] Leisegang M., Turqueti-Neves A., Engels B., Blankenstein T., Schendel D.J., Uckert W. and Noessner E. T-cell receptor gene-modified T cells with shared renal cell carcinoma specificity for adoptive T-cell therapy. Clin. Cancer. Res. 16:2333-43, 2010.
________________________________________________________________References
157
[84] Shafer-Weaver K.A., Watkins S.K., Anderson M.J., Draper L.J., Malyguine A., Alvord W.G., Greenberg N.M. and Hurwitz A.A. Immunity to murine prostatic tumors: continuous provision of T-cell help prevents CD8 T-cell tolerance and activates tumor-infiltrating dendritic cells. Cancer Res. 69:6256-64, 2009.
[85] Almeida J.R., Price D.A., Papagno L., Arkoub Z.A., Sauce D., Bornstein E., Asher T.E., Samri A., Schnuriger A., Theodorou I., Costagliola D., Rouzioux C., Agut H., Marcelin A.G., Douek D., Autran B. and Appay V. Superior control of HIV-1 replication by CD8+ T cells is reflected by their avidity, polyfunctionality, and clonal turnover. J. Exp. Med. 1;204:2473-85, 2007.
[86] Wilde S., Sommermeyer D., Frankenberger B., Schiemann M., Milosevic S., Spranger S., Pohla H., Uckert W., Busch D.H. and Schendel D.J. Dendritic cells pulsed with RNA encoding allogeneic MHC and antigen induce T cells with superior antitumor activity and higher TCR functional avidity. Blood 3;114:2131-9, 2009.
[87] Friedrich J., Ebner R. and Kunz-Schughart L.A. Experimental anti-tumor therapy in 3-D: spheroids--old hat or new challenge? Int. J. Radiat. Biol. 83:849-71, 2007.
[88] Adunka T. Veränderungen der peripheren Immunzellen bei Nierenzellkarzinom- und Sarkom-Patienten. MSc. Thesis an der Leopold-Franzens Universität Innsbruck, 2009.
[89] Reichert T.E., Strauss L., Wagner E.M., Gooding W., Whiteside T.L. Signaling Abnormalities, Apoptosis, and Reduced Proliferation of Circulating and Tumor-infiltrating Lymphocytes in Patients with Oral Carcinoma. Clin. Cancer Res. 8:3137-45, 2002.
[90] Treiber U. and Zaak D. Manual Urogenitale Tumoren. Empfehlungen zur Diagnostik, Therapie und Nachsorge. Tumorzentrum Munchen (Ed.). W. Zuckschwerdt Verlag, 2008.
[91] Hedfors I.A. and Brinchmann J.E. Long-term proliferation and survival of in vitro-activated T cells is dependent on Interleukin-2 receptor signalling but not on the high-affinity IL-2R. Scand. J. Immunol. 58:522-32, 2003.
[92] Van Parijs L., Refaeli Y., Lord J.D., Nelson B.H., Abbas A.K. and Baltimore D. Uncoupling IL-2 signals that regulate T cell proliferation, survival, and Fas-mediated activation-induced cell death. Immunity 11:281-8, 1999.

References
158
[93] Ku C.C., Murakami M., Sakamoto A., Kappler J. and Marrack P. Control of homeostasis of CD8+ memory T cells by opposing cytokines. Science 288:675-8, 2000.
[94] Klebanoff C.A., Finkelstein S.E., Surman D.R., Lichtman M.K., Gattinoni L., Theoret M.R., Grewal N., Spiess P.J., Antony P.A., Palmer D.C., Tagaya Y., Rosenberg S.A., Waldmann T.A., Restifo N.P. IL-15 enhances the in vivo antitumor activity of tumor-reactive CD8+ T cells. Proc. Natl. Acad. Sci. USA 17;101:1969-74, 2004.
[95] Christensen J.E., Christensen J.P., Kristensen N.N., Hansen N.J.V., Stryhn A. and Thomsen A.R. Role of CD28 co-stimulation in generation and maintenance of virus-specific T cells. Int. Immunol. 14:701-11, 2002.
[96] Powell D.J. Jr., Dudley M.E., Robbins P.F. and Rosenberg S.A. Transition of late-stage effector T cells to CD27+ CD28+ tumor-reactive effector memory T cells in humans after adoptive cell transfer therapy. Blood 1;105:241-50, 2004.
[97] Whiteside T. L. Signaling defects in T lymphocytes of patients with malignancy. Cancer Immunol. Immunother. 48:346-52, 1999.
[98] Wells A.D. New insights into the molecular basis of T cell anergy: anergy factors, avoidance sensors, and epigenetic imprinting. J. Immunol. 182:7331-41, 2009.
[99] Santini S.M., Lapenta C., Santodonato L., D'Agostino G., Belardelli F. and Ferrantini M. IFN-alpha in the generation of dendritic cells for cancer immunotherapy. Handb. Exp. Pharmacol. 188:295-317, 2009.
[100] Vives-Pi M., Armengol M.P., Alcalde L., Costa M., Somoza N., Vargas F., Jaraquemada D. and Pujol-Borrell R. Expression of transporter associated with antigen processing-1 in the endocrine cells of human pancreatic islets: effect of cytokines and evidence of hyperexpression in IDDM. Diabetes 45:779-88, 1996.
[101] Vaupel P, Höckel M, Mayer A. Detection and characterization of tumor hypoxia using pO2 histography. Antioxid Redox Signal 9:1221-35, 2007.
[102] Godlove J., Chiu W.K. and Weng N.P. Gene expression and generation of CD28-CD8 T cells mediated by interleukin 15. Exp. Gerontol. 42:412-5, 2007.
[103] Helmlinger G., Yuan F., Dellian M., Jain R.K. Interstitial pH and pO2 gradients in solid tumors in vivo: high-resolution measurements reveal a lack of correlation. Nat. Med. 3:177-82, 1997.
________________________________________________________________References
159
[104] Jantzer P. and Schendel D.J. Human renal cell carcinoma antigen-specific CTLs: antigen-driven selection and long-term persistence in vivo. Cancer Res. 58:3078-86, 1998.
[105] Koop B.F., Rowen L., Wang. K., Kuo C.L., Seto D., Lenstra J.A., Howard S., Shan W., Deshpande P. and Hood L.E. The human T-cell receptor TCRAC/TCRDC (C alpha/C delta) region: organization, sequence, and evolution of 97.6 kb of DNA. Genomics 19:478-93, 1994
[106] Chen Y.T., Scanlan M.J., Sahin U., Tureci O., Gure A.O., Tsang S., Williamson B., Stockert E., Pfreundschuh M. and Old L.J. A testicular antigen aberrantly expressed in human cancers detected by autologous antibody screening. Proc. Natl. Acad. Sci. USA 94:1914-8, 1997.
[107] Elkord E., Shablak A., Stern P.L., Hawkins R.E. 5T4 as a target for immunotherapy in renal cell carcinoma. Expert Rev. Anticancer Ther. 9:1705-9, 2009.
[108] Griffiths R.W., Gilham D.E., Dangoor A., Ramani V., Clarke N.W., Stern P.L., Hawkins R.E. Expression of the 5T4 oncofoetal antigen in renal cell carcinoma: a potential target for T-cell-based immunotherapy. Br. J. Cancer 19, 93:670-7, 2005.
[109] Hole N., Stern P.L. A 72 kD trophoblast glycoprotein defined by a monoclonal antibody. Br. J. Cancer 57:239-46, 1988.
[110] Carbone D.P., Ciernik I.F., Kelley M.J., Smith M.C., Nadaf S., Kavanaugh D., Maher V.E., Stipanov M., Contois D., Johnson B.E., Pendleton C.D., Seifert B., Carter C., Read E.J., Greenblatt J., Top L.E., Kelsey M.I., Minna J.D. and Berzofsky J.A. Immunization with mutant p53- and K-ras-derived peptides in cancer patients: immune response and clinical outcome. J. Clin. Oncol. 23:5099-107, 2005.
[111] Linehan W.M., Pinto P.A., Srinivasan R., Merino M., Choyke P., Choyke L., Coleman J., Toro J., Glenn G., Vocke C., Zbar B., Schmidt L.S., Bottaro D. and Neckers L. Identification of the genes for kidney cancer: opportunity for disease-specific targeted therapeutics. Clin. Cancer Res. 13:671s-679s, 2007.
[112] Drexler H.G. Guide to Leukemia-Lymphoma Cell Lines. German Collection of Microorganisms and Cell Cultures, Braunschweig, Germany, 2005
[113] Burrows S.R., Sculley T.B., Misko I.S., Schmidt C. and Moss D.J. An Epstein-Barr virus-specific cytotoxic T cell epitope in EBV nuclear antigen 3 (EBNA 3). J. Exp. Med. 171:345-9, 1990.

References
160
[114] Kast W.M., Brandt R.M., Drijfhout J.W. and Melief C.J. Human leukocyte antigen-A2.1 restricted candidate cytotoxic T lymphocyte epitopes of human papillomavirus type 16 E6 and E7 proteins identified by using the processing-defective human cell line T2. J. Immunother. Emphasis. Tumor. Immunol. 14:115-20, 1993.
[115] Labrecque N, Whitfield LS, Obst R, Waltzinger C, Benoist C, Mathis D.How much TCR does a T cell need? Immunity 15:71-82, 2001.
[116] Alexander-Miller M.A., Leggatt G.R. and Berzofsky J.A. Selective expansion of high- or low-avidity cytotoxic T lymphocytes and efficacy for adoptive immunotherapy. Proc. Natl. Acad. Sci. USA 93:4102-7, 1996.
[117] Zeh H.J. 3rd, Perry-Lalley D., Dudley M.E., Rosenberg S.A. and Yang J.C. High avidity CTLs for two self-antigens demonstrate superior in vitro and in vivo antitumor efficacy. J. Immunol. 162:989-94, 1999.
[118] Lichterfeld M., Yu X.G., Mui S.K., Williams K.L., Trocha A., Brockman M.A., Allgaier R.L., Waring M.T., Koibuchi T., Johnston M.N., Cohen D., Allen T.M., Rosenberg E.S., Walker B.D. and Altfeld M. Selective depletion of high-avidity human immunodeficiency virus type 1 (HIV-1)-specific CD8+ T cells after early HIV-1 infection. J. Virol. 81:4199-214, 2007.
[119] Zaks T.Z. and Rosenberg S.A. Immunization with a peptide epitope (p369-377) from HER-2/neu leads to peptide-specific cytotoxic T lymphocytes that fail to recognize HER-2/neu+ tumors. Cancer Res. 58:4902-8, 1998.
[120] Knutson K.L., Schiffman K., Cheever M.A. and Disis M.L. Immunization of cancer patients with a HER-2/neu, HLA-A2 peptide, p369- 377, results in short-lived peptide-specific immunity. Clin. Cancer Res. 8:1014-8, 2002.
[121] Asselin-Paturel C., Echchakin H., Carayol G., Gay F., Opolon P., Grunenwald D., Chouaib S. and Mami-Chouaib F. Quantitative analysis of Th1, Th2, and TGF- 1 cytokine expression in tumor, TIL, and PBL of non-small lung cancer patients. Int. J. Cancer 77:7-12, 1998.
[122] Dworacki G., Meidenbauer N., Kuss I., Hoffmann T.K., Gooding M.S., Lotze M., and Whiteside T.L. Decrease zeta chain expression and apoptosis in CD3+ peripheral blood T lymphocytes of patients with melanoma. Clin. Cancer Res. 7:947s-957s, 2001.
[123] Schwartz R.H. Costimulation of T lymphocytes: the role of CD28, CTLA-4, and B7/BB1 in interleukin-2 production and immunotherapy. Cell 71:1065-8, 1992.

________________________________________________________________References
161
[124] Greiner J.W., Ullmann C.D., Nieroda C., Qi C.F., Eggensperger D., Shimada S., Steinberg S.M. and Schlom J. Improved radioimmunotherapeutic efficacy of an anticarcinoma monoclonal antibody (131I-CC49) when given in combination with gamma-interferon. Cancer Res. 53:600-8, 1993.
[125] Brouwers A.H., Frielink C., Oosterwijk E., Oyen W.J., Corstens F.H. and Boerman O.C. Interferons can upregulate the expression of the tumor associated antigen G250-MN/CA IX, a potential target for (radio)immunotherapy of renal cell carcinoma. Cancer Biother. Radiopharm. 18:539-47, 2003.
[126] Sutherland R.M., Sordat B., Bamat J., Gabbert H., Bourrât B and Mueller-Klieser W. Oxygenation and differentiation in multicellular spheroids of human colon carcinoma. Cancer Res. 46:5320-9, 1986.
[127] Kunz-Schughart L.A., Doetsch J., Mueller-Klieser W. and Groebe K. Proliferative activity and tumorigenic conversion: impact on cellular metabolism in 3-D culture. Am. J. Physiol. Cell. Physiol. 278:C765-80, 2000.
[128] Fischer K., Hoffmann P., Voelkl S., Meidenbauer N., Ammer J., Edinger M., Gottfried E., Schwarz S., Rothe G., Hoves S., Renner K., Timischl B., Mackensen A., Kunz-Schughart L., Andreesen R., Krause S.W., Kreutz M. Inhibitory effect of tumor cell-derived lactic acid on human T cells. Blood 109:3812-9, 2007.
[129] Engels B., Cam H., Schüler T., Indraccolo S., Gladow M., Baum C., Blankenstein T., Uckert W. Retroviral vectors for high-level transgene expression in T lymphocytes. Hum. Gene. Ther. 10;14:1155-68, 2003.
[130] Leisegang M., Engels B., Meyerhuber P., Kieback E., Sommermeyer D., Xue S.A., Reuss S., Stauss H., Uckert W. Enhanced functionality of T cell receptor-redirected T cells is defined by the transgene cassette. J. Mol. Med. 86:573-83, 2008.
[131] Carlsson J., Yuhas J.M. Liquid-overlay culture of cellular spheroids. In: Acker H, Carlsson J, Durand R, Sutherland RM, eds. Spheroids in Cancer Research: Recent Results in Cancer Research. New York, NY: Springer ;1-24, 2002.
[132] Cepko and Pear W. Overview of the retrovirus transduction system. Current Protoc Mol Biol Chapter 9:Unit 9.9, 2001.
[133] Gerharz C.D., Ramp U., Déjosez M., Mahotka C., Czarnotta B., Bretschneider U., Lorenz I., Müller M., Krammer P.H. and Gabbert H.E. Resistance to CD95 (APO-1/Fas)-mediated apoptosis in human renal cell carcinomas: an important factor for evasion from negative growth control. Lab. Invest. 79:1521-34, 1999.

References
162
[134] Snyder J.T., Alexander-Miller M.A., Berzofsky J.A. and Belyakov I.M. Molecular mechanisms and biological significance of CTL avidity. Current. Hiv. Research 1:287-94, 2003.
[135] Sette A. and Fikes J. Epitope-based vaccines: an update on epitope identification, vaccine design and delivery. Curr. Opin. Immunol. 15:461-70, 2003.
[136] Chiu W.K., Fann M., Weng N.P. Generation and growth of CD28nullCD8+ memory T cells mediated by IL-15 and its induced cytokines. J. Immunol. 177:7802-10, 2006.
[137] Hedfors I.A. and Brinchmann J.E. Long-term proliferation and survival of in vitro-activated T cells is dependent on Interleukin-2 receptor signalling but not on the high-affinity IL-2R. Scand. J. Immunol. 58:522-32, 2003.
[138] Yannelli J.R. The preparation of effector cells for use in the adoptive cellular immunotherapy of human cancer. J. Immunol. Methods 139:1-16, 1991.
__________________________________________________________Acknowlwedgments
163
Acknowledgments First and foremost I want to express my sincere gratitude to my supervisor Dr.
Elfriede Nößner. She has contributed in many ways to make my PhD experience
productive and stimulating, even during tough times. Looking back to the beginning
of my PhD studies I realize how much I have learned from her and for that I am
deeply grateful. I also have Anna Brandl to thank for the great support throughout my
PhD work.
I am very grateful to my supervisor at the LMU, Professor Elisabeth Weiß for her
constructive comments and for her important support throughout this work. My
sincere thanks also to Professor Dolores Schendel, who always supported and
encouraged this work.
During my PhD I have collaborated closely with Matthias Leisegang for whom I have
great regard. I want to express my gratitude for his constant support and for sharing
his experiences and knowledge with me. I also wish to express my sincere gratitude
to Professor Wolfgang Uckert for his constructive comments and support.
The group has been a source of friendship as well as good advice and collaboration.
My warm thanks to the past and present group members Ainhoa Figel, Dr. Judith
Hosse, Anna Jolesch, Petra Prinz, Dorothee Brech, Tina Adunka, Stefan Dietl, Petra
Skrablin, Dr. Bin Hu and Ramona Schlenker. Also many thanks to other past
members that I have had the pleasure to work alongside, Andreas Reichert and
Kristina Tham.
The lunch club on Mondays, the nice coffee breakes and the great lectures and
scientific discussions on Mondays, Wednesdays and every last Friday are just a few
examples of what has made a great environment to work in. Thank you all that made
it possible.
I owe my beloved husband Eduardo not only my deepest thanks for his constant
support and patience but also the fact that I got so far in my studies. That I owe also
my parents Oldevir and Tania. My thanks also to the rest of my family, in special to
my brothers Andre, Mario and Marcos.
Curriculum Vitae_
164
Curriculum Vitae
Personal Data:
Adriana Turqueti Neves, born on 24th of November 1979 in Porto Alegre, RS, Brazil.
Education:
1986 – 1989 Primary school in Porto Alegre, Brazil.
1990 – 1996 High school in Porto Alegre, Brazil.
1997 – 2002 BSc. at the Federal University of Rio Grande do Sul in
Porto Alegre, Brazil.
Dissertation: Isolation and characterization of Bipolaris
sorokiniana and Trichoderma sp. Fungi, pathogen of
barley and its antagonist.
2003 – 2005 MSc. at the Max Planck Institute of Biochemistry in
Munich, Germany.
University: Technische Universität München in Munich,
Germany.
Dissertation: Identification of substrates and cellular
functions of the ubiquitin specific Cdc48Shp1 chaperone
complex from Saccharomyces cerevisae.
2005 – 2006 Research work on genes involved in yeast cell polarity
determination by TIRF microscopy at the Max Planck
Institute of Biochemistry in Munich, Germany.
2006 – 2010 PhD at the Institute of Molecular Immunology of the
Helmholz Zentrum München in Munich, Germany.
University: Ludwig Maximillian Universität in Munich,
Germany.
Dissertation: Recognition of renal cell carcinoma by CD8+
and CD4+ TCR-engineered T lymphocytes.

____________________________________________________________Curriculum Vitae
165
Publications:
Leisegang M.*, Turqueti-Neves A.*, Engels B., Blankenstein T., Schendel D.J.,
Uckert W. and Noessner E. T-cell receptor gene-modified T cells with shared renal
cell carcinoma specificity for adoptive T-cell therapy. Clin Cancer Res 16:2333-43,
2010.
* Contributed equally to this work.

Statement______
166
Statement Herewith I certify to have written this thesis independently, without help of others. The results of this thesis are based on experiments I performed by myself. Adriana Turqueti Neves