rapid damage mapping for post-earthquake building …shinozuka.eng.uci.edu/remote_sensing_2003/keiko...
TRANSCRIPT

Workshop on the Application of Remote Sensing Technologies to Disaster Response
Rapid Damage Mapping for Post-Earthquake Building Damage Assessment
Keiko Saito, Robin Spence The Martin Centre for Architectural and Urban Studies
University of Cambridge
Workshop on the Application of Remote Sensing Technologies to Disaster ResponseSeptember 12 2003

Workshop on the Application of Remote Sensing Technologies to Disaster Response
12 September 2003 Rapid Damage Mapping for post-Earthquake Building Damage Assessment 2
Objective
Develop methodologies to create a post-earthquake rapid building damage map using high-resolution optical satellite images by
combining
• Visual Interpretation• Automatic remote sensing techniques

Workshop on the Application of Remote Sensing Technologies to Disaster Response
12 September 2003 Rapid Damage Mapping for post-Earthquake Building Damage Assessment 3
• Pilot project Using remote sensing for post disaster damage assessment”, funded by EPSRC, UK.
• Case study carried out in Gujarat, India

Workshop on the Application of Remote Sensing Technologies to Disaster Response
12 September 2003 Rapid Damage Mapping for post-Earthquake Building Damage Assessment 4
Questions
• Main focus on post earthquake building damage assessment• According to a study, “70-80% success rate using semi-automatic
techniques”• Can visual interpretation do better? • Can a method that combines both achieve better results? • What kind of semi-automatic methods can be used to assess
damages to buildings?• What kind of damage maps will be useful for search and rescue or
during the reconstruction phase?

Workshop on the Application of Remote Sensing Technologies to Disaster Response
12 September 2003 Rapid Damage Mapping for post-Earthquake Building Damage Assessment 5
Satellite images acquired for pilot project
1m B&W
1m B&W
Image type
IKONOS2
IKONOS2
Satellite
OXBhuj
OOAhmedabad
PostPrePlace name

Workshop on the Application of Remote Sensing Technologies to Disaster Response
12 September 2003 Rapid Damage Mapping for post-Earthquake Building Damage Assessment 6
Sample IKONOS image
(left) Full view of IKONOS 1m panchromatic satellite image of west Ahmedabad, Gujarat, India, taken on 27 January 2001, a day after the earthquake. Covers121km2.
Zoom in of the image

Workshop on the Application of Remote Sensing Technologies to Disaster Response
12 September 2003 Rapid Damage Mapping for post-Earthquake Building Damage Assessment 7
Which is better?
Panchromatic image(from Reuters web page)Multispectral image

Workshop on the Application of Remote Sensing Technologies to Disaster Response
12 September 2003 Rapid Damage Mapping for post-Earthquake Building Damage Assessment 8
Three visual interpretation experiments using the satellite images
Experiment 1 - Comparison study using ground photos and post-earthquake IKONOS satellite image of Bhuj
Experiment 2 - Comparison study using pre- and post-earthquake images of Ahmedabad
Experiment 3 - Area based damage assessment study
Workshop on the Application of Remote Sensing Technologies to Disaster Response
12 September 2003 Rapid Damage Mapping for post-Earthquake Building Damage Assessment 9
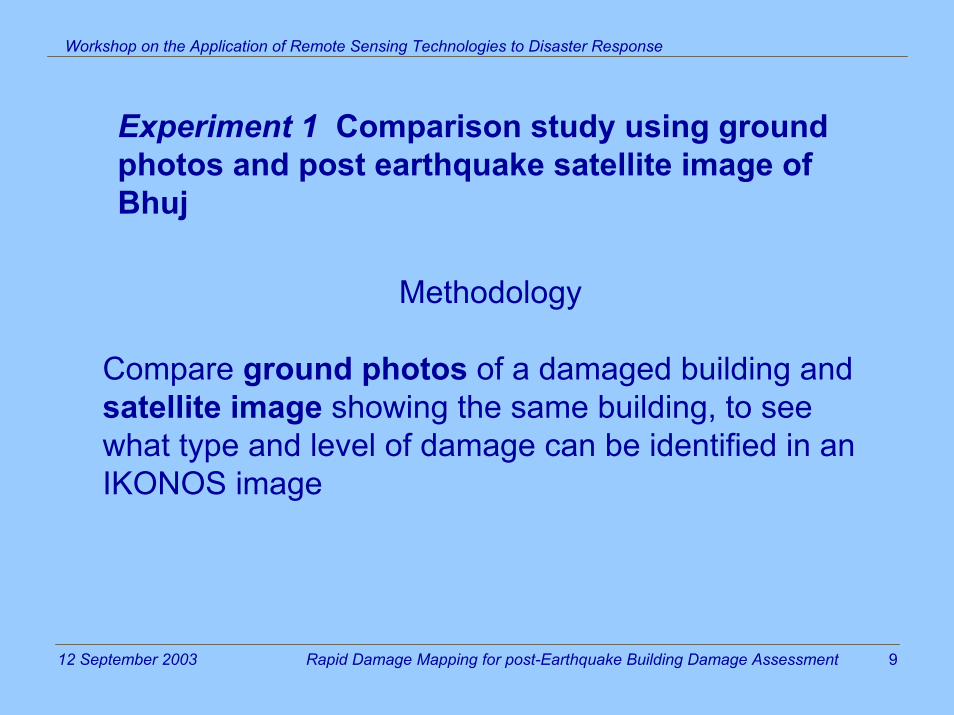
Experiment 1 Comparison study using ground photos and post earthquake satellite image of Bhuj
Methodology
Compare ground photos of a damaged building and satellite image showing the same building, to see what type and level of damage can be identified in an IKONOS image

Workshop on the Application of Remote Sensing Technologies to Disaster Response
12 September 2003 Rapid Damage Mapping for post-Earthquake Building Damage Assessment 10
Image interpretation
Chris Going (Cambridge Architectural Research)
Michael Markus (University of Karlsruhe)
Keiko Saito (The Martin centre, University of Cambridge)

Workshop on the Application of Remote Sensing Technologies to Disaster Response
12 September 2003 Rapid Damage Mapping for post-Earthquake Building Damage Assessment 11
Location of buildings recorded using handheld GPS single measurement (red dots).
Ground photos of 24 buildings taken approximately a week after the earthquake by Michael Markus.
IKONOS 1m panchromatic Date & Time: 2/2/2001, 6:05am Processing Level: Geometrically CorrectedPositional accuracy: 50m Map Projection: UTM 42 NDatum: WGS84Pixel Size: resampled to 1mSun angle: 45o
Area size: 100km2
Supplied by Space Imaging Middle East.
Data sources
Workshop on the Application of Remote Sensing Technologies to Disaster Response
12 September 2003 Rapid Damage Mapping for post-Earthquake Building Damage Assessment 12
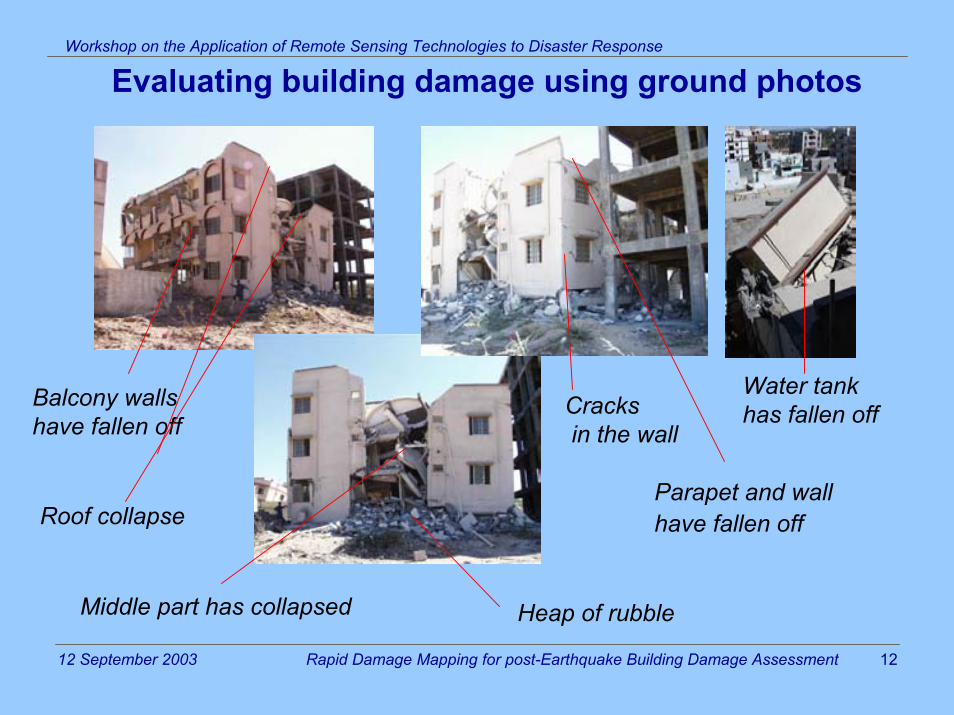
Evaluating building damage using ground photos
Parapet and wall have fallen off
Middle part has collapsed
Cracksin the wall
Balcony walls have fallen off
Roof collapse
Water tank has fallen off
Heap of rubble

Workshop on the Application of Remote Sensing Technologies to Disaster Response
12 September 2003 Rapid Damage Mapping for post-Earthquake Building Damage Assessment 13
Comparison with satellite image
Observations•Balcony walls fallen off•Roof collapse•Partial collapse•Big pile of rubble•Roof and wall fallen off•Cracks in the wall•Damage to water tank
Building no.43Visible•Displacement of thewater tank
Not Visible•Shadow is hiding the rubble•Partial collapse in the middle section not clear•Damage to walls not visible

Workshop on the Application of Remote Sensing Technologies to Disaster Response
12 September 2003 Rapid Damage Mapping for post-Earthquake Building Damage Assessment 14
Create Database

Workshop on the Application of Remote Sensing Technologies to Disaster Response
12 September 2003 Rapid Damage Mapping for post-Earthquake Building Damage Assessment 15
ResultsTypes of visible damages
1. Totally collapsed buildings.

Workshop on the Application of Remote Sensing Technologies to Disaster Response
12 September 2003 Rapid Damage Mapping for post-Earthquake Building Damage Assessment 16
However, if the building is located in a built up area, it is difficult to identify
even if the building had totally collapsed.

Workshop on the Application of Remote Sensing Technologies to Disaster Response
12 September 2003 Rapid Damage Mapping for post-Earthquake Building Damage Assessment 17
2. Tilted buildings

Workshop on the Application of Remote Sensing Technologies to Disaster Response
12 September 2003 Rapid Damage Mapping for post-Earthquake Building Damage Assessment 18
3. Displacement of Building Appendages

Workshop on the Application of Remote Sensing Technologies to Disaster Response
12 September 2003 Rapid Damage Mapping for post-Earthquake Building Damage Assessment 19
4. Split in the middle of a high-rise building

Workshop on the Application of Remote Sensing Technologies to Disaster Response
12 September 2003 Rapid Damage Mapping for post-Earthquake Building Damage Assessment 20
5. Overturned buildings

Workshop on the Application of Remote Sensing Technologies to Disaster Response
12 September 2003 Rapid Damage Mapping for post-Earthquake Building Damage Assessment 21
6. Debris

Workshop on the Application of Remote Sensing Technologies to Disaster Response
12 September 2003 Rapid Damage Mapping for post-Earthquake Building Damage Assessment 22
Effect of shadows
Shadows can hide information

Workshop on the Application of Remote Sensing Technologies to Disaster Response
12 September 2003 Rapid Damage Mapping for post-Earthquake Building Damage Assessment 23
Shadows could be used to estimate building height

Workshop on the Application of Remote Sensing Technologies to Disaster Response
12 September 2003 Rapid Damage Mapping for post-Earthquake Building Damage Assessment 24
Non-visible damage
Lower Storey collapse

Workshop on the Application of Remote Sensing Technologies to Disaster Response
12 September 2003 Rapid Damage Mapping for post-Earthquake Building Damage Assessment 25
Damages on low rise buildings
Low rise buildings tend to have small area size

Workshop on the Application of Remote Sensing Technologies to Disaster Response
12 September 2003 Rapid Damage Mapping for post-Earthquake Building Damage Assessment 26
Damages on buildings located in built up areas
Possible, but difficult without the help of ground photos.

Workshop on the Application of Remote Sensing Technologies to Disaster Response
12 September 2003 Rapid Damage Mapping for post-Earthquake Building Damage Assessment 27
Summary
Not visible
Damages in built up areas, even totally collapsed (difficult without pre-damage image or ground photo)Damages hidden in the shadowsDamages on walls (cracks etc)Damages on low rise buildingsStorey collapse
Visible
Totally collapsed single buildingsHeavily tilted buildingsWater tank displacementSplit in the middle of a high risebuildingTurned over buildingsDebris Shadows (shape and height)
High rise buildings Low rise buildings, built up areas
Workshop on the Application of Remote Sensing Technologies to Disaster Response
12 September 2003 Rapid Damage Mapping for post-Earthquake Building Damage Assessment 28
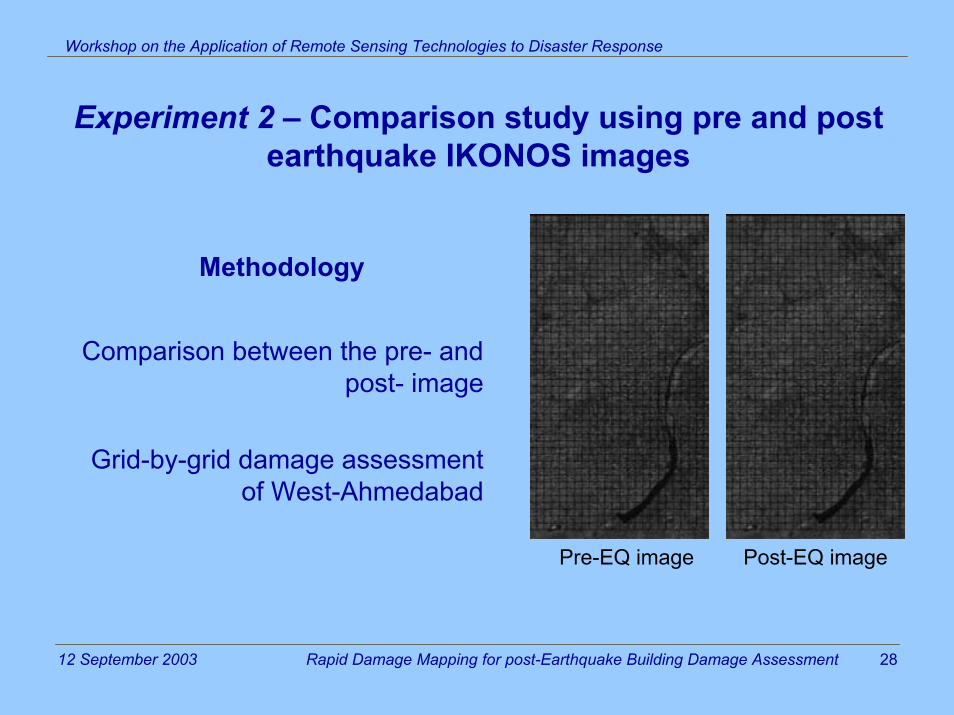
Experiment 2 – Comparison study using pre and post earthquake IKONOS images
Methodology
Comparison between the pre- and post- image
Grid-by-grid damage assessment of West-Ahmedabad
Pre-EQ image Post-EQ image

Workshop on the Application of Remote Sensing Technologies to Disaster Response
12 September 2003 Rapid Damage Mapping for post-Earthquake Building Damage Assessment 29
Possible to find collapsed and severely damaged buildings

Workshop on the Application of Remote Sensing Technologies to Disaster Response
12 September 2003 Rapid Damage Mapping for post-Earthquake Building Damage Assessment 30
Collapsed buildings

Workshop on the Application of Remote Sensing Technologies to Disaster Response
12 September 2003 Rapid Damage Mapping for post-Earthquake Building Damage Assessment 31

Workshop on the Application of Remote Sensing Technologies to Disaster Response
12 September 2003 Rapid Damage Mapping for post-Earthquake Building Damage Assessment 32
Out of the 12 collapsed buildings found,10 had collapsed, 2 had not collapsed. Took 15 hours to complete assessment

Workshop on the Application of Remote Sensing Technologies to Disaster Response
12 September 2003 Rapid Damage Mapping for post-Earthquake Building Damage Assessment 33
Experiment 3 – Area based damage assessment study
Methodology
Carry out a grid by grid damage assessment only using the post-earthquake image
Assign a damage level toeach grid based on a pre-defined classification
Result of area-based damage assessment
Workshop on the Application of Remote Sensing Technologies to Disaster Response
12 September 2003 Rapid Damage Mapping for post-Earthquake Building Damage Assessment 34
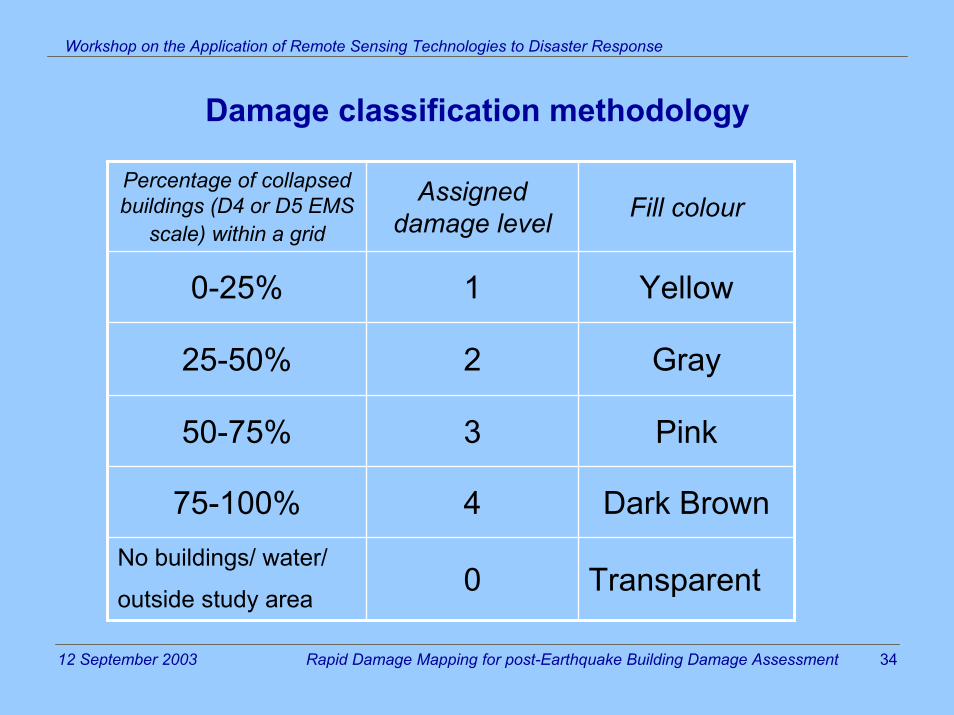
Damage classification methodology
Transparent0No buildings/ water/
outside study area
Dark Brown475-100%
Pink350-75%
Gray225-50%
Yellow10-25%
Fill colourAssigned damage level
Percentage of collapsed buildings (D4 or D5 EMS
scale) within a grid

Workshop on the Application of Remote Sensing Technologies to Disaster Response
12 September 2003 Rapid Damage Mapping for post-Earthquake Building Damage Assessment 35
Result of visual damage interpretation

Workshop on the Application of Remote Sensing Technologies to Disaster Response
12 September 2003 Rapid Damage Mapping for post-Earthquake Building Damage Assessment 36
Comparison with ground survey result
EPC ground survey resultVisual interpretation
“General damage pattern agrees with the ground survey”

Workshop on the Application of Remote Sensing Technologies to Disaster Response
12 September 2003 Rapid Damage Mapping for post-Earthquake Building Damage Assessment 37
Discrepancy
153126Total
3425212401-1
Number of gridsDiscrepancy
General tendency to underestimate – need for training

Workshop on the Application of Remote Sensing Technologies to Disaster Response
12 September 2003 Rapid Damage Mapping for post-Earthquake Building Damage Assessment 38
Analysis of the discrepancy
Resampling method to be blamed?
Original EPC damage map Resampled EPC damage map

Workshop on the Application of Remote Sensing Technologies to Disaster Response
12 September 2003 Rapid Damage Mapping for post-Earthquake Building Damage Assessment 39
North part of Walled city has many low-rise buildings in a densely built-up area
Grids with 3 (yellow) and 2 (light blue) levels of discrepancy. The map is the original EPC damage survey

Workshop on the Application of Remote Sensing Technologies to Disaster Response
12 September 2003 Rapid Damage Mapping for post-Earthquake Building Damage Assessment 40
Better results in the south, where there are many modern middle to high rise buildings Grids that match EPC survey results

Workshop on the Application of Remote Sensing Technologies to Disaster Response
12 September 2003 Rapid Damage Mapping for post-Earthquake Building Damage Assessment 41
Implications
Resolution of IKONOS images are good enough to be used for visualinterpretation
-Develop an easy-to-use visual damage assessment manual- How can the accuracy of the assessment be improved?
Limitations include;-shadows-built up areas, small buildings -weather (cloud cover)-availability of pre-event imagery

Workshop on the Application of Remote Sensing Technologies to Disaster Response
12 September 2003 Rapid Damage Mapping for post-Earthquake Building Damage Assessment 42
Next Phase
• Concentrate on the use of post-event images only.
• Visual interpretation – continue to accumulate experience using other data sets, modify area-based assessment classification method
• Experiment on semi-automatic remote sensing techniques – stereo viewing using pre- and post-event imagery, extraction of building footprints using edge detection techniques, unsupervised classification, supervised classification, texture analysis and rectification in the horizontal and vertical planes.

Workshop on the Application of Remote Sensing Technologies to Disaster Response
12 September 2003 Rapid Damage Mapping for post-Earthquake Building Damage Assessment 43
Elements in the process of creating a rapid damage map
1. Obtaining information on the building stock e.g. footprints, function of the building, height, area size, material of building.
2. Assessment of the damage to each building, e.g. total collapse, tilted, lower storey collapse.
3. Creating the damage map, e.g. area-based damage mapping, building-by-building damage mapping, mapping of the roads.
Workshop on the Application of Remote Sensing Technologies to Disaster Response
12 September 2003 Rapid Damage Mapping for post-Earthquake Building Damage Assessment 44
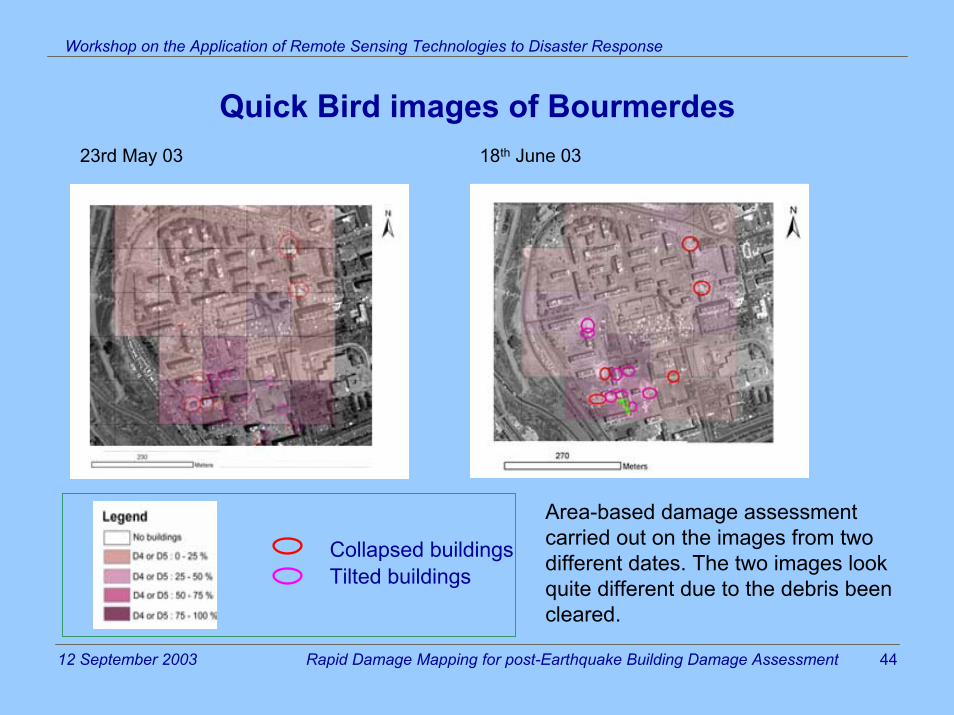
Quick Bird images of Bourmerdes23rd May 03 18th June 03
Collapsed buildingsTilted buildings
Area-based damage assessment carried out on the images from two different dates. The two images look quite different due to the debris been cleared.

Workshop on the Application of Remote Sensing Technologies to Disaster Response
12 September 2003 Rapid Damage Mapping for post-Earthquake Building Damage Assessment 45
Observed change between the May and June images
23rd May 18th June
Additional damage was observed on the image from June. Note the difference in the look angle as well.

Workshop on the Application of Remote Sensing Technologies to Disaster Response
12 September 2003 Rapid Damage Mapping for post-Earthquake Building Damage Assessment 46
Comparison with the IKONOS images of Gujarat cities
Ahmedabad, 29th January 01 Walled city-Bhuj, 2nd February 01 Bourmerdes, 18th June 03
•Different morphology of the three cites •Difference in building density – less obstruction by the shadows in Bourmerdes image•Façade visible in Ahmedabad image – look angle is 61 degrees – ideal for visual interpretation, not ideal for change detection

Workshop on the Application of Remote Sensing Technologies to Disaster Response
12 September 2003 Rapid Damage Mapping for post-Earthquake Building Damage Assessment 47
Multispectral images
•Spatial resolution not good enough to be used as it is for visual interpretation of damage to buildings•The colours can help understand the nature of the object – in this case, tents. •Other use – NDVI (to exclude vegetation), material of buildings

Workshop on the Application of Remote Sensing Technologies to Disaster Response
12 September 2003 Rapid Damage Mapping for post-Earthquake Building Damage Assessment 48
GPSUsing high-resolution satellite images as a map
• “Satellite image map” created using standard GIS software.• Used to reach sites with collapsed buildings.• Especially useful in areas where readily made maps are not available.
Location of sites with
potential collapsed buildings
Upload/ Download positional data with your GPS
Coordinates of the
building sites can be displayed. (in this case, UTM)
Major Road names

Workshop on the Application of Remote Sensing Technologies to Disaster Response
12 September 2003 Rapid Damage Mapping for post-Earthquake Building Damage Assessment 49
Other potentially useful tool
Stereo imagery
• No case studies yet (using satellite imagery).
• Expensive

Workshop on the Application of Remote Sensing Technologies to Disaster Response
12 September 2003 Rapid Damage Mapping for post-Earthquake Building Damage Assessment 50
Obstacles of using optical satellite images?
• Cloud cover, Smoke, Shadows, Tall buildings, Built up areas • In such case, other means of detecting damage should be considered.
• However, the majority of the major earthquakes in the last few years were, or could have been, covered by cloud free satellite images, e.g. Kobe, Northridge, Kocaeli, Seattle, Gujarat, Miyagi and Bourmerdes.
high probability of cloud free coverage?

Workshop on the Application of Remote Sensing Technologies to Disaster Response
12 September 2003 Rapid Damage Mapping for post-Earthquake Building Damage Assessment 51
Conclusion
• The use of high-resolution optical satellite images for damage mapping is feasible. Should be further pursued.
• Research collaboration for rapid acquisition of satellite imageswould be useful.
• Acquisition of ground truth data is time consuming. Negotiations can be delicate. Could be assisted by international associations such as EERI. Agreements offering reciprocal benefits to the provider of
ground truth information likely to be needed.