q1 financial presentation 2017 dof asa asa/ir/2017/dof_q1_2017.pdf · dof asa - q1 presentation...
TRANSCRIPT

Q1 Financial Presentation 2017
DOF ASA

2 DOF ASA - Q1 presentation 2017
Highlights Group

DOF ASA - Q1 presentation 2017 3
Average utilisation total fleet 71% in Q1 Low utilisation from subsea project activity, 51% in Q1 Contract awards in Brazil, Argentina and the North Sea Management of three vessels including purchase options Skandi Buzios (4th PLSV) delivered and on-hire 8 yrs contract with Petrobras DOF Subsea completed a new bond issue of USD 175 million DOF Subsea AS reviewing possibilities to apply for a listing on Oslo Stock Exchange
All numbers based on management reporting
Operational EBITDA Q1 MNOK 530 (excl hedge accounting)
Highlights

DOF ASA - Q1 presentation 2017
Total of 3 919 employees • Subsea employees 1 190 • Supply employees 2 729
Positioned globally Head office in Norway Operating from 6 continents 20 offices near key O&G markets 67 vessels globally
Our vessels and subsea equipment Subsea 30 AHTS 20 PSV 17 Total fleet 67
ROV 69 AUV 2
DOF ASA, a global player
26 billion backlog Approx 4 000 employees 67 vessels
4 4

DOF ASA - Q1 presentation 2017
Positioned to deliver Assets • 67 vessels
• Average age approx. 10 years, value adjusted fleet age of 6.8 years
• NOK 31.2 billion in fair market value owned vessels in operation* (100% basis)
• 69 ROVs + 2 ROVs on order • 1 subsea vessel chartered in from
external owner (firm until August 2017)
Backlog • Firm contracts: NOK 26 bn • Options: NOK 33 bn
Total value backlog (firm & options) from 2020 and onwards is MNOK 43,138
30
20
17
1 Subsea
AHTS
PSV
Chartered SubseaVessels
2017 2018 2019 2020 ThereafterOption 429 1 251 1 504 1 824 27 737Firm 4 124 4 354 4 043 3 237 10 337
02 0004 0006 0008 000
10 00012 000
NO
K m
illio
n
Group backlog at 31.03.2017
5 5
Backlog DOF Supply / DOF Subsea at 31.03.2017
(* As per 31.03.2017)
6 DOF ASA - Q1 presentation 2017
Financials Management Reporting

DOF ASA - Q1 presentation 2017 7
• Average utilisation total fleet 71% in Q1 • 81% PSV segment
• 67% AHTS segment
• 68% CSV segment (project fleet 51%)
All numbers based on management reporting
Operational EBITDA Q1 MNOK 530 (excl hedge accounting)
Main Financial Highlights
7%
32%
3%
58%
EBITDA Q1 2017
PSV
AHTS
CSV
DOF Subsea
13%
17%
5% 65%
EBITDA Q1 2016
PSV
AHTS
CSV
DOF Subsea
Comments to highlights
Performance • DOF Subsea EBITDA: MNOK 278
• DOF Supply EBITDA: MNOK 205
Operations • Avg. utilisation of DOF Subsea fleet: 68%
• Avg. utilisation of DOF Supply fleet: 74%
• One vessel sold
• Six vessels in lay-up
• Low utilisation and earnings from project activity
.

DOF ASA - Q1 presentation 2017
Profit & Loss Q1 2017
Comments P&L Q1 Operational performance: PSV: • Decent utilisation but reduced earnings • One vessel sold and one vessel in lay-up AHTS: • Majority of the fleet in Brazil • Two vessels in lay-up • One vessel added to the fleet CSV: • Low utilisation project fleet • One vessel added to the fleet • Three vessels in lay-up
• Impairment: 5% drop in Fair Market Values
during Q1 Finance: • Unrealised gain – strenghten BRL to USD
All figures in NOK million Q1 2017 Q1 2016 2016
Operating income 1 724 2 250 8 776 Operating expenses -1 197 -1 451 -5 745 Net profit/loss from TS and JV 5 2 -10 Net gain on sale of vessel -2 70 171 EBITDA before hedge 530 871 3 193 Hedge operating income -47 -68 -207 Operating profit before depr - EBITDA 483 803 2 986 Depreciation -284 -268 -1 142 Impairment -302 -330 -1 932 Operating profit- EBIT -102 205 -89 Financial income 18 7 1 116 Financial costs -259 -295 -1 190 Net realised currency gain/loss -83 -136 -483 Net profit/loss before unrealised currency -426 -218 -646
Net unrealised currency gain/loss 137 365 800 Net unrealised gain/loss on market instr. 29 182 249 Profit/loss before tax -260 329 403 Tax -43 -61 -202 Net profit/loss -303 267 201 According to management reporting
8 8

DOF ASA - Q1 presentation 2017
Segment reporting Q1 2017 PSV AHTS CSV Total
Amounts in NOK million Q1 2017 Q1 2016 Q1 2017 Q1 2016 Q1 2017 Q1 2016 Q1 2017 Q1 2016
Operating income 181 262 373 383 1 123 1 467 1 677 2 112 Gain on sale of tangible assets -1 - - - -1 70 -2 70 Operating result before depreciation and impairment (EBITDA) 36 101 155 136 291 566 483 803 Depreciation 33 45 76 59 175 164 284 268 Impairment 107 56 54 73 140 201 302 330
Operating result (EBIT) -104 0 25 4 -24 201 -102 205
EBITDA margin 20 % 39 % 42 % 36 % 26 % 39 % 29 % 38 % EBIT margin -57 % 0 % 7 % 1 % -2 % 14 % -6 % 10 %
According to management reporting
8%
32%
60%
EBITDA Q1 2017
PSV AHTS CSV
13% 17%
70%
EBITDA Q1 2016
PSV AHTS CSV
9

DOF ASA - Q1 presentation 2017
Balance as of 31.03.2017 Comments to balance Non current assets:
• Skandi Buzios (CSV) delivered in January • Skandi Waveney (PSV) sold in March
Non current assets:
• Improved cash position after issuance new bond
Equity:
• Outstanding convertible bond by year end MNOK 365 after conversion of MNOK 128 from year end
Non current liabilities: • New loan drawn on one newbuild • New bond issue DOF Subsea
Current liabilities:
• Current part interest bearing debt include 12 months amortisation and accrued interests, no balloons until 2019
Amounts in NOK million 31.03.2017 31.03.2016 31.12.2016
ASSETS Tangible assets 27 340 26 574 27 469 Goodwill 334 419 330 Deferred taxes 958 1 252 1 023 Investment in associated and joint ventures 83 103 70 Other non-current receivables 624 517 619 Non-current assets 29 338 28 865 29 511
Receivables 2 035 2 491 2 243 Cash and cash equivalents 2 640 1 799 2 370 Current assets 4 675 4 289 4 614 Total assets 34 013 33 154 34 125
EQUITY AND LIABILITIES Subscripted equity 2 955 1 452 2 675 Retained equity 1 567 896 1 950 Non-controlling equity 3 472 3 455 3 521 Equity 7 994 5 803 8 146
Non-current interest bearing debt 22 219 21 462 21 901 Other non-current liabilities 151 375 222 Non-current liabilities 22 370 21 838 22 123
Current part of interest bearing debt 2 147 3 853 2 081 Other current liabilities 1 503 1 661 1 775 Current liabilities 3 649 5 514 3 856 Total equity and liabilities 34 013 33 154 34 125 According to management reporting
10
DOF ASA - Q1 presentation 2017
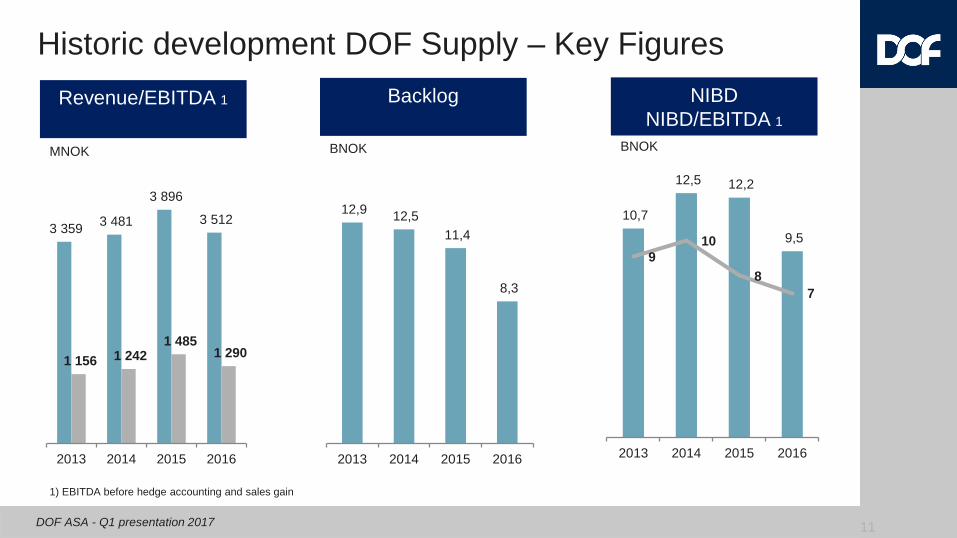
Historic development DOF Supply – Key Figures
11
Revenue/EBITDA 1
Backlog
NIBD
NIBD/EBITDA 1
MNOK BNOK BNOK
1) EBITDA before hedge accounting and sales gain
12,9 12,5 11,4
8,3
2013 2014 2015 2016
10,7
12,5 12,2
9,5 9
10
8 7
2013 2014 2015 2016
3 359 3 481
3 896
3 512
1 156 1 242 1 485
1 290
2013 2014 2015 2016

DOF ASA - Q1 presentation 2017
Historic development DOF Group – Key Figures
12
Revenue/EBITDA 1
Backlog
NIBD
NIBD/EBITDA 1
MNOK BNOK BNOK
1) EBITDA before hedge accounting and sales gain
9 754 10 698 10 991
8 776
3 105 3 339 3 527 3 021
2013 2014 2015 2016
28,9 29,5
32,9
27,2
2013 2014 2015 2016
21,7 22,3 23,5
21,4
7 7 7 7
2013 2014 2015 2016

13 DOF ASA - Q1 presentation 2017
DOF Subsea
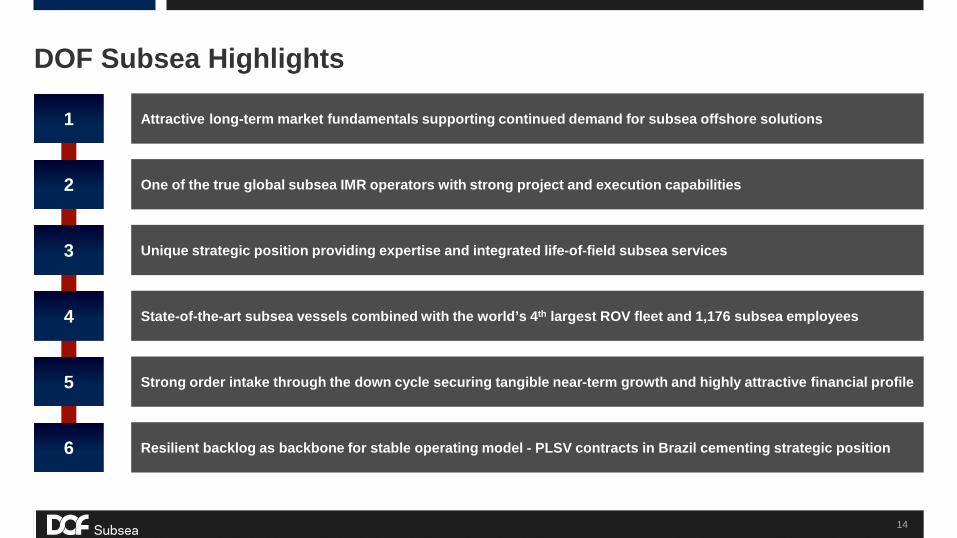
DOF Subsea Highlights
14
Attractive long-term market fundamentals supporting continued demand for subsea offshore solutions
One of the true global subsea IMR operators with strong project and execution capabilities
Unique strategic position providing expertise and integrated life-of-field subsea services
State-of-the-art subsea vessels combined with the world’s 4th largest ROV fleet and 1,176 subsea employees
Strong order intake through the down cycle securing tangible near-term growth and highly attractive financial profile
Resilient backlog as backbone for stable operating model - PLSV contracts in Brazil cementing strategic position
1
2
3
4
5
6

DOF Subsea Group at a glance
15
2005 DOF Subsea established
NOK 5.4bn Revenues FY 2016
1,176 1)
Subsea employees worldwide
NOK 18.3bn Firm backlog
Q1’17
25 2)
Subsea vessels
69 ROVs
Modern State-of-the-art
asset base
Integrated Supplier of subsea offshore services
1) Note: Excluding marine crew 2) Note: Includes newbuilds Skandi Vinland, Skandi Olinda and Skandi Recife and Harvey Deep Sea (chartered)
DOF ASA to remain majority shareholder post transaction

337 553 563
897 1 014 1 246
1 492 1 354 1 667 1 858 1 566
1 278
2005 2006 2007 2008 2009 2010 2011 2012 2013 2014 2015 2016 2019
11 11 13 16 18
21 24 25 26 27 24
21 25
2005 2006 2007 2008 2009 2010 2011 2012 2013 2014 2015 2016 2019Owned vessels Chartered vessels
Focus on consolidation and streamlining of business operations to improve efficiency and
competitiveness in weak market
DOF Subsea established following the acquisition of Geoconsult. The Company was
listed second half 2005.
First Reserve acquires 49% of DOF Subsea, which in the following is delisted from the Oslo
Stock Exchange
Expanding organisation on the back of several large contract awards. Number of employees
and vessels peaking at 1,858 and 27, respectively
Positioned for profitable growth DOF Subsea Board considering listing of
the Company on Oslo Stock Exchange
Large and global organisation following multiple acquisitions from 2005-2010
2010 Century Subsea Covus Subsea
CSL
2005
More than a decade of structural growth and consolidation
16
2008
2014
2016
2017
Development in # of Subsea Employees
Development in # of vessels # of vessels
# of FTEs
SEMAR
Awarded four PLSV long-term contracts in conjunction with TechnipFMC
2013
SWG Offshore

Several major and attractive contracts to commence in 2017
17
ENI Angola
Jan 2017
• IMR contract offshore Angola
• 16 months + 3x4 months options
• Scope comprising project management, engineering, supply of vessels and ROVs
• Long-term charter with Petrobras • 18 months + 18 months options • On contract with Petrobras since
2010 • Vessel co-owned on a 50% basis
through joint venture with TechnipFMC
• First-pipe lay vessel built in Brazil
• Long-term charter with Petrobras
• 8 years + 8 years options • Vessel co-owned on a 50%
basis through joint venture with TechnipFMC
• Built in Norway
• Long-term IMR contract offshore Eastern Canada
• 10 years + 10 years options • IMR scope comprising supply
of new well intervention vessel, two work class ROVs and personnel
• High strategic importance through strengthened presence in the Canadian market
• Long-term FLNG IMR contract awarded in Australia with Shell
• 5 years + 4 options • Scope comprising
underwater services and Multi-Purpose Vessel (MSVP) services spanning project management, engineering and supply of vessel and ROVs
Skandi Vitoria
Jan 2017
Skandi Buzios
Apr 2017 Husky Energy
Jul 2017
Prelude FLNG
Oct 2017

Two businesses
18
DOF Subsea Group
Subsea IMR Projects Long-term Chartering 1)
Revenues 2016
NOK 4.4bn
EBITDA 2) 2016 NOK 0.9bn
~20% margin
Firm backlog NOK 4.3bn (NOK 5bn)
Revenues 2016
NOK 1.0bn
EBITDA 2016 NOK 0.8bn
~80% margin
Firm backlog NOK 14bn
(NOK 13bn)
1) Note: Long-term chartering comprises PLSVs, Skandi Acergy and Skandi Patagonia 2) Note: Excluding gains from sales of assets 3) Note: Skandi Acu delivered August 2016
options options
1,176 employees
1 newbuild
15 vessels
5.3 vessels in 2016 3)
9 vessels by Q1’19
6 vessels in Q1’17

19
Developing competence through numerous projects worldwide Building a leading subsea projects division for over a decade… • Gradual increase in subsea project activity establishing a global footprint in all key offshore regions
− Strong presence in all key regions within Subsea IMR and Mooring operations • Building a high quality asset base leveraging unrivaled operating and vessel competence and experience
− Flexible vessel capacity through combination of owned and chartered-in vessels
…with a clear action plan to pursue further opportunities • Continue to increase the scope and complexity of operations
− Expand engineering capacity to position for market upcycle − Further build and strengthen presence in selected geographies
• Strengthen project backlog with core focus on IMR projects
Subsea IMR Projects
Selected Mooring projects – Last 5 years Selected IMR projects – Last 5 years
Goliat Field support (2016) Saipem CRX/Nene (2014) Call-off for Light Construction Services and Seabed Survey
Services for Statoil (2012-15) Technip Frame agreement (2012-2015) ConocoPhillips ROV Services (2012 and onwards) Freeport McMoran IMR support (2013-2016) Saipem JSM Export Line support (2014-2015) ROV Support vessel Petrobras (2011 and onwards)
Bongot Mooring Replacement PTTEP (2017)
Raroa Mooring OMW (2016-2017)
Gina Krog TMRS (2016)
Catcher Mooring Installation Project (2016)
Goliat FPSO Marine Installation (2011-2015)
Lam Son Mooring Installation PTSC (2014)
Knarr Mooring Project (2013-2014)
Banff Re-instatement Project (2013-2014)

Selected contracts and framework agreements
20
Location Client Scope Commencement Duration
Angola ENI Angola IMR 2017 18 months + 18 months
Canada Husky Energy IMR 2017 10 years + 10 years
Prelude Shell Australia IMR 2017 5 years + 4 years
Brazil Petrobras Inspection 2016 1 year + 1 year
Gorgon, Janz and Wheatstone Chevron Australia IMR 2015 3 years + 2 years
Malampaya Shell Philippines IMR 2014 7 years + 3 years
Brazil Petrobras IMR 2012 6 years + 4 years
Brazil Petrobras IMR 2011 6.5 years + 4 years
North Sea Conoco Philips IMR 2011 8 years + 13 years
Subsea IMR Projects
North Sea / Atlantic Brazil Asia Pacific North America
Gradually built up the region, becoming a top three supplier of IMR services in the GoM
Strong position being one of the major suppliers of
IMR services
Leading supplier of mooring services in the
North Sea and West Africa
Leading supplier of IMR services in the region

DOF Subsea provides state-of-the-art vessels to leading players
21
Long-term Chartering
Skandi Acergy Skandi Acu Skandi Africa
Skandi Niteroi Skandi Patagonia Skandi Vitoria
Skandi Buzios Skandi Recife Skandi Olinda Predominantly day-rate based as DOF Subsea mainly provides vessel services Remuneration
Strong long-term contract coverage with a typical duration of more than five years – seven out of eight available vessels on contract
Contracts
Fleet of high-end and sophisticated vessels operating advanced subsea projects with comprehensive work scope for third parties
Operations
Selected clients
Construction support vessel
Construction & pipe laying vessel
Construction & pipe laying vessel
Construction & pipe laying vessel
Construction & pipe laying vessel
Construction & pipe laying vessel
Construction & pipe laying vessel
Dive support vessel
Construction & pipe laying vessel
7 vessels in operation
2 contracted newbuilds
NOK 14bn firm backlog
per Q1’17

Vessel Built Client Firm end Option end J F M A M J J A S O N D J F M A M J J A S O N D J F M A M J J A S O N D J F M A M J J A S O N D J F M A M J J A S O N D
Skandi Patagonia 2000 Jun-25
Skandi Acergy 2008 Aug-19
Skandi Niteroi 2010 Feb-17
Skandi Vitoria 2010 Sep-18
Skandi Africa 2015 Aug-20 Aug-25
Skandi Acu Aug-16 Aug-24 Aug-32
Skandi Buzios Apr-17 Apr-25 Jun-33
Skandi Recife Jun-18 Jun-26 Jun-34
Skandi Olinda Feb-19 Jun-27 Mar-35
Contract overview - Long-term Chartering 2017 2018 2019 2020 2021Subsea vessel
Built year
Current client
Firm end
Option
end
Strong contract coverage provides robust backbone for growth
22
Long-term Chartering
~5.5 years Average contract coverage
(October 2022)
NOK 0.8 bn EBITDA contribution
in 2016
~5.3 Operational vessels
in 20161)
9
Vessels in operation from Q1’19
Approx. NOK 6.1bn2) of the Group’s debt against long-term chartered vessels
Under negotiation
1) Note: Skandi Acu delivered August 2016 2) As of Q1’17

Competitive landscape and positioning
23
Positioning DOF Subsea
• Improved competitive position for DOF Subsea when market normalises − multiple competitors have scaled down
operations or entered financial distress
• Favourable competitive dynamics in tendering for mid-sized subsea IMR projects − Larger EPCI providers typically invited to
tender, however less capable and willing to meet specific project requirements due to relatively small project size
− Vessel suppliers typically not invited to tenders due to lack of engineering capabilities
• DOF Subsea reaping benefits from offering an integrated engineering and vessel solution
IMR
/ Li
ght
Con
stru
ctio
n SU
RF
Larg
e pr
ojec
ts
(dee
pwat
er)
Dayrate / Support services Small to medium EPCI contracts Larger EPCI contracts
Illustrative
= Chapter 11 / liquidation
Source: ABGSC

15,5 16 17
21,5
18,9
2012 2013 2014 2015 2016
Key financials | DOF Subsea
24
Revenue EBITDA1 Backlog (excl. options)
5 249
6 579
7 422 7 251
5 426
2012 2013 2014 2015 2016
1 799 1 949
2 097 2 041
1 733
2012 2013 2014 2015 2016
NOKm NOKm NOKbn
1) Note: EBITDA excl. profit from sale of non-current assets

DOF ASA - Q1 presentation 2017
No change in guidance for 2017 (MNOK 2 400 – MNOK 2 800)
Better EBITDA Q2 compared to Q1
Outlook
25

Thank you Presented by Mons Aase - CEO Hilde Drønen - CFO

DOF ASA - Q1 presentation 2017
DISCLAIMER This presentation by DOF ASA designed to provide a high level overview of aspects of the operations of the DOF ASA Group. The material set out in the presentation is current as at 12 May 2017. This presentation contains forward-looking statements relating to operations of the DOF ASA Group that are based on management’s own current expectations, estimates and projections about matters relevant to DOF ASA‘s future financial performance. Words such as “likely”, “aims”, “looking forward”, “potential”, “anticipates”, “expects”, “predicts”, “plans”, “targets”, “believes” and “estimates” and similar expressions are intended to identify forward-looking statements. References in the presentation to assumptions, estimates and outcomes and forward-looking statements about assumptions, estimates and outcomes, which are based on internal business data and external sources, are uncertain given the nature of the industry, business risks, and other factors. Also, they may be affected by internal and external factors that may have a material effect on future business performance and results. No assurance or guarantee is, or should be taken to be, given in relation to the future business performance or results of the DOF ASA Group or the likelihood that the assumptions, estimates or outcomes will be achieved. While management has taken every effort to ensure the accuracy of the material in the presentation, the presentation is provided for information only. DOF ASA , its officers and management exclude and disclaim any liability in respect of anything done in reliance on the presentation. All forward-looking statements made in this presentation are based on information presently available to management and DOF ASA assumes no obligation to update any forward looking- statements. Nothing in this presentation constitutes investment advice and this presentation shall not constitute an offer to sell or the solicitation of any offer to buy any securities or otherwise engage in any investment activity. You should make your own enquiries and take your own advice (including financial and legal advice) before making an investment in the company's shares or in making a decision to hold or sell your shares.
27