q - dof group asa/ir/2017/dof asa q4 2017 financial... · q dof asa financial report. management...
TRANSCRIPT

Q4 2017DOF ASA Financial Report
Management reporting - accounts 4th quarter 2017
(MNOK) Q4 2017 Q4 2016 2017 2016
Operating income 1 995 1 912 7 376 8 569
Operating expenses -1 379 -1 319 -5 076 -5 745
Net profit from associated and joint ventures -10 5 -15 -10
Net gain on sale of tangible assets 3 98 2 171
Operating profit before depreciation and impairment - EBITDA 610 695 2 287 2 986
Depreciation -285 -304 -1 145 -1 142
Impairment -340 -413 -1 322 -1 932
Operating profit - EBIT -15 -21 -180 -89
Financial income 9 29 51 1 116
Financial costs -321 -337 -1 118 -1 190
Net realised gain/loss on currencies -59 -200 -227 -483
Profit before unrealised finance costs -386 -530 -1 474 -646
Unrealised finance costs -264 -95 363 1 049
Profit (loss) before taxes -649 -625 -1 111 403
Taxes -203 -89 -244 -202
Profit (loss) -853 -714 -1 355 201
(MNOK) Q4 2017 Q4 2016 2017 2016
Net cash from operation activities 481 615 1 150 2 003
Net cash from investing activities -159 607 -1 292 -2 707
Net cash from financing activities -14 -1 104 218 910
Net changes in cash and cash equivalents 308 119 76 205
Cash and cash equivalents at start of the period 2 137 2 260 2 370 2 220
Exchange gain/loss on cash and cash equivalents -11 -8 -12 -54
Cash and cash equivalents at the end of the period 2 434 2 370 2 434 2 370
(MNOK) 31.12.2017 31.12.2016
ASSETSTangible assets 25 793 27 469
Goodwill 324 330
Deferred taxes 779 1 023
Investment in associated companies and joint ventures 71 70
Other non-current financial assets 635 619
Total non-current assets 27 604 29 511
Receivables 2 165 2 243
Cash and cash equivalents 2 434 2 370
Total current assets 4 599 4 614
Total assets 32 203 34 125
EQUITY AND LIABILITIESEquity 7 342 8 146
Non-current liabilities 20 769 22 123
Current liabilities 4 092 3 856
Total liabilities 24 861 25 979
Total equity and liabilities 32 203 34 125
Net interest bearing liabilities 20 550 21 442
RESULT
BALANCE
CASH FLOW
IndexFinancial report 4th Quarter 2017 4
Accounts Q4 2017 10
Consolidated income statement 10
Consolidated statement of financial position 11
Consolidated statement of equity 12
Cashflow 13
Notes to the Accounts 14
Note 1 General 14
Note 2 Management reporting 16
Note 3 Segment information - management reporting 17
Note 4 Hedges 17
Note 5 Tangible assets 18
Note 6 Investment in associated and joint ventures 19
Note 7 Cash and cash equivalent 19
Note 8 Interest bearing liabilities 20
Note 9 Subsequent events 21
Note 10 Transaction with related parties 21
Note 11 Taxes 21
Note 12 Share capital and shareholders 22
Note 13 Performance measurements definitions 23

FINANCIAL REPORT Q4 2017 DOF ASA4
KEY INFORMATIONGroup EBITDA (management reporting) NOK 610 million (NOK 649 million excl. hedge accounting)
A refinancing completed in December• Private placement of NOK 500 million in DOF ASA• Share issue and increased ownership in DOF Subsea AS• Extended maturity DOFSUB07 bond with two years• Extended soft terms in DOF Rederi AS 3.8 bn facility and extension credit facility until 2021 • A subsequent offering of NOK 202 million has been completed in February 2018
Fleet utilisation of 76%• 80% subsea fleet, 67% AHTS fleet and 82% PSV fleet, 5 vessels in lay-up by end of the quarter
Two vessels sold in the period• Skandi Marstein, PSV built in 1996• Skandi Møgster, AHTS built in 1998
Total fleet of 67 vessels:• 20 AHTSs, 16 PSVs, 29 Subsea vessels, 2 newbuilds (PLSVs), and 71 ROVs• Several contract awards both in the Subsea IRM project segment and for the PSV and AHTS fleet. Main highlight in
Q4 was Skandi Darwin on-hire on a 5-year contract with Shell at the Prelude field outside Australia
Increased tender activity and signs of higher activity within some regions and segments
Financial report 4th Quarter 2017
Management reporting Financial reporting
(MNOK) Q4 2017 Q4 2016 2017 2016 Q4 2017 Q4 2016 2017 2016
Operating income 1 995 1 912 7 376 8 569 1 794 1 778 6 665 8 134
EBITDA* 610 695 2 287 2 986 428 590 1 798 2 621
EBIT -15 -21 -180 -89 -112 -58 -358 -203
Net financial costs -649 -625 -1 111 403 -549 -589 -763 562
Profit (loss) -853 -714 -1 355 201 -853 -714 -1 355 201
Ebitda before hedge 649 738 2 458 3 193 467 633 1 969 2 828
NIBD (Net interest bearing debt) 20 550 21 442 16 802 17 494
Equity Ratio 23 % 24 % 26 % 27 %
KEY FIGURES
0
12 000
10 000
8 000
6 000
4 000
2 000
2018967
5 037Option
Firm
20191 5774 199
20201 7843 305
20212 2522 648
Thereafter26 9207 820
Group Backlog per 31.12.2017
Group backlog of NOK 23 billion
* Incl. gain from sale of assets

FINANCIAL REPORT Q4 2017DOF ASA 5
Q4 Operations
Results from the segments:
(MNOK) PSV AHTS CSV Total
Operating income 204 366 1 425 1 995
Net gain on sale of tangible assets 1 2 - 3
Operating result before depreciation and impairment - EBITDA 36 150 425 610
Depreciation 29 64 192 285
Impairment 160 97 83 340
Operating result - EBIT -154 -11 150 -15
EBITDA margin 17 % 41 % 30 % 31 %
EBIT margin -75 % -3 % 11 % -1 %
The main part of the Group’s PSV and AHTS fleet operate on firm contracts or in the spot market, while the Subsea fleet partly are utilized on term contracts or on subsea IRM (Inspection, Repair and Maintenance) project contracts.
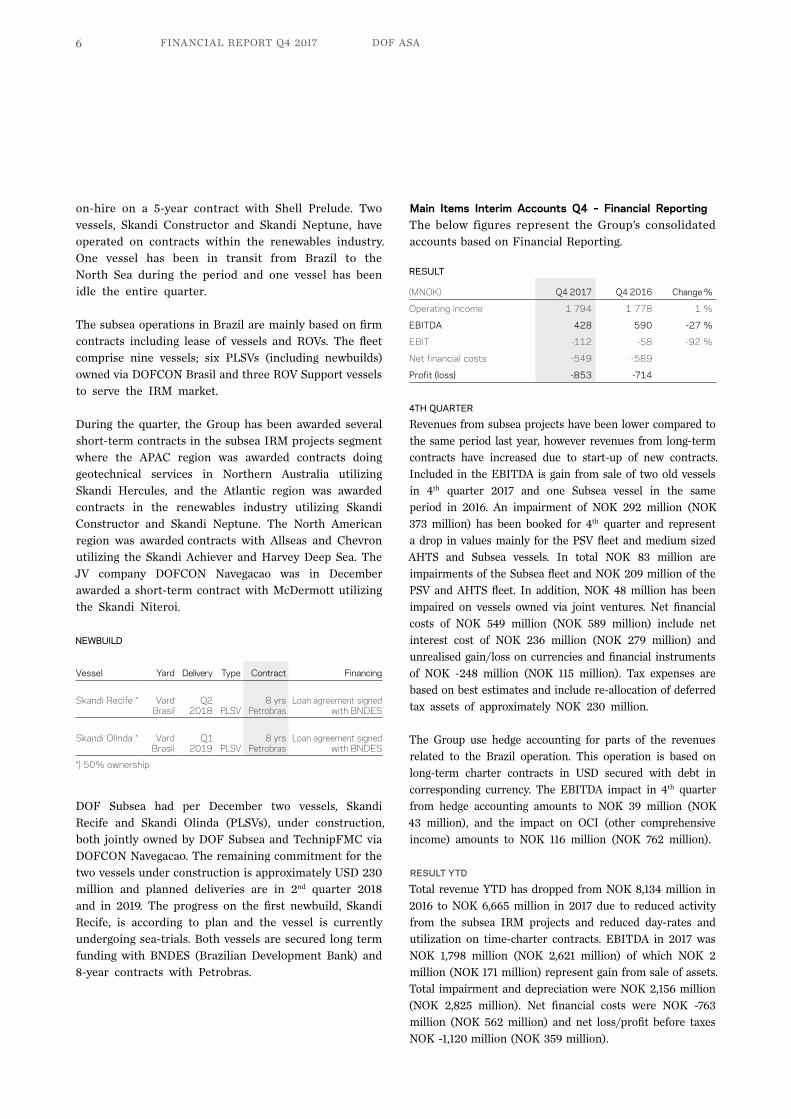
PSV
The PSV fleet included by year end 16 vessels of which one vessel is owned via a minority share. The majority of the fleet has operated on term contracts, and in the spot market in the North Sea. Average utilization was 82% in 4th quarter and 82% for the full year. The activity in the North Sea market declined during October, but was somewhat higher a couple of weeks in December. Two vessels completed two contracts in APAC, whereof one vessel continued on a new contract in the same region and one vessel started a contract in the Black Sea. Skandi Marstein, built 1996, was sold and delivered to a new owner in December. By the end of the quarter the Group had one PSV in lay-up.
Skandi Foula was awarded a contract with Allseas in the Black Sea and Skandi Sotra started on a contract with Chevron after finishing their contracts with TechnipFMC in APAC. Skandi Gamma and Skandi Rona were extended by Wintershall and Shell respectively, and secured utilization into 1st quarter 2018. Skandi Feistein finished a long-term contract with ConocoPhillips in December and was awarded a contract with Saipem in Egypt.
AHTS
The AHTS fleet includes 18 vessels and in addition two vessels on management. Five vessels are 50% owned via DOF Deepwater AS and one vessel is owned via a minority
share in Iceman AS. Average utilization for the AHTS fleet was 67% in 4th quarter and 69% for the full year.
During 4th quarter 12 vessels operated in South-America, all on firm contracts. In Brazil 10 out of 11 vessels have Brazilian flag. The operations in this region have continued to show stable utilization and earnings, and only been impacted by vessels being idle due to class dockings. In the North Sea one vessel has operated on a firm contract and three vessels have operated in the spot market, including Skandi Bergen (management vessel) which entered the North Sea during 3rd quarter. The utilization and earnings in the North Sea spot market have been variable and shown reduced earnings compared to previous quarter. Skandi Iceman started on a contract in Nigeria in December and was secured work during parts of the winter season. Skandi Møgster, built 1998, was sold and delivered to new owners in November. The AHTS fleet in Asia comprises three vessels, where the market has continued to be weak. By year-end four vessels were in lay-up.
SUBSEA
During the 4th quarter the Group operated a fleet of 29 Subsea vessels, of which two vessels were hired in from external owners. The majority of the fleet is owned by the subsidiary DOF Subsea AS.
The revenues from the subsea operation include revenues from subsea IRM project contracts and long-term contracts. The revenues from the subsea IRM contracts during 4th quarter amounted to NOK 877 million (NOK 819 million). The Group’s project activity is operated by the regions in the Atlantic, Asia Pacific, North-America, and South-America (Brazil). The overall utilization of the subsea fleet during the period was 80% and 71% for the full year.
During 4th quarter the Group has seen increased subsea IRM project activity in both the Asia Pacific region and in the North American region with increased utilization of both personnel and assets. In the Atlantic and Brazil region the activity has decreased. The overall vessel utilization for both owned and chartered in vessel in the 4th quarter was 80%, where the utilization in the long-term chartering segment was 87%, and 75% in the subsea IRM projects segment.
The Group has seen improved performance in the subsea IRM projects segment compared to 3rd quarter where one highlight was Skandi Darwin which went
FINANCIAL REPORT Q4 2017 DOF ASA6
on-hire on a 5-year contract with Shell Prelude. Two vessels, Skandi Constructor and Skandi Neptune, have operated on contracts within the renewables industry. One vessel has been in transit from Brazil to the North Sea during the period and one vessel has been idle the entire quarter.
The subsea operations in Brazil are mainly based on firm contracts including lease of vessels and ROVs. The fleet comprise nine vessels; six PLSVs (including newbuilds) owned via DOFCON Brasil and three ROV Support vessels to serve the IRM market.
During the quarter, the Group has been awarded several short-term contracts in the subsea IRM projects segment where the APAC region was awarded contracts doing geotechnical services in Northern Australia utilizing Skandi Hercules, and the Atlantic region was awarded contracts in the renewables industry utilizing Skandi Constructor and Skandi Neptune. The North American region was awarded contracts with Allseas and Chevron utilizing the Skandi Achiever and Harvey Deep Sea. The JV company DOFCON Navegacao was in December awarded a short-term contract with McDermott utilizing the Skandi Niteroi.
DOF Subsea had per December two vessels, Skandi Recife and Skandi Olinda (PLSVs), under construction, both jointly owned by DOF Subsea and TechnipFMC via DOFCON Navegacao. The remaining commitment for the two vessels under construction is approximately USD 230 million and planned deliveries are in 2nd quarter 2018 and in 2019. The progress on the first newbuild, Skandi Recife, is according to plan and the vessel is currently undergoing sea-trials. Both vessels are secured long term funding with BNDES (Brazilian Development Bank) and 8-year contracts with Petrobras.
Main Items Interim Accounts Q4 – Financial ReportingThe below figures represent the Group’s consolidated accounts based on Financial Reporting.
RESULT
(MNOK) Q4 2017 Q4 2016 Change %
Operating income 1 794 1 778 1 %
EBITDA 428 590 -27 %
EBIT -112 -58 -92 %
Net financial costs -549 -589
Profit (loss) -853 -714
4TH QUARTER
Revenues from subsea projects have been lower compared to the same period last year, however revenues from long-term contracts have increased due to start-up of new contracts. Included in the EBITDA is gain from sale of two old vessels in 4th quarter 2017 and one Subsea vessel in the same period in 2016. An impairment of NOK 292 million (NOK 373 million) has been booked for 4th quarter and represent a drop in values mainly for the PSV fleet and medium sized AHTS and Subsea vessels. In total NOK 83 million are impairments of the Subsea fleet and NOK 209 million of the PSV and AHTS fleet. In addition, NOK 48 million has been impaired on vessels owned via joint ventures. Net financial costs of NOK 549 million (NOK 589 million) include net interest cost of NOK 236 million (NOK 279 million) and unrealised gain/loss on currencies and financial instruments of NOK -248 million (NOK 115 million). Tax expenses are based on best estimates and include re-allocation of deferred tax assets of approximately NOK 230 million.
The Group use hedge accounting for parts of the revenues related to the Brazil operation. This operation is based on long-term charter contracts in USD secured with debt in corresponding currency. The EBITDA impact in 4th quarter from hedge accounting amounts to NOK 39 million (NOK 43 million), and the impact on OCI (other comprehensive income) amounts to NOK 116 million (NOK 762 million).
RESULT YTD
Total revenue YTD has dropped from NOK 8,134 million in 2016 to NOK 6,665 million in 2017 due to reduced activity from the subsea IRM projects and reduced day-rates and utilization on time-charter contracts. EBITDA in 2017 was NOK 1,798 million (NOK 2,621 million) of which NOK 2 million (NOK 171 million) represent gain from sale of assets. Total impairment and depreciation were NOK 2,156 million (NOK 2,825 million). Net financial costs were NOK -763 million (NOK 562 million) and net loss/profit before taxes NOK -1,120 million (NOK 359 million).
Vessel Yard Delivery Type Contract Financing
Skandi Recife * Vard Brasil
Q2 2018 PLSV
8 yrs Petrobras
Loan agreement signed with BNDES
Skandi Olinda * Vard Brasil
Q1 2019 PLSV
8 yrs Petrobras
Loan agreement signed with BNDES
*) 50% ownership
NEWBUILD
FINANCIAL REPORT Q4 2017DOF ASA 7
BALANCE
(MNOK) 31.12.2017 31.12.2016 Change %
Non-current assets 23 855 25 440 -6 %
Current assets 1 981 2 098 -6 %
Cash and cash equivalents 2 238 2 192 2 %
Total assets 28 075 29 731 -6 %
Equity 7 342 8 146 -10 %
Non-current liabilities 17 085 18 212 -6 %
Current liabilities 3 648 3 372 8 %
Total equity and liabilities 28 075 29 731 -6 %
Net interest bearing liabilities (NIBD) 16 802 17 494 -4 %
Of the Group’s total balance of NOK 28,075 million (NOK 29,731 million), the vessels, newbuilds and subsea equipment amount to NOK 20,667 million (NOK 22,199 million). 11 vessels are owned via joint ventures and are represented as associated companies and non-current receivables in the balance sheet, in total NOK 2,041 million (NOK 1,859 million). The Group’s remaining newbuilds are owned via a joint venture. Goodwill amounts to NOK 324 million (NOK 330 million) and has not been impaired in 4th quarter. Equity includes a non-controlling interest of NOK 2,505 million (NOK 3,521 million). The change in minority interests mainly represent reduced minority in DOF Subsea after a share issue in December.
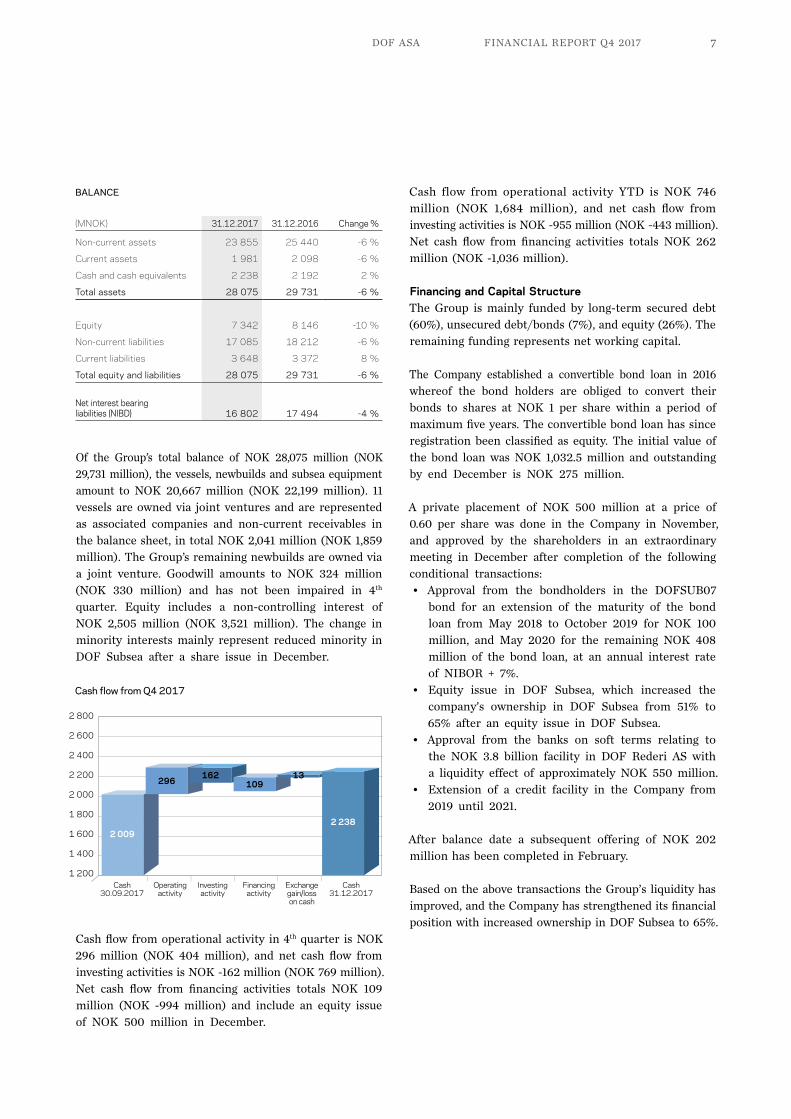
Cash flow from operational activity in 4th quarter is NOK 296 million (NOK 404 million), and net cash flow from investing activities is NOK -162 million (NOK 769 million). Net cash flow from financing activities totals NOK 109 million (NOK -994 million) and include an equity issue of NOK 500 million in December.
Cash flow from operational activity YTD is NOK 746 million (NOK 1,684 million), and net cash flow from investing activities is NOK -955 million (NOK -443 million). Net cash flow from financing activities totals NOK 262 million (NOK -1,036 million).
Financing and Capital Structure The Group is mainly funded by long-term secured debt (60%), unsecured debt/bonds (7%), and equity (26%). The remaining funding represents net working capital.
The Company established a convertible bond loan in 2016 whereof the bond holders are obliged to convert their bonds to shares at NOK 1 per share within a period of maximum five years. The convertible bond loan has since registration been classified as equity. The initial value of the bond loan was NOK 1,032.5 million and outstanding by end December is NOK 275 million.
A private placement of NOK 500 million at a price of 0.60 per share was done in the Company in November, and approved by the shareholders in an extraordinary meeting in December after completion of the following conditional transactions:• Approval from the bondholders in the DOFSUB07
bond for an extension of the maturity of the bond loan from May 2018 to October 2019 for NOK 100 million, and May 2020 for the remaining NOK 408 million of the bond loan, at an annual interest rate of NIBOR + 7%.
• Equity issue in DOF Subsea, which increased the company’s ownership in DOF Subsea from 51% to 65% after an equity issue in DOF Subsea.
• Approval from the banks on soft terms relating to the NOK 3.8 billion facility in DOF Rederi AS with a liquidity effect of approximately NOK 550 million.
• Extension of a credit facility in the Company from 2019 until 2021.
After balance date a subsequent offering of NOK 202 million has been completed in February.
Based on the above transactions the Group’s liquidity has improved, and the Company has strengthened its financial position with increased ownership in DOF Subsea to 65%.
2 800
2 600
2 400
2 200
2 000
1 800
1 600
1 400
1 200| | | | |
Cash30.09.2017
Operatingactivity
Investingactivity
Financingactivity
Exchangegain/losson cash
Cash31.12.2017
2 009
296162
10913
2 238
Cash flow from Q4 2017
FINANCIAL REPORT Q4 2017 DOF ASA8
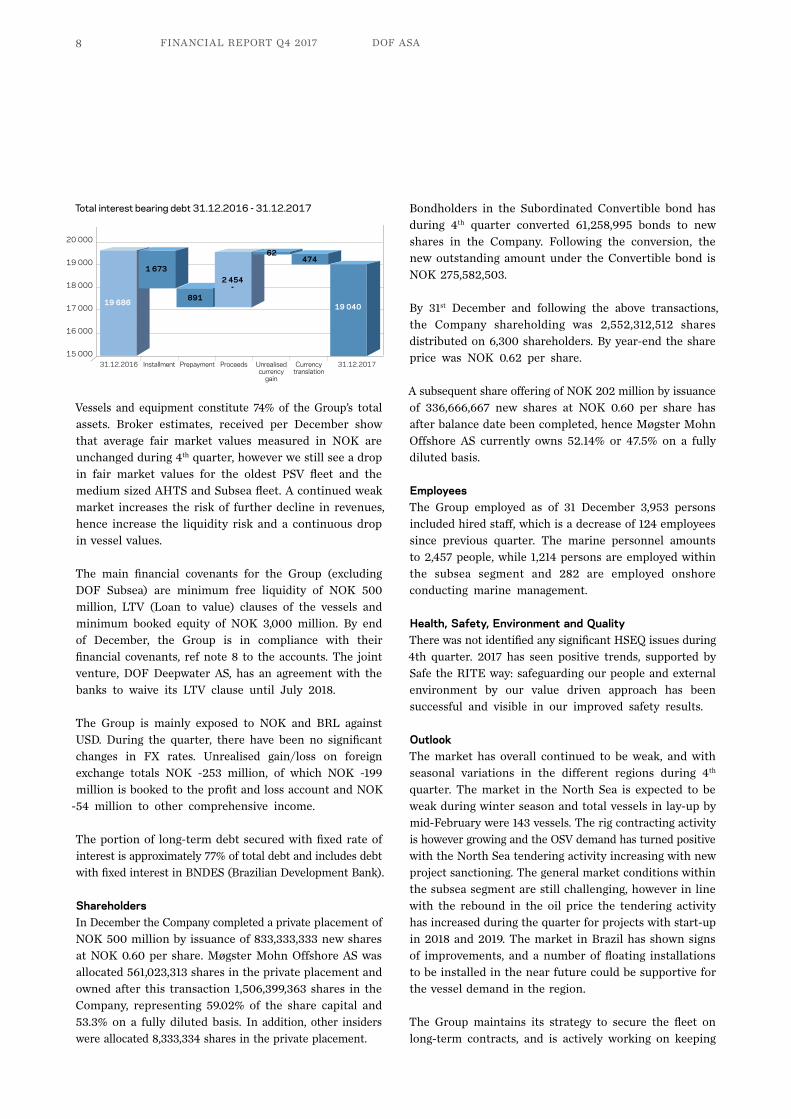
Vessels and equipment constitute 74% of the Group’s total assets. Broker estimates, received per December show that average fair market values measured in NOK are unchanged during 4th quarter, however we still see a drop in fair market values for the oldest PSV fleet and the medium sized AHTS and Subsea fleet. A continued weak market increases the risk of further decline in revenues, hence increase the liquidity risk and a continuous drop in vessel values.
The main financial covenants for the Group (excluding DOF Subsea) are minimum free liquidity of NOK 500 million, LTV (Loan to value) clauses of the vessels and minimum booked equity of NOK 3,000 million. By end of December, the Group is in compliance with their financial covenants, ref note 8 to the accounts. The joint venture, DOF Deepwater AS, has an agreement with the banks to waive its LTV clause until July 2018.
The Group is mainly exposed to NOK and BRL against USD. During the quarter, there have been no significant changes in FX rates. Unrealised gain/loss on foreign exchange totals NOK -253 million, of which NOK -199 million is booked to the profit and loss account and NOK
-54 million to other comprehensive income.
The portion of long-term debt secured with fixed rate of interest is approximately 77% of total debt and includes debt with fixed interest in BNDES (Brazilian Development Bank).
Shareholders In December the Company completed a private place ment of NOK 500 million by issuance of 833,333,333 new shares at NOK 0.60 per share. Møgster Mohn Offshore AS was allocated 561,023,313 shares in the private placement and owned after this transaction 1,506,399,363 shares in the Company, representing 59.02% of the share capital and 53.3% on a fully diluted basis. In addition, other insiders were allocated 8,333,334 shares in the private placement.
Bondholders in the Subordinated Convertible bond has during 4th quarter converted 61,258,995 bonds to new shares in the Company. Following the conversion, the new outstanding amount under the Convertible bond is NOK 275,582,503.
By 31st December and following the above transactions, the Company shareholding was 2,552,312,512 shares distributed on 6,300 shareholders. By year-end the share price was NOK 0.62 per share.
A subsequent share offering of NOK 202 million by issuance of 336,666,667 new shares at NOK 0.60 per share has after balance date been completed, hence Møgster Mohn Offshore AS currently owns 52.14% or 47.5% on a fully diluted basis.
Employees The Group employed as of 31 December 3,953 persons included hired staff, which is a decrease of 124 employees since previous quarter. The marine personnel amounts to 2,457 people, while 1,214 persons are employed within the subsea segment and 282 are employed onshore conducting marine management.
Health, Safety, Environment and Quality There was not identified any significant HSEQ issues during 4th quarter. 2017 has seen positive trends, supported by Safe the RITE way: safeguarding our people and external environment by our value driven approach has been successful and visible in our improved safety results.
OutlookThe market has overall continued to be weak, and with seasonal variations in the different regions during 4th quarter. The market in the North Sea is expected to be weak during winter season and total vessels in lay-up by mid-February were 143 vessels. The rig contracting activity is however growing and the OSV demand has turned positive with the North Sea tendering activity increasing with new project sanctioning. The general market conditions within the subsea segment are still challenging, however in line with the rebound in the oil price the tendering activity has increased during the quarter for projects with start-up in 2018 and 2019. The market in Brazil has shown signs of improvements, and a number of floating installations to be installed in the near future could be supportive for the vessel demand in the region.
The Group maintains its strategy to secure the fleet on long-term contracts, and is actively working on keeping
21 000
20 000
19 000
18 000
17 000
16 000
15 000| | | | | |
31.12.2016 Installment Prepayment Proceeds Unrealised currency
gain
Currency translation
31.12.2017
19 686
1 673
891
2 454-
62474
19 040
Total interest bearing debt 31.12.2016 - 31.12.2017

FINANCIAL REPORT Q4 2017DOF ASA 9
The Board of Directors of DOF ASA, February 22nd, 2018
Helge SingelstadDeputy Chairman
Helge MøgsterChairman
Kathryn Baker
Frederik W. Mohn Marianne Møgster Mons S. AaseCEO
the firm employment of the fleet as high as possible. The Group will continue its focus to reduce costs and to adjust its capacity to the challenging market. The Group’s backlog is approximately 52% for 2018 (excluding options), and the majority of the Group’s high-end assets are committed on firm contracts and represent the largest portion of the Group’s backlog. The two remaining newbuilds are further committed on firm contracts. A continuing weak market will however increase the risk of lower utilization and earnings of the Group’s vessels and as such a risk for further deterioration of the vessel values and an increased liquidity risk for the Group. The Group’s global presence and a flexible business model within the subsea segment, in a combination with high backlog and local content in Brazil, are expected to reduce these risks.
The Board of Directors expects today an EBITDA (based on management reporting) in 2018 to be slightly higher than 2017.
IR contacts: Mons S. Aase, CEO +47 91661012, [email protected] Hilde Drønen, CFO +47 91661009, [email protected]
DOF ASA5392 Storebøwww.dof.com
FINANCIAL REPORT Q4 2017 DOF ASA10
Accounts Q4 2017
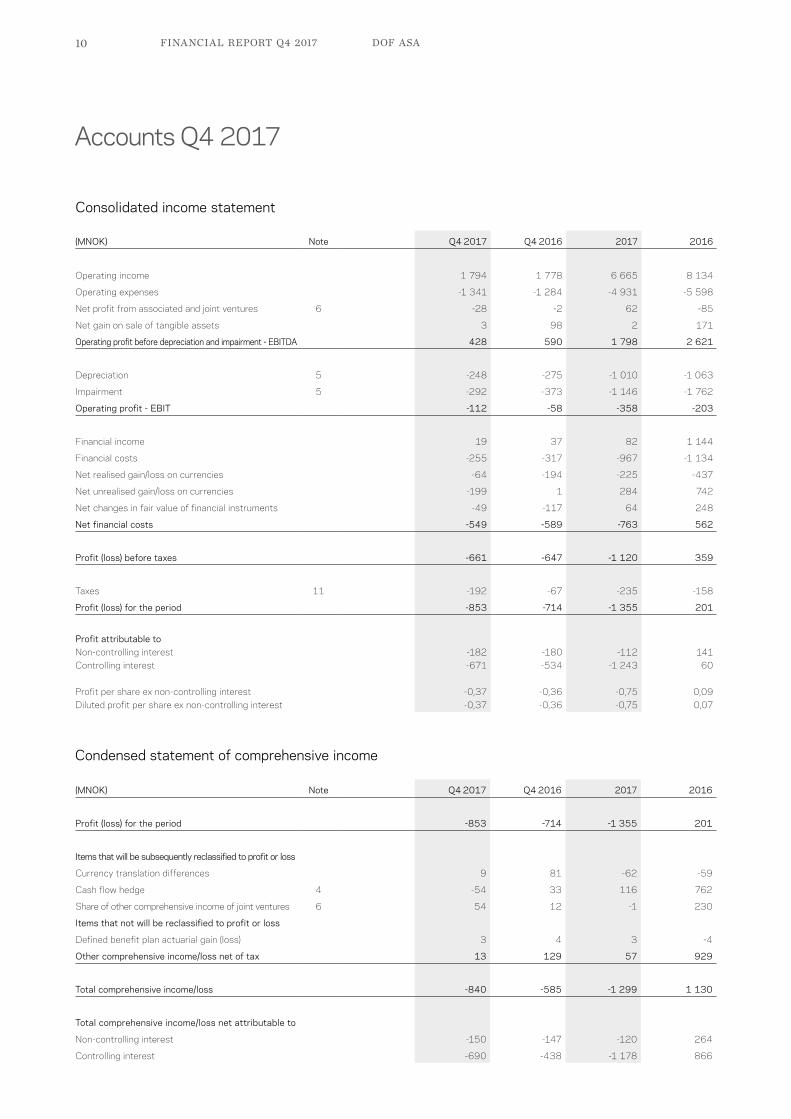
Consolidated income statement
Condensed statement of comprehensive income
(MNOK) Note Q4 2017 Q4 2016 2017 2016
Operating income 1 794 1 778 6 665 8 134
Operating expenses -1 341 -1 284 -4 931 -5 598
Net profit from associated and joint ventures 6 -28 -2 62 -85
Net gain on sale of tangible assets 3 98 2 171
Operating profit before depreciation and impairment - EBITDA 428 590 1 798 2 621
Depreciation 5 -248 -275 -1 010 -1 063
Impairment 5 -292 -373 -1 146 -1 762
Operating profit - EBIT -112 -58 -358 -203
Financial income 19 37 82 1 144
Financial costs -255 -317 -967 -1 134
Net realised gain/loss on currencies -64 -194 -225 -437
Net unrealised gain/loss on currencies -199 1 284 742
Net changes in fair value of financial instruments -49 -117 64 248
Net financial costs -549 -589 -763 562
Profit (loss) before taxes -661 -647 -1 120 359
Taxes 11 -192 -67 -235 -158
Profit (loss) for the period -853 -714 -1 355 201
Profit attributable toNon-controlling interest -182 -180 -112 141 Controlling interest -671 -534 -1 243 60
Profit per share ex non-controlling interest -0,37 -0,36 -0,75 0,09 Diluted profit per share ex non-controlling interest -0,37 -0,36 -0,75 0,07
(MNOK) Note Q4 2017 Q4 2016 2017 2016
Profit (loss) for the period -853 -714 -1 355 201
Items that will be subsequently reclassified to profit or loss
Currency translation differences 9 81 -62 -59
Cash flow hedge 4 -54 33 116 762
Share of other comprehensive income of joint ventures 6 54 12 -1 230
Items that not will be reclassified to profit or loss
Defined benefit plan actuarial gain (loss) 3 4 3 -4
Other comprehensive income/loss net of tax 13 129 57 929
Total comprehensive income/loss -840 -585 -1 299 1 130
Total comprehensive income/loss net attributable to
Non-controlling interest -150 -147 -120 264
Controlling interest -690 -438 -1 178 866
FINANCIAL REPORT Q4 2017DOF ASA 11
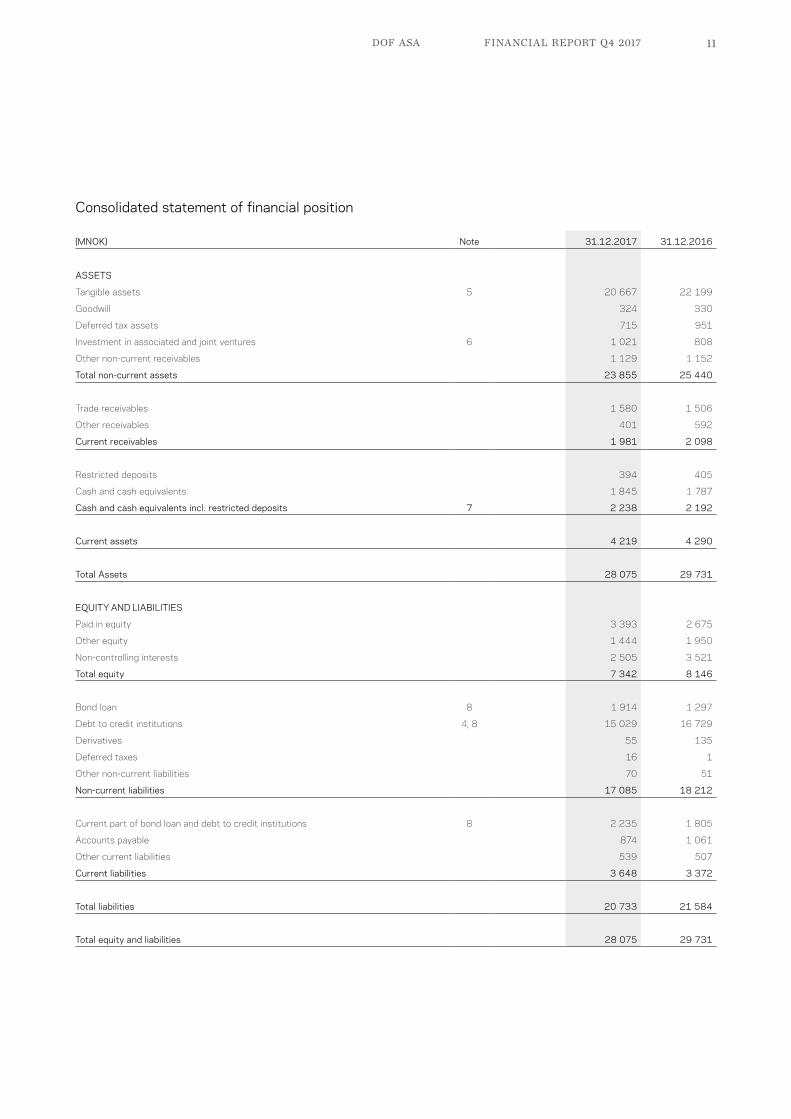
Consolidated statement of financial position
(MNOK) Note 31.12.2017 31.12.2016
ASSETS
Tangible assets 5 20 667 22 199
Goodwill 324 330
Deferred tax assets 715 951
Investment in associated and joint ventures 6 1 021 808
Other non-current receivables 1 129 1 152
Total non-current assets 23 855 25 440
Trade receivables 1 580 1 506
Other receivables 401 592
Current receivables 1 981 2 098
Restricted deposits 394 405
Cash and cash equivalents 1 845 1 787
Cash and cash equivalents incl. restricted deposits 7 2 238 2 192
Current assets 4 219 4 290
Total Assets 28 075 29 731
EQUITY AND LIABILITIES
Paid in equity 3 393 2 675
Other equity 1 444 1 950
Non-controlling interests 2 505 3 521
Total equity 7 342 8 146
Bond loan 8 1 914 1 297
Debt to credit institutions 4, 8 15 029 16 729
Derivatives 55 135
Deferred taxes 16 1
Other non-current liabilities 70 51
Non-current liabilities 17 085 18 212
Current part of bond loan and debt to credit institutions 8 2 235 1 805
Accounts payable 874 1 061
Other current liabilities 539 507
Current liabilities 3 648 3 372
Total liabilities 20 733 21 584
Total equity and liabilities 28 075 29 731

FINANCIAL REPORT Q4 2017 DOF ASA12
Consolidated statement of equity
(MNOK)Paid-in capital
Other contributed
capital
Other equity - Retained earnings
Other equity - Currency
translation differences
Other equity - Cash
flow hedgeTotal other
equity
Non-controlling
interestTotal
equity
Balance at 01.01.2017 2 675 493 1 840 309 -693 1 950 3 521 8 146
Result (loss) for the period -1 243 -1 243 -112 -1 355
Other comprehensive income/loss - -51 116 65 -8 57
Reclassification between CTA and cash flow hedge -40 40 - -
Converted bond 218 -218 -218 -
Right issue 500 -6 -6 494
Balance at 31.12.2017 3 393 275 590 218 -537 548 3 401 7 342
Balance at 01.01.2016 1 452 - 1 516 222 -1 299 440 3 281 5 172
Result (loss) for the period 60 60 141 201
Other comprehensive income/loss 114 -69 762 807 123 929
Reclassification between CTA and cash flow hedge 156 -156 - -
Reduced share capital with reduced nominal value -167 167 167 -
Convertible bond - 824 - 824 - 824
Converted bond 330 -330 - -330 - -
Right issue 1 060 - -16 -16 - 1 044
Dividends -22 -22
Changes in non-controlling interests -2 -2
Balance at 31.12.2016 2 675 493 1 840 309 -693 1 950 3 521 8 146
Key figuresQ4 2017 Q4 2016 2017 2016
EBITDA margin ex net gain on sale of vessel 1 24 % 28 % 27 % 30 %
EBITDA margin 2 24 % 33 % 27 % 32 %
EBIT margin 3 -6 % -3 % -5 % -2 %
Cashflow per share (controlling interest) 4 0,11 0,02 0,44 4,15
Profit per share (controlling interest) 5 -0,34 -0,36 -0,62 1,02
Profit per share ex. unrealised gain/loss on currencies and changes fair value of financial instruments (controlling interest) 6 -0,13 -0,34 0,33 -4,30
Return on net capital 7 -18 % 2 %
Equity ratio 8 26 % 27 %
Net interest bearing debt 16 802 17 494
Average number of shares 1 797 029 929 1 492 071 743 1 667 492 108 658 878 610
Number of shares 1 657 720 184 1 488 171 200 2 552 312 512 1 501 321 200
Potential average number of shares 2 103 257 334 1 994 561 682 2 021 958 942 882 981 813
Potential number of shares 2 827 895 015 1 994 561 862 2 827 895 015 1 994 561 862
1) Operating profit before net gain on sale of vessel and depreciation in percent of operating income. 2) Operating profit before depreciation in percent of operating income. 3) Operating profit in percent of operating income. 4) Pre-tax result + depreciation and impairment +/- unrealised gain/loss on currencies +/- net changes in fair value of financial instruments/potential average no of shares.5) Result /potential average no. of shares. 6) Result + net unrealised currency gain/loss + net changes fair value of financial instruments)/potential no of shares. 7) Result incl non-controlling interest/total equity. 8) Total equity/Total balance.

FINANCIAL REPORT Q4 2017DOF ASA 13
Cashflow
(MNOK) Q4 2017 Q4 2016 2017 2016
Operating result -112 -58 -358 -203
Depreciation and impairment 540 648 2 155 2 825
Gain/loss on disposal of tangible assets -3 -98 -2 -171
Share of profit/loss from associates and joint ventures 28 2 -62 85
Changes in accounts receivables -67 -20 -74 606
Changes in accounts payable 68 104 -187 -378
Changes in other working capital 64 96 258 64
Exchange rate effects on operating activities 46 -1 -25 -57
Cash from operating activities 565 673 1 705 2 770
Interest received 8 18 59 59
Interest paid -243 -281 -956 -1 087
Taxes paid -34 -6 -62 -59
Net cash from operating activities 296 404 746 1 684
Payments received for sale of tangible assets 29 980 61 1 531
Purchase of tangible assets -154 -212 -867 -1 610
Payments received for sale of shares 0 -3 0 -
Purchase of shares -8 -6 -17 -7
Received dividend - - 5 -
Other investments -29 8 -136 -356
Net cash from investing activities -162 769 -955 -443
Proceeds from borrowings 57 3 800 2 333 5 088
Repayment of borrowings -441 -4 793 -2 564 -6 934
Share issue 494 - 494 1 044
Purchase of convertible bond - - - -209
Payments to non-controlling interests - - - -26
Net cash from financing activities 109 -994 262 -1 036
Net changes in cash and cash equivalents 243 179 53 204
Cash and cash equivalents at the start of the period 2 009 2 033 2 192 2 056
Exchange gain/loss on cash and cash equivalents -13 -19 -7 -68
Cash and cash equivalents at the end of the period 2 238 2 192 2 238 2 192

FINANCIAL REPORT Q4 2017 DOF ASA14
Note 1 General
Notes to the Accounts
DOF ASA (the “Company”) and its subsidiaries (together, the “Group”) own and operate a fleet of PSV, AHTS, subsea vessels and service companies offering services to the subsea market worldwide.
The Company is a public limited company, which is listed on the Oslo Stock Exchange and incorporated and domiciled in Norway. The head office is located at Storebø in the municipality of Austevoll, Norway.
These condensed interim financial statements were approved for issue on 22 February 2018. These condensed interim financial statements have not been audited.
Basis of preparation These condensed interim financial statements have been prepared in accordance with IAS 34, ‘Interim financial reporting’. The condensed interim financial statements should be read in conjunction with the annual financial statements for the year ended 31 December 2016, which have been prepared in accordance with IFRS.
Taxes on income in the interim periods are accrued using the tax rate that would be applicable to expected total annual profit or loss.
Estimates The preparation of interim financial statements requires management to make judgements, estimates and assumptions that affect the application of accounting policies and the reported amounts of assets and liabilities, income and expense. Actual results may differ from these estimates.
In preparing these condensed interim financial statements, the significant judgements made by management in applying the Group’s accounting policies and the key sources of estimation uncertainty were the same as those that applied to the consolidated financial statements for the year ended 31 December 2016, with the exception of changes in estimates that are required in determining the provision for income taxes.
New standards, amendments and interpretations - not yet adoptedIFRS 15 Revenue contracts with customers - effective from 1 January 2018The new standard is based on the principle that revenue is recognised when control of a good or service transfers to a customer - the notion of control replaces the existing notion of risks and rewards.
The Group has finalised an internal project regarding the implementation of IFRS 15 Revenue from contracts with customers. The main purpose of the project is to assess the impact of applying the new standard on the Group’s Financial statements to ensure a good implementation process. All contracts ongoing as of year-end are evaluated based on the five step model described in IFRS 15 Revenue from contract with customers. The purpose of the evaluation was to identify the effect on the equity 1 January 2018. In addition, all types of contracts within the different revenue streams are evaluated on a general basis to evaluate the effects of the implementation in 2018. As a part of the project the Group’s revenue streams has been categorised into the following types: Time Charter revenue and Project revenue.
Time Charter revenue is based on contracts were the Group deliver a vessel (including crew) to the client. During the contract period, the client decides how and when to operate the vessel. Based on existing IFRS, and after the implementation of IFRS 15 Revenue from contracts with customers, this revenue stream is recognised over time. The Time Charter revenue will be affected by the implementation of IFRS 15 Revenue from contracts with customers and the bareboat element will be recognised as lease revenue based on IFRS 16 Leases. Result of the assessment is that the timing of the revenue recognition under IFRS 15 Revenue from contracts with customers and IFRS 16 Leases, will be the same under IAS 18 Revenue and IFRS 17 Leases.
FINANCIAL REPORT Q4 2017DOF ASA 15
Note 1 General (continued)
Project revenue is based on operations were the Group utilize its vessels, equipment and crew to perform tailor made operations on the client’s installations, assets etc. Based on existing IFRS this revenue is recognised over time. Result of the assessments is that the timing of the revenue recognition under IFRS 15 Revenue from contracts with customers will be the same as under IAS 18 Revenue/IAS 11 Construction contracts.
Despite no change in the main recognition method, the Group has identified that the following areas might be affected going forward: • The application of IFRS 15 Revenue from contracts with customers may result in identification of separate performance
obligations, which could affect the timing of revenue recognition in relation to the separate performance obligations.• Certain costs will be recognised as a contract asset under IFRS 15 Revenue from contracts with customers with additional
disclosures. Under existing IFRS contract asset are not separated from other assets.• Parts of the Time Charter revenue might be recognised as lease revenue based on IAS 17 Leases/IFRS 16 Leases.
The Group will apply IFRS 15 Revenue from contracts with customers retrospectively with the cumulative effect of initial application recognised as an adjustment to equity as of 1st January 2018. This transition method will only be applied retrospectively on contracts that are not completed by 1 January 2018. Based on assessment the Group do not expect any adjustment to the equity as of 1 January 2018.
IFRS 9 Financial instruments - effective from 1 January 2018IFRS 9 Financial instruments addresses the classification, measurement and de-recognition of financial assets and financial liabilities and introduces new rules for hedge accounting. The implementation might cause a minor effect on the equity as of 1 January 2018, due to the modification of the remaining part of the DOFSUB07 bond loan and the fleet loan in DOF Rederi AS, in December 2017. The Group does not expect any material effects on the equity as of 1 January 2018.
IFRS 16 Leases - mandatory from 1 January 2019 The new standard will result in almost all leases being recognised in the statement of financial position, as the distinction between operating and finance leases are removed. Under the standard, an asset (the right to use a leased item) and a financial liability (the obligation to pay rentals) are recognised. The only exceptions of this recognition principle are short-term and low-value leases.
As of 31 December 2017, the Group has two vessels on lessee arrangements which are presented as operating leases. One of the agreements are for less than 12 months. Furthermore, the Group has and will have lease agreements on office buildings and warehouses that will be affected by implementation of IFRS 16 Leases. Yearly lease fee for the Group’s office buildings and warehouses are approximately NOK 67 million. At the moment some lease agreements are longer than 12 months and some lease agreements are shorter than 12 months. It is expected that the composition of long- and short-term lease agreements can be changed before implementation of IFRS 16 Leases.
For the Group as a lessor expected impacts on revenue are related to presentation, classification and notes to the Financial Statements.
The Group does not intend to adopt the standard before its effective date, 1 January 2019.

FINANCIAL REPORT Q4 2017 DOF ASA16
The reporting below is presented according to internal management reporting, based on the proportional consolidation method of accounting of jointly controlled companies. The bridge between the management reporting and the figures reported in the financial statement is presented below.
Note 2 Management reporting
RESULT Q4 2017 Q4 2016
(MNOK)
Management reporting
Reconciliation to equity
method
Financial reporting
Management
reporting
Reconciliation to equity
method Financial reporting
Operating income 1 995 -202 1 794 1 912 -134 1 778
Operating expenses -1 379 38 -1 341 -1 319 35 -1 284
Net profit from associated and joint ventures -10 -19 -28 5 -6 -2
Net gain on sale of tangible assets 3 - 3 98 - 98
Operating profit before depreciation and impairment - EBITDA 610 -182 428 695 -105 590
Depreciation -285 37 -248 -304 28 -275
Impairment -340 48 -292 -413 40 -373
Operating profit - EBIT -15 -97 -112 -21 -37 -58
Financial income 9 9 19 29 9 37
Financial costs -321 66 -255 -337 20 -317
Net realised gain/loss on currencies -59 -6 -64 -200 6 -194
Net unrealised gain/loss on currencies -215 16 -199 20 -19 1
Net changes in fair value of financial instruments -49 - -49 -116 -1 -117
Net financial costs -634 86 -549 -604 15 -589
Profit (loss) before taxes -649 -12 -661 -625 -22 -647
Taxes -203 12 -192 -89 22 -67
Profit (loss) -853 - -853 -714 - -714
BALANCE 31.12.2017 31.12.2016
(MNOK)
Management reporting
Reconciliation to equity
method Financial reporting
Management
reporting
Reconciliation to equity
method Financial reporting
ASSETSTangible assets 25 793 -5 127 20 667 27 469 -5 270 22 199
Goodwill 324 - 324 330 - 330
Deferred taxes 779 -64 715 1 023 -72 951
Investment in associated companies and joint ventures 71 949 1 021 70 738 808
Other non-current financial assets 635 494 1 129 619 533 1 152
Total non-current assets 27 604 -3 748 23 855 29 511 -4 071 25 440
Receivables 2 165 -185 1 981 2 243 -145 2 098
Cash and cash equivalents 2 434 -196 2 238 2 370 -178 2 192
Total current assets 4 599 -380 4 219 4 614 -323 4 290
Total assets 32 203 -4 128 28 075 34 125 -4 394 29 731
EQUITY AND LIABILITIESEquity 7 342 - 7 342 8 146 - 8 146
Non-current liabilities 20 769 -3 684 17 085 22 123 -3 911 18 212
Current liabilities 4 092 -444 3 648 3 856 -484 3 372
Total liabilities 24 861 -4 128 20 733 25 979 -4 394 21 584
Total equity and liabilities 32 203 -4 128 28 075 34 125 -4 394 29 731
Net interest bearing liabilities 20 550 -3 748 16 802 21 442 -3 948 17 494

FINANCIAL REPORT Q4 2017DOF ASA 17
Note 4 Hedges
Note 3 Segment information - management reporting
The Group applies cash flow hedge accounting related to foreign exchange rate risk on expected highly probable income in USD, using a non derivative financial hedging instrument. This hedging relationship is described below.
Cash flow hedge involving future highly probable income The Group applies hedge accounting related to the cash flow hedging of expected highly probable income in USD, from its operations in Brazil.
The cash flow hedges hedge a portion of the foreign currency risk arising from highly probable income in USD relating to time charter contracts on vessels owned by the companies Norskan Offshore Ltda and DOF Subsea Navagacao Ltda.
The hedging instruments are portions of the companies’ long term debt denominated in USD. The risk being hedged in each hedging relationship is the spot element of the forward currency rate of USD/BRL. The future highly probable income has a significant exposure to the spot element as the spot element is the main part of the forward rate. The long term debt is translated from USD to BRL at spot rate on the balance sheet date every reporting period.
The effective portion of changes in fair value of the instruments that are designated and qualify as cash flow hedges is recognised in other comprehensive income. The gain or loss relating to the ineffective portion is recognised immediately in the income statement.
Amounts accumulated in equity are reclassified to profit or loss in the periods when the expected income is recognised.
PSV AHTS CSV Total
4th quarter 2017Operating income 204 366 1 425 1 995
Net gain on sale of tangible assets 1 2 - 3
Operating result before depreciation and impairment - EBITDA 36 150 425 610
Depreciation 29 64 192 285
Impairment 160 97 83 340
Operation result - EBIT -154 -11 150 -15
4th quarter 2016Operating income 210 431 1 271 1 912
Net gain on sale of tangible assets 2 - 96 98
Operating result before depreciation and impairment - EBITDA 59 218 418 695
Depreciation 41 68 196 304
Impairment 143 91 179 413
Operation result - EBIT -123 59 44 -21

FINANCIAL REPORT Q4 2017 DOF ASA18
Impairment The challenging market condition for offshore service vessels has continued. Impairment indicators are observed and an impairment test for vessels in the Group has been done. Impairment tests are performed in line with accounting principle presented in annual report for 2016. Impairment of NOK 292 million has been recognised in the 4th quarter of 2017 and NOK 1,136 million for the year 2017.
In addition an impairment in the joint ventures of NOK 48 million has been done in 4th quarter and NOK 186 million for the year 2017.
Note 5 Tangible assets
2017
Vessel and periodical
maintenance ROV NewbuildsOperating
equipment Total
Book value at 01.01.2017 20 869 856 26 448 22 199
Addition 364 9 634 105 1 112
Vessel completed 496 -496 -
Disposal -56 -2 -58
Reclassification 139 -153 14 -
Depreciation -739 -154 -117 -1 010
Impairment loss -1 136 -1 136
Currency translation differences -430 -4 -6 -440
Book value at 31.12.2017 19 368 844 11 444 20 667
2016
Vessel and periodical
maintenance ROV NewbuildsOperating
equipment Total
Book value at 01.01.2016 21 603 943 106 535 23 188
Addition 494 12 1 061 93 1 660
Vessel completed 1 113 -1 113 -
Disposal -1 001 -3 -20 -1 024
Reclassification 1 47 -32 -10 6
Depreciation -767 -163 -133 -1 063
Impairment loss -1 528 -5 -19 -1 552
Currency translation differences 954 23 4 2 983
Book value at 31.12.2016 20 869 855 26 448 22 199
FINANCIAL REPORT Q4 2017DOF ASA 19
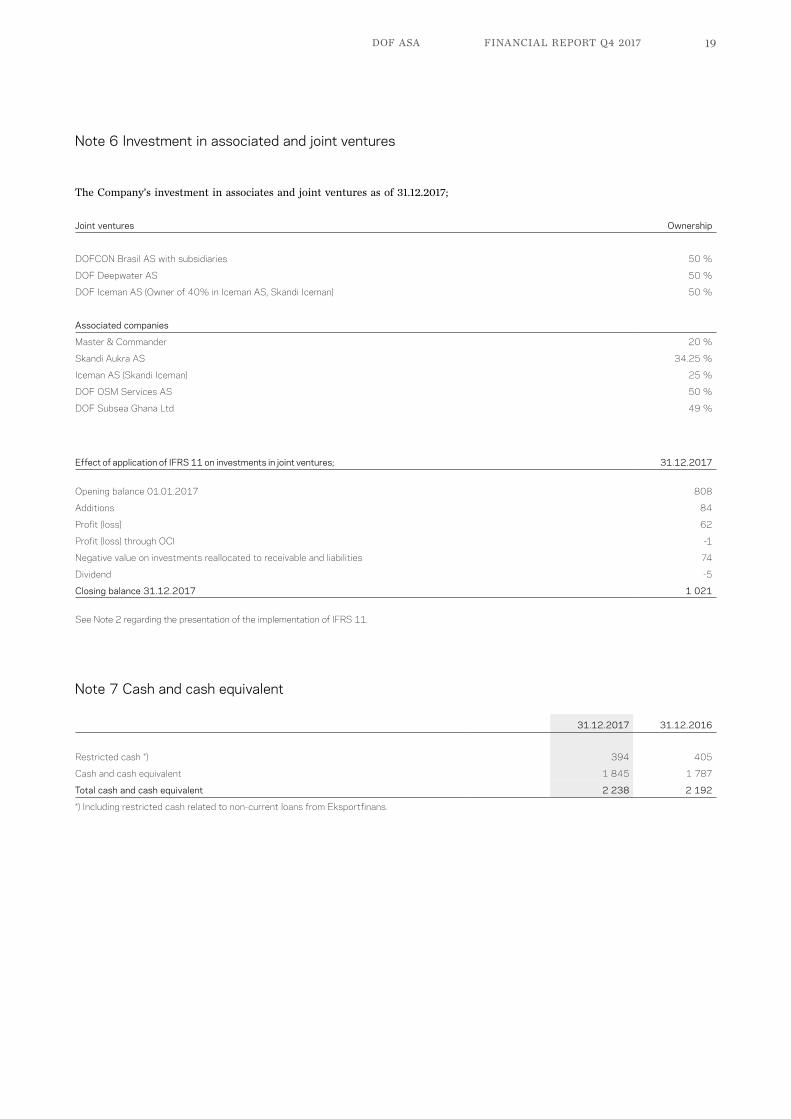
Note 7 Cash and cash equivalent
31.12.2017 31.12.2016
Restricted cash *) 394 405
Cash and cash equivalent 1 845 1 787
Total cash and cash equivalent 2 238 2 192
*) Including restricted cash related to non-current loans from Eksportfinans.
Effect of application of IFRS 11 on investments in joint ventures; 31.12.2017
Opening balance 01.01.2017 808
Additions 84
Profit (loss) 62
Profit (loss) through OCI -1
Negative value on investments reallocated to receivable and liabilities 74
Dividend -5
Closing balance 31.12.2017 1 021
Joint ventures Ownership
DOFCON Brasil AS with subsidiaries 50 %
DOF Deepwater AS 50 %
DOF Iceman AS (Owner of 40% in Iceman AS, Skandi Iceman) 50 %
Associated companies
Master & Commander 20 %
Skandi Aukra AS 34.25 %
Iceman AS (Skandi Iceman) 25 %
DOF OSM Services AS 50 %
DOF Subsea Ghana Ltd 49 %
Note 6 Investment in associated and joint ventures
The Company’s investment in associates and joint ventures as of 31.12.2017;
See Note 2 regarding the presentation of the implementation of IFRS 11.
FINANCIAL REPORT Q4 2017 DOF ASA20
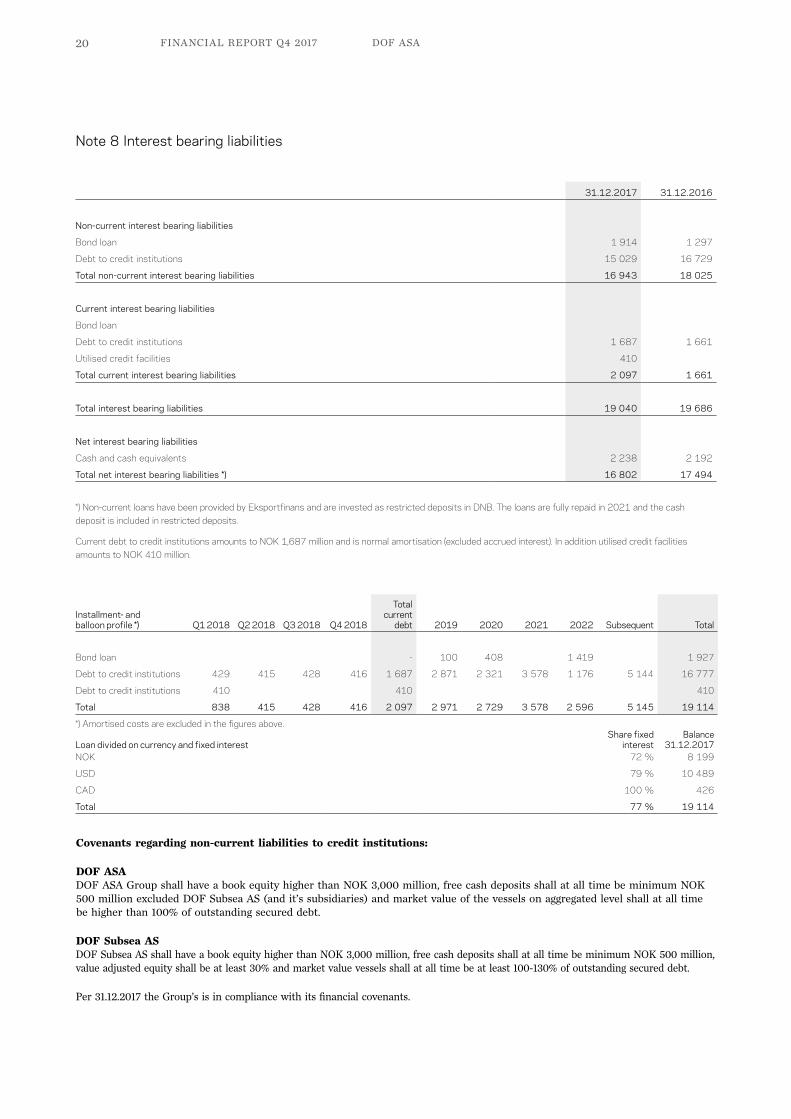
Note 8 Interest bearing liabilities
31.12.2017 31.12.2016
Non-current interest bearing liabilities
Bond loan 1 914 1 297
Debt to credit institutions 15 029 16 729
Total non-current interest bearing liabilities 16 943 18 025
Current interest bearing liabilities
Bond loan
Debt to credit institutions 1 687 1 661
Utilised credit facilities 410
Total current interest bearing liabilities 2 097 1 661
Total interest bearing liabilities 19 040 19 686
Net interest bearing liabilities
Cash and cash equivalents 2 238 2 192
Total net interest bearing liabilities *) 16 802 17 494
Installment- and balloon profile *) Q1 2018 Q2 2018 Q3 2018 Q4 2018
Total current
debt 2019 2020 2021 2022 Subsequent Total
Bond loan - 100 408 1 419 1 927
Debt to credit institutions 429 415 428 416 1 687 2 871 2 321 3 578 1 176 5 144 16 777
Debt to credit institutions 410 410 410
Total 838 415 428 416 2 097 2 971 2 729 3 578 2 596 5 145 19 114
*) Amortised costs are excluded in the figures above.
Loan divided on currency and fixed interestShare fixed
interest Balance
31.12.2017NOK 72 % 8 199
USD 79 % 10 489
CAD 100 % 426
Total 77 % 19 114
Covenants regarding non-current liabilities to credit institutions:
DOF ASA DOF ASA Group shall have a book equity higher than NOK 3,000 million, free cash deposits shall at all time be minimum NOK 500 million excluded DOF Subsea AS (and it’s subsidiaries) and market value of the vessels on aggregated level shall at all time be higher than 100% of outstanding secured debt.
DOF Subsea AS DOF Subsea AS shall have a book equity higher than NOK 3,000 million, free cash deposits shall at all time be minimum NOK 500 million, value adjusted equity shall be at least 30% and market value vessels shall at all time be at least 100-130% of outstanding secured debt.
Per 31.12.2017 the Group’s is in compliance with its financial covenants.
*) Non-current loans have been provided by Eksportfinans and are invested as restricted deposits in DNB. The loans are fully repaid in 2021 and the cash deposit is included in restricted deposits.
Current debt to credit institutions amounts to NOK 1,687 million and is normal amortisation (excluded accrued interest). In addition utilised credit facilities amounts to NOK 410 million.
FINANCIAL REPORT Q4 2017DOF ASA 21
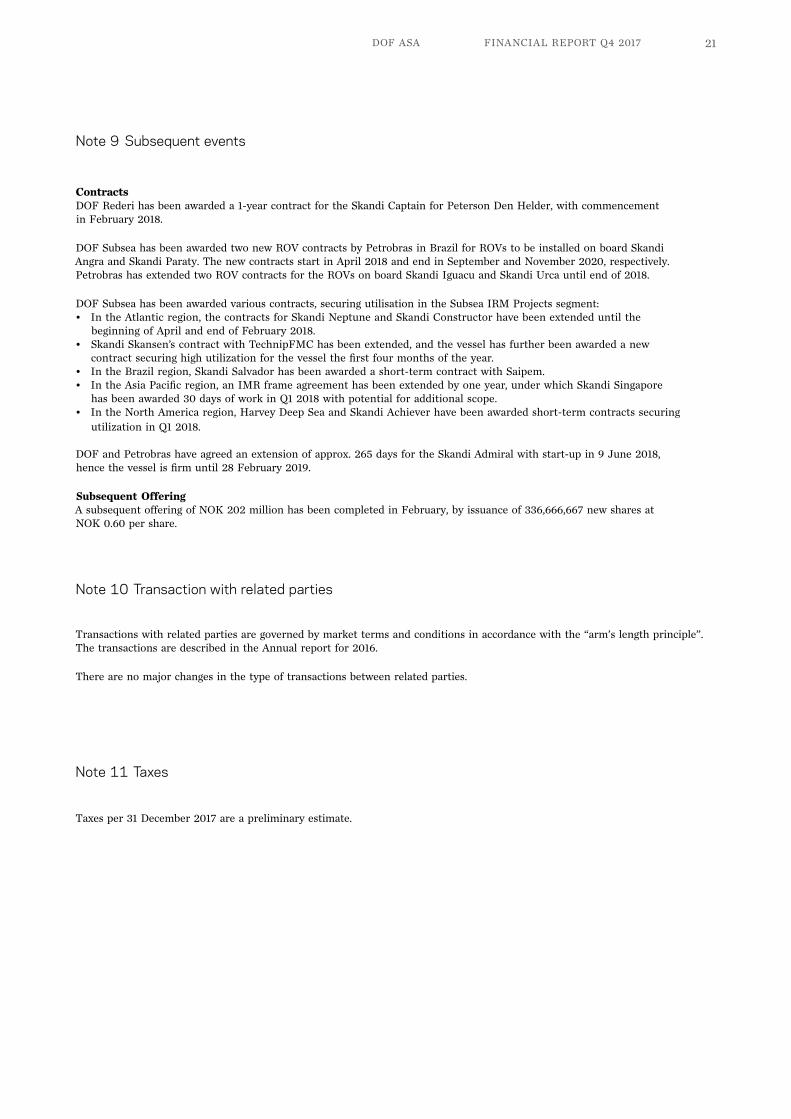
Note 9 Subsequent events
ContractsDOF Rederi has been awarded a 1-year contract for the Skandi Captain for Peterson Den Helder, with commencement in February 2018.
DOF Subsea has been awarded two new ROV contracts by Petrobras in Brazil for ROVs to be installed on board Skandi Angra and Skandi Paraty. The new contracts start in April 2018 and end in September and November 2020, respectively. Petrobras has extended two ROV contracts for the ROVs on board Skandi Iguacu and Skandi Urca until end of 2018.
DOF Subsea has been awarded various contracts, securing utilisation in the Subsea IRM Projects segment:• In the Atlantic region, the contracts for Skandi Neptune and Skandi Constructor have been extended until the
beginning of April and end of February 2018.• Skandi Skansen’s contract with TechnipFMC has been extended, and the vessel has further been awarded a new
contract securing high utilization for the vessel the first four months of the year.• In the Brazil region, Skandi Salvador has been awarded a short-term contract with Saipem.• In the Asia Pacific region, an IMR frame agreement has been extended by one year, under which Skandi Singapore
has been awarded 30 days of work in Q1 2018 with potential for additional scope.• In the North America region, Harvey Deep Sea and Skandi Achiever have been awarded short-term contracts securing
utilization in Q1 2018.
DOF and Petrobras have agreed an extension of approx. 265 days for the Skandi Admiral with start-up in 9 June 2018, hence the vessel is firm until 28 February 2019.
Subsequent OfferingA subsequent offering of NOK 202 million has been completed in February, by issuance of 336,666,667 new shares at NOK 0.60 per share.
Note 10 Transaction with related parties
Note 11 Taxes
Transactions with related parties are governed by market terms and conditions in accordance with the “arm’s length principle”. The transactions are described in the Annual report for 2016.
There are no major changes in the type of transactions between related parties.
Taxes per 31 December 2017 are a preliminary estimate.

FINANCIAL REPORT Q4 2017 DOF ASA22
Note 12 Share capital and shareholders
Largest shareholders as of 31.12.2017
Name No. shares Shareholding Voting shares
MØGSTER MOHN OFFSHORE AS 1 506 399 363 59.02 % 59.02 %
BNP PARIBAS SECURITIES SERVICES 95 701 686 3.75 % 3.75 %
MP PENSJON PK 43 414 691 1.70 % 1.70 %
CITY FINANCIAL ABSOLUTE EQUITY FD 27 750 000 1.09 % 1.09 %
SKANDINAVISKA ENSKILDA BANKEN AB 26 356 058 1.03 % 1.03 %
DRAGESUND INVEST AS 24 600 000 0.96 % 0.96 %
MOCO AS 19 844 184 0.78 % 0.78 %
GERDA MARIE AS 18 000 000 0.71 % 0.71 %
PARETO AS 14 234 975 0.56 % 0.56 %
TOPDANMARK LIVSFORSIKRING A/S 12 500 000 0.49 % 0.49 %
NORDNET LIVSFORSIKRING AS 11 019 455 0.43 % 0.43 %
MSIP EQUITY 10 709 780 0.42 % 0.42 %
BERGEN KOMMUNALE PENSJONSKASSE 10 341 089 0.41 % 0.41 %
ARCTIC FUNDS PLC 10 187 012 0.40 % 0.40 %
DNB NOR BANK ASA 10 135 546 0.40 % 0.40 %
AKERSHUS FYLKESKOMM. PENSJONSKASSE 10 000 000 0.39 % 0.39 %
SKANDINAVISKA ENSKILDA BANKEN AB 9 500 000 0.37 % 0.37 %
KRISTIAN FALNES AS 9 500 000 0.37 % 0.37 %
NETFONDS LIVSFORSIKRING AS 8 958 925 0.35 % 0.35 %
AS NAVE 8 615 000 0.34 % 0.34 %
Total 1 887 767 764 73.96 % 73.96 %
Total other shareholders 664 544 748 26.04 % 26.04 %
Ttoal no of shares 2 552 312 512 100.00 % 100.00 %
Convertible bond loan at 31.12.2017 275 582 503
Diluted number of shares at 31.12.2017 2 827 895 015
Subsequent offering in February 2018 336 666 667
Diluted number of shares included subsequent offering February 2018 3 164 561 682

FINANCIAL REPORT Q4 2017DOF ASA 23
Note 13 Performance measurements definitions
DOF ASA financial information is prepared in accordance with international financial reporting standards (IFRS). In addition DOF ASA discloses alternative performance measures as a supplement to the financial statement prepared in accordance with IFRS. Such performance measures are used to provide an enhanced insight into the operating performance, financing and future prospects of the company and are frequently used by securities analysts, investors and other interested parties.
The definitions of these measures are as follows:
EBITDA – Operating profit (earnings) before depreciation, impairment, amortisation, net financial costs and taxes is a key financial parameter. The term is useful for assessing the profitability of its operations, as it is based on variable costs and excludes depreciation, impairment and amortise costs related to investments. Ebitda is also important in evaluating performance relative to competitors.
EBITDA before hedge – Ebitda as described above adjusted for hedge accounting of revenue, according to management reporting.
Operational EBITDA – Ebitda as described above adjusted for gain on sale of tangible assets, according to management reporting.
Operational EBITDA before hedge – Ebitda as describe above adjusted for gain on sale of tangible assets and hedge accounting of revenue, according to management reporting.
EBIT – Operating profit (earnings) before net financial costs and taxes.
Profit before unrealised finance costs – Profit before net unrealised gain/loss on currencies and net changes in the fair value of financial instruments.
Unrealised finance costs – Total unrealised gain/loss on currencies and net changes in the fair value of financial instruments.
Unemployed capital – Vessel under construction (newbuildings).
Interest bearing debt – Total of current and non-current borrowings.
Net interest bearing debt – Interest bearing debt minus current and non-current interest-bearing receivables and cash and cash equivalents. The use of the term “net debt” does not necessarily mean cash included in the calculation are available to settle debts if included in the term.
Utilisation - Utilisation of vessel numbers is based on actual available days including days at yard for periodical maintenance, upgrading, transit or idle time between contracts.
Contract coverage – Number of future sold days compared with total actual available days excluded options.
Backlog – Sum of un-discounted revenue related to secured contracts in the future and optional contract extensions as determined by the client. Contract coverage related to master service agreements (MSA`s) within the CSV segment, includes only confirmed purchase order.
Financial reporting – Financial Reporting according to IFRS.
Management reporting – Investments in joint ventures (JV) is consolidated on gross basis in the income statement and the statement of financial position.
DOF ASAAlfabygget
5392 StorebøNORWAY
www.dof.com