dof asa q3 2010 asa/ir/archive/2010_q3_dof_asa_pres.pdfdof asa presentation q3 2010 - 8 the new...
TRANSCRIPT

DOF ASA PRESENTATION
Q4 2009
The New Horizon
DOF ASAQ3 2010
CEO – Mons S. Aase CFO – Hilde Drønen

DOF ASA PRESENTATION
Q3 2010 - 2
The New Horizon
Agenda
Highlights Q3
Overview Group
Status DOF Subsea
Status Supply
Q3 Financials
Outlook

DOF ASA PRESENTATION
Q3 2010 - 3
The New Horizon
Highlights Q3
Contracts:
15 years contract with Total Argentina for Skandi Patagonia
4 AHTS newbuilds, 4 x 8 years with Petrobras
3 x RSV‟s, 3 x 5 years with Petrobras
Skandi Admiral onhire to Petrobras end September
Several contracts for DOF Subsea resulting in good asset utilisation
in Q4
Fleet:
Sale of hull 81 under construction at Cochin yard
Norskan ordered 3 AHTS at STX Promar, Brazil
Skandi Skolten delivered in July
Skandi Vitoria delivered and onhire to Petrobras early October
Skandi Peregrino delivered mid November, enroute to Brazil to
commence a long term contract with Statoil
Skandi Stord extended 2 more years with Statoil
Skandi Aker ”Ship of the Year 2010”
DOF ASA PRESENTATION
Q3 2010 - 4
The New Horizon
Highlights Q3
Financial:
Refinancing bonds in DOF ASA and DOF Subsea AS
Share issue DOF Installer ASA
Listing of Norskan postponed

DOF ASA PRESENTATION
Q3 2010 - 5
The New Horizon
Modern fleet
3 AHTS’s
13 PSV’s
2 CSV
3 state of the art
installation AHTS
vessels
Company overview
DOF Installer
Modern fleet & Equipment
21 CSV/ROV vessels
40 ROV’s + 1 AUV
Leading Subsea Contractor
DOF Subsea
Modern fleet
17 AHTS’s
7 PSV’s
2 CSV’s
NorskanDOF Subsea
Holding
Ship owning
Company
DOF ASA
DOF ASA PRESENTATION
Q3 2010 - 6
The New Horizon
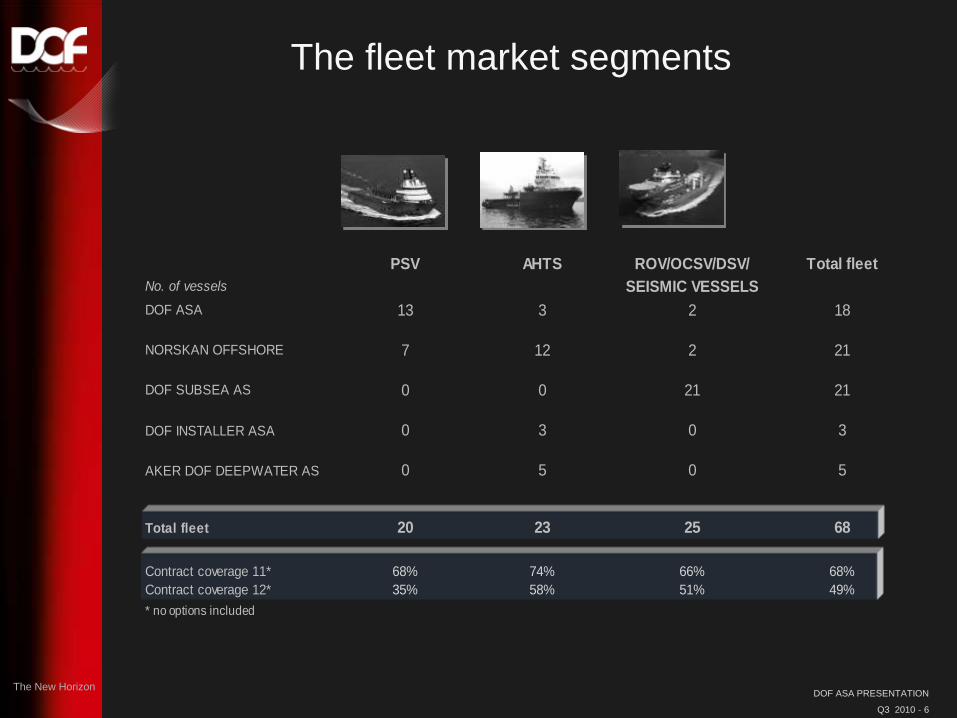
The fleet market segments
PSV AHTS ROV/OCSV/DSV/ Total fleet
No. of vessels SEISMIC VESSELS
DOF ASA 13 3 2 18
NORSKAN OFFSHORE 7 12 2 21
DOF SUBSEA AS 0 0 21 21
DOF INSTALLER ASA 0 3 0 3
AKER DOF DEEPWATER AS 0 5 0 5
Total fleet 20 23 25 68
Contract coverage 11* 68% 74% 66% 68%
Contract coverage 12* 35% 58% 51% 49%
* no options included

DOF ASA PRESENTATION
Q3 2010 - 7
The New Horizon
GLOBAL PLAYER
GEOGRAPHICAL FOCUS AREAS
PerthRio de Janeiro
Buenos Aires
Singapore
Houston
St. Johns
Aberdeen
Austevoll
Cairo
Brunei
Macae
Jakarta
Manila
Angola
St. Petersburg
Bergen
23
2
21
4
1
1

DOF ASA PRESENTATION
Q3 2010 - 8
The New Horizon
8
Long Term Contracted Cash Flows…
DOF group has solid cash flow visibility over the next 3-5 years
By Nov 2010 the total back-log (incl. options) was approx NOK 34 bn
Firm contract counts for NOK 19 bn
Options count for NOK 15 bn
The vessel Backlog amount to approximately 4 times the current
yearly revenue
Backlog Development (Year-End)
Note: Includes extension options on long-term contracts.
-
5
10
15
20
25
30
35
2010 2011 2012 2013 2014 2015 2016 2017

The New Horizon DOF ASA PRESENTATION
Q3 2010 - 9
DOF SUBSEA
Photographer: Harald M. Valderhaug

DOF ASA PRESENTATION
Q3 2010 - 10
The New Horizon
DOF Subsea Contract Coverage (Vessels)
FIRM CONTRACTS UNDER CONSTRUCTIONOPTIONAL PERIOD
J F M A M J J A S O N D J F M A M J J A S O N D J F M A M J J A S O N D J F M A M J J A S O N D J F M A M J J A S O N D J F M A M J J A S O N D
Geobay
Geograph Petrobras - Jun 2016
Ocean Protector (Bergen) Seaforce - Sept 2014 + 2y opt
Geosund
Geosea
Geoholm
Skandi Seven Subsea 7 -Mar 2013 +4y opt
Skandi Salvadore Chevron -Sept 2011 +2y opt
Skandi Singapore (H621)
Skandi Vitoria Petrobras - July 2014 + 4y opt
Skandi Niteroi (H24)
Skandi Skolten
Skandi Hercules (H722)
Skandi Bergen (H723)
Skandi Aker (H705) AKOFS 2 - Jan 2015 + 5y opt
Skandi Santos (H716) AKOFS 1 - Jan 2015 + 5y opt
Skandi Patagonia Total - Dec 2025
Skandi Inspector Fugro - Q4 2010
Skandi Carla Fugro - July 2012 + 14y opt
Skandi Neptune Subsea 7 - Dec 2013 + 3y opt
Skandi Achiever Technip - Aug 2015 + 4y opt
Skandi Acergy Acergy - Aug 2016 + 6y opt
Skandi Arctic Technip - mar 2017 + 8y opt
Q4Q1 Q2 Q3 Q4 Q1 Q2 Q3 Q4 Q1 Q2 Q3
201220112010 2013 2014 2015
Q1 Q2 Q3 Q4 Q1 Q2 Q3 Q4 Q1 Q2 Q3 Q4

DOF ASA PRESENTATION
Q3 2010 - 11
The New Horizon
FIRM CONTRACTS OPTIONAL PERIOD
DOF Subsea Contract Coverage (ROV & Others)
Q1 Q2 Q3 Q4 Q1 Q2 Q3 Q4 Q1 Q2 Q3 Q4
Norskan Botafogo Petrobas
Skandi Fluminence Petrobras
Skandi Chieftain Petrobras
DOF ASA Skandi Vega Statoil (May)
Skandi Seven Subsea 7
Skandi Aker AKOFS (May)
Subsea IRM contract Shell Philipines
TGT White Rhino TGT VSP Vietnam
Devils Creek Development SapuraAcergy
Victorian Desalination Plant Thiess Pty
Survey and Positioning Heerema
Field Development Technip
Pazflor SURF Oproject Technip
Well positioning BP Angola
Survey, FPSO Instal. Ghana Technip
Survey, Seismic Node Inst. Nigeria Seabird
Survey support BP
Survey support BP Angola
Urugua Saipem
Asia
Reg
ion
Atl
an
tic r
eg
ion
DOFCON
No
rskan
2010 2011 2012
DOF ASA PRESENTATION
Q3 2010 - 12
The New Horizon
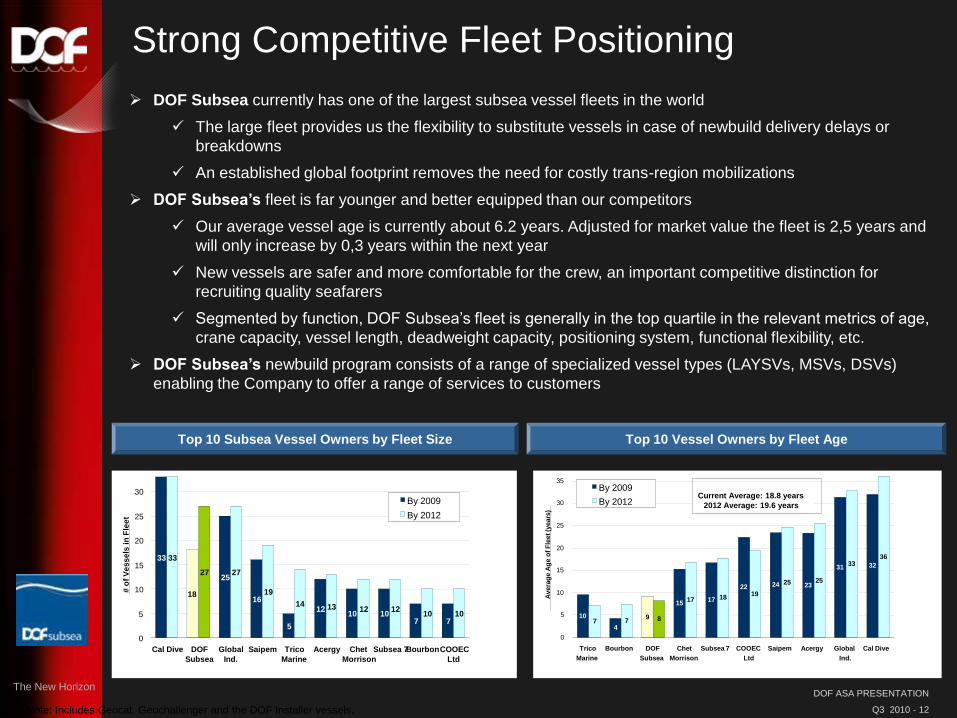
Strong Competitive Fleet Positioning
DOF Subsea currently has one of the largest subsea vessel fleets in the world
The large fleet provides us the flexibility to substitute vessels in case of newbuild delivery delays or
breakdowns
An established global footprint removes the need for costly trans-region mobilizations
DOF Subsea’s fleet is far younger and better equipped than our competitors
Our average vessel age is currently about 6.2 years. Adjusted for market value the fleet is 2,5 years and
will only increase by 0,3 years within the next year
New vessels are safer and more comfortable for the crew, an important competitive distinction for
recruiting quality seafarers
Segmented by function, DOF Subsea‟s fleet is generally in the top quartile in the relevant metrics of age,
crane capacity, vessel length, deadweight capacity, positioning system, functional flexibility, etc.
DOF Subsea’s newbuild program consists of a range of specialized vessel types (LAYSVs, MSVs, DSVs)
enabling the Company to offer a range of services to customers
Top 10 Vessel Owners by Fleet AgeTop 10 Subsea Vessel Owners by Fleet Size
33
16
5
1210 10
7 7
33
19
14 13 12 1210 10
18
2527 27
0
5
10
15
20
25
30
Cal Dive DOF
Subsea
Global
Ind.
Saipem Trico
Marine
Acergy Chet
Morrison
Subsea 7BourbonCOOEC
Ltd
# o
f V
es
se
ls i
n F
lee
t
By 2009
By 2012
10
4
1517
22 24 23
31 32
7 7 8
17 1819
25 25
3336
9
0
5
10
15
20
25
30
35
Trico
Marine
Bourbon DOF
Subsea
Chet
Morrison
Subsea 7 COOEC
Ltd
Saipem Acergy Global
Ind.
Cal Dive
Avera
ge A
ge o
f F
leet (y
ears
)
By 2009
By 2012Current Average: 18.8 years
2012 Average: 19.6 years
Note: Includes Geocat, Geochallenger and the DOF Installer vessels.

DOF ASA PRESENTATION
Q3 2010 - 13
The New Horizon
Skandi Singapore - DSV
Delivery Q2 2011
DP II Dive Support Vessel
2 x Triton XLX W ROV
18 man saturation diving
system
140 t Crane
900 m2 Cargo deck area
100 men accommodation

DOF ASA PRESENTATION
Q3 2010 - 14
The New Horizon
Skandi Skolten – The new generation vessels
Construction & AHTS
vessel
Hybrid propulsion
361 t Bollard Pull
36 000 BHP
250 t Crane
2 x W ROV
1 070 m2 Cargo deck
area
90 men accommodation
Design STX AH-04 | Built: 2010

DOF ASA PRESENTATION
Q3 2010 - 15
The New Horizon
Status Supply
Photographer: Harald M. Valderhaug

DOF ASA PRESENTATION
Q3 2010 - 16
The New Horizon
J F M A M J J A S O N D J F M A M J J A S O N D J F M A M J J A S O N D J F M A M J J A S O N D J F M A M J J A S O N D J F M A M J J A S O N D
PSV
1 Skandi Falcon Reliance spot
2 Skandi Marstein SHELL UK Opt Nov 2016
3 Skandi Foula SHELL UK
4 Skandi Rona SHELL UK
5 Skandi Buchan TOTAL
6 Skandi Sotra STATOIL
7 Skandi Caledonia M OG
8 Skandi Barra TOTAL
9 Skandi Texel Peterson Supplylink Opt Jan 2016
10 Skandi Commander SHELL
11 Skandi Mongstad STATOIL Firm Aug 2016 / Opt Aug 2021
12 Skandi Flora STATOIL Opt Feb 2017
13 Skandi Gamma (PSV 06 LNG) STATOIL Firm Mar 2016/ Opt Mar 2019
AHTS
14 Skandi Stord STATOIL
15 Skandi Admiral* PETROBRAS
16 Skandi Vega STATOIL Opt May 2018
*Backlog under Brazil contract overview
CSV
17 Skandi Fjord Halliburton Opt Oct 2017
18 Skandi Olympia FUGRO
2010 2011 2012 2013 2014 2015
DOF Contract Coverage
FIRM CONTRACTS UNDER CONSTRUCTIONOPTIONAL PERIOD

DOF ASA PRESENTATION
Q3 2010 - 17
The New Horizon
Aker DOF Deepwater AS - 50% DOF
Vessel Name
J F M A M J J A S O N D J F M A M J J A S O N D J F M A M J J A S O N D J F M A M J J A S O N D J F M A M J J A S O N D J F M A M J J A S O N D
1 Skandi Peregrino (VN) STATOIL
2 Skandi TBN Vietnam
3 Skandi TBN Vietnam
4 Skandi TBN Vietnam
5 Skandi TBN Vietnam
201520142010 2011 2012 2013
Aker DOF Deepwater - Contract Coverage
FIRM CONTRACTS UNDER CONSTRUCTIONOPTIONAL PERIOD

DOF ASA PRESENTATION
Q3 2010 - 18
The New Horizon
Brazilian Fleet9
Brazilian Fleet (Under
Construction)7
International Fleet
10
International Fleet (Under Construction)
10
Norskan‟s Market Position in BrazilNorskan is well positioned to serve the high-end offshore support vessel
market in Brazil
Leading owner of a diversified Brazilian
offshore support vessel fleet
Largest AHTS and CSVs owner in Brazil with a
versatile fleet
Leading owner of large PSVs and AHTSs in
Brazil (including current newbuilds)
One of the youngest fleets in the industry
Unique, “best-in-class” Brazilian-flagged
vessels
One of the largest tonnage capacities in the
Brazilian offshore industry to benefit from REB
regime
Capacity to import 6 to 8 additional high-end
vessels (through REB)
Chasing the Day Rate Business
Source: ODS Petrodata; includes vessels currently owned in Brazil and announced Brazilian newbuild programs1 Calculated at IPO
Norskan Vessel Breakdown 1
Companies operating in Brazil owning PSVs ≥ 3,000 dwt,
AHTS ≥ 10,000 bhp
Companies operating in Brazil owning CSVs

DOF ASA PRESENTATION
Q3 2010 - 19
Vessel J F M A M J J A S O N D J F M A M J J A S O N D J F M A M J J A S O N D J F M A M J J A S O N D J F M A M J J A S O N D J F M A M J J A S O N D
1 Skandi Leblon SHELL
2 Skandi Flamengo PETROBRAS
3 Skandi Waveney STATOIL
4 Skandi Stolmen PETROBRAS
5 Skandi Captain PETROBRAS
6 Skandi Yare PETROBRAS Opt Jan 2016
7 Skandi Hav PETROBRAS Opt Sep 2019
8 Skandi Copacabana PETROBRAS
9 Skandi Botafogo PETROBRAS
10 Skandi Rio PETROBRAS
11 Skandi Fluminense PETROBRAS
12 Skandi Giant PETROBRAS
13 Skandi Admiral PETROBRAS
14 Skandi Møgster OGX
15 Sanko Bay OGX18
16 Skandi Ipanema OGX
17 Skandi Peregrino STATOIL
18 Skandi Amazonas PETROBRAS 8 yrs f irm cont ract Fir m Jul 2019 / Opt Jul 2027
19 Skandi Iguaçu PETROBRAS 8 yrs f irm cont ract Fir m Dec 2019 / Opt Dec 2027
20 Hull 30 STX AH 11 PETROBRAS 8 yrs f irm cont ract Fir m Nov 2020 / Opt Nov 2028
21 Hull 31 STX AH 11 PETROBRAS 8 yrs f irm cont ract Fir m May 2021 / Opt May 202919
22 Hull 33 STX AH 1119
23 Skandi Chieftain PETROBRAS
24 Skandi Emerald/Odin Viking OGX
25 Skandi Salvador CHEVRON# #
26 Skandi Santos PETROBRAS Opt Nov 2020# #
27 Skandi Vitória PETROBRAS Opt Dec 2017
28 Skandi Niterói
29 Geograph PETROBRAS 5 yrs f r im cont ract
30 Skandi TBN 1 PETROBRAS 5 yrs f r im cont ract
31 Skandi TBN 2 PETROBRAS 5 yrs f r im cont ract
2015Q1 Q2 Q3 Q4
2014Q1 Q2 Q3 Q4
2013Q1 Q2 Q3 Q4
2011Q1 Q2 Q3 Q4
2012Q1 Q2 Q3 Q4
2010Q1 Q2 Q3 Q4
DOF / Norskan /DOF Subsea Contracts in Brazil
FIRM CONTRACTS UNDER CONSTRUCTIONOPTIONAL PERIOD
DOF ASA PRESENTATION
Q3 2010 - 20
The New Horizon
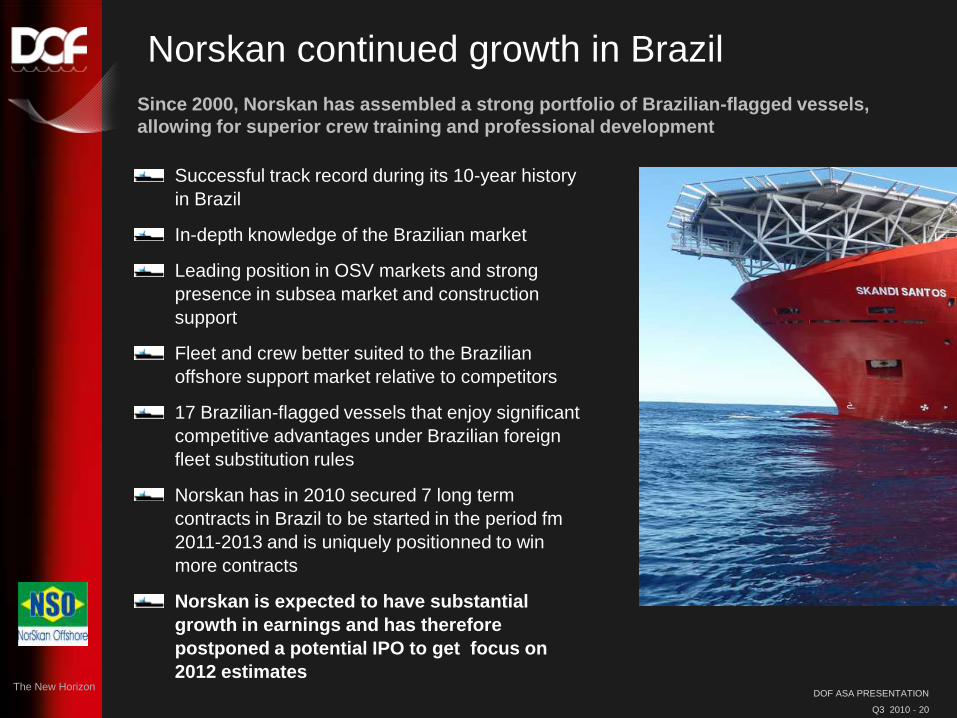
Norskan continued growth in Brazil
Since 2000, Norskan has assembled a strong portfolio of Brazilian-flagged vessels,
allowing for superior crew training and professional development
Successful track record during its 10-year history
in Brazil
In-depth knowledge of the Brazilian market
Leading position in OSV markets and strong
presence in subsea market and construction
support
Fleet and crew better suited to the Brazilian
offshore support market relative to competitors
17 Brazilian-flagged vessels that enjoy significant
competitive advantages under Brazilian foreign
fleet substitution rules
Norskan has in 2010 secured 7 long term
contracts in Brazil to be started in the period fm
2011-2013 and is uniquely positionned to win
more contracts
Norskan is expected to have substantial
growth in earnings and has therefore
postponed a potential IPO to get focus on
2012 estimates

DOF ASA PRESENTATION
Q3 2010 - 21
The New Horizon
Financials

DOF ASA PRESENTATION
Q3 2010 - 22
The New Horizon
Financial/Operational Highlights Q3 2010
• Utilization Subsea fleet (85%)
Good activity in the North Sea and Brazil
Lower activity in Australia
• Utilization Supply fleet (91%)
Two vessels in transit to new operational areas
Class docking
• Two vessels delivered in 3rd quarter
Skandi Skolten, in operation since July/August
Skandi Vitoria, in operation from October
• Unrealised currency gain on long term debt

DOF ASA PRESENTATION
Q3 2010 - 23
The New Horizon
ALL FIGURES IN NOK MILLION
Result Q3 2010
2010 2009 2010 2009 2009
Q3 Q3 YTD YTD
Operating income 1 237 1 120 3 888 3 166 4 327
Total operating income 1 237 1 120 3 888 3 166 4 327
operating expenses vessels 805 745 2 632 2 228 3 094
Total operating expenses 805 745 2 632 2 228 3 094
Operating profit before depreciation EBITDA 433 375 1 256 939 1 234
Depreciation 301 215 825 566 837
Write-down 179
Operating profit - EBIT 132 160 431 373 218
Net profit from associated companies -9 3 -7 176 192
other financial Items -262 -40 -484 -287 -163
Unralized profit/ loss on currencies 339 496 -1 900 758
Net financial costs 68 459 -492 789 787
Pre-tax profit 200 619 -61 1 162 1 005
Taxes 26 122 46 272 201
Result 174 497 -107 890 803

DOF ASA PRESENTATION
Q3 2010 - 24
The New Horizon
P&L Supply and Subsea
ALL FIGURES IN NOK MILLIONDOF ASA
DOF SUB.
HOLDINGTotal DOF ASA
DOF SUB.
HOLDINGTotal
Q3 2010 Q3 2010 Q3 2010 YTD 2010 YTD 2010 YTD 2010
Operating income 408 829 1 237 1 400 2 488 3 888
Other income - -
Total operating income 408 829 1 237 1 400 2 488 3 888
Operating expenses 256 549 805 892 1 740 2 632
Total operating expenses 256 549 805 892 1 740 2 632
Operating profit before
depreciation 163 270 433 508 748 1 256
Ebitda margin 40 % 33 % 35 % 36 % 30 % 32 %

DOF ASA PRESENTATION
Q3 2010 - 25
The New Horizon
Results - Business SegmentsALL FIGURES IN NOK MILLION
68
86
279
EBITDA Q3 2010
68
83 223
EBITDA Q3 2009
EBITDA
Q3 2010 Q3 2009
PSV 68 68
AHTS 86 83
CSV 279 223
Total 433 374

DOF ASA PRESENTATION
Q3 2010 - 26
The New Horizon
Results – Geographical SegmentsALL FIGURES IN NOK MILLION
110
6
159
158
EBITDA Q3 2010
185
25
81
83
EBITDA Q3 2009
EBITDA
Q3 2010 Q3 2009
Europe/ West Africa 110 185
Australasia 6 25
Brazil 159 81
America/Worldwide 158 83
Total 433 374

DOF ASA PRESENTATION
Q3 2010 - 27
The New Horizon
Currency effects on Q3 2010 results
ALL FIGURES IN NOK MILLION
Financial items Q3 2010 Acc Q3 2010 Q3 2009 Acc Q3 2009
Share of loss profit from associated -8 -7 4 176
Interest reveneue 21 57 15 64
Interest costs -232 -554 -148 -474
Realized currency gain/loss long debt -3 40 60 109
Realized currency gain/loss on forex instruments -9 -8 -113 -98
Realized operational currency gain/loss (-) 66 63 -27
Other financial expenses -106 -83 81 75
Total financial items -271 -491 -101 -175
Unrealized profit/loss on currencies
Unrealized currency gain/loss on long debt 223 -39 477 788
Unrealized currency gain/loss on forex instruments 116 38 18 112
Unrealized operational currency gain
Total unrealized profit/loss on currencies 339 -1 495 900
Total financial items 68 -492 394 725
DOF ASA PRESENTATION
Q3 2010 - 28
The New Horizon
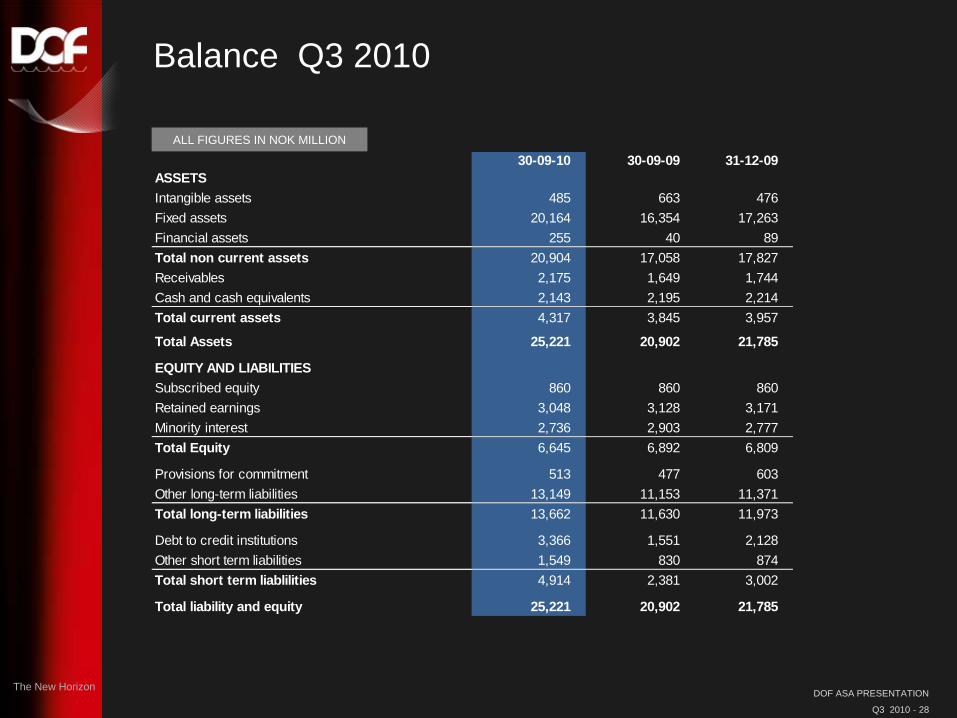
Balance Q3 2010
ALL FIGURES IN NOK MILLION
30-09-10 30-09-09 31-12-09
ASSETS
Intangible assets 485 663 476
Fixed assets 20,164 16,354 17,263
Financial assets 255 40 89
Total non current assets 20,904 17,058 17,827
Receivables 2,175 1,649 1,744
Cash and cash equivalents 2,143 2,195 2,214
Total current assets 4,317 3,845 3,957
Total Assets 25,221 20,902 21,785
EQUITY AND LIABILITIES
Subscribed equity 860 860 860
Retained earnings 3,048 3,128 3,171
Minority interest 2,736 2,903 2,777
Total Equity 6,645 6,892 6,809
Provisions for commitment 513 477 603
Other long-term liabilities 13,149 11,153 11,371
Total long-term liabilities 13,662 11,630 11,973
Debt to credit institutions 3,366 1,551 2,128
Other short term liabilities 1,549 830 874
Total short term liablilities 4,914 2,381 3,002
Total liability and equity 25,221 20,902 21,785

DOF ASA PRESENTATION
Q3 2010 - 29
The New Horizon
Key figures Q3 2010
2010 2009 2010 2009 2009
Q3 Q3 YTD YTD
Profit per share ex. minority interest 1.85 6.24 -0.08 10.84 9.16
Profit per share ex. unrealized loss/gain -1.81 0.01 -1.16 -0.12 0.52
Cashflow per share 1.50 2.61 7.90 6.72 12.10
Ebitda margin 35% 34% 32% 30% 29%
Ebit margin 11% 14% 11% 12% 5%
Return on net capital 3% 7% -2% 13% 12%
Equity ratio 26% 33% 26% 33% 31%
Net interest bearing debt 14,154 10,379 14,154 10,379 11,073
Net interest bearing debt ex. unemployed capital 10,726 6,091 10,726 6,091 6,478
No of shares 91,037,975 82,767,975 91,037,975 82,767,975 87,730,811
Face value per share 2 2 2 2 2

DOF ASA PRESENTATION
Q3 2010 - 30
The New Horizon
-
100,000
200,000
300,000
400,000
500,000
600,000
Q4 -2006
Q1 -2007
Q2 -2007
Q3 -2007
Q4 -2007
Q1 -2008
Q2 -2008
Q3 -2008
Q4 -2008
Q1 -2009
Q2 -2009
Q3 -2009
Q4 -2009
Q1 -2010
Q2 -2010
Th
ou
san
d N
OK
PSV
AHTS
CSV
DOF High asset values
Fair market values DOF fleet have been stable through 2008 and 2009
Fair market values Brazilian built vessels have increased with approx. 25%
since 2006
All vessels (built 1983-2010) are valued higher then original capex
Valuation of PSV (UT 755 and MT 6000), AHTS (UT 722L) and Subsea ROV vessel.

DOF ASA PRESENTATION
Q3 2010 - 31
The New Horizon
Significant Asset Coverage
The combined market value DOF vessels in operation per September is NOK 20bn
Supply FMV NOK 9 bn NIBD NOK 4,5bn
Subsea FMV NOK 11bn NIBD NOK 6,0 bn
Asset-level gearing on the fleet including new-builds is 59%, decreasing to 44% in 2014
Provides a significant equity cushion on top of existing vessel-level
financing
We forecast significant gearing reduction upon completion of the current
newbuild program
Total Fleet Market value
Vessels (a) 20 000
Other Equipment (b) 1 000
Total Fleet 21 000
Note: Vessel values as of 30 June, 2010.(a) Does not include market value of the remaining vessels to be delivered in 2010-
2013DOF Subsea are included 100% in the calculation and JV‟s with 50%.
(b) Includes ROVs, AUV, diving systems, other equipment.
Gearing forecast summary
0 %
20 %
40 %
60 %
80 %
100 %
120 %
2010E 2011E 2012E 2013E 2014E
59 % 60 % 57 % 52 % 44 %
41 % 40 % 43 % 48 % 56 %
debt Equity
DOF ASA PRESENTATION
Q3 2010 - 32
The New Horizon
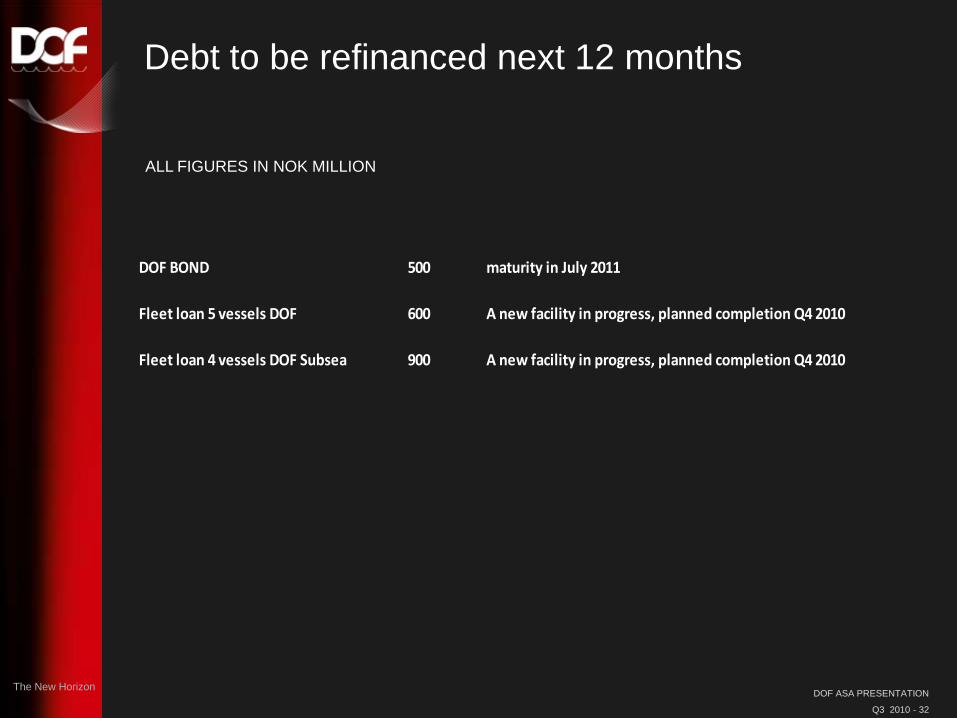
DOF BOND 500 maturity in July 2011
Fleet loan 5 vessels DOF 600 A new facility in progress, planned completion Q4 2010
Fleet loan 4 vessels DOF Subsea 900 A new facility in progress, planned completion Q4 2010
Debt to be refinanced next 12 months
ALL FIGURES IN NOK MILLION

DOF ASA PRESENTATION
Q3 2010 - 33
The New Horizon
The DOF Group New Builds
New Builds DOF ASA Group 31.10.2010 NOK 000
Vessel Name PROJECT
PRICE PAID IN
REMAINING
CAPEX FINANCING ** EQUITY LTV
Sum New Builds DOF ASA Group 11.135.466 1.955.123 9.180.343 8.352.620 827.723 75 %
Relative share New Builds DOF ASA Group 9.988.306 1.755.818 8.232.488 7.537.620 694.868 75 %
DOF ASA /DOF Rederi (100%) 553.870 110.000 443.870 415.000 28.870 75 %
Norskan (100%) 5.474.275 783.513 4.690.762 4.357.620 333.142 80 %
Aker DOF Deepwater (JV 50 %) 866.161 144.805 721.356 590.000 131.356 68 %
DOF SUBSEA (100 %) 913.000 350.000 563.000 650.000 -87.000 71 %
DOF SUBSEA (JV 50%) 281.000 54.500 226.500 225.000 1.500 80 %
DOF INSTALLER (78,5%) 1.900.000 313.000 1.587.000 1.300.000 287.000 68 %
**Total planned financing new-building program: NOK 7,5 bnSecured financing new-building program: NOK 5,7 bn

DOF ASA PRESENTATION
Q3 2010 - 34
The New Horizon Picture of Skandi Mongstad
OUTLOOK

DOF ASA PRESENTATION
Q3 2010 - 35
The New Horizon
SHORT TERM OUTLOOK
High contract coverage for both supply and subsea in
Q4
More vessels contributing compared to previous
quarters
Ebitda in Q4 expected to be better than Q2 Ebitda

DOF ASA PRESENTATION
Q3 2010 - 36
The New Horizon
Q4 2010 H1 2011 H2 2011 2012 2013
Skandi Urca (8 yrs Petrobras)
Skandi Angra
Skandi Iquazu (8 yrs Petrobras)
Skandi Paraty (8 yrs Petrobras)
Skandi Vietnam 5
Skandi Vietnam 6
Skandi Vietnam 4
Skandi Bergen (Project)
Skandi Niterói
Skandi Amazonas (8 yrs Petrobras)
Skandi Gamma (6 yrs Statoil)
Skandi Emerald
Skandi Hawk
Skandi Singapore
Skandi Hercules (Project)
Skandi Vitoria (4 yrs Petrobras)
Skandi Ipanema (1.5 yrs OGX)
Skandi Peregino (2 yrs Statoil)
50 Vessels
54 Vessels
58 Vessels
62 Vessels
66 Vessels
Long Term OutlookEbitda growth new vessels
Brazil DOF Supply
DOF Installer DOF Subsea
Vessels in Operation

DOF ASA PRESENTATION
Q3 2010 - 37
The New Horizon
MARKET SUMMARY DOF FLEET
Supply
Weak North Sea spot market expected near term
Several long term opportunities for PSV‟s in the North Sea
Strong market in Brazil – several new tenders
Subsea
Expected lower activities in the North Sea during winter season
Higher activity in Asia in Q4 2010 and Q1 2011 compared to Q3
High activity in Brazil

DOF ASA PRESENTATION
Q3 2010 - 38
The New Horizon
Thank you

DOF ASA PRESENTATION
Q3 2010 - 39
The New Horizon
DISCLAIMER
This presentation by DOF ASA designed to provide a high level overview of aspects of theoperations of the DOF ASA Group.
The material set out in the presentation is current as at 18 November, 2010.
This presentation contains forward-looking statements relating to operations of the DOF ASAGroup that are based on management‟s own current expectations, estimates and projectionsabout matters relevant to DOF ASA„s future financial performance. Words such as “likely”,“aims”, “looking forward”, “potential”, “anticipates”, “expects”, “predicts”, “plans”, “targets”,“believes” and “estimates” and similar expressions are intended to identify forward-lookingstatements.
References in the presentation to assumptions, estimates and outcomes and forward-lookingstatements about assumptions, estimates and outcomes, which are based on internal businessdata and external sources, are uncertain given the nature of the industry, business risks, andother factors. Also, they may be affected by internal and external factors that may have amaterial effect on future business performance and results.
No assurance or guarantee is, or should be taken to be, given in relation to the future businessperformance or results of the DOF ASA Group or the likelihood that the assumptions, estimatesor outcomes will be achieved.
While management has taken every effort to ensure the accuracy of the material in thepresentation, the presentation is provided for information only. DOF ASA , its officers andmanagement exclude and disclaim any liability in respect of anything done in reliance on thepresentation.
All forward-looking statements made in this presentation are based on information presentlyavailable to management and DOF ASA assumes no obligation to update any forward looking-statements. Nothing in this presentation constitutes investment advice and this presentationshall not constitute an offer to sell or the solicitation of any offer to buy any securities orotherwise engage in any investment activity.
You should make your own enquiries and take your own advice (including financial and legaladvice) before making an investment in the company's shares or in making a decision to hold orsell your shares.