q1 2017 waterloo region office market report
TRANSCRIPT
Research & Forecast Report
WATERLOO REGIONOFFICE First Quarter 2017
2 Research & Forecast Report | First Quarter 2017 | Waterloo Region / Office | Colliers International
Market Summaries
City of Cambridge ..........................................................................................................4 City of Kitchener ..................................................................................................... 5 City of Waterloo ...................................................................................................... 6
Glossary ............................................................................................................................... 7
Table of Contents
3 Research & Forecast Report | First Quarter 2017 | Waterloo Region / Office | Colliers International
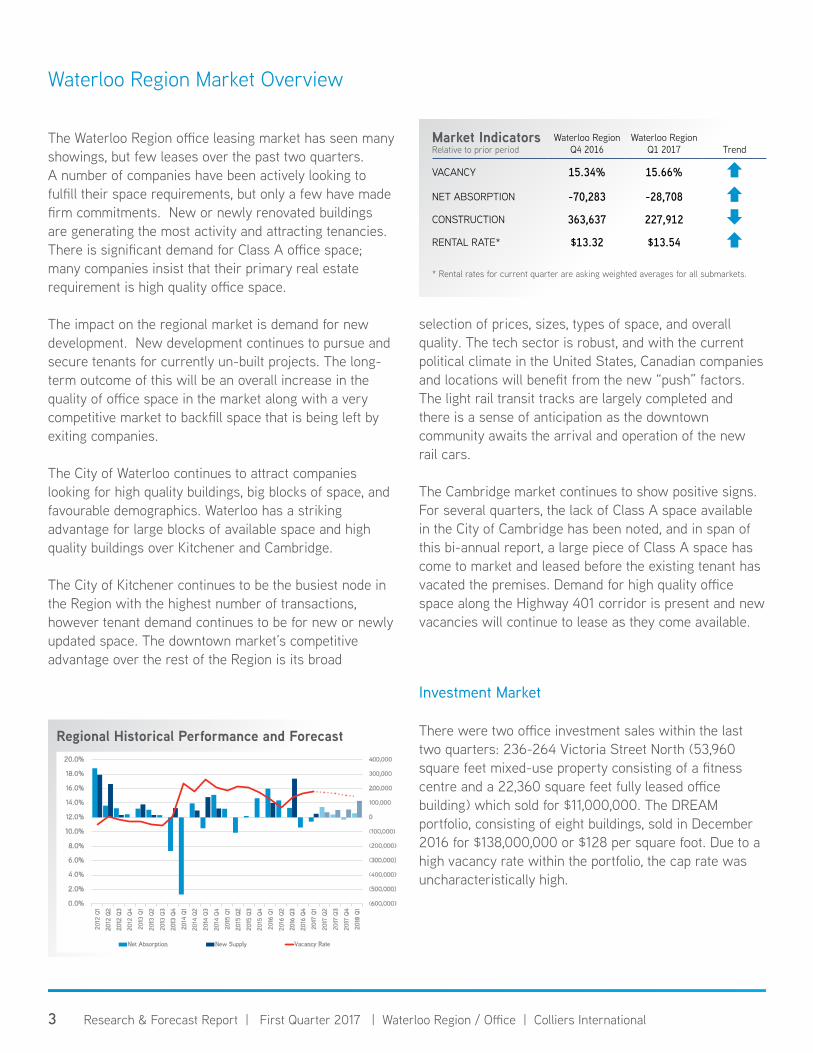
Waterloo Region Market Overview
The Waterloo Region office leasing market has seen many showings, but few leases over the past two quarters. A number of companies have been actively looking to fulfill their space requirements, but only a few have made firm commitments. New or newly renovated buildings are generating the most activity and attracting tenancies. There is significant demand for Class A office space; many companies insist that their primary real estate requirement is high quality office space.
The impact on the regional market is demand for new development. New development continues to pursue and secure tenants for currently un-built projects. The long-term outcome of this will be an overall increase in the quality of office space in the market along with a very competitive market to backfill space that is being left by exiting companies.
The City of Waterloo continues to attract companies looking for high quality buildings, big blocks of space, and favourable demographics. Waterloo has a striking advantage for large blocks of available space and high quality buildings over Kitchener and Cambridge.
The City of Kitchener continues to be the busiest node in the Region with the highest number of transactions, however tenant demand continues to be for new or newly updated space. The downtown market’s competitive advantage over the rest of the Region is its broad
Market IndicatorsRelative to prior period
Waterloo RegionQ4 2016
Waterloo RegionQ1 2017 Trend
VACANCY 15.34% 15.66%
NET ABSORPTION -70,283 -28,708
CONSTRUCTION 363,637 227,912
RENTAL RATE* $13.32 $13.54
* Rental rates for current quarter are asking weighted averages for all submarkets.
selection of prices, sizes, types of space, and overall quality. The tech sector is robust, and with the current political climate in the United States, Canadian companies and locations will benefit from the new “push” factors. The light rail transit tracks are largely completed and there is a sense of anticipation as the downtown community awaits the arrival and operation of the new rail cars.
The Cambridge market continues to show positive signs. For several quarters, the lack of Class A space available in the City of Cambridge has been noted, and in span of this bi-annual report, a large piece of Class A space has come to market and leased before the existing tenant has vacated the premises. Demand for high quality office space along the Highway 401 corridor is present and new vacancies will continue to lease as they come available.
Investment Market
There were two office investment sales within the last two quarters: 236-264 Victoria Street North (53,960 square feet mixed-use property consisting of a fitness centre and a 22,360 square feet fully leased office building) which sold for $11,000,000. The DREAM portfolio, consisting of eight buildings, sold in December 2016 for $138,000,000 or $128 per square foot. Due to a high vacancy rate within the portfolio, the cap rate was uncharacteristically high.
Regional Historical Performance and Forecast
(600,000)
(500,000)
(400,000)
(300,000)
(200,000)
(100,000)
0
100,000
200,000
300,000
400,000
0.0%
2.0%
4.0%
6.0%
8.0%
10.0%
12.0%
14.0%
16.0%
18.0%
20.0%
2012
Q1
2012
Q2
2012
Q3
2012
Q4
2013
Q1
2013
Q2
2013
Q3
2013
Q4
2014
Q1
2014
Q2
2014
Q3
2014
Q4
2015
Q1
2015
Q2
2015
Q3
2015
Q4
2016
Q1
2016
Q2
2016
Q3
2016
Q4
2017
Q1
2017
Q2
2017
Q3
2017
Q4
2018
Q1
Net Absorption New Supply Vacancy Rate
4 Research & Forecast Report | First Quarter 2017 | Waterloo Region / Office | Colliers International
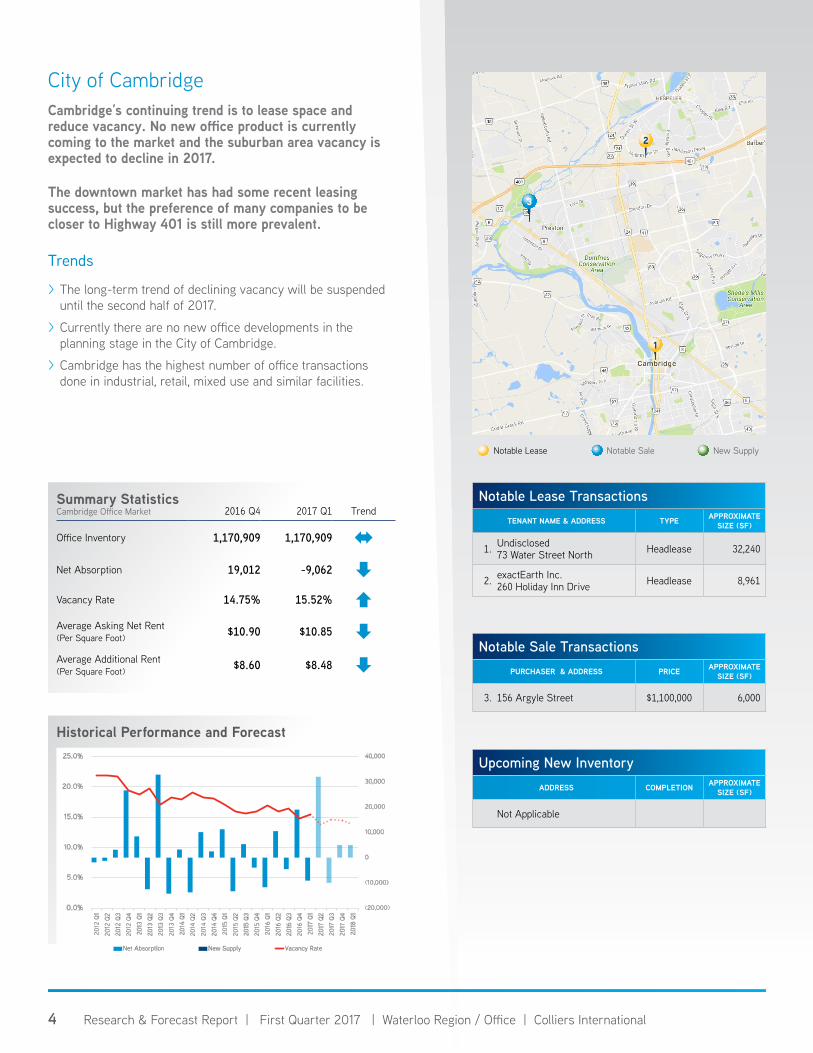
Notable Lease TransactionsTENANT NAME & ADDRESS TYPE APPROXIMATE
SIZE (SF)
1. Undisclosed73 Water Street North Headlease 32,240
2. exactEarth Inc.260 Holiday Inn Drive Headlease 8,961
1
Notable Lease Notable Sale New Supply
City of CambridgeCambridge’s continuing trend is to lease space and reduce vacancy. No new office product is currently coming to the market and the suburban area vacancy is expected to decline in 2017.
The downtown market has had some recent leasing success, but the preference of many companies to be closer to Highway 401 is still more prevalent.
Trends
> The long-term trend of declining vacancy will be suspended until the second half of 2017.
> Currently there are no new office developments in the planning stage in the City of Cambridge.
> Cambridge has the highest number of office transactions done in industrial, retail, mixed use and similar facilities.
Notable Sale TransactionsPURCHASER & ADDRESS PRICE APPROXIMATE
SIZE (SF)
3. 156 Argyle Street $1,100,000 6,000
Upcoming New InventoryADDRESS COMPLETION APPROXIMATE
SIZE (SF)
Not Applicable
Summary Statistics Cambridge Office Market 2016 Q4 2017 Q1 Trend
Office Inventory 1,170,909 1,170,909
Net Absorption 19,012 -9,062
Vacancy Rate 14.75% 15.52%
Average Asking Net Rent(Per Square Foot) $10.90 $10.85
Average Additional Rent(Per Square Foot) $8.60 $8.48
Historical Performance and Forecast
(20,000)
(10,000)
0
10,000
20,000
30,000
40,000
0.0%
5.0%
10.0%
15.0%
20.0%
25.0%
2012
Q1
2012
Q2
2012
Q3
2012
Q4
2013
Q1
2013
Q2
2013
Q3
2013
Q4
2014
Q1
2014
Q2
2014
Q3
2014
Q4
2015
Q1
2015
Q2
2015
Q3
2015
Q4
2016
Q1
2016
Q2
2016
Q3
2016
Q4
2017
Q1
2017
Q2
2017
Q3
2017
Q4
2018
Q1
Net Absorption New Supply Vacancy Rate
2
3
5 Research & Forecast Report | First Quarter 2017 | Waterloo Region / Office | Colliers International
Notable Lease TransactionsTENANT NAME & ADDRESS TYPE APPROXIMATE
SIZE (SF)
1. Atomic Labs119 King Street West Sublease 10,940
2. Overlap Associates305 King Street West Headlease 6,439
3. Laurentian Bank305 King Street West Headlease 5,520
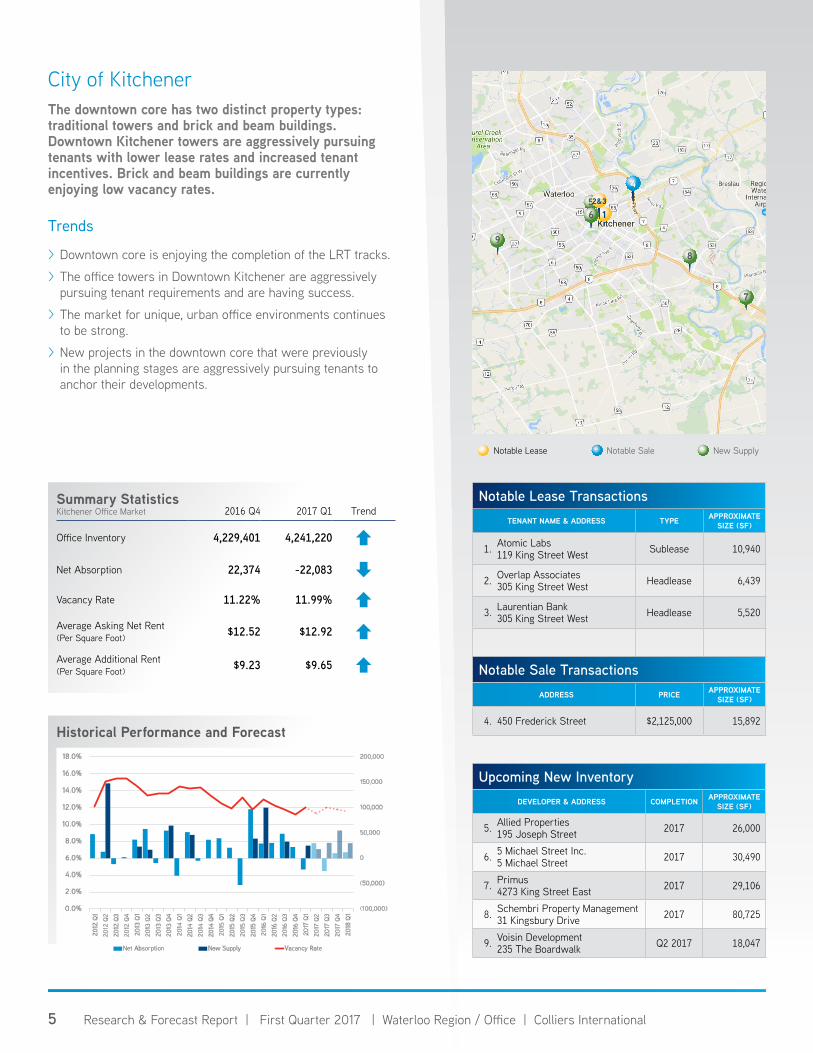
Notable Lease Notable Sale New Supply
City of KitchenerThe downtown core has two distinct property types: traditional towers and brick and beam buildings. Downtown Kitchener towers are aggressively pursuing tenants with lower lease rates and increased tenant incentives. Brick and beam buildings are currently enjoying low vacancy rates.
Trends
> Downtown core is enjoying the completion of the LRT tracks.
> The office towers in Downtown Kitchener are aggressively pursuing tenant requirements and are having success.
> The market for unique, urban office environments continues to be strong.
> New projects in the downtown core that were previously in the planning stages are aggressively pursuing tenants to anchor their developments.
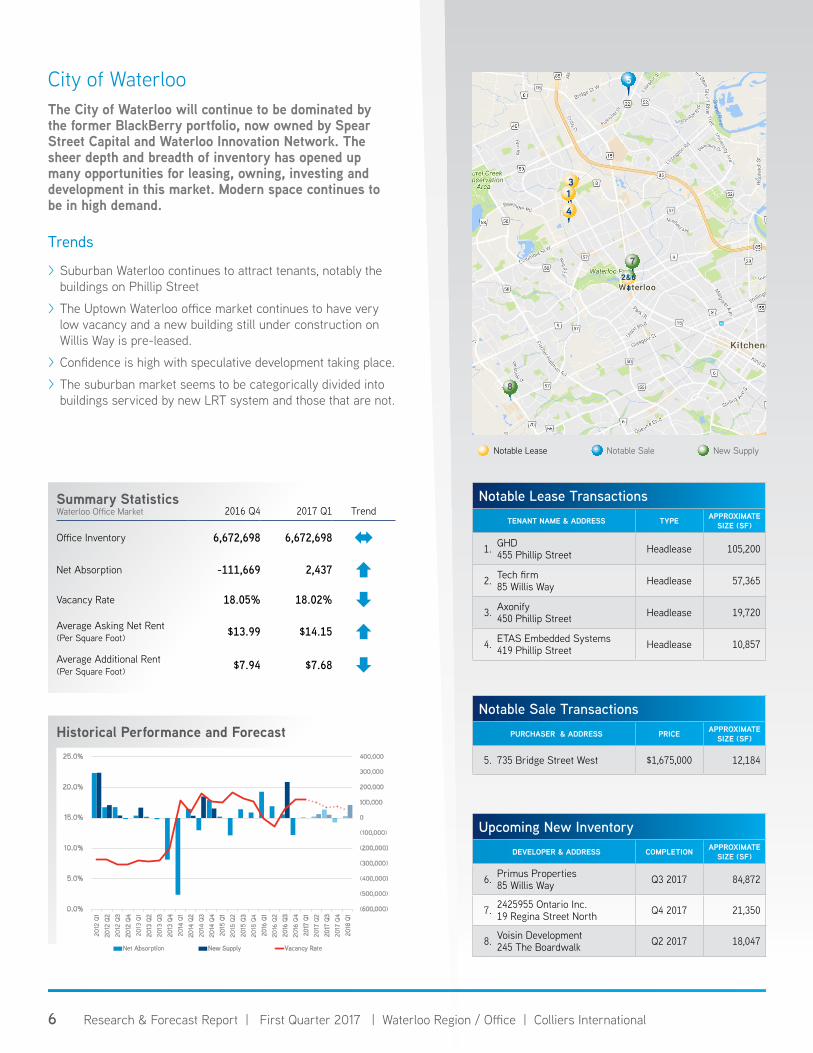
Summary Statistics Kitchener Office Market 2016 Q4 2017 Q1 Trend
Office Inventory 4,229,401 4,241,220
Net Absorption 22,374 -22,083
Vacancy Rate 11.22% 11.99%
Average Asking Net Rent(Per Square Foot) $12.52 $12.92
Average Additional Rent(Per Square Foot) $9.23 $9.65 Notable Sale Transactions
ADDRESS PRICE APPROXIMATE SIZE (SF)
4. 450 Frederick Street $2,125,000 15,892
Upcoming New InventoryDEVELOPER & ADDRESS COMPLETION APPROXIMATE
SIZE (SF)
5. Allied Properties195 Joseph Street 2017 26,000
6. 5 Michael Street Inc.5 Michael Street 2017 30,490
7. Primus4273 King Street East 2017 29,106
8. Schembri Property Management31 Kingsbury Drive 2017 80,725
9. Voisin Development235 The Boardwalk Q2 2017 18,047
Historical Performance and Forecast
(100,000)
(50,000)
0
50,000
100,000
150,000
200,000
0.0%
2.0%
4.0%
6.0%
8.0%
10.0%
12.0%
14.0%
16.0%
18.0%
2012
Q1
2012
Q2
2012
Q3
2012
Q4
2013
Q1
2013
Q2
2013
Q3
2013
Q4
2014
Q1
2014
Q2
2014
Q3
2014
Q4
2015
Q1
2015
Q2
2015
Q3
2015
Q4
2016
Q1
2016
Q2
2016
Q3
2016
Q4
2017
Q1
2017
Q2
2017
Q3
2017
Q4
2018
Q1
Net Absorption New Supply Vacancy Rate
8
51
7
9
4
62&3
6 Research & Forecast Report | First Quarter 2017 | Waterloo Region / Office | Colliers International
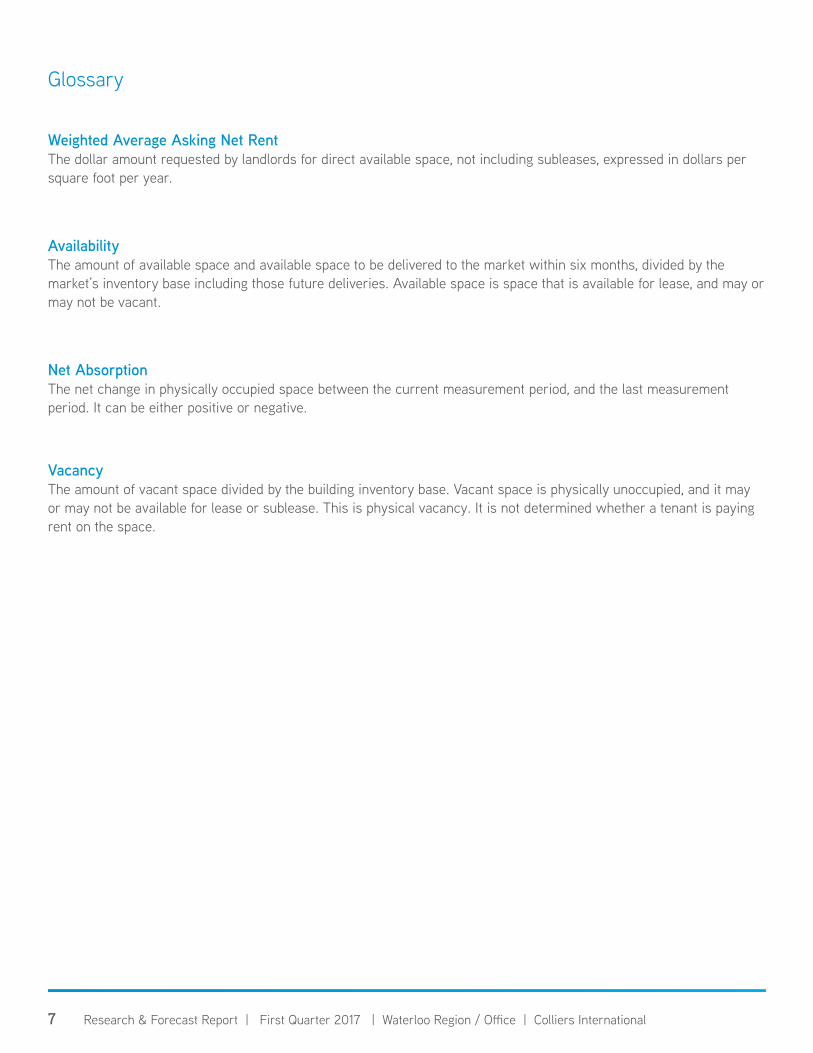
Notable Lease Notable Sale New Supply
City of WaterlooThe City of Waterloo will continue to be dominated by the former BlackBerry portfolio, now owned by Spear Street Capital and Waterloo Innovation Network. The sheer depth and breadth of inventory has opened up many opportunities for leasing, owning, investing and development in this market. Modern space continues to be in high demand.
Trends
> Suburban Waterloo continues to attract tenants, notably the buildings on Phillip Street
> The Uptown Waterloo office market continues to have very low vacancy and a new building still under construction on Willis Way is pre-leased.
> Confidence is high with speculative development taking place.
> The suburban market seems to be categorically divided into buildings serviced by new LRT system and those that are not.
Summary Statistics Waterloo Office Market 2016 Q4 2017 Q1 Trend
Office Inventory 6,672,698 6,672,698
Net Absorption -111,669 2,437
Vacancy Rate 18.05% 18.02%
Average Asking Net Rent(Per Square Foot) $13.99 $14.15
Average Additional Rent(Per Square Foot) $7.94 $7.68
Historical Performance and Forecast
(600,000)
(500,000)
(400,000)
(300,000)
(200,000)
(100,000)
0
100,000
200,000
300,000
400,000
0.0%
5.0%
10.0%
15.0%
20.0%
25.0%
2012
Q1
2012
Q2
2012
Q3
2012
Q4
2013
Q1
2013
Q2
2013
Q3
2013
Q4
2014
Q1
2014
Q2
2014
Q3
2014
Q4
2015
Q1
2015
Q2
2015
Q3
2015
Q4
2016
Q1
2016
Q2
2016
Q3
2016
Q4
2017
Q1
2017
Q2
2017
Q3
2017
Q4
2018
Q1
Net Absorption New Supply Vacancy Rate
Notable Lease TransactionsTENANT NAME & ADDRESS TYPE APPROXIMATE
SIZE (SF)
1. GHD455 Phillip Street Headlease 105,200
2. Tech firm 85 Willis Way Headlease 57,365
3. Axonify450 Phillip Street Headlease 19,720
4. ETAS Embedded Systems419 Phillip Street Headlease 10,857
Notable Sale TransactionsPURCHASER & ADDRESS PRICE APPROXIMATE
SIZE (SF)
5. 735 Bridge Street West $1,675,000 12,184
Upcoming New InventoryDEVELOPER & ADDRESS COMPLETION APPROXIMATE
SIZE (SF)
6. Primus Properties85 Willis Way Q3 2017 84,872
7. 2425955 Ontario Inc.19 Regina Street North Q4 2017 21,350
8. Voisin Development245 The Boardwalk Q2 2017 18,047
5
3
7
8
1
2&6
4
7 Research & Forecast Report | First Quarter 2017 | Waterloo Region / Office | Colliers International
Glossary
Weighted Average Asking Net Rent The dollar amount requested by landlords for direct available space, not including subleases, expressed in dollars per square foot per year.
Availability The amount of available space and available space to be delivered to the market within six months, divided by the market’s inventory base including those future deliveries. Available space is space that is available for lease, and may or may not be vacant.
Net Absorption The net change in physically occupied space between the current measurement period, and the last measurement period. It can be either positive or negative.
Vacancy The amount of vacant space divided by the building inventory base. Vacant space is physically unoccupied, and it may or may not be available for lease or sublease. This is physical vacancy. It is not determined whether a tenant is paying rent on the space.
Copyright © 2017 Colliers International.
The information contained herein has been obtained from sources deemed reliable. While every reasonable effort has been made to ensure its accuracy, we cannot guarantee it. No responsibility is assumed for any inaccuracies. Readers are encouraged to consult their professional advisors prior to acting on any of the material contained in this report.
About Colliers International Group Inc.
Colliers International Group Inc. is an industry leading global real estate services company with more than 15,000 skilled professionals operating in 68 countries. With an enterprising culture and significant employee ownership, Colliers professionals provide a full range of services to real estate occupiers, owners and investors worldwide. Services include strategic advice and execution for property sales, leasing and finance; global corporate solutions; property, facility and project management; workplace solutions; appraisal, valuation and tax consulting; customized research; and thought leadership consulting.
Colliers professionals think differently, share great ideas and offer thoughtful and innovative advice that help clients accelerate their success. Colliers has been ranked among the top 100 outsourcing firms by the International Association of Outsourcing Professionals’ Global Outsourcing for 11 consecutive years, more than any other real estate services firm.
colliers.com
396 offices in 68 countries on 6 continentsUnited States: 153 Canada: 29 Latin America: 24 Asia Pacific: 79 EMEA: 111
$2.6BUS* in annual revenue
2Bsquare feet under management
15,000professionals and staff
*Based on 2016 results
MARKET CONTACT:Serguei Kaminski Market Intelligence Coordinator | Waterloo Region+1 519 904 [email protected]
REGIONAL AUTHORS:John Lind | Senior Sales RepresentativeKarl Innanen, CCIM | Managing Director, BrokerSerguei Kaminski | Market Intelligence CoordinatorJennie Ross | Client Project Coordinator
Colliers International | Waterloo Region305 King Street West, Suite 606Kitchener, ON N2G 1B9 | Canada
+1 519 570 1330