national household survey - region of waterloo
TRANSCRIPT

PLANNING, DEVELOPMENT AND LEGISLATIVE SERVICES – 2011 NHS Bulletin #3
National Household Survey
F A S T F A C T S• The term “National Household Survey”
(NHS) in this document refers to the National Household Survey of Canada conducted by Statistics Canada between May and August of 2011. This was a voluntary survey sent to 4.5 million households across Canada to gather social and economic information about the population.
• The term “Census” in this document refers to the Census of Population conducted by Statistics Canada. The most recent Census was conducted on May 10, 2011. The Census is designed to provide information about people and housing units in Canada.
• Due to the voluntary nature of the 2011 NHS, caution must be used when interpreting the data. Further, due to changes in data reporting and survey methodology from 2006 and previous census years, direct comparisons, including the calculation of growth rates, percentage and absolute changes, should not be made.
• Some respondents reported multiple ethnic origins, for example, Canadian and English. Since each response is counted, the totals summed up from each ethnic origin will exceed the total population. For ethnic origins, ‘total responses’ represents the sum of both single and multiple response counts for a selected ethnicity.
• In contrast to the 2011 Census population of 507,096 for Waterloo Region, NHS data was collected for 499,610 people who were living in private households. It does not include those living in collectives such as nursing homes or group homes.
For more information on Census statistics, please refer to Statistics Canada’s website: www.statcan.gc.ca
Ethnic Origins, Visible Minorities, Aboriginal People and ReligionStatistics from the 2011 National Household Survey for Waterloo Region
Ethnic OriginsThe 2011 NHS shows Waterloo Region’s cultural diversity, with residents reporting 189 different ethnic origins. Not to be confused with nationality or place of birth, ‘ethnic origin’ refers to a respondent’s ancestry and is tied to their awareness of their family background. Interestingly, the most frequently reported ethnicity was Canadian with 21 per cent of total responses.The top ten responses for ethnicities after Canadian are listed in Table 1. English, German, Scottish and Irish ethnic origins, combined with Canadian, accounted for nearly 90 per cent of the total responses. Eight of the ten top responses were European ethnicities including French, Dutch, Polish and Portuguese, with East Indian, Chinese ethnicities rounding out the top ten. Table 1: Top Ten Reported Ethnic Origins after Canadian in Waterloo Region, 2011
Ethnicity Total ResponsesPercentage of Total Region Responses
Canadian 126,390 21.0
1 English 121,335 20.2
2 German 114,550 19.0
3 Scottish 88,530 14.7
4 Irish 87,415 14.5
5 French 45,670 7.6
6 Dutch 24,345 4.0
7 Polish 23,210 3.9
8 Portuguese 20,385 3.4
9 East Indian 16,520 2.7
10 Chinese 14,200 2.4Source: Statistics Canada, 2011 National Household Survey by Census Division
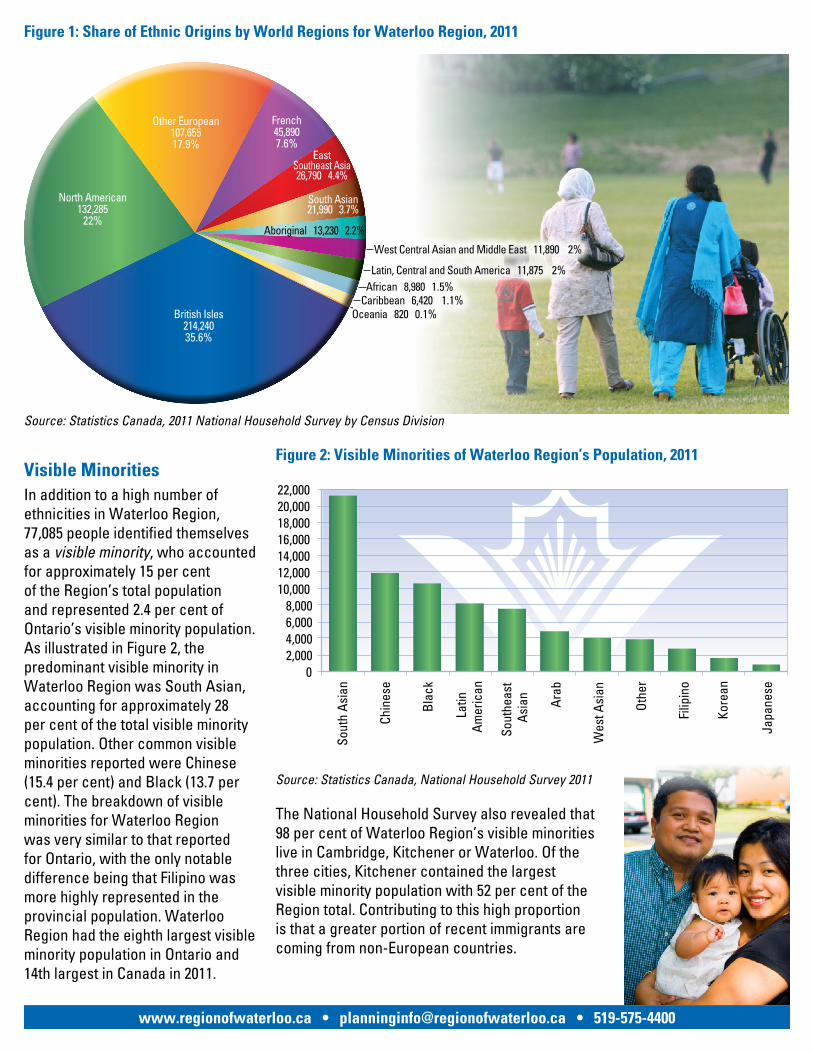
When grouped by world region, the majority of ethnic origins responses were from the British Isles, North American or Other European regions, as illustrated in Figure 1. French, South and Southeast Asian were also common responses followed by Aboriginal.
www.regionofwaterloo.ca • [email protected] • 519-575-4400
Figure 1: Share of Ethnic Origins by World Regions for Waterloo Region, 2011
Source: Statistics Canada, 2011 National Household Survey by Census Division
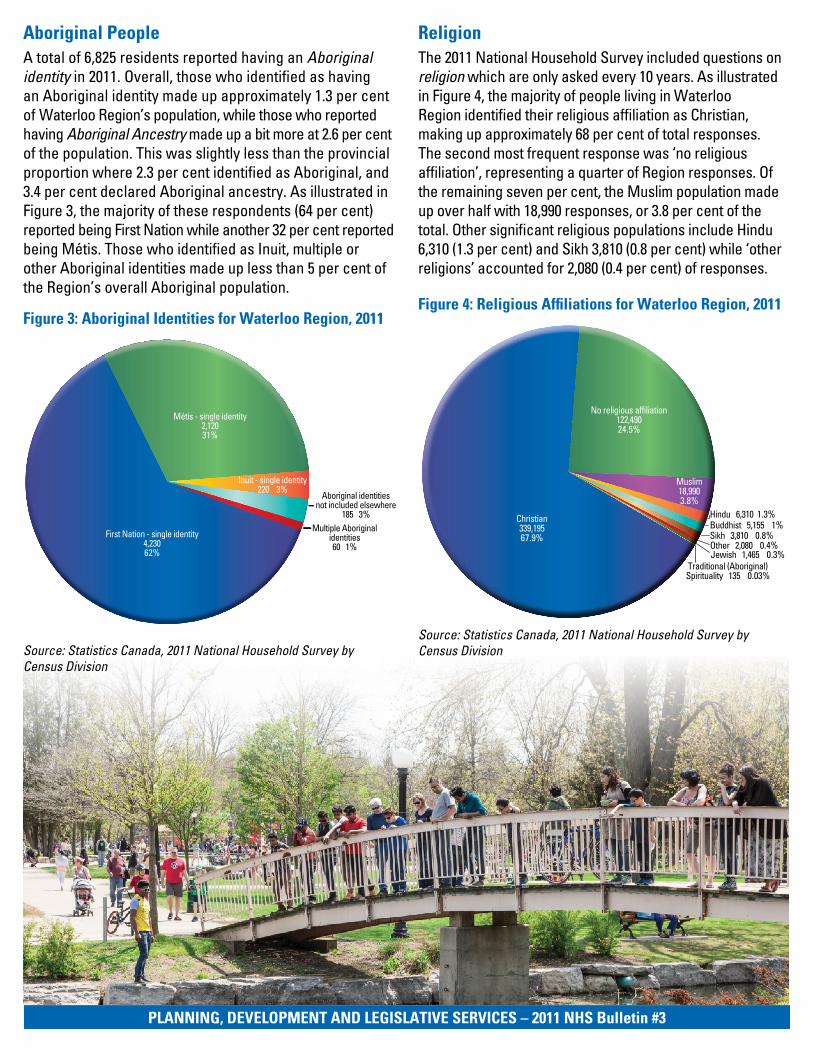
Visible MinoritiesIn addition to a high number of ethnicities in Waterloo Region, 77,085 people identified themselves as a visible minority, who accounted for approximately 15 per cent of the Region’s total population and represented 2.4 per cent of Ontario’s visible minority population. As illustrated in Figure 2, the predominant visible minority in Waterloo Region was South Asian, accounting for approximately 28 per cent of the total visible minority population. Other common visible minorities reported were Chinese (15.4 per cent) and Black (13.7 per cent). The breakdown of visible minorities for Waterloo Region was very similar to that reported for Ontario, with the only notable difference being that Filipino was more highly represented in the provincial population. Waterloo Region had the eighth largest visible minority population in Ontario and 14th largest in Canada in 2011.
Figure 2: Visible Minorities of Waterloo Region’s Population, 2011
Source: Statistics Canada, National Household Survey 2011
The National Household Survey also revealed that 98 per cent of Waterloo Region’s visible minorities live in Cambridge, Kitchener or Waterloo. Of the three cities, Kitchener contained the largest visible minority population with 52 per cent of the Region total. Contributing to this high proportion is that a greater portion of recent immigrants are coming from non-European countries.
North American132,285
22%
Other European107,65517.9%
British Isles214,24035.6%
French45,8907.6%
EastSoutheast Asia26,790 4.4%
South Asian21,990 3.7%
Aboriginal 13,230 2.2%
West Central Asian and Middle East 11,890 2%
Oceania 820 0.1%Caribbean 6,420 1.1%African 8,980 1.5%
Latin, Central and South America 11,875 2%
02,0004,0006,0008,000
10,00012,00014,00016,00018,00020,00022,000
Sout
h A
sian
Chin
ese
Bla
ck
Latin
A
mer
ican
Sout
heas
t A
sian A
rab
Wes
t Asi
an
Oth
er
Filip
ino
Kore
an
Japa
nese
PLANNING, DEVELOPMENT AND LEGISLATIVE SERVICES – 2011 NHS Bulletin #3
Aboriginal PeopleA total of 6,825 residents reported having an Aboriginal identity in 2011. Overall, those who identified as having an Aboriginal identity made up approximately 1.3 per cent of Waterloo Region’s population, while those who reported having Aboriginal Ancestry made up a bit more at 2.6 per cent of the population. This was slightly less than the provincial proportion where 2.3 per cent identified as Aboriginal, and 3.4 per cent declared Aboriginal ancestry. As illustrated in Figure 3, the majority of these respondents (64 per cent) reported being First Nation while another 32 per cent reported being Métis. Those who identified as Inuit, multiple or other Aboriginal identities made up less than 5 per cent of the Region’s overall Aboriginal population.
Figure 3: Aboriginal Identities for Waterloo Region, 2011
Source: Statistics Canada, 2011 National Household Survey by Census Division
ReligionThe 2011 National Household Survey included questions on religion which are only asked every 10 years. As illustrated in Figure 4, the majority of people living in Waterloo Region identified their religious affiliation as Christian, making up approximately 68 per cent of total responses. The second most frequent response was ‘no religious affiliation’, representing a quarter of Region responses. Of the remaining seven per cent, the Muslim population made up over half with 18,990 responses, or 3.8 per cent of the total. Other significant religious populations include Hindu 6,310 (1.3 per cent) and Sikh 3,810 (0.8 per cent) while ‘other religions’ accounted for 2,080 (0.4 per cent) of responses.
Figure 4: Religious Affiliations for Waterloo Region, 2011
Source: Statistics Canada, 2011 National Household Survey by Census Division
First Nation - single identity4,23062%
Métis - single identity2,12031%
Inuit - single identity220 3%
Aboriginal identitiesnot included elsewhere
185 3%Multiple Aboriginal
identities60 1%
Christian339,19567.9%
No religious affiliation122,49024.5%
Muslim18,9903.8%
Hindu 6,310 1.3%Buddhist 5,155 1%Sikh 3,810 0.8%Other 2,080 0.4%Jewish 1,465 0.3%
Traditional (Aboriginal)Spirituality 135 0.03%

www.regionofwaterloo.ca • [email protected] • 519-575-4400
ƒ
Catholicism was the most common Christian religion in Waterloo Region, with 142,700 followers, and 42 per cent of the Christian population. ‘Other Christian’ religions, which represents all those not listed in Figure 5, made up 19 per cent, while United Church make up approximately nine per cent. In comparison to Ontario, Waterloo Region’s Christian population is very similar, where notable differences include a lower Catholic population (Ontario – 49 per cent Catholic) and higher percentages of Lutherans (Ontario – 2 per cent) and Other Christians (Ontario – 15 per cent). The Region’s large German community and Mennonite population are possible explanations.
Figure 5: Christian Religions in Waterloo Region, 2011
Source: Statistics Canada, 2011 National Household Survey by Census Division
Aboriginal Ancestry – “Refers to whether a person reported ancestry associated with Aboriginal peoples of Canada in the ethnic origin question (Question 17).”
Aboriginal Identity – “Refers to whether the person reported being an Aboriginal person, that is, First Nations (North American Indian) Métis or Inuk (Inuit) and/or being a Registered or Treaty Indian (that is, registered under the Indian Act of Canada) and/or being a member of a First Nation or Indian band.” Aboriginal peoples of Canada are defined in the Constitution Act, 1982, section 35(2) as including the Indian, Inuit and Métis peoples of Canada.
Ethnic Origin – “Refers to the ethnic or cultural origins of the respondent’s ancestors.”
Religion – “Refers to the person’s self-identification as having a connection or affiliation with any religious denomination, group, body, sect, cult or other religiously defined community or system of belief. Religion is not limited to formal membership in a religious organization or group. Persons without a religious connection or affiliation can self-identify as atheist, agnostic or humanist, or can provide another applicable response.”
Private Household – “a person or group of persons who occupy a private dwelling and do not have a usual place of residence elsewhere in Canada.”
Visible Minority – “Refers to whether a person self identifies with a visible minority group as defined by the Employment Equity Act and, if so, the visible minority group to which the person belongs. The Employment Equity Act defines visible minorities as persons, other than Aboriginal peoples, who are non-Caucasian in race or non-white in colour.”
Source: Statistics Canada National Household Survey Dictionary, 2011
How to Source: The Regional Municipality of Waterloo. Ethnic Origins, Visible Minorities, Aboriginal People and Religion National Household Survey Bulletin. 2011 NHS Bulletin Series. Kitchener, Ontario. 2014.
For more information on how information was collected on ethnic origin for the National Household Survey please consult the Ethnic Origin Reference Guide: www12.statcan.gc.ca/nhs-enm/2011/ref/guides/99-010-x/99-010-x2011006-eng.pdf
For more information on how information was collected on visible minorities for the National Household Survey please consult the Visible Minority and Population Group Reference Guide: www12.statcan.gc.ca/nhs-enm/2011/ref/guides/99-010-x/99-010-x2011009-eng.pdf
For more information on how information was collected on Aboriginal People for the National Household Survey please consult the Aboriginal Peoples Reference Guide: www12.statcan.gc.ca/nhs-enm/2011/ref/guides/99-011-x/99-011-x2011006-eng.pdf
For more information on how information was collected on religion for the National Household Survey please consult the Religion Reference Guide: www12.statcan.gc.ca/nhs-enm/2011/ref/guides/99-010-x/99-010-x2011010-eng.pdf
For further information please contact:
Planning, Development and Legislative Services
Planning Research and Analytics www.regionofwaterloo.ca
519-575-4400 TTY: 519-575-4608
0
20,000
40,000
60,000
80,000
100,000
120,000
140,000
160,000
Cath
olic
Oth
er C
hris
tian
Uni
ted
Chur
ch
Luth
eran
Ang
lican
Pres
byte
rian
Chris
tian
Ort
hodo
x
Bap
tist
Pent
ecos
tal
42.1%
19.1%
9% 7.4% 7.1% 5.2% 3.8% 3.8% 2.7%