waterloo region industrial report | q1 2016
TRANSCRIPT
Research & Forecast Report
WATERLOO REGIONINDUSTRIAL First Quarter 2016

2 Research & Forecast Report | First Quarter 2016 | Waterloo Region / Industrial | Colliers International
Market Summaries
City of Cambridge ..........................................................................................................4 City of Kitchener ..................................................................................................... 5 City of Waterloo ...................................................................................................... 6
Glossary ............................................................................................................................... 7
Table of Contents

3 Research & Forecast Report | First Quarter 2016 | Waterloo Region / Industrial | Colliers International
Waterloo Region Market Overview
In the first quarter of 2016, year over year, leasing activity was down slightly with 190,000 square feet transacted compared to 201,000 square feet in Q1 2015. However, year over year transaction size was up. The average transaction size increased by 4,667 square feet from 11,166 square feet in Q1 2015 to 15,833 square feet in Q1 2016. This is a positive indicator that larger users are active in the market and absorbing space.
On a quarter over quarter basis, there was an increase of 38,000 square feet in the total area leased in Q1 2016 over the previous quarter and an increase in transaction size of approximately 2,000 square feet – a trend we expect will carry forward into the next two quarters.
Lease rates were up over the last quarter while operating expenses stayed flat. The weighted average asking rate increased by just $0.04 compared to Q1 2015 ($5.19 per square foot up from $5.15 per square foot) while Taxes, Maintenance and Insurance costs (TMI) remained virtually unchanged at $3.38 per square foot (compared to $3.36 per square foot in Q1 2015). Unweighted average rates, however, show a more dramatic increase: $5.47 per square foot up from $4.95 per square foot asking rents and $3.80 per square foot versus $3.52 per square foot for TMI.
Based on current market activity, we anticipate increased leasing activity in Q2 and Q3 with 30,000 to 50,000 square feet leased each quarter, and lower weighted average asking rates as better quality space is leased.
The low interest rates, relative ease of borrowing, and increased construction costs make the purchase of existing buildings attractive to industrial users, but desirable purchasing options are in short supply. While off-market purchases are
Market IndicatorsRelative to prior period
Waterloo RegionQ4 2015
Waterloo RegionQ1 2016 Trend
VACANCY 6.8% 6.65%
NET ABSORPTION -488,398 139,316
CONSTRUCTION 98,826 69,442
RENTAL RATE* $4.76 $4.83 Note: Construction is the change in Under Construction. * Rental rates for current quarter are asking weighted averages for all submarkets.
Source: Colliers International
Historical Performance & Forecast | Waterloo Region Industrial Market
(1,000,000)
(800,000)
(600,000)
(400,000)
(200,000)
0
200,000
400,000
600,000
800,000
0.0%
1.0%
2.0%
3.0%
4.0%
5.0%
6.0%
7.0%
8.0%
9.0%
20
10 Q
1
20
10 Q
2
20
10 Q
3
20
10 Q
4
20
11 Q
1
20
11 Q
2
20
11 Q
3
20
11 Q
4
20
12 Q
1
20
12 Q
2
20
12 Q
3
20
12 Q
4
20
13 Q
1
20
13 Q
2
20
13 Q
3
20
13 Q
4
20
14 Q
1
20
14 Q
2
20
14 Q
3
20
14 Q
4
20
15 Q
1
20
15 Q
2
20
15 Q
3
20
15 Q
4
20
16 Q
1
20
16 Q
2
20
16 Q
3
20
16 Q
4
20
17 Q
1
Net Absorption New Supply Vacancy Rate
usually 20% to 25% of the total sales per quarter, in Q1 2016, seven of the 11 user transactions over 5,000 square feet were achieved without mass marketing - opportunities are quickly seized.
Vacancy maintains a generally downward trend (6.65% versus the 6.80% rate in Q4 2015) and the Q1 2016 absorption is positive (139,000 square feet), mostly due to the occupancy of spaces where leases were done previously (for example, 102,000 square feet at 50 Groh Avenue and 45,000 square feet at 1250 Franklin Boulevard).
Investment Market
There were no industrial investment sales in Waterloo Region in Q1 2016. This is due to a lack of supply as industrial investments are still seen as extremely attractive to a wide range of active purchasers. We expect cap rates to remain within the 6.0% to 7% range indicated by the recent sale of 455 Silvercreek Parkway North in the neighboring Guelph market. The industrial investment market will be very active this year - the only limiting factor will be on the supply side.

4 Research & Forecast Report | First Quarter 2016 | Waterloo Region / Industrial | Colliers International
Notable Lease TransactionsTENANT NAME & ADDRESS TYPE APPROXIMATE
SIZE (SF)
1. Undisclosed111 Savage Drive Headlease 28,057
2. PNR Railworks1139 Industrial Road Headlease 19,231
3. Undisclosed1741 Bishop Street North Headlease 12,040
8
5
7
Notable Lease Notable Sale New Supply
City of CambridgeCambridge remains the most active of the Region’s industrial markets; with quick access to Highway 401, readily available serviced land and reasonable development charges, it will continue to grow and attract new investment. New speculative projects attract tenants seeking modern, efficient facilities while less functional, outdated buildings tend to find lease up more challenging. Construction activity has slowed as users seek out existing opportunities and developers sit on the sidelines, waiting for signs of improvement. Purchase options are in demand, however the availability of purchase inventory is the limiting factor.
Trends > Vacant inventory consists mostly of older Class B and C space while demand is strong for newer Class A space.
> New spec space will generate activity in 2016 with new options for tenants seeking high quality, functional and efficient space.
> Sale activity remains strong as low interest rates and financing availability encourage users to purchase.
Summary Statistics Cambridge Industrial Market 2015 Q4 2016 Q1 Trend
Industrial Inventory 31,506,914 31,589,735
Net Absorption -130,620 139,869
Vacancy Rate 5.65% 5.36%
Average Asking Net Rent(Per Square Foot) $4.85 $4.91
Historical Performance and Forecast
(600,000)
(400,000)
(200,000)
0
200,000
400,000
600,000
800,000
0.0%
1.0%
2.0%
3.0%
4.0%
5.0%
6.0%
7.0%
8.0%
9.0%
10.0%
20
10 Q
1
20
10 Q
2
20
10 Q
3
20
10 Q
4
20
11 Q
1
20
11 Q
2
20
11 Q
3
20
11 Q
4
20
12 Q
1
20
12 Q
2
20
12 Q
3
20
12 Q
4
20
13 Q
1
20
13 Q
2
20
13 Q
3
20
13 Q
4
20
14 Q
1
20
14 Q
2
20
14 Q
3
20
14 Q
4
20
15 Q
1
20
15 Q
2
20
15 Q
3
20
15 Q
4
20
16 Q
1
20
16 Q
2
20
16 Q
3
20
16 Q
4
20
17 Q
1
Net Absorption New Supply Vacancy Rate
Notable Sale TransactionsPURCHASER & ADDRESS PRICE APPROXIMATE
SIZE (SF)
4. 110 Vondrau Drive $4,830,000 40,176
5. 1680 Bishop Street North $3,000,000 38,250
6. 85 Thompson Drive $1,525,000 13,995
Upcoming New InventoryADDRESS COMPLETION APPROXIMATE
SIZE (SF)
7. 45 Commerce Court Q1/Q2 2016 43,290
8. 75 Heroux Devtek Drive Q2/Q3 2016 20,582
1
4
23
6

5 Research & Forecast Report | First Quarter 2016 | Waterloo Region / Industrial | Colliers International
Notable Lease TransactionsTENANT NAME & ADDRESS TYPE APPROXIMATE
SIZE (SF)
1. 1070 Guelph Street Headlease 25,000
2. 45 Goodrich Drive Headlease 20,435
3. Carehawk780 Wilson Avenue Headlease 18,483
Notable Lease Notable Sale New Supply
City of KitchenerKitchener’s industrial market activity continues to be restrained by the lack of quality Class A space available to both tenants and prospective buyers. Most available options comprise older Class B and C space, or buildings that are poorly sized for demand requirements. Industrial users actively seek opportunities in the neighbouring City of Cambridge due to its superior Highway 401 proximity.
Trends > Much of the available space is functionally challenged or obsolete; these facilities present opportunties for redevelopment or adaptive reuse to gain tenancies.
> Downward pressure on lease rates is a result of functionally challenged buildings attempting to attract tenants through lower lease rates.
> Industrial growth in Kitchener remains stagnant due to the lack of developed industrial land. The City of Kitchener is the primary land developer.
> Blue Top Properties’ new spec development at Wilson Avenue and Goodrich Drive brings much-needed Class A space to Kitchener; the project has seen great success with over 75% of space now leased.
Summary Statistics Kitchener Industrial Market 2015 Q4 2016 Q1 Trend
Industrial Inventory 19,636,168 19,632,633
Net Absorption -400,372 23,292
Vacancy Rate 10.09% 9.95%
Average Asking Net Rent(Per Square Foot) $4.37 $4.37
Historical Performance and Forecast
(1,000,000)
(800,000)
(600,000)
(400,000)
(200,000)
0
200,000
400,000
0.0%
2.0%
4.0%
6.0%
8.0%
10.0%
12.0%
20
10 Q
1
20
10 Q
2
20
10 Q
3
20
10 Q
4
20
11 Q
1
20
11 Q
2
20
11 Q
3
20
11 Q
4
20
12 Q
1
20
12 Q
2
20
12 Q
3
20
12 Q
4
20
13 Q
1
20
13 Q
2
20
13 Q
3
20
13 Q
4
20
14 Q
1
20
14 Q
2
20
14 Q
3
20
14 Q
4
20
15 Q
1
20
15 Q
2
20
15 Q
3
20
15 Q
4
20
16 Q
1
20
16 Q
2
20
16 Q
3
20
16 Q
4
20
17 Q
1
Net Absorption New Supply Vacancy Rate
Notable Sale TransactionsPURCHASER & ADDRESS PRICE APPROXIMATE
SIZE (SF)
None
Upcoming New InventoryADDRESS COMPLETION APPROXIMATE
SIZE (SF)
4. For Lease45 Goodrich Drive Q2/Q3 2016 65,572
1
32&4
6 Research & Forecast Report | First Quarter 2016 | Waterloo Region / Industrial | Colliers International
Notable Lease Notable Sale New Supply
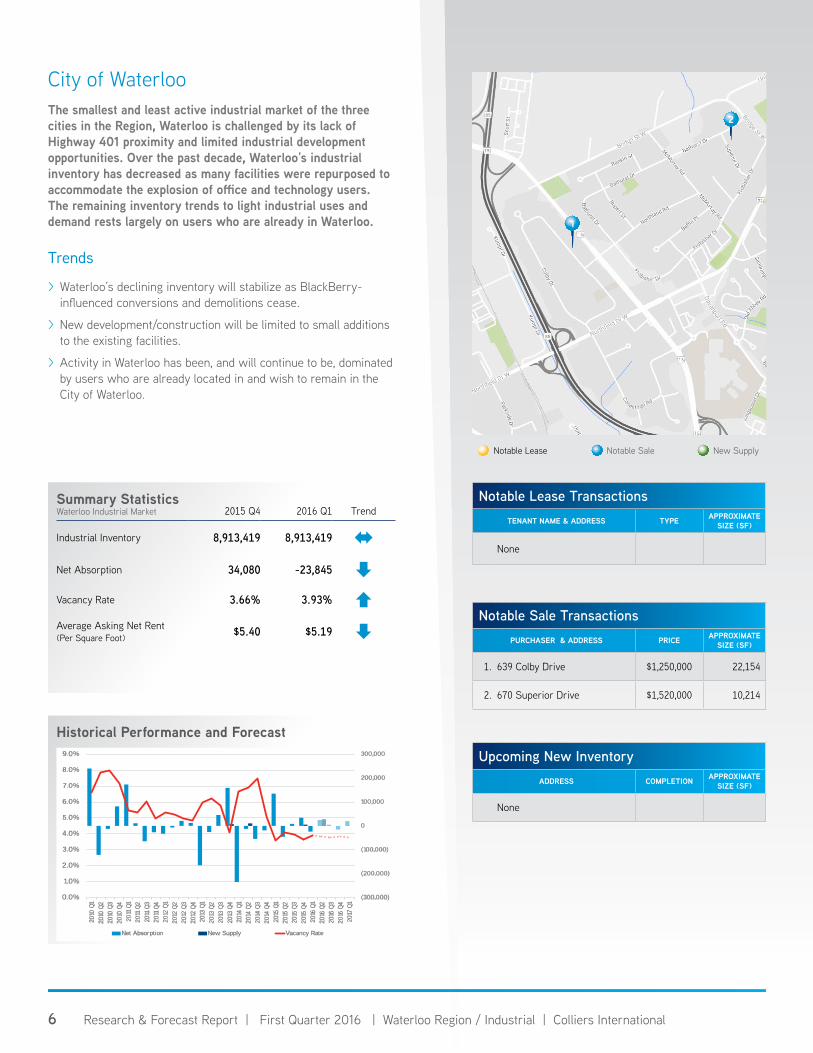
City of WaterlooThe smallest and least active industrial market of the three cities in the Region, Waterloo is challenged by its lack of Highway 401 proximity and limited industrial development opportunities. Over the past decade, Waterloo’s industrial inventory has decreased as many facilities were repurposed to accommodate the explosion of office and technology users. The remaining inventory trends to light industrial uses and demand rests largely on users who are already in Waterloo.
Trends
> Waterloo’s declining inventory will stabilize as BlackBerry-influenced conversions and demolitions cease.
> New development/construction will be limited to small additions to the existing facilities.
> Activity in Waterloo has been, and will continue to be, dominated by users who are already located in and wish to remain in the City of Waterloo.
Summary Statistics Waterloo Industrial Market 2015 Q4 2016 Q1 Trend
Industrial Inventory 8,913,419 8,913,419
Net Absorption 34,080 -23,845
Vacancy Rate 3.66% 3.93%
Average Asking Net Rent(Per Square Foot) $5.40 $5.19
Historical Performance and Forecast
(300,000)
(200,000)
(100,000)
0
100,000
200,000
300,000
0.0%
1.0%
2.0%
3.0%
4.0%
5.0%
6.0%
7.0%
8.0%
9.0%
20
10 Q
1
20
10 Q
2
20
10 Q
3
20
10 Q
4
20
11 Q
1
20
11 Q
2
20
11 Q
3
20
11 Q
4
20
12 Q
1
20
12 Q
2
20
12 Q
3
20
12 Q
4
20
13 Q
1
20
13 Q
2
20
13 Q
3
20
13 Q
4
20
14 Q
1
20
14 Q
2
20
14 Q
3
20
14 Q
4
20
15 Q
1
20
15 Q
2
20
15 Q
3
20
15 Q
4
20
16 Q
1
20
16 Q
2
20
16 Q
3
20
16 Q
4
20
17 Q
1
Net Absorption New Supply Vacancy Rate
Notable Lease TransactionsTENANT NAME & ADDRESS TYPE APPROXIMATE
SIZE (SF)
None
Notable Sale TransactionsPURCHASER & ADDRESS PRICE APPROXIMATE
SIZE (SF)
1. 639 Colby Drive $1,250,000 22,154
2. 670 Superior Drive $1,520,000 10,214
Upcoming New InventoryADDRESS COMPLETION APPROXIMATE
SIZE (SF)
None
2
1

7 Research & Forecast Report | First Quarter 2016 | Waterloo Region / Industrial | Colliers International
Glossary
Weighted Average Asking Net Rent The dollar amount requested by landlords for direct available space, not including subleases, expressed in dollars per square foot per year.
Availability The amount of available space and available space to be delivered to the market within six months, divided by the market’s inventory base including those future deliveries. Available space is space that is available for lease, and may or may not be vacant.
Net Absorption The net change in physically occupied space between the current measurement period, and the last measurement period. It can be either positive or negative.
Vacancy The amount of vacant space divided by the building inventory base. Vacant space is physically unoccupied, and it may or may not be available for lease or sublease. This is physical vacancy. It is not determined whether a tenant is paying rent on the space.

Copyright © 2016 Colliers International.
The information contained herein has been obtained from sources deemed reliable. While every reasonable effort has been made to ensure its accuracy, we cannot guarantee it. No responsibility is assumed for any inaccuracies. Readers are encouraged to consult their professional advisors prior to acting on any of the material contained in this report.
About Colliers International Group Inc.Colliers International Group Inc. is a global leader in commercial real estate services, with more than 16,300 professionals operating out of 502 offices in 67 countries. Colliers International delivers a full range of services to real estate occupiers, owners and investors worldwide, including global corporate solutions, brokerage, property and asset management, hotel investment sales and consulting, valuation, consulting and appraisal services, mortgage banking and insightful research. In 2014 the firm handled $97 billion in total transaction value for 84,600 leases and sales. Colliers manages more than 1.7 billion square feet of commercial properties.
Colliers International Group Inc. generates more than US$2.3 billion in annual revenues. With significant insider ownership and an experienced management team, Colliers International has a long-term track record of creating value and superior returns for shareholders – previously under the ownership of FirstService, and as of June 2015, continuously as an independently owned company. The common shares of Colliers International Group Inc. trade on the NASDAQ under the symbol “CIGI” and on the Toronto Stock Exchange under the symbol “CIG”.
collierscanada.com
502 offices in 67 countries on 6 continentsUnited States: 140 Canada: 31 Latin America: 24 Asia Pacific: 199 EMEA: 108
$2.3billion in annual revenue
1.7billion square feet under management
16,300professionals and staff
MARKET CONTACT:Serguei Kaminski Market Intelligence Coordinator | Waterloo Region+1 519 904 [email protected]
REGIONAL AUTHORS:Karl Innanen | Managing Director, BrokerRon Jansen | Vice President, Sales RepresentativeSerguei Kaminski | Market Intellience CoordinatorJennie Ross | Client Project Coordinator
Colliers International | Waterloo Region305 King Street West, Suite 606Kitchener, ON N2G 1B9 | Canada
+1 519 570 1330