q1 2016 presentation - telia company · • estonia impacted by higher marketing costs ... •...
TRANSCRIPT
1
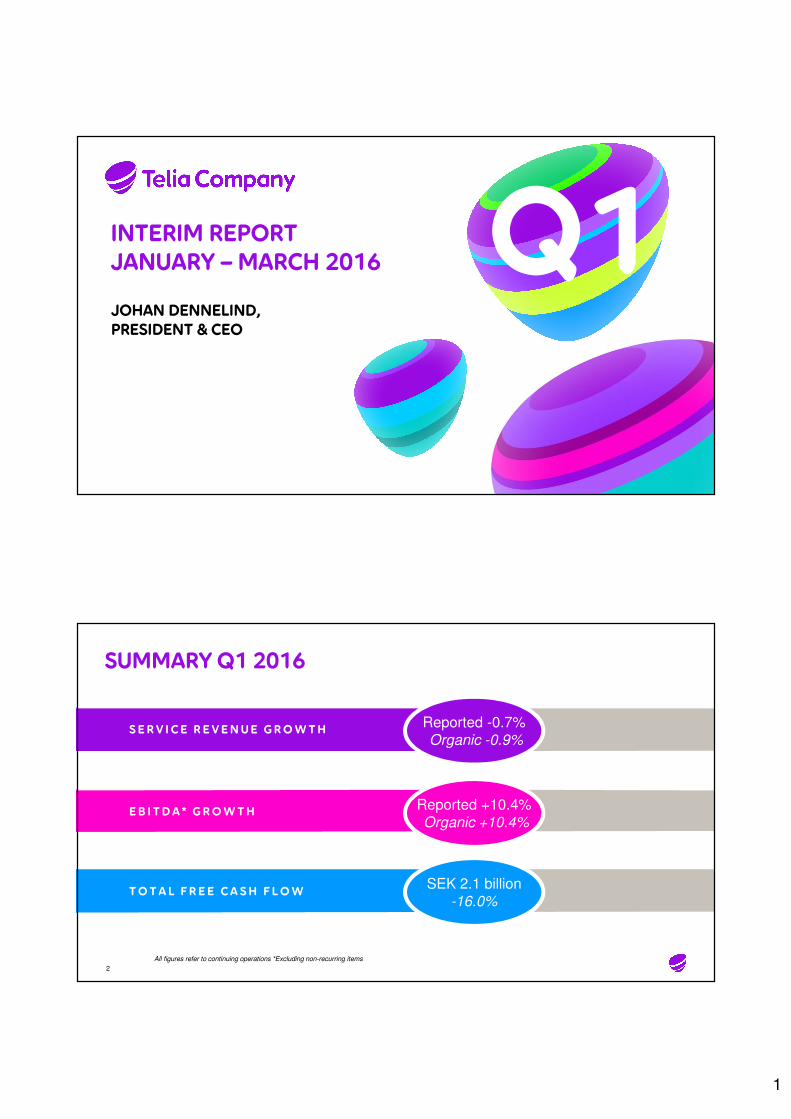
JOHAN DENNELIND,
PRESIDENT & CEO
INTERIM REPORT
JANUARY – MARCH 2016 Q1
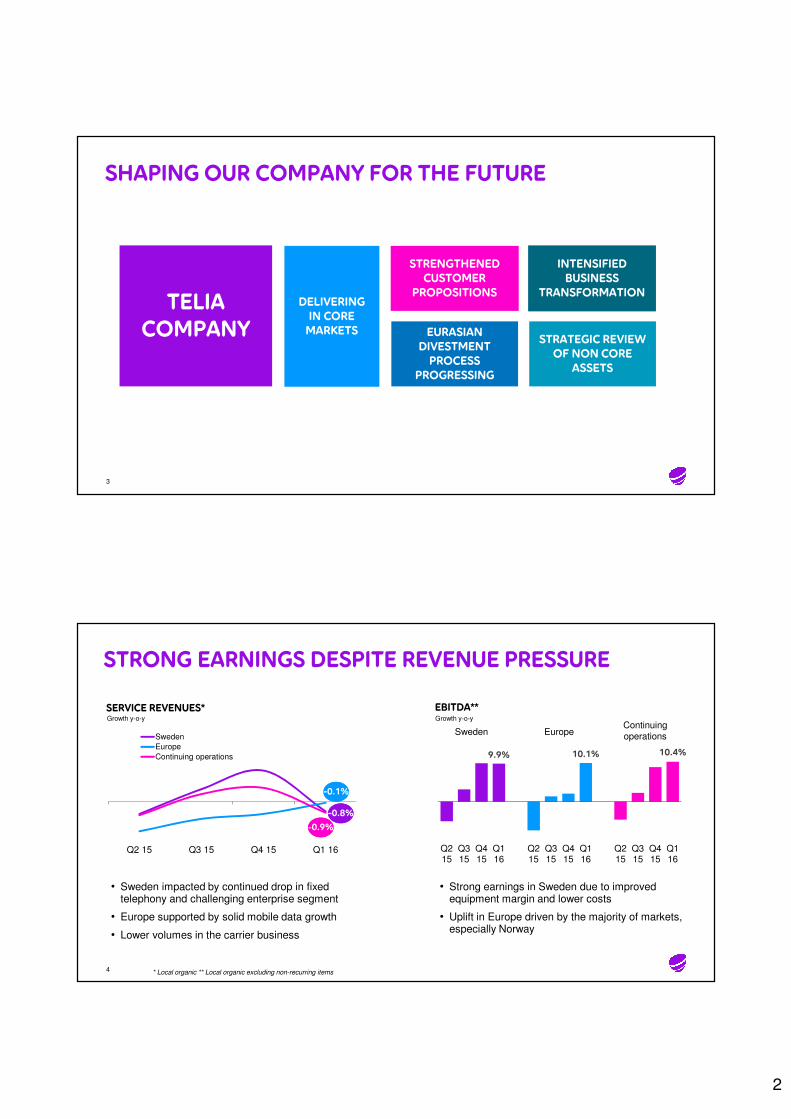
SUMMARY Q1 2016
2
S E RV I C E R E VENUE GROWTH
EB I TDA * G ROWTH
TOTA L F R E E CA SH F LOW
Reported -0.7%Organic -0.9%
Reported +10.4%Organic +10.4%
SEK 2.1 billion-16.0%
All figures refer to continuing operations *Excluding non-recurring items
2
SHAPING OUR COMPANY FOR THE FUTURE
3
TELIA
COMPANYSTRATEGIC REVIEW
OF NON CORE
ASSETS
INTENSIFIED
BUSINESS
TRANSFORMATION
EURASIAN
DIVESTMENT
PROCESS
PROGRESSING
STRENGTHENED
CUSTOMER
PROPOSITIONSDELIVERING
IN CORE
MARKETS
9.9% 10.1% 10.4%
Q215
Q315
Q415
Q116
Q215
Q315
Q415
Q116
Q215
Q315
Q415
Q116
4
Sweden EuropeContinuing
operations
Q2 15 Q3 15 Q4 15 Q1 16
Sweden
Europe
Continuing operations
* Local organic ** Local organic excluding non-recurring items
• Sweden impacted by continued drop in fixed telephony and challenging enterprise segment
• Europe supported by solid mobile data growth
• Lower volumes in the carrier business
• Strong earnings in Sweden due to improved equipment margin and lower costs
• Uplift in Europe driven by the majority of markets, especially Norway
STRONG EARNINGS DESPITE REVENUE PRESSURE
SERVICE REVENUES* EBITDA**Growth y-o-y Growth y-o-y
-0.8%-0.8%
-0.9%-0.9%
-0.1%-0.1%
3
Q1 15 Q2 15 Q3 15 Q4 15 Q1 16
Telia connected (MDUs + SDUs)Communication operatorTelia passed, not connected
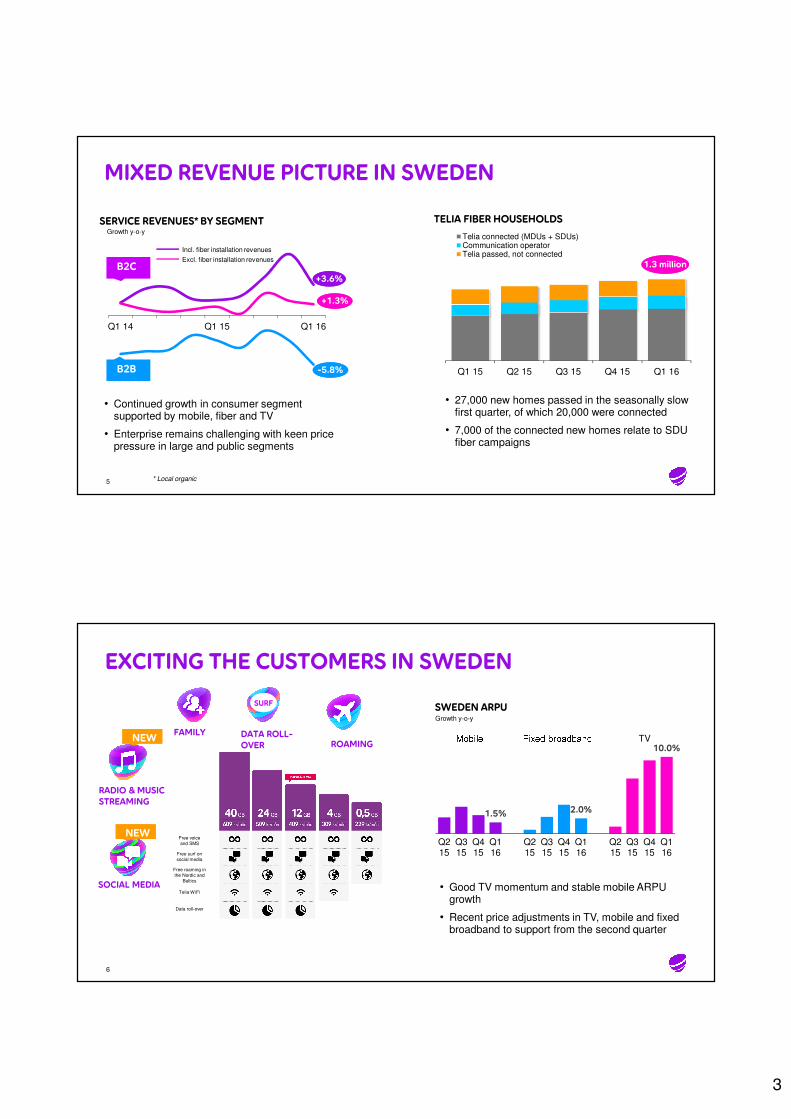
MIXED REVENUE PICTURE IN SWEDEN
5
Q1 14 Q1 15 Q1 16
+1.3%+1.3%
-5.8%-5.8%
+3.6%+3.6%
B2B
B2C
• Continued growth in consumer segment supported by mobile, fiber and TV
• Enterprise remains challenging with keen price pressure in large and public segments
SERVICE REVENUES* BY SEGMENT
* Local organic
Excl. fiber installation revenues
Incl. fiber installation revenues
1.3 million1.3 million
TELIA FIBER HOUSEHOLDS
• 27,000 new homes passed in the seasonally slow first quarter, of which 20,000 were connected
• 7,000 of the connected new homes relate to SDU fiber campaigns
Growth y-o-y
EXCITING THE CUSTOMERS IN SWEDEN
6
SWEDEN ARPU
1.5% 2.0%
10.0%
Q215
Q315
Q415
Q116
Q215
Q315
Q415
Q116
Q215
Q315
Q415
Q116
TV
• Good TV momentum and stable mobile ARPU growth
• Recent price adjustments in TV, mobile and fixed broadband to support from the second quarter
Growth y-o-y
FAMILY DATA ROLL-
OVER ROAMING
SOCIAL MEDIA
RADIO & MUSIC
STREAMING
SURF
NEW
Free voice
and SMS
Free surf on
social media
Free roaming in
the Nordic and
Baltics
Telia WiFi
Data roll-over
NEW
4
2,767 2,740
Q1 15 Q1 16
-0.4%-0.4%
4.0%
0.9%
Q1 15 Q2 15 Q3 15 Q4 15 Q1 16
Billed revenues
Mobile service revenues
IMPROVED BILLED REVENUE GROWTH IN FINLAND
• Growth in mobile billed revenues intact supported by B2C
7
• Service revenues impacted by lower fixed and interconnect revenues
• Mobile billed revenue growth and reduced operating expenses behind EBITDA uplift
* External service revenues **Excluding non-recurring items
972 1,016
Q1 15 Q1 16
+5.2%+5.2%
Service revenues EBITDA
= Local organic growth
MOBILE SERVICE REVENUES*SERVICE REVENUES* & EBITDA**SEK million Organic growth y-o-y
1,693 1,724
Q1 15 Q1 16
SYNERGY TARGET REACHED IN NORWAY
• Lower interconnect revenues behind negative organic service revenue growth
• Successful rebranding to Telia
8
• EBITDA excluding FX impact increased by close to SEK 240 million, the full year run-rate synergy target of SEK 1 billion reached
• Negative impact on reported EBITDA from a close to 10 percent weakening of NOK
-2.9%-2.9%
* External service revenues **Excluding non-recurring items = Local organic growth
665238
486
FXimpact
Increase in stable FX
Q1 15reported
-59
Q1 16reported
SERVICE REVENUES* EBITDA**SEK million SEK million, reported
5
9
196 181
244277
127 135
-10%
-5%
0%
5%
Q1 15 Q2 15 Q3 15 Q4 15 Q1 16
Estonia Lithuania Latvia
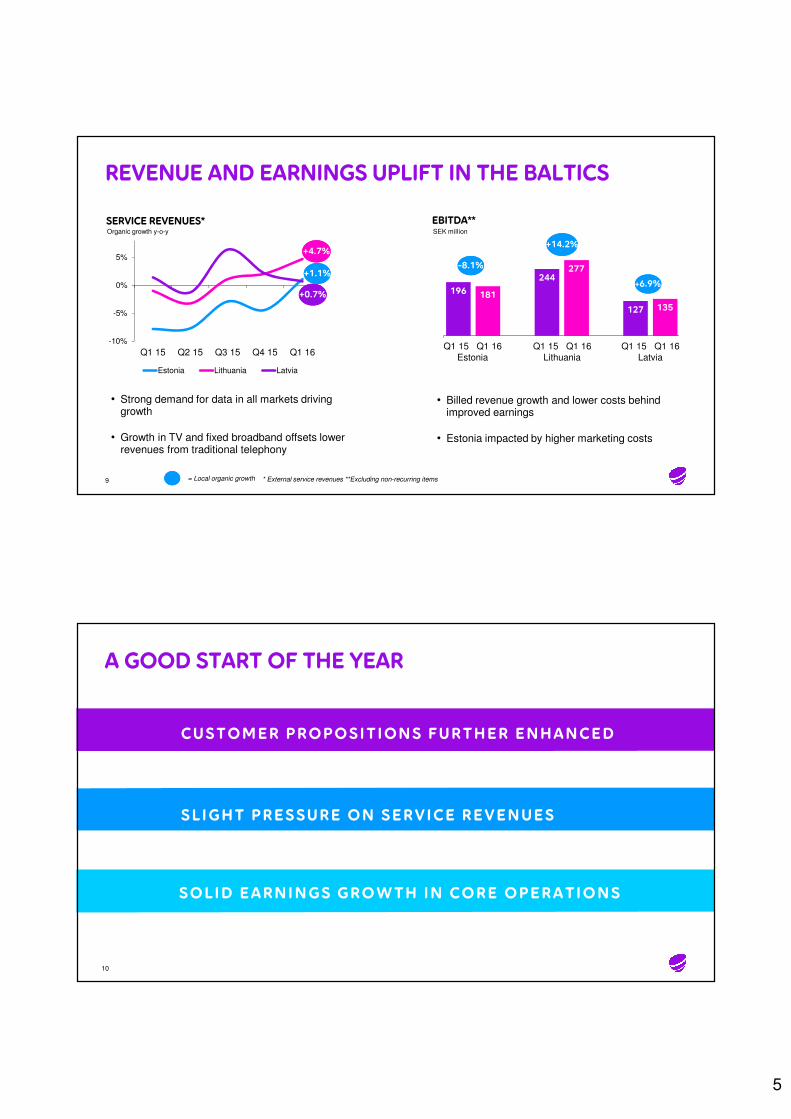
• Strong demand for data in all markets driving growth
• Growth in TV and fixed broadband offsets lower revenues from traditional telephony
Q1 15 Q1 16
Lithuania
Q1 15 Q1 16
Latvia
+14.2%+14.2%
Q1 15 Q1 16
Estonia
• Billed revenue growth and lower costs behind improved earnings
• Estonia impacted by higher marketing costs
* External service revenues **Excluding non-recurring items = Local organic growth
REVENUE AND EARNINGS UPLIFT IN THE BALTICS
EBITDA**
-8.1%-8.1%
+6.9%+6.9%
Organic growth y-o-y
SERVICE REVENUES*SEK million
+0.7%+0.7%
+4.7%+4.7%
+1.1%+1.1%
A GOOD START OF THE YEAR
10
CUSTOMER PROPOSIT IONS FURTHER ENHANCED
SL IGHT PRESSURE ON SERV ICE REVENUES
SOLID EARNINGS GROWTH IN CORE OPERATIONS

6
SAVE THE DATE JUNE 21, 2016
11
ANALYST AND INVESTOR BRIEFING IN STOCKHOLM - FOCUS ON TELIA SWEDEN
CHRISTIAN LUIGA,
SENIOR VICE PRESIDENT & CFO
INTERIM REPORT
JANUARY – MARCH 2016 Q1

7
NET SALES DECLINE DUE TO FIXED AND EQUIPMENT
NET SALES* EQUIPMENT SALES**
* Local organic ** Reported currency
• Mobile growth impacted by lower interconnect
• Traditional telephony decline only partly compensated by fiber installation revenues, TV and fixed broadband
EquipmentOtherservice
revenues
Fixedservice
revenues
Mobile service
revenues
Q1 15
-1.1%
Q1 16-40%
-20%
0%
20%
40%
Q1 14 Q1 15 Q1 16
Sweden Europe
• Equipment sales decline in Sweden due to lack of major handset releases
• Still equipment sales growth in Europe due to successful Christmas campaign in Spain and continued strong growth in Latvia
Growth y-o-y Growth y-o-y
13
EBITDA GROWTH SUPPORTED BY LOWER COSTS
14
EBITDA*Growth y-o-y
OtherEurope Q1 16SwedenQ1 15
+10.4%
• Sweden supported by improved sales mix together with lower resource and field maintenance costs
• Improvements in Europe driven by Norway and reduced resource costs in the Nordics
10.4%
Q1 15 Q2 15 Q3 15 Q4 15 Q1 16
EBITDA*Growth y-o-y
• Comparisons to become gradually tougher throughout the year
• Main challenges remains the B2B segment primarily in Sweden and Finland
* Local organic, excluding non-recurring items
8
15
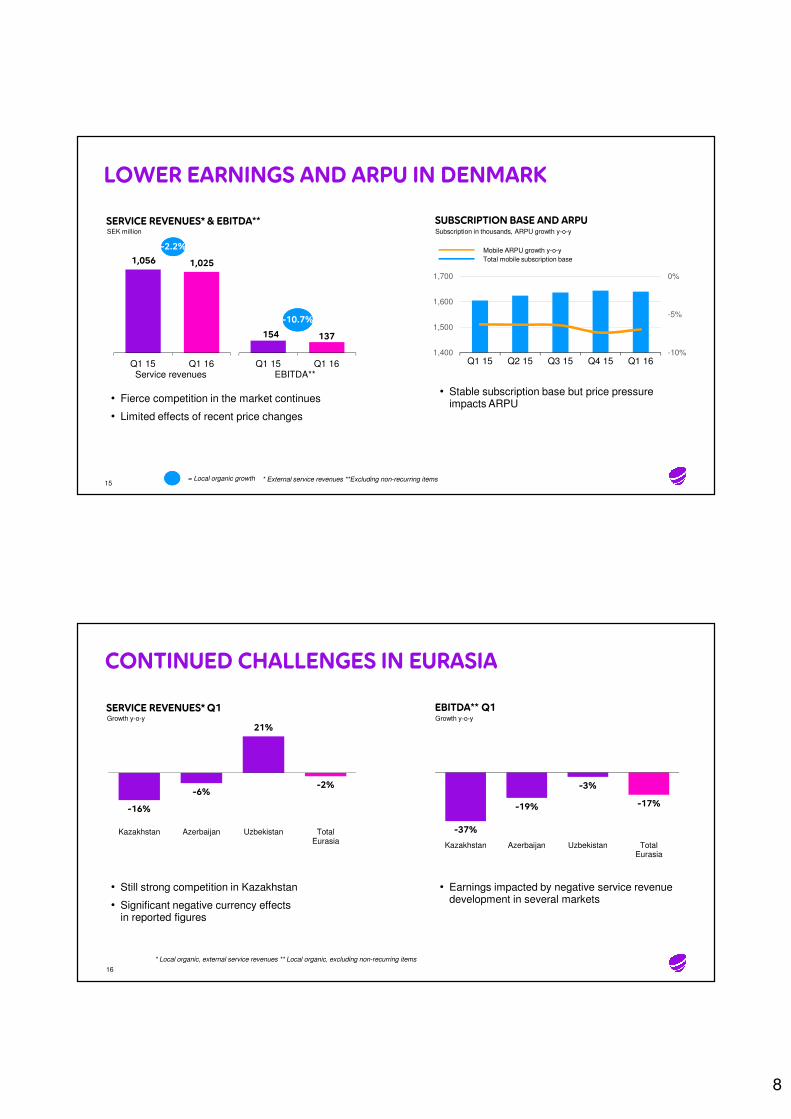
1,056 1,025
Q1 15 Q1 16
-2.2%-2.2%
154 137
Q1 15 Q1 16
-10.7%-10.7%
Service revenues EBITDA**
-10%
-5%
0%
1,400
1,500
1,600
1,700
Q1 15 Q2 15 Q3 15 Q4 15 Q1 16
• Fierce competition in the market continues
• Limited effects of recent price changes
Mobile ARPU growth y-o-y
Total mobile subscription base
• Stable subscription base but price pressure impacts ARPU
LOWER EARNINGS AND ARPU IN DENMARK
SUBSCRIPTION BASE AND ARPUSERVICE REVENUES* & EBITDA**SEK million Subscription in thousands, ARPU growth y-o-y
* External service revenues **Excluding non-recurring items = Local organic growth
CONTINUED CHALLENGES IN EURASIA
• Still strong competition in Kazakhstan
• Significant negative currency effects in reported figures
-16%
-6%
21%
-2%
Kazakhstan Azerbaijan Uzbekistan TotalEurasia
16
* Local organic, external service revenues ** Local organic, excluding non-recurring items
• Earnings impacted by negative service revenue development in several markets
-37%
-19%
-3%
-17%
Kazakhstan Azerbaijan Uzbekistan TotalEurasia
SERVICE REVENUES* Q1 EBITDA** Q1Growth y-o-y Growth y-o-y
9
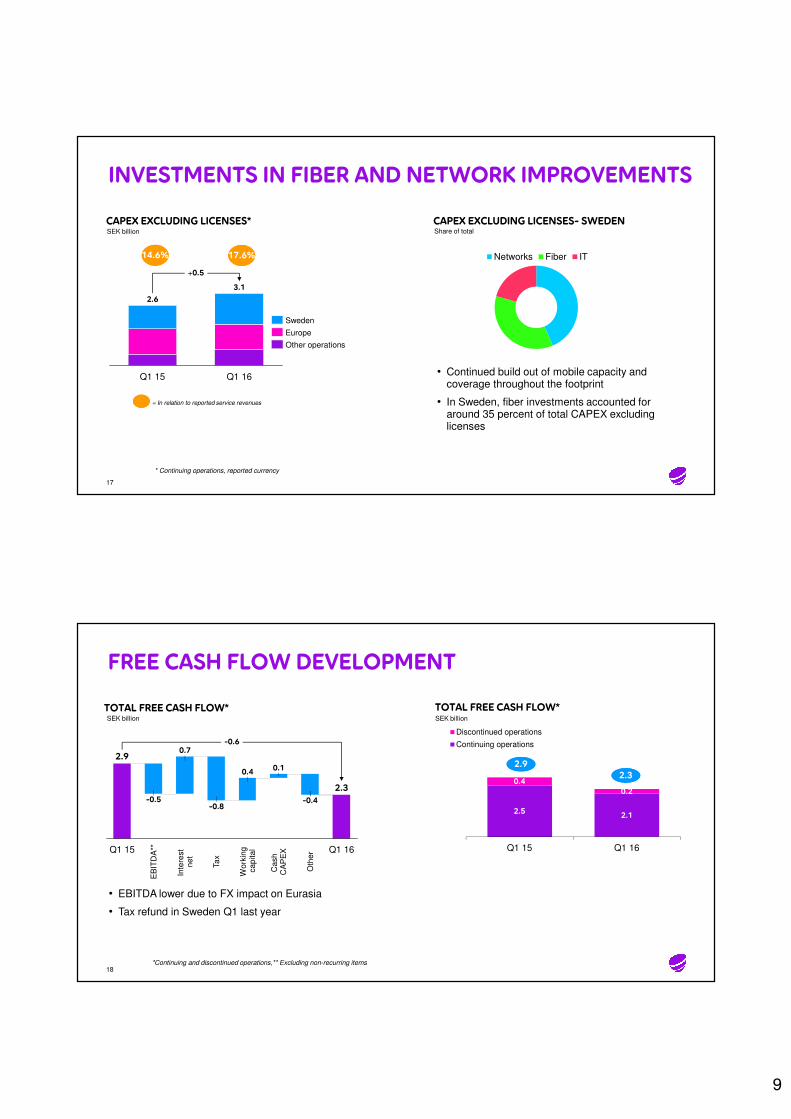
INVESTMENTS IN FIBER AND NETWORK IMPROVEMENTS
17
2.6
3.1
Q1 16
+0.5
Q1 15
Other operations
Europe
Sweden
• Continued build out of mobile capacity and coverage throughout the footprint
• In Sweden, fiber investments accounted for around 35 percent of total CAPEX excluding licenses
= In relation to reported service revenues
CAPEX EXCLUDING LICENSES*SEK billion
14.6%14.6% 17.6%17.6%
* Continuing operations, reported currency
Networks Fiber IT
CAPEX EXCLUDING LICENSES- SWEDENShare of total
FREE CASH FLOW DEVELOPMENT
• EBITDA lower due to FX impact on Eurasia
• Tax refund in Sweden Q1 last year
*Continuing and discontinued operations,** Excluding non-recurring items 18
-0.4
Oth
er
0.1
Wo
rkin
gca
pita
l
0.4
Ta
x
-0.8
Inte
rest
ne
t
0.7
EB
ITD
A**
-0.5
Q1 15
2.9
Q1 16
2.3
Ca
sh
C
AP
EX
-0.6
2.52.1
0.4
0.2
Q1 15 Q1 16
Discontinued operations
Continuing operations
2.32.3
2.92.9
TOTAL FREE CASH FLOW* TOTAL FREE CASH FLOW*SEK billion SEK billion
10
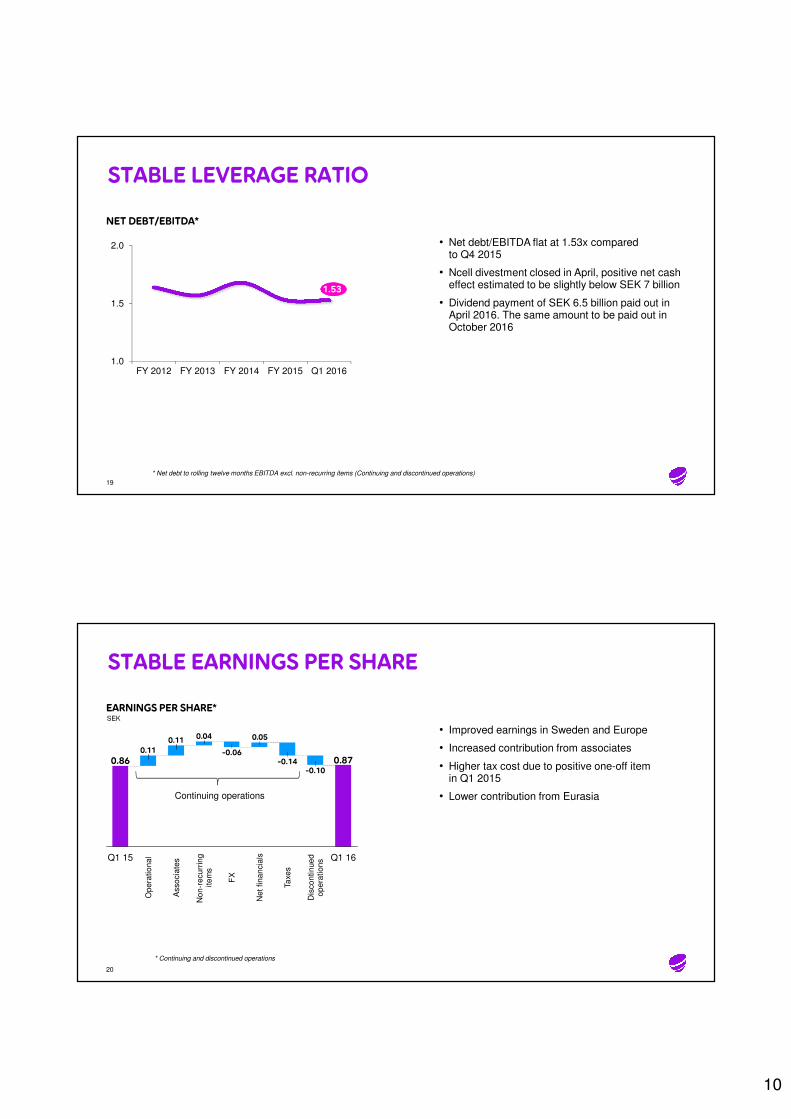
STABLE LEVERAGE RATIO
19
* Net debt to rolling twelve months EBITDA excl. non-recurring items (Continuing and discontinued operations)
• Net debt/EBITDA flat at 1.53x compared to Q4 2015
• Ncell divestment closed in April, positive net cash effect estimated to be slightly below SEK 7 billion
• Dividend payment of SEK 6.5 billion paid out in April 2016. The same amount to be paid out in October 2016
NET DEBT/EBITDA*
1.53
1.0
1.5
2.0
FY 2012 FY 2013 FY 2014 FY 2015 Q1 2016
STABLE EARNINGS PER SHARE
20
0.050.040.11
0.11
0.870.86
Dis
co
ntin
ue
do
pe
ratio
ns
-0.10
Ta
xe
s
-0.14
Ne
t fin
an
cia
ls
FX
-0.06
No
n-r
ecu
rrin
g
ite
ms
Asso
cia
tes Q1 16
Op
era
tio
nalQ1 15
* Continuing and discontinued operations
Continuing operations
• Improved earnings in Sweden and Europe
• Increased contribution from associates
• Higher tax cost due to positive one-off item in Q1 2015
• Lower contribution from Eurasia
EARNINGS PER SHARE*SEK
11
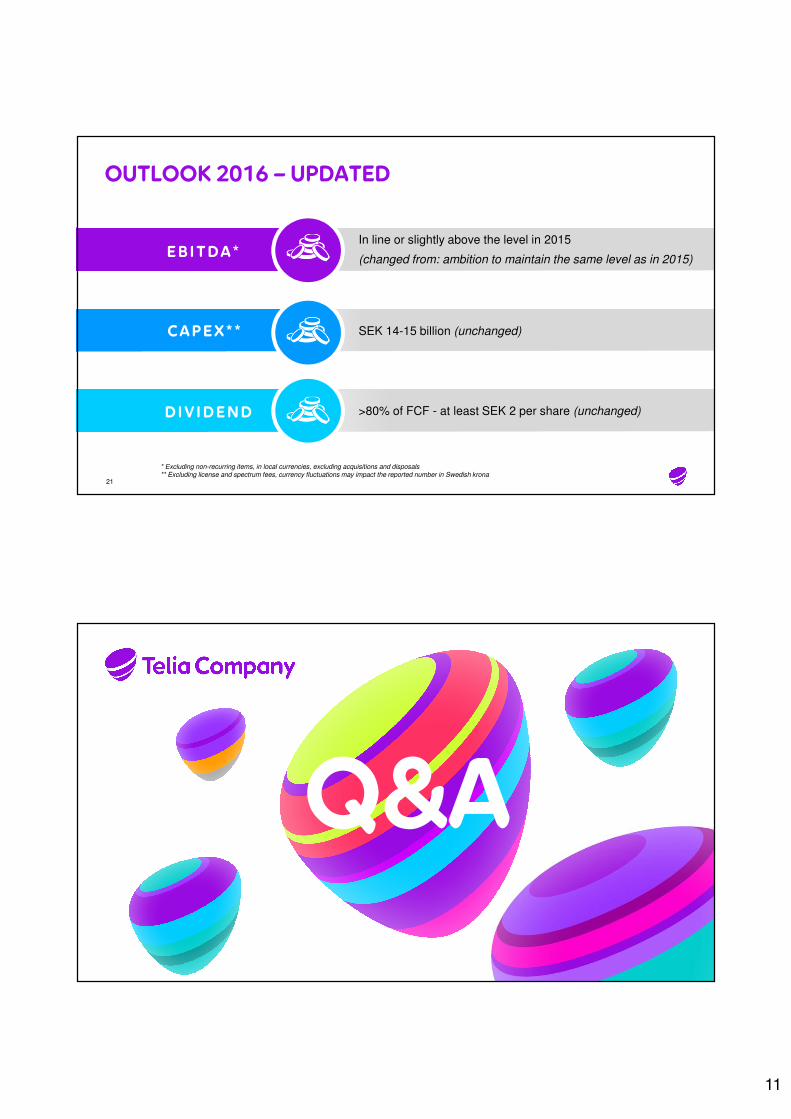
OUTLOOK 2016 – UPDATED
* Excluding non-recurring items, in local currencies, excluding acquisitions and disposals** Excluding license and spectrum fees, currency fluctuations may impact the reported number in Swedish krona
21
In line or slightly above the level in 2015
(changed from: ambition to maintain the same level as in 2015)EB ITDA *
SEK 14-15 billion (unchanged)
>80% of FCF - at least SEK 2 per share (unchanged)
CAPEX * *
DIV IDEND
Q&A
12
DEBT MATURITY SCHEDULE MMO
0
1
2
3
4
5
6
7
8
Apr-16
May-16
Jun-16
Jul-16
Aug-16
Sep-16
Oct-16
Nov-16
Dec-16
Jan-17
Feb-17
Mar-17
0
2
4
6
8
10
12
14
16
18
2016 2019 2022 2025 2028 2031 2034 2037 2040 2043 2046 2049 2052 2055 2058 2061 2064
23
DEBT MATURING NEXT 12 MONTHS
DEBT PORTFOLIO MATURITY SCHEDULE – 2016 AND ONWARDS
SEK billion
SEK billion
FINANCIAL SUMMARY Q1 2016
24
* Excluding non-recurring items
Q1 2016 Q1 2015 CHANGE (%)
Net sales (SEK million) 20,394 20,589 -0.9
Change local organic (%) -1.1
Service revenues (SEK million) 17,434 17,548 -0.7
Change local organic (%) -0.9
EBITDA* (SEK million) 6,217 5,632 +10.4
Change local organic (%) +10.4
EBITDA* Margin (%) 30.5 27.4 +3.1pp
Total EPS (SEK) 0.87 0.86 +1.4
Total free cash flow (SEK million) 2,293 2,853 -19.6
13
25
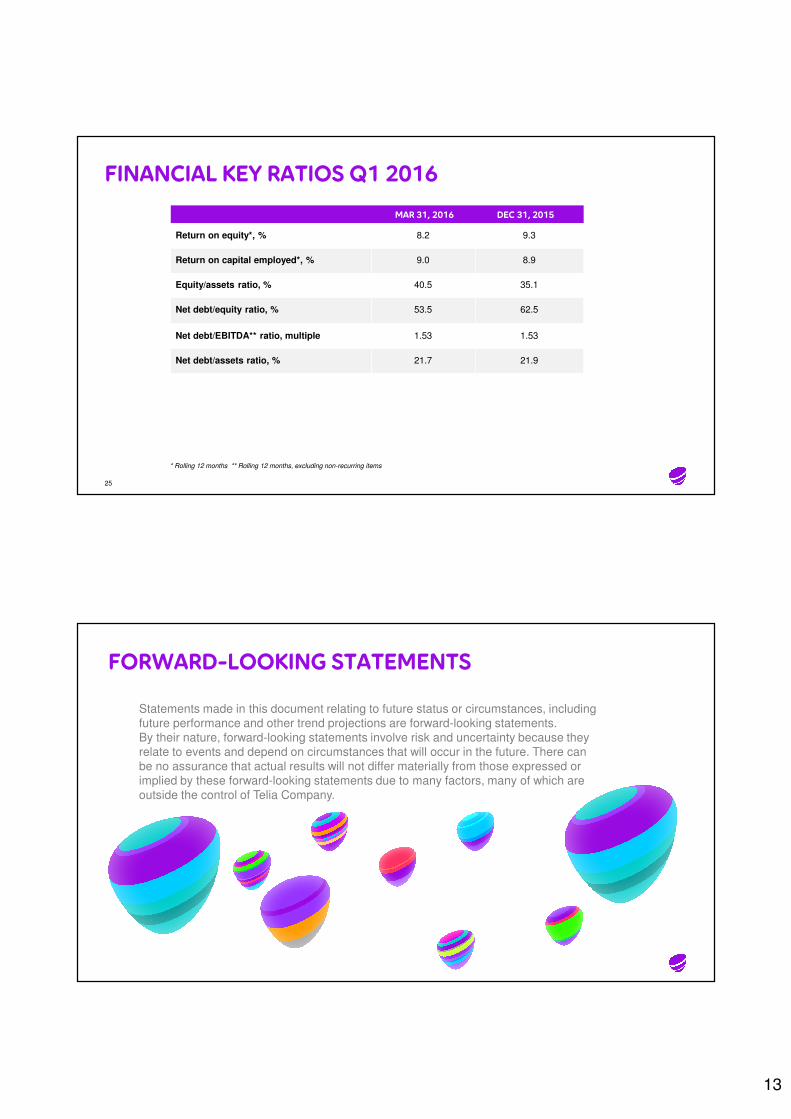
MAR 31, 2016 DEC 31, 2015
Return on equity*, % 8.2 9.3
Return on capital employed*, % 9.0 8.9
Equity/assets ratio, % 40.5 35.1
Net debt/equity ratio, % 53.5 62.5
Net debt/EBITDA** ratio, multiple 1.53 1.53
Net debt/assets ratio, % 21.7 21.9
* Rolling 12 months ** Rolling 12 months, excluding non-recurring items
FINANCIAL KEY RATIOS Q1 2016
FORWARD-LOOKING STATEMENTS
Statements made in this document relating to future status or circumstances, including
future performance and other trend projections are forward-looking statements.
By their nature, forward-looking statements involve risk and uncertainty because they
relate to events and depend on circumstances that will occur in the future. There can
be no assurance that actual results will not differ materially from those expressed or
implied by these forward-looking statements due to many factors, many of which are
outside the control of Telia Company.