puget sound watershed characterization project sound watershed characterization project: description...
TRANSCRIPT

Puget Sound Watershed Characterization Project:
Description of Methods, Models and Analysis
DRAFT FOR PEER REVIEW March 2010, Version 2
Ecology Publication #10-06-05
Written by: Stephen Stanley, Susan Grigsby, Tom Hruby, Patricia Olson Washington State Department of Ecology

Publication and Contact Information
If you need this publication in an alternate format, call the SEA Program Publications Coordinator, Jackie Chandler, at (360) 407-7291. Persons with hearing loss can call 711 for Washington Relay Service. Persons with a speech disability can call 877-833-6341.
Publications Coordinator Shorelands and Environmental Assistance Program P.O. Box 47600 Olympia, WA 98504-7600
E-mail: [email protected] Phone: (360) 407-7291 Refer to Publication #10-06-005 This work was funded in part by the U.S. Environmental Protection Agency - Aquatic Ecosystems Unit, Wetland Program Development Grant No.CE-9607-4401-0. Preferred citation:
(This page left intentionally blank.)
Stanley, S., S. Grigsby, T. Hruby, and P. Olson. 2009. Puget Sound Watershed
Characterization Project: Description of Methods, Models and Analysis. Washington
State Department of Ecology. Publication #10-06-005. Olympia, WA.


Puget Sound Characterization Project: Version 2 Methods, Models, and Analysis iv March 2010
Table of Contents
Table of Contents .......................................................................... iv
List of Figures ................................................................................ v
List of Tables ................................................................................. vi
Technical Team ............................................................................ vii
Acknowledgements ..................................................................... viii
Executive Summary ........................................................................ x
Definitions .................................................................................. xiv
Overview ...................................................................................... 1
Importance of Watershed Processes in Puget Sound .................................................. 1
Role of Ecosystem Processes: Process, Structure and Function ................................... 1
Major Threats to Ecosystem Processes and Habitats ................................................... 2
Using a Watershed Approach to Protect and Restore Ecosystem Processes and Habitats .................................................................................................................... 2
Methods for Mapping & Analyzing Watershed Processes ........................................... 3
Incorporating an Understanding of Watershed Processes into Planning .................... 4
Introduction to the Puget Sound Characterization Project ............. 6
Overview of the Basic Steps Used in this Approach ..................................................... 7
Step 1: Import the SSHIAP Analysis Units .................................................................... 9
Step 2: Develop Landscape Groups ........................................................................... 12
Step 3: Aggregate Units for Each Landscape Groups ................................................ 13
Step 4: Map ‘Important Areas’ and Rank Analysis units by Watershed Process ...... 15
Step 5: Map ‘Impairment Areas’ and Rank Analysis units by Watershed Process ... 20
Step 6: Identify Analysis units for Protection and Restoration and Recommended
Actions .................................................................................................................... 24
Incorporating Results into Existing Planning Efforts..................... 36
Framework for Planning.............................................................................................. 36
Birch Bay Watershed Management Plan .................................................................... 37
Using the Watershed Planning Framework with Existing State Planning Laws ......... 43
Other Approaches ....................................................................................................... 45
Influencing Human Behavior....................................................................................... 46

Puget Sound Characterization Project: Version 2 Methods, Models, and Analysis v March 2010
References .................................................................................. 48
Appendices
Appendix A: Overview of Appendices ………………………………………………A-1 Methods for Western Washington Watersheds for Assessment of the
Delivery, Movement, and Loss of: Appendix B: Water ………………………………………………………………..….B-1 The Following Appendices A through G will be completed during Phase II, 2010 to 2011. Appendix C: Nitrogen ……………………………………………………………..…C-1 Appendix D: Pathogens …………………………………………………………….D-1 Appendix E: Sediment ……………………………………………………………….E-1 Appendix F: Phosphorous & Toxins ……………………………………………F-1 Appendix G: Large Woody Debris ……………………………………………..G-1
Appendix H: GIS Methods ……………………………………………………………..H-1 Appendix I: Complete References …………………………………………………..I-1
List of Figures
Figure 1 – Diagram of Process, Structure, Function Relationship………………………………….. 1 Figure 2. Watershed Management Matrix ........................................................................ 4
Figure 3. WRIA Watersheds Analyzed by Puget Sound Characterization Project ........... 10
Figure 4. Imported SSHIAP units for WRIA ...................................................................... 11
Figure 5. Analysis Units for Thurston County. ................................................................. 13
Figure 6. Landscape Group (LG) for WRIA 11 and 13, Deschutes and Nisqually River Watersheds. ............................................................................................................... 14
Figure 7. Example of the Aggregation of SSHIAP Analysis units into Coastal Analysis Units. .......................................................................................................................... 14
Figure 9. Example of Important Areas for Delivery for WRIA 11 and 13, Thurston County. ....................................................................................................................... 17
Figure 10. Example of Important Areas for Storage Relative to Rain on Snow and Snow Dominated Ares. For WRIA 11 and 13, Thurston County. ......................................... 17
Figure 11. Example of Important Areas for Recharge For WRIA 11 and 13, Thurston County. ....................................................................................................................... 18
Figure 12. Example of Important Areas for Discharge For WRIA 11 and 13, Thurston County. ]HU_D] ......................................................................................................... 18
Figure 13. Example of Important Groundwater Discharge Areas Map for Coastal Landscape Group WRIA 13, Thurston County. .......................................................... 19

Puget Sound Characterization Project: Version 2 Methods, Models, and Analysis vi March 2010
Figure 14. Example of Overall Impairments Map for Water Flow Processes, WRIA 11 and 13, Thurston County for Water Process. The darkest pink areas are the most impaired. Results are in quantiles. ............................................................................. 21
Figure 15. Example of Impairments Map for Surface Water Storage for WRIA 11 and 13, Thurston County for Water Process ........................................................................... 21
Figure 16. Example of Imairments to Recharge Areas for WRIA 11 and 13, Thurston County ........................................................................................................................ 22
Figure 17. Example of Impairments to Discharge Areas for WRIA 11 and 13, Thurston County ........................................................................................................................ 23
Figure 18. Watershed Management Matrix. ................................................................... 25
Figure 19. Example of Restoration and Protection (All Components of Water Flow Model) ........................................................................................................................ 32
Figure 20. Example of Restoration and Protection (Surface Water Storage). ................. 33
Figure 21. Example of Restoration and Protection for Groundwater Recharge. ............ 34
Figure 24. Birch Bay Watershed ....................................................................................... 38
Figure 25. Birch Bay results of Assessment for the ......................................................... 39
Figure 26. Watershed Management Plan for Birch Bay Watershed ............................... 40
List of Tables
Table 1. Key sources of existing digital data. ..................................................................... 8 Table 2. Interpreting Map Results- Understanding What Important Areas Do and
Possible Actions to Offset Impairments Identified …………………………………………………25 Table 3 Examples of Addressing Environmental Issues Using Results of Assessment for
Water Flow Processes ………………………………………………………………………………………..…27 Table 4– Integrating information across scales to identify planning solutions ................ 37
Table 5. Example of Synthesis Table for Birch Bay Watershed. ..................................... 41

Puget Sound Characterization Project: Version 2 Methods, Models, and Analysis vii March 2010
Technical Team
Neal Aaland (WA Association of Counties) Karen Adams (Dept of Ecology) Harriet Beale (DOE) Scott Campbell (Corps of Engineers) Lowell Dickson (Dept of Natural Resources) Richard Dinocola (US Geological Survey) Dick Gersib (Washington Dept of Transportation) Peter Gill (Whatcom County) Susan Grigsby (DOE) Eric Grossman (USGS) Bernie Hargrave (COE) Debbie Hyde (Pierce County) John Jacobsen (Washington Department of Fish and Wildlife) Patricia Johnson (DOE) Bruce Jones (NW Indian Fisheries Commission) Gino Lucchetti (King County) Randy Lumper (Skokomish Tribes) Krista Mendelman (Environmental Protection Agency) Patricia Olson (DOE) Doug Peters (WA Dept of Commerce) Tim Quinn (WDFW) Paul Roberts (Association of Cities) Mary Ruckelshaus (National Oceanic and Atmospheric Agency) Dan Saul (DOE) Hugh Shipman (DOE) Stephen Stanley (DOE) Kathy Taylor (DOE) Chris Townsend (Puget Sound Partnership) Jim Weber (NWIFC) George Wilhere (WDFW) Michelle Wilcox (DOE) Bruce Wulkan (PSP).
Puget Sound Characterization Project: Version 2 Methods, Models, and Analysis viii March 2010
Acknowledgements
The production of this document would not have been possible without the
generous contribution of time and energy by numerous individuals. In particular, we wish to thank two Ecology employees: Andy McMillan, for his vision and commitment in supporting the landscape approach as an effective way to protect aquatic ecosystems in the State of Washington; and Jeannie Summerhays, for her tireless efforts to help create and support the establishment of a landscape program at Ecology
Other Ecology employees include Lauren Driscoll, for her expert review and
comments on early drafts and continued support and encouragement for the landscape approach. Richard Robohm provided timely and essential comments that greatly improved this guidance. Randy Davis supplied very useful input on planning aspects of the guidance. Krystyna Kowalik provided support, and shared knowledge and her early work on landscape analysis. Jeanne Koenings used her exceptional editing skills to the transform this guidance into a more readable document.
Whatcom County Planning played a major role in bringing this technical document
to fruition. We are indebted to Hal Hart and Jeff Chalfant for supporting application of a “landscape approach” to their Shoreline Plan update, and to Peter Gill for his technical input and exceptional GIS skills. Input on the landscape approach from the Whatcom County SMP Technical Advisory Committee has also assisted greatly in the evolution of this guidance.
We are extremely grateful to Margaret Clancy of Adolfson, and Chip Maney and
David Sherrard of Parametrix for their patient application of the emerging methods to the Whatcom County Shoreline Plan update. Their scientific and planning expertise coupled with their application of and feedback on the methods was tremendously useful in developing both the draft and final document.
Joseph Jones and Sue Kahle (USGS) were instrumental in evaluating our early
concepts for this document and helping us formulate its overall scientific framework. We are indebted to Rick Dinocola (USGS) for his in-depth review of the water flow model and recommended changes that resulted in a far better product.
We also appreciate the considerable effort and time spent by peer reviewers on the
draft guidance. Derek Booth’s extensive review has been central to revising the scientific assumptions, rationale, and overall structure of the guidance. Tom Winter’s review of the Water Flow Process (Appendix B) greatly assisted in the completion of this appendix, especially with the water flow diagrams. Additionally, the review of the draft document by Tim Beechie, Susan Bolton, Janet Carroll, Mary Kentula, John Owens, Joanne Schuett-Hames, Peter Skidmore and Linda Storm was critical to its final development.
Puget Sound Characterization Project: Version 2 Methods, Models, and Analysis ix March 2010
We also owe much to Dick Gersib for his review of this document and his initial work
on watershed characterization during his tenure with Ecology that established the foundation for developing the methods presented herewithin. Jenny Brown’s exceptional work on Ecology’s original watershed characterization document (Protecting Aquatic Ecosystems 2006), has been key to the successful development of both the current assessment models and technical document.
The completion of this draft technical document would not have been possible
without Michelle Wilcox assisting in both the project management and coordination of the technical team meetings. We also greatly appreciate the considerable time and effort spent by the technical guidance group in helping craft the draft technical products and the expert facilitation of the technical group meetings by Elizabeth McManus (Jones and Jones). The technical team members include: Neal Aaland (WA Association of Counties), Karen Adams (DOE), Harriet Beale (DOE), Scott Campbell (COE), Lowell Dickson (DNR), Dick Gersib (WSDOT), Peter Gill (Whatcom County), Eric Grossman (USGS), Bernie Hargrave (COE), Debbie Hyde (Pierce County), John Jacobsen (WDFW), Patricia Johnston (DOE), Bruce Jones (NW Indian Fisheries Commission), Gino Lucchetti (King County), Randy Lumper (Skokomish Tribes) , Krista Mendelman (EPA), Patricia Olson (DOE), Doug Peters (WA Dept of Commerce), Tim Quinn (WDFW), Paul Roberts (Association of Cities), Mary Ruckelshaus (NOAA), Dan Saul (DOE), Hugh Shipman (DOE), Kathy Taylor (DOE), Jim Weber (NWIFC), George Wilhere (WDFW), Bruce Wulkan (PSP). Additionally, we received invaluable technical assistance from Tyson Waldo(NWIFC) and Kelly Slattery (DOE) in the creation and editing of the SHIAPP based analysis units.
Funding for this work from the U.S. Environmental Protection Agency (Grant #CD-
96074401-0) and Puget Sound Partnership made this document possible. We wish to thank Krista Mendelman and Michael Rylko (U.S. EPA) and Chris Townsend (Puget Sound Partnership) for recognizing both the value of and need for taking a landscape approach to protecting our aquatic ecosystems within the state of Washington.

Puget Sound Characterization Project: Version 2 Methods, Models, and Analysis x March 2010
Examples of the most important watershed processes in Washington State are the movement of water, sediment, nutrients, pathogens, toxic compounds, and wood.
Executive Summary
Land use management plans and regulations are the main tools we use to protect
and restore our lakes, rivers, wetlands and estuaries. The audience for this technical document includes the planners, resource managers, and consultants who develop these land use plans and regulations.
Purpose
This technical document describes the approach taken to assess one watershed process, the movement of water in the Puget Sound, as part of the Puget Sound Characterization Project. Subsequent assessments for fish and wildlife and other processes such as movement of nutrients, will be completed over the next year. Together this information will constitute a relatively complete watershed characterization. Planners can use the complete characterization results to help minimize negative environmental impacts from changes in land uses.
Scientists are developing a consensus that understanding watershed processes at a broad scale is essential to adequately protect and restore aquatic ecosystems. This approach outlines an assessment methodology to evaluate the relative importance of watershed processes among different analysis units of a watershed, and the relative impairment to these processes from human activity. The goal is to identify areas of the landscape that are important for maintaining watershed processes, and to characterize to what degree human activity has impaired these processes. This information can identify areas that are:
important to protect,
a high priority to restore, and
less sensitive to impacts from new development and changes in land use.
The assessment results do not characterize functions or processes at the site or reach scale. Instead the assessment methods describes the types of “controls” or important areas on the landscape that govern the movement of water and associated processes and how activities impair each process, and identifies a set of indicators for these activities.
Scale
This approach is best suited to the county or watershed level, but also provides valuable information at a sub-watershed scale. Since it evaluates relationships occurring at a watershed scale, it does not establish a direct connection between

Puget Sound Characterization Project: Version 2 Methods, Models, and Analysis xi March 2010
impairments at the larger scale and resulting impacts at the site scale. Assessment at the watershed scale doesn‘t identify site-specific needs for restoration or mitigation, though it is essential to informing plans for restoring sites or mitigating for site impacts. For example, the assessment results are not intended to modify the results of salmon enhancement plans, which are based on analysis of site and reach specific functions and processes. The assessment results may improve the success of salmon recovery plans by ensuring that watershed processes critical to sustaining reach scale processes are protected or restored in the contributing watershed.
Benefits
The analyses from this approach can inform the following planning efforts:
Growth Management Act
▬ Supports protection of critical areas (for example, Critical Areas Ordinances, and public outreach, education, and incentive programs) by identifying areas important in maintaining watershed processes.
▬ Evaluates the effect of future changes in land use on watershed processes.
▬ Assists with public works infrastructure planning and maintenance.
Shoreline Management Act
▬ Completes the assessment of ecosystem-wide processes.
▬ Identifies areas appropriate for restoration and protection as part of the restoration plan.
▬ Informs land use designations and development standards that protect ecosystem-wide processes.
▬ Supports “no net loss” requirements while allowing flexibility in mitigation.
State Environmental Policy Act and National Environmental Policy Act
▬ Includes watershed processes in the development of mitigation plans.
▬ Provides information to meet the avoidance and minimization steps of “mitigation sequencing.”
Local Regulations
▬ Supports predictable permitting by streamlining the permitting process with clearly established mitigation, credits, and fees.
Resource planning ▬ Supports more effective natural resource protection. ▬ Informs site-level restoration and protection plans, and strategies for
reducing risk of negative effects of land use change.
Puget Sound Characterization Project: Version 2 Methods, Models, and Analysis xii March 2010
How to Use this Technical Document
If you are a planner, the main document provides an overview of the approach used for Puget Sound, the scientific concepts supporting it, and examples of how it can support various planning needs. If you are a technical specialist, the appendices provide the detailed methods and scientific rationale used for completing the analyses. In interpreting and applying the results to planning and permitting decisions it is best to engage a technical team with expertise in hydrology, geology and aquatic ecology. Over the next year, the Puget Sound Characterization Project will be attempting to secure funding to support a watershed technical team that provides assistance to local government planners in Puget Sound.
Background Documents
The approach and methods presented in this document were originally contained in
Version 2 and 2 of Ecology Publication 05-06-027, “Protecting Aquatic Ecosystems by Understanding Watershed Processes: A Guide to Planners.” Both versions have been peer reviewed, but the second version is not published. Since the release of Version 2 in early 2006, local governments have applied variations of the original guidance throughout western Washington. This has included shoreline master program updates for Whatcom, Jefferson, King, and Pierce Counties in addition to the Cities of Issaquah, Olympia, Tumwater, and Lacey. Some of these efforts have resulted in the adoption of local plans and development regulations based on watershed principals. Additionally, the guidance was applied in Clark County to support development of a countywide mitigation framework, and in Birch Bay to support drafting of a watershed based sub-area plan.
Through these individual planning efforts, we have identified ways to improve the
assessment methods and models. A technical team guiding the Puget Sound Characterization project has made further changes to the water flow models including recommendations on how to analyze and interpret the results of the modeling.
This technical document reflects these improvements and includes: 1) Models for scoring water flow, (Appendix B) This will allow local governments to
prioritize planning actions within a watershed. 2) Expanded examples of how to apply the guidance to local planning. 3) Detailed steps for conducting GIS analysis. Watershed science continues to evolve and as this guidance continues to be used
and results evaluated, assessment methods may change. The Puget Sound Phase 1 assessment only includes “water processes”. Other watershed processes such as sediment and nutrient transport will be addressed in future assessments.

Puget Sound Characterization Project: Version 2 Methods, Models, and Analysis xiii March 2010
What this Approach Does Not Do
This approach does not provide information at a scale that will allow for the design of mitigation (includes restoration, enhancement and protection measures) actions at the reach or site scale.

Puget Sound Characterization Project: Version 2 Methods, Models, and Analysis xiv March 2010
Definitions
The following key terms occur in this document:
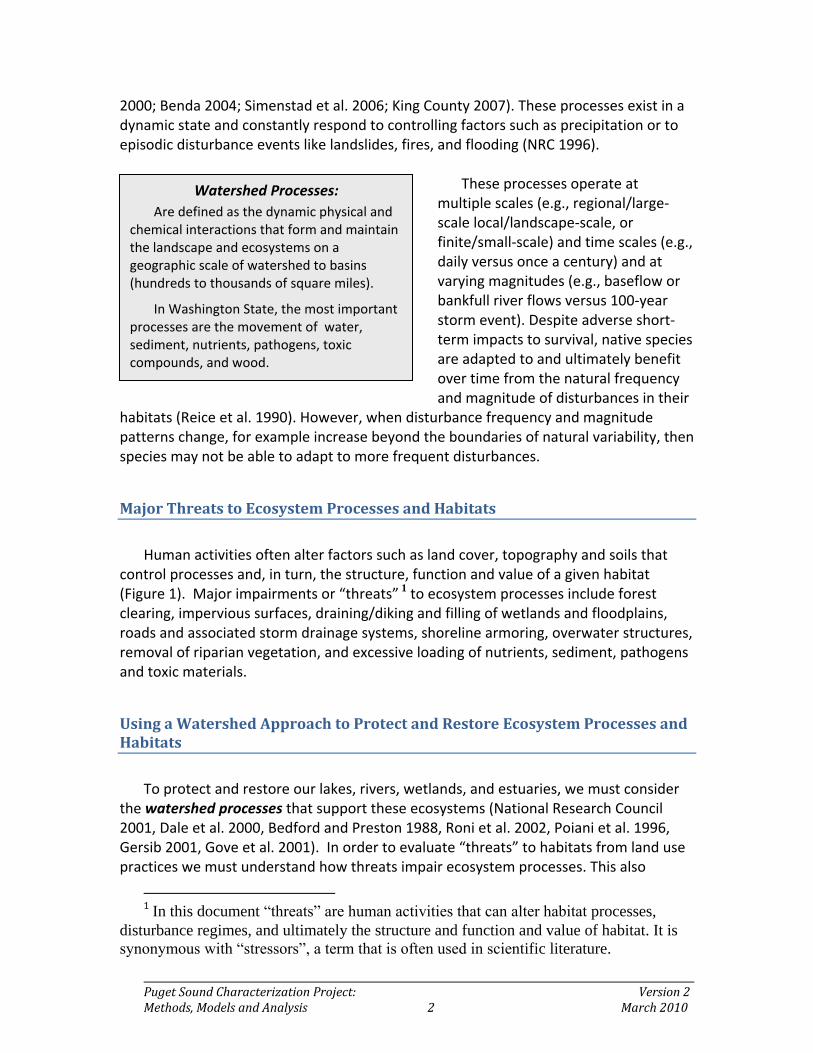
Watershed Processes: The dynamic physical and chemical interactions that form and maintain the landscape and ecosystems on a geographic scale of watersheds to basins (hundreds to thousands of square miles). In Washington State, the most important processes are the movement of water, sediment, nutrients, pathogens, toxic compounds, and wood. Each of these are described in detail in the appendices.
Assessing Watershed Processes: The methods presented here for analyzing watershed processes. In this document, ‘assessment’, ‘watershed assessment’, or ‘assessment of processes’ all have the same meaning.
Method(s): The analysis of an individual watershed process in one region of the state. Each appendix, B through G, presents the method for one process.
Model: Numeric equations for scoring the relative level of importance and impairment for analysis units within an analysis area. Currently, three of the processes have models: Water Flow, Nitrogen, and Pathogen processes.
Watershed Management Matrix: The matrix to identify the most suitable areas for protection, restoration, and development for a process within the analysis area. It combines the results of the models for importance and impairment for one process.
Analysis Area: The geographic extent of the assessment. It ranges in scale depending on the size of a jurisdiction (city vs. county) and the type of landforms (coastal terrace vs. large river basin). It can include several watersheds. See Step 2.
Analysis Unit: Each analysis area is divided into many smaller analysis units for comparison of model results. These are the units that are ranked as most important to least important for a process, or most impaired to least impaired for a process. The size and number of these units depends on the size of the analysis area, the landform types, and the planning issues a jurisdiction may be addressing. See Step 2.
Landscape Group: A group of analysis units within the analysis area that have similar environmental characteristics, such as precipitation, landform, and geology. A large analysis area may have one landscape group in a coastal terrace consisting of till, with relative low precipitation, and a second landscape group in mountainous bedrock with high precipitation and snow pack. The analysis units within each landscape group are compared to each other and not to analysis units in a different landscape group.
Impervious Surfaces: Constructed surfaces, such as pavement for transportation, buildings, roofs, and sidewalks, that effectively prevent or retard the movement of water vertically through the underlying soil and geologic deposits.
Effective Impervious Area (EIA)s: Impervious surfaces in a watershed that have a downstream drainage connections which eventually connects to surface water bodies such as streams, lakes, and wetlands. The Effective Impervious Area in a watershed is typically less than the total impervious surface.

Puget Sound Characterization Project: Version 2 Methods, Models and Analysis 1 March 2010
Overview
Importance of Watershed Processes in Puget Sound
Role of Ecosystem Processes: Process, Structure and Function
“Habitat” is comprised of the biological, physical and chemical conditions of an area that support a particular species or species assemblage” (Ruckelshaus and McClure 2007). Examples of Puget Sound habitats include high-elevation glaciers, alpine meadows, mid-elevation mixed forests of fir, hemlock, alder and maple, river floodplains, freshwater wetlands, riparian forests, estuarine and tidal marshes, mudflats, eelgrass beds, and sand and gravel beaches (Kruckeberg 1991; Williams et al.
2001; Ruckelshaus and McClure 2007). These habitats are not formed de novo and are not static in their condition, area or availability. Instead, they are part of a complex web of habitats formed and maintained over time by the interaction of physical, chemical and biological processes occurring throughout their watersheds (Spence et al. 1996; Dale et al. 2000; NRC 2001; Roni et al. 2002; Stanley 2005; Simenstad et al. 2006).
Ecosystem processes
deliver, move, and transform water, sediment, wood, nutrients, pathogens, and organic matter. These processes Figure 1. Ecosystem processes are responsible for creating/maintaining habitat structures and the resulting functions. Threats alter components of ecosystem processes, which in turn, affect structure and function and ultimately the values people and species may desire (Fuerstenberg 1998; King County 2007). are responsible for creating and maintaining the habitats that we see and for the functions that habitats provide (Naiman and Bilby 1998; Beechie & Bolton 1999, Hobbie
Puget Sound Characterization Project: Version 2 Methods, Models and Analysis 2 March 2010
Watershed Processes:
Are defined as the dynamic physical and chemical interactions that form and maintain the landscape and ecosystems on a geographic scale of watershed to basins (hundreds to thousands of square miles).
In Washington State, the most important processes are the movement of water, sediment, nutrients, pathogens, toxic compounds, and wood.
2000; Benda 2004; Simenstad et al. 2006; King County 2007). These processes exist in a dynamic state and constantly respond to controlling factors such as precipitation or to episodic disturbance events like landslides, fires, and flooding (NRC 1996).
These processes operate at
multiple scales (e.g., regional/large-scale local/landscape-scale, or finite/small-scale) and time scales (e.g., daily versus once a century) and at varying magnitudes (e.g., baseflow or bankfull river flows versus 100-year storm event). Despite adverse short-term impacts to survival, native species are adapted to and ultimately benefit over time from the natural frequency and magnitude of disturbances in their
habitats (Reice et al. 1990). However, when disturbance frequency and magnitude patterns change, for example increase beyond the boundaries of natural variability, then species may not be able to adapt to more frequent disturbances.
Major Threats to Ecosystem Processes and Habitats
Human activities often alter factors such as land cover, topography and soils that
control processes and, in turn, the structure, function and value of a given habitat (Figure 1). Major impairments or “threats” 1 to ecosystem processes include forest clearing, impervious surfaces, draining/diking and filling of wetlands and floodplains, roads and associated storm drainage systems, shoreline armoring, overwater structures, removal of riparian vegetation, and excessive loading of nutrients, sediment, pathogens and toxic materials.
Using a Watershed Approach to Protect and Restore Ecosystem Processes and Habitats
To protect and restore our lakes, rivers, wetlands, and estuaries, we must consider
the watershed processes that support these ecosystems (National Research Council 2001, Dale et al. 2000, Bedford and Preston 1988, Roni et al. 2002, Poiani et al. 1996, Gersib 2001, Gove et al. 2001). In order to evaluate “threats” to habitats from land use practices we must understand how threats impair ecosystem processes. This also
1 In this document “threats” are human activities that can alter habitat processes,
disturbance regimes, and ultimately the structure and function and value of habitat. It is
synonymous with “stressors”, a term that is often used in scientific literature.

Puget Sound Characterization Project: Version 2 Methods, Models and Analysis 3 March 2010
provides an understanding of the level of impairment to water quality, water quantity, and habitat functions.
Management and regulation of these aquatic ecosystems has typically concentrated on the individual lake, wetland, stream reach or estuary, and not on the larger watershed, that controls these characteristics. Much of the research concludes that protection, management, and regulatory activities could be more successful if they incorporate an understanding of watershed processes. Conclusions from the research are:
Many restoration efforts fail when they do not consider watershed processes; success would improve with consideration of the watershed context in site-level restoration (Buffington et al. 2003, National Research Council 2001, Reid 1998, Frissell and Ralph 1998, Beechie and Bolton 1999, Kauffman et al. 1997, Roni et al. 2002).
The design of mitigation projects needs to integrate a watershed perspective (Mitsch and Wilson 1996, Preston and Bedford 1988).
Land use plans should develop within a framework that first focuses on maintaining or restoring watershed processes (Hidding and Teunissen 2002, Dale et al. 2000, Gove et al. 2001).
Methods for Mapping & Analyzing Watershed Processes
The methods presented in this document for characterizing watershed processes is
based on predicting how water moves within a watershed according to the landscape setting (Preston and Bedford 1988, Bedford 1996, Winter 1988). The methods focus on six watershed processes that play an important role in structuring and maintaining aquatic ecosystems in the Pacific Northwest (Naiman et al. 1992, Beechie and Bolton 1999, Beechie et al. 2003). These processes are the movement of:
water,
sediment,
phosphorus and toxins,
nitrogen,
pathogens, and
large woody debris,
as they enter, pass through, interact with, and eventually leave the watershed.
This document describes the types of “controls” or important areas on the landscape that govern the movement of water and associated processes and how activities impair each process, and identifies a set of indicators for these activities.

Puget Sound Characterization Project: Version 2 Methods, Models and Analysis 4 March 2010
Appendices A through G describe these relationships in detail for western Washington. The goal of watershed assessment is to inform decisions on where protection and restoration of watershed processes will be most effective, and which areas on the landscape are least sensitive to future disturbance. A watershed management matrix, Figure 2, summarizes the information from the assessment. The matrix is a graphical representation used to identify analysis units most suited for protection, restoration, and other land use activities for a watershed process. The matrix results from two factors: 1) the importance of the analysis unit in maintaining watershed processes, 2) and the degree to which the processes in the analysis unit have been impaired by human activities.
Figure 2. Watershed Management Matrix. The matrix summarizes information on the rating of importance and rating of impairment for analysis units within an analysis area. The matrix identifies those analysis units most suitable for protection, and restoration, and those least sensitive to impacts from additional development and changes in land use.
The appendices present the methods for analyzing, ranking, mapping, and interpreting the importance and level of impairment in all analysis units of a watershed. The appendices describe in detail the kinds of information to combine (e.g., soils and geology) and how to select attribute combinations (e.g., hydric rating and permeability) to identify locations where processes are important. This approach also applies when evaluating impairments. We applied the methods described in the appendices to the Puget Sound watersheds as part of the Puget Sound Characterization Project.
Incorporating an Understanding of Watershed Processes into Planning
Conservation Less Impact to Processes

Puget Sound Characterization Project: Version 2 Methods, Models and Analysis 5 March 2010
This analysis assesses all analysis units of a watershed in terms of the management matrix described above. Each analysis unit is ranked, relative to the other analysis units, for its potential for restoration, preservation, and development suitability. Policy and resource managers can use this information to assess the potential impact of future development patterns on watershed processes. The results of the analysis can also be used to establish the environmental condition of an analysis unit relative to other analysis units. This approach is most effective when used in the comprehensive planning process applied at the county, subarea, or watershed scale, allowing communities to effectively plan for future development. This approach can identify the potential adverse changes in watershed processes resulting from different patterns and types of land use activities.
Issues of Scale – Integrating information on watershed processes into land use plans and policies that deal with individual sites can be difficult. Our understanding of how processes interact at different geographic scales is limited. For example:
We understand… But our knowledge is less certain
of…
Some relationships between landscape conditions and water movement on a watershed scale.
How the movement of water at the large scale affects the movement of water to a single wetland, stream reach, etc.
Which human activities are likely to alter watershed processes (e.g., additional inputs of nutrients or change to nutrient removal mechanisms).
How the addition of nutrients will change the functions of an individual wetland.
Therefore, the results from analyses for an entire watershed will not be
accurate for a specific site. Most hydrologic studies are conducted on the site scale and upscaling these processes to the watershed scale is a problem that has not been resolved. Watershed level hydrologic process measurement studies are just beginning to be instituted and results are very preliminary and not conclusive (McDonnell et al 2007). The information, however, can be used to develop standards for protecting and managing aquatic resources through local government plans (i.e. comprehensive plans, shoreline management plans) or state planning documents (e.g. establishing regional restoration priorities). This creates a watershed based management framework which helps inform site specific decisions on the best location of mitigation and restoration actions and future development. See page 40 for more detail on state planning laws.

Puget Sound Characterization Project: Version 2 Methods, Models and Analysis 6 March 2010
Introduction to the Puget Sound Characterization Project
The Washington State Department of Ecology (Ecology) and the Puget Sound Partnership (Partnership) received funding from the EPA (Spring 2009) to conduct a watershed characterization for the entire Puget Sound region over a two-year period. This project was the top ranked near-term protection action in the Action Agenda for the Puget Sound Partnership.
The characterization will include landscape assessments of water flow and water quality processes and fish and wildlife habitat. Ecology formed a technical team to review the assessment models, GIS Methods and make recommendations relative to the interpretation and application of assessment results. The team consists of representatives from the Environmental Protection Agency, US Geological Survey, Army Corps of Engineers, Washington Department of Fish and Wildlife, Washington Department of Natural Resources, Washington Department of Commerce, local governments, and the Association of Washington Cities and the Washington Association of Counties.
The Project has two phases based on scales: 1) a broad scale analysis that will
present data for the entire Puget Sound Basin and 2) a mid scale analysis that will present information at a scale suitable for use by local governments. The products are as follows:
Phase I – This will include an assessment of the relative importance of areas based
on water flow processes for all of Puget Sound on a broad scale. The data is analyzed on a county-by-county basis and then aggregated to a Sound-wide level. The county level analysis will be complete by early 2010 and the Sound-wide analysis should be completed by mid 2010.
The project team will coordinate with tribes regarding release of the watershed
characterization to local governments. This coordination will include identifying additional data layers to make available to local governments for use with the countywide watershed characterizations. Those data layers will include:
SSHIAP LFA Fish Distribution (NWIFC-WDFW)
Ecology Water Quality Standard classifications (Ecology)
Slide prone area (source: DNR)

Puget Sound Characterization Project: Version 2 Methods, Models and Analysis 7 March 2010
Initially, the draft characterizations will be made available to those local governments in the process of preparing SMP updates. The water flow assessment and additional data sets will initially be made available as GIS data layers and ultimately will be made available on an interactive web-mapping tool.
Phase II - Phase II will incorporate and synthesize the additional data layers provided with the Phase 1 characterization work. It will also incorporate additional information such as fish and wildlife habitat, water quality data, and the Puget Sound Nearshore Ecosystem Restoration Project (PSNERP) change analysis and water quality assessments into the overall characterization. Ultimately, Phase 2 characterizations will be available at both the broad scale and the mid scale. Phase 2 should be completed by June 2011.
The Puget Sound Characterization project team has also dedicated resources
available to assist tribes and local governments in using the watershed characterizations for local planning and regulatory processes. The focus of this technical assistance will help local governments incorporate the results of the watershed assessments into their shoreline master program updates and help one or two local jurisdictions prepare a more detailed characterization for implementation through the specific planning process.
Overview of the Basic Steps Used in this Approach
The basic steps used in this approach for assessing watershed processes included:
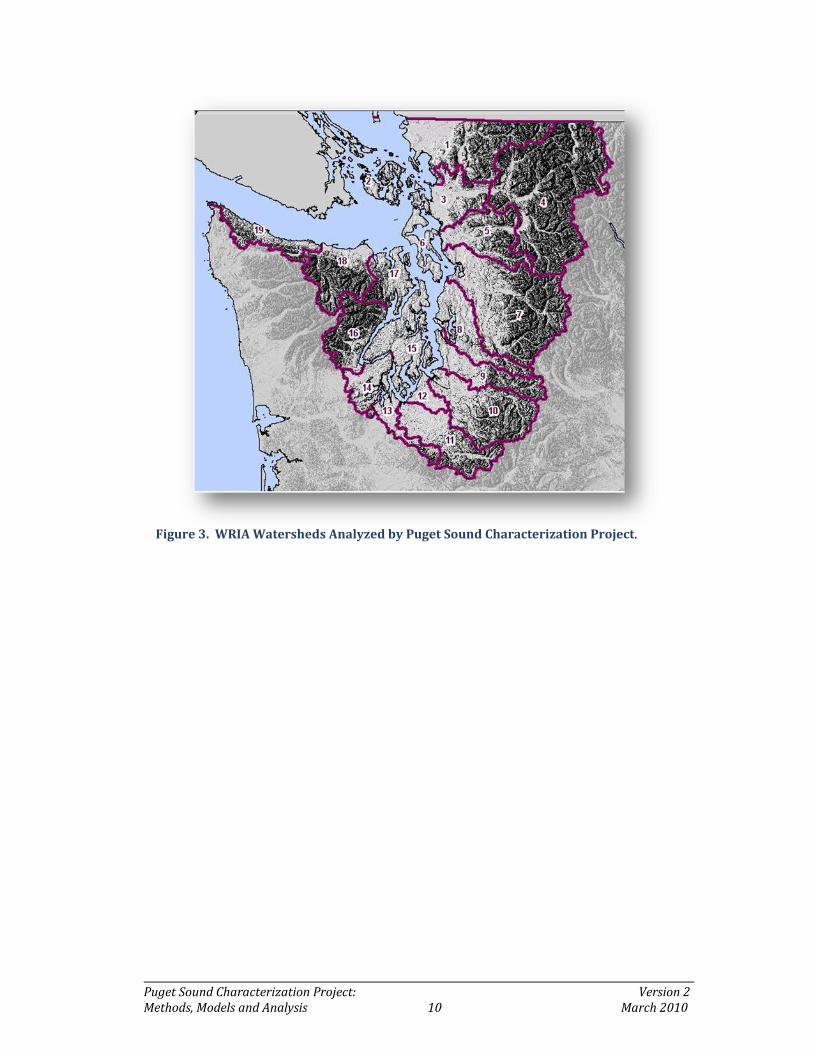
1. Import the Salmon and Steelhead Habitat Inventory and Assessment Program (SSHIAP) analysis units for Puget Sound WRIAs 1 through 19 (see Figure 3).
2. Develop landscape groups and identify analysis unit size for each landscape group. 3. Aggregate smaller SSHIAP units into the selected analysis unit size for each
landscape group (Figure 4). 4. Apply process models and map the relative importance of these analysis units for
maintaining the processes in the watershed. For Phase I, we only developed and ran the water flow model.
5. Apply (water flow) process models and map the relative impairment of these analysis units to the watershed processes.
6. Identify analysis units for potential restoration and protection actions at the broad scale and those units least sensitive to disturbance. Apply watershed management process outlined in Figure 21 to incorporate assessment results into local plans.
The technical committee applied these steps to assess water flow processes in Puget
Sound. The results of this assessment will assist resource managers to identify areas: for protection; restoration; less sensitive to development (or more resilent).
All six steps use existing environmental data and land use information. This includes data such as surficial geology, soils, topography, land cover, land use, hydrography, and
Puget Sound Characterization Project: Version 2 Methods, Models and Analysis 8 March 2010
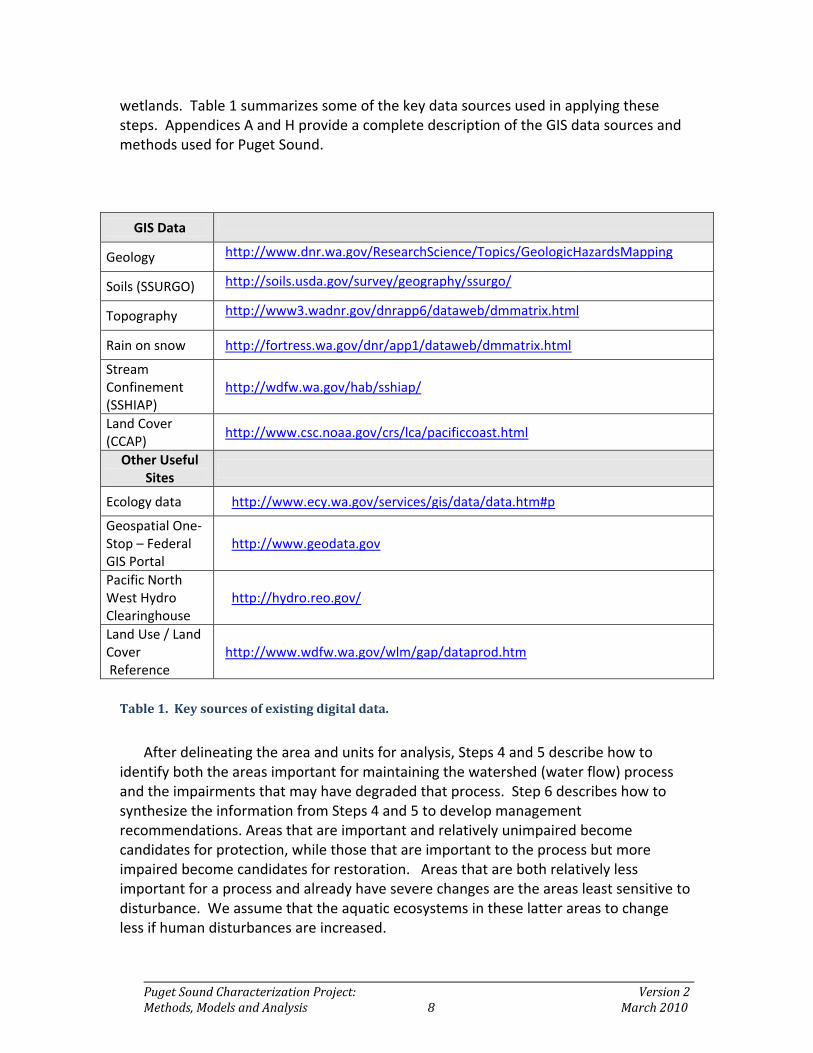
wetlands. Table 1 summarizes some of the key data sources used in applying these steps. Appendices A and H provide a complete description of the GIS data sources and methods used for Puget Sound.
GIS Data
Geology http://www.dnr.wa.gov/ResearchScience/Topics/GeologicHazardsMapping
Soils (SSURGO) http://soils.usda.gov/survey/geography/ssurgo/
Topography http://www3.wadnr.gov/dnrapp6/dataweb/dmmatrix.html
Rain on snow http://fortress.wa.gov/dnr/app1/dataweb/dmmatrix.html
Stream Confinement (SSHIAP)
http://wdfw.wa.gov/hab/sshiap/
Land Cover (CCAP)
http://www.csc.noaa.gov/crs/lca/pacificcoast.html
Other Useful Sites
Ecology data http://www.ecy.wa.gov/services/gis/data/data.htm#p
Geospatial One-Stop – Federal GIS Portal
http://www.geodata.gov
Pacific North West Hydro Clearinghouse
http://hydro.reo.gov/
Land Use / Land Cover Reference
http://www.wdfw.wa.gov/wlm/gap/dataprod.htm
Table 1. Key sources of existing digital data.
After delineating the area and units for analysis, Steps 4 and 5 describe how to
identify both the areas important for maintaining the watershed (water flow) process and the impairments that may have degraded that process. Step 6 describes how to synthesize the information from Steps 4 and 5 to develop management recommendations. Areas that are important and relatively unimpaired become candidates for protection, while those that are important to the process but more impaired become candidates for restoration. Areas that are both relatively less important for a process and already have severe changes are the areas least sensitive to disturbance. We assume that the aquatic ecosystems in these latter areas to change less if human disturbances are increased.
Puget Sound Characterization Project: Version 2 Methods, Models and Analysis 9 March 2010
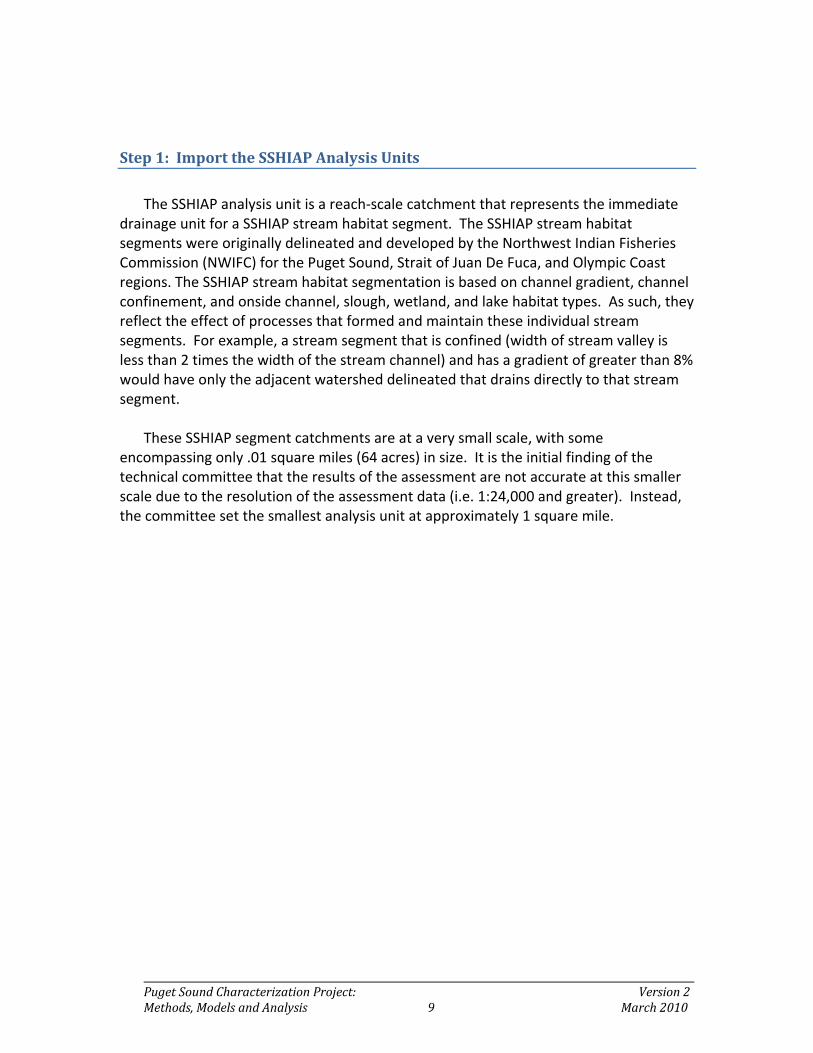
Step 1: Import the SSHIAP Analysis Units
The SSHIAP analysis unit is a reach-scale catchment that represents the immediate
drainage unit for a SSHIAP stream habitat segment. The SSHIAP stream habitat segments were originally delineated and developed by the Northwest Indian Fisheries Commission (NWIFC) for the Puget Sound, Strait of Juan De Fuca, and Olympic Coast regions. The SSHIAP stream habitat segmentation is based on channel gradient, channel confinement, and onside channel, slough, wetland, and lake habitat types. As such, they reflect the effect of processes that formed and maintain these individual stream segments. For example, a stream segment that is confined (width of stream valley is less than 2 times the width of the stream channel) and has a gradient of greater than 8% would have only the adjacent watershed delineated that drains directly to that stream segment.
These SSHIAP segment catchments are at a very small scale, with some
encompassing only .01 square miles (64 acres) in size. It is the initial finding of the technical committee that the results of the assessment are not accurate at this smaller scale due to the resolution of the assessment data (i.e. 1:24,000 and greater). Instead, the committee set the smallest analysis unit at approximately 1 square mile.
Puget Sound Characterization Project: Version 2 Methods, Models and Analysis 10 March 2010
Figure 3. WRIA Watersheds Analyzed by Puget Sound Characterization Project.

Puget Sound Characterization Project: Version 2 Methods, Models and Analysis 11 March 2010
Figure 4. Imported SSHIAP units for WRIA ‘s 14, 15 and 16--Southern Hood Canal area and Mason County, Kitsap and Pierce Counties. Catchment units outlined in “black” are the individual SSHIAP units prior the aggregation into landscape Groups.
Figure 4 depicts the range of sizes of SSHIAP analysis units prior to aggregation,
which we discuss in step 3, with an example of aggregation provided in Figure 7 for the Hood Canal area (WRIA 15).

Puget Sound Characterization Project: Version 2 Methods, Models and Analysis 12 March 2010
Step 2: Develop Landscape Groups
Key Questions:
Are there significantly different areas of precipitation, landform and geology in the analysis areas?
What size of the analysis units meets local planning and permitting needs?
Landscape Groups (LG)
For each WRIA, the SSHIAP catchment units were grouped or classified into
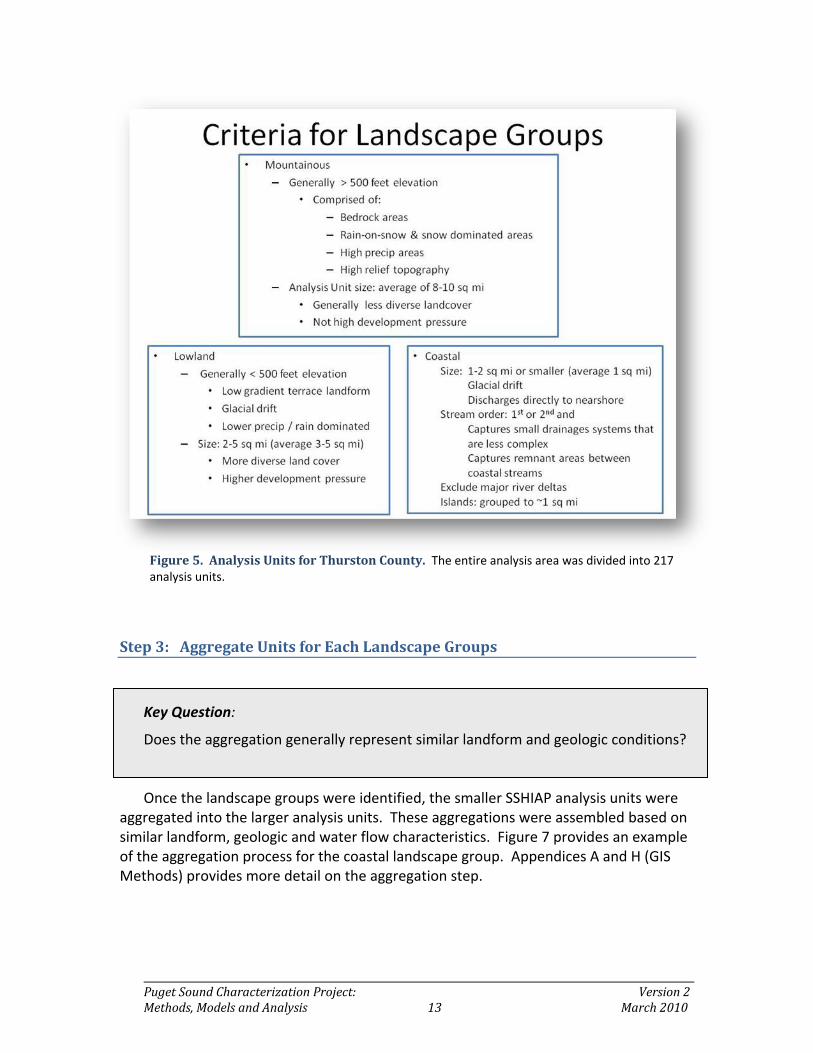
landscape units with similar environmental conditions. This classification system is based on Winter’s (2001) “analysis-landscapes” and Bedford (1999 & 1988) hydrogeology framework. This classification considers regional climate, surficial geology, topography (landform), groundwater, and surface flow patterns in relationship to aquatic ecosystems. Based on this classification the technical committee developed criteria (Figure 6) for three landscape groups: mountainous, lowland and coastal. The criteria details are:
Mountainous Group. This higher elevation area is characterized by high
precipitation, significant snow cover, bedrock and steep topography with shallow seasonal groundwater and deeper regional groundwater systems.
Lowland Group. Lower elevation terraces comprised of glacial deposits. Moderate
levels of precipitation occuring primarily as rainfall. Groundwater patterns consist of both intermediate and local recharge in the upper terraces and local to regional scale groundwater discharge in broad glacial valleys.
Coastal Group. These are smaller watersheds that directly influence nearshore
marine environments. Precipitation is rain dominated but has lower annual precipitation than the other landscape units. Most watersheds contain smaller (2nd order or less) stream systems underlain by glacially derived deposits. Local groundwater recharge and discharge predominates the groundwater flow pattern.
Figure 6 and 7 for WRIA 11 and 13, Thurston County Illustrates the landscape groups
and analysis units.
Puget Sound Characterization Project: Version 2 Methods, Models and Analysis 13 March 2010
Figure 5. Analysis Units for Thurston County. The entire analysis area was divided into 217 analysis units.
Step 3: Aggregate Units for Each Landscape Groups
Key Question:
Does the aggregation generally represent similar landform and geologic conditions? Once the landscape groups were identified, the smaller SSHIAP analysis units were
aggregated into the larger analysis units. These aggregations were assembled based on similar landform, geologic and water flow characteristics. Figure 7 provides an example of the aggregation process for the coastal landscape group. Appendices A and H (GIS Methods) provides more detail on the aggregation step.
Puget Sound Characterization Project: Version 2 Methods, Models and Analysis 14 March 2010
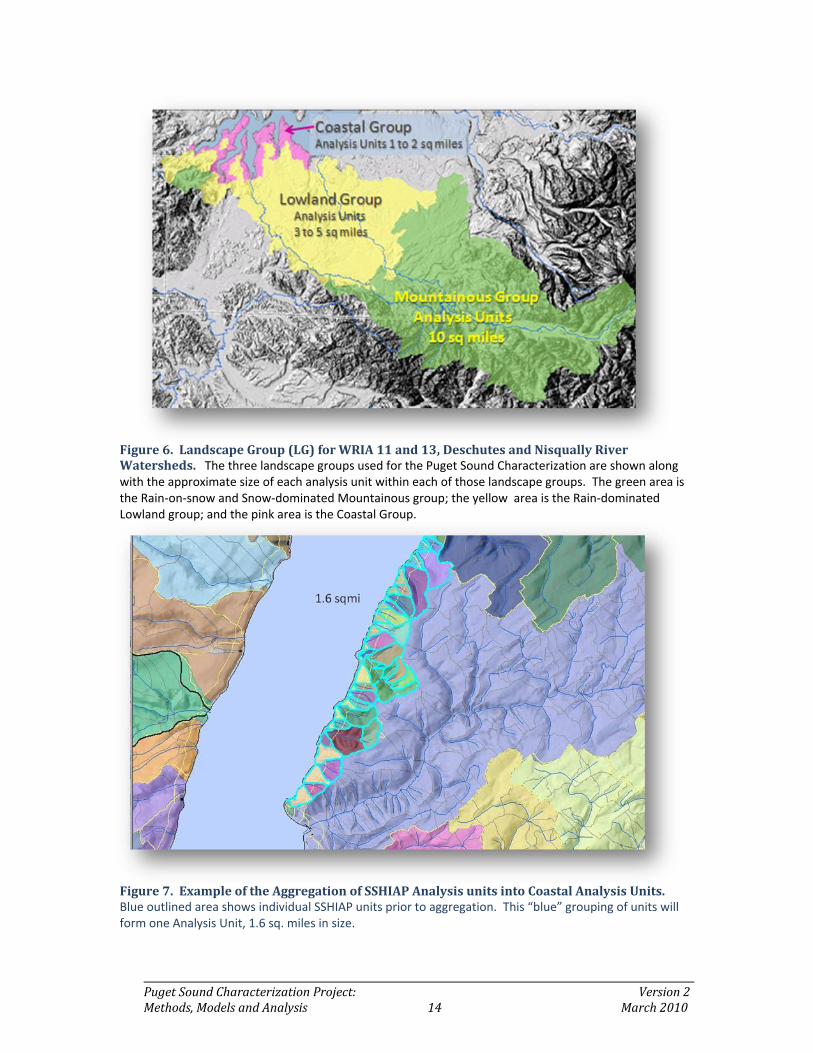
Figure 6. Landscape Group (LG) for WRIA 11 and 13, Deschutes and Nisqually River Watersheds. The three landscape groups used for the Puget Sound Characterization are shown along with the approximate size of each analysis unit within each of those landscape groups. The green area is the Rain-on-snow and Snow-dominated Mountainous group; the yellow area is the Rain-dominated Lowland group; and the pink area is the Coastal Group.
Figure 7. Example of the Aggregation of SSHIAP Analysis units into Coastal Analysis Units. Blue outlined area shows individual SSHIAP units prior to aggregation. This “blue” grouping of units will form one Analysis Unit, 1.6 sq. miles in size.

Puget Sound Characterization Project: Version 2 Methods, Models and Analysis 15 March 2010
Step 4: Map ‘Important Areas’ and Rank Analysis units by Watershed Process
Key Question:
In the absence of human impairment*, what areas are important to each watershed process?
Where are these areas located and what is their relative importance to each process?
* We address important areas that are impaired in the next section.
Methods: This step maps the physical characteristics that control the natural performance of each watershed process in Puget Sound. In this document, the term “important areas” refers to those areas with characteristics that help maintain a watershed process. Step 3 in each Appendix, B through G, describes our current understanding (or informed assumptions) regarding these relationships for each process. The numeric model for mapping important areas results in a relative ranking of each analysis unit within the analysis area, from most to least important. Figure 8 shows the results of the water process model for assumed delivery of surface water and ground water components. Individual maps displayed the results of each of these components (Figure 8).
GIS analyses: The section on “Models” in each appendix describes the individual
analyses and the scoring methods that make up each model. After combining various layers of digital data, each sub-basin receives a composite score that represents its relative importance to the process within the analysis unit. This final score is grouped into one of four rating categories: High, Moderate to High, Moderate, or Low. These results can then be supplemented with local data. Table 3 lists GIS data sets.
Products: Map of ratings for analysis units (Figure 8): We created a summary map from
the GIS analysis work that displays the importance of each analysis unit for the water flow process relative to other analysis units within the analysis area. The darker the color the more important the sub-basin is relative to the others. The results of analysis within each landscape group were used to create a ranking for only that group. We did not combine the scores of landscape groups to create rankings for an entire WRIA or multiple WRIA’s.
Example: We analyzed and mapped the water flow process for WRIA 10, Thurston
County (Figures 8 to 12). The analysis units within each landscape group were analyzed separately from those in other landscape groups. Thus, the snow-dominated mountainous analysis units in WRIA 10 were compared to one another, as were the analysis units in the lowland landscape group. In this way, each landscape unit has analysis units that range from high to low.
Puget Sound Characterization Project: Version 2 Methods, Models and Analysis 16 March 2010
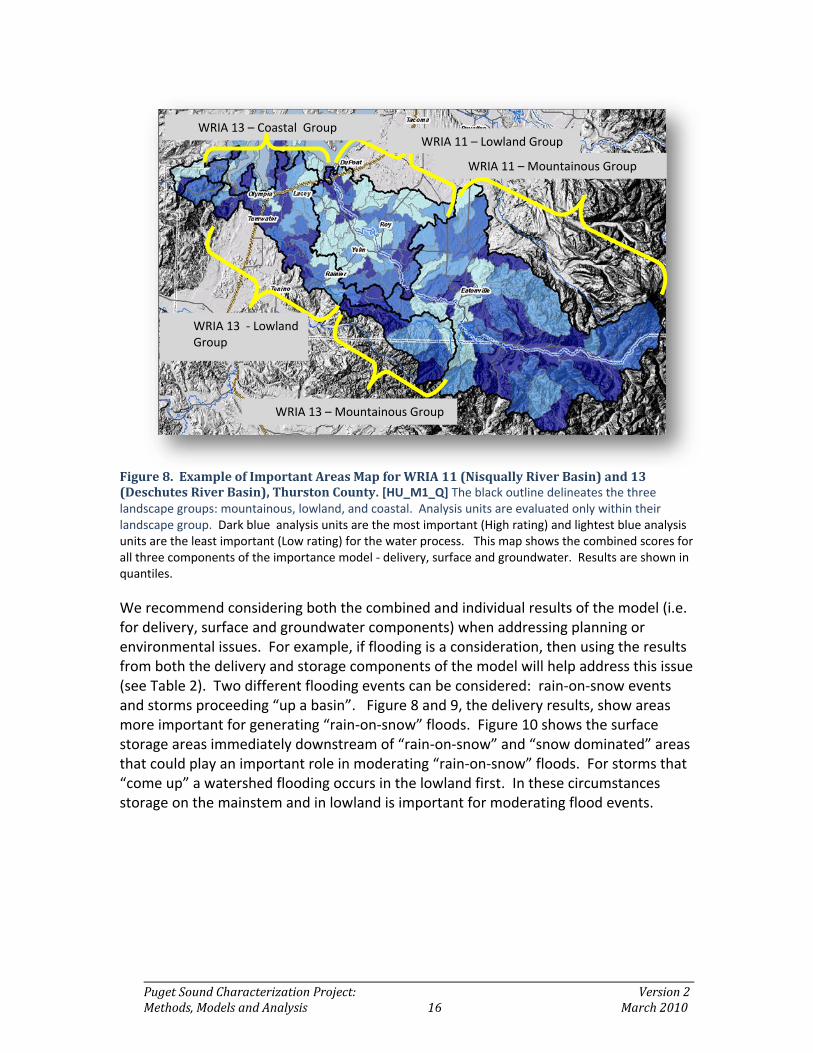
Figure 8. Example of Important Areas Map for WRIA 11 (Nisqually River Basin) and 13 (Deschutes River Basin), Thurston County. [HU_M1_Q] The black outline delineates the three landscape groups: mountainous, lowland, and coastal. Analysis units are evaluated only within their landscape group. Dark blue analysis units are the most important (High rating) and lightest blue analysis units are the least important (Low rating) for the water process. This map shows the combined scores for all three components of the importance model - delivery, surface and groundwater. Results are shown in quantiles.
We recommend considering both the combined and individual results of the model (i.e. for delivery, surface and groundwater components) when addressing planning or environmental issues. For example, if flooding is a consideration, then using the results from both the delivery and storage components of the model will help address this issue (see Table 2). Two different flooding events can be considered: rain-on-snow events and storms proceeding “up a basin”. Figure 8 and 9, the delivery results, show areas more important for generating “rain-on-snow” floods. Figure 10 shows the surface storage areas immediately downstream of “rain-on-snow” and “snow dominated” areas that could play an important role in moderating “rain-on-snow” floods. For storms that “come up” a watershed flooding occurs in the lowland first. In these circumstances storage on the mainstem and in lowland is important for moderating flood events.
WRIA 11 – Mountainous Group
WRIA 11 – Lowland Group
WRIA 13 – Mountainous Group
WRIA 13 - Lowland Group
WRIA 13 – Coastal Group

Puget Sound Characterization Project: Version 2 Methods, Models and Analysis 17 March 2010
Figure 9. Example of Important Areas for Delivery for WRIA 11 and 13, Thurston
County. Pink areas represent “rain-on-snow” zones and “blue” areas represent “snow dominated zones. These factors contributed to the high importance designation shown in Figure 7.
Figure 10. Example of Important Areas for Storage Relative to Rain on Snow and Snow
Dominated Ares. For WRIA 11 and 13, Thurston County. Darkest analysis units are the most important (High rating) and lightest analysis units are the least important (Low rating) for the storage of surface flows. [HUSW]. The closer the “high importance” surface storage area to the “rain-on-snow” area the greater effect on reducing downstream flooding. Results are shown in quantiles.
Rain on snow and snow dominated areas important for delivery.
Storage in these areas is important for moderating rain on snow flood events.
Storage in this area is important for moderating rain generated flood events.
Storage for both rain generated and rain on snow flooding events.

Puget Sound Characterization Project: Version 2 Methods, Models and Analysis 18 March 2010
Figure 11. Example of Important Areas for Recharge For WRIA 11 and 13, Thurston
County. [HU5] Darkest analysis units are the most important (High rating) and lightest analysis units are the least important (Low rating) for recharge. Results are in quantiles.
Figure 12. Example of Important Areas for Discharge For WRIA 11 and 13, Thurston
County. ]HU_D] Darkest analysis units are the most important (High rating) and lightest analysis units are the least important (Low rating) for groundwater discharge. Results are in quantiles. The discharge in the area north and west of Eatonville is from shallow subsurface flows due to less permeable till deposits relative to discharge from more permeable aquifer units in alluvial deposits.
Recharge is significant for majority of lowland area due to course-grained deposits.
Recharge is significant in upper watershed due to coarse deposits and snowmelt generated recharge.
These areas score higher, due to groundwater discharge from valley alluvial deposits with relatively greater subsurface storage capacity
This area scores higher due to discharge from shallow, local groundwater flow bodies located on top of “hilly” upland deposits of glacial till. Supports large area of wetlands and lakes.

Puget Sound Characterization Project: Version 2 Methods, Models and Analysis 19 March 2010
The recharge map (Figure 11) demonstrates that recharge is a significant process throughout the lowland group of WRIA 11. It’s importance is not completely evident on the overall importance map (Figure 8). Recharge (Figure 11) is not as important in the area west of Eatonville but discharge of shallow subsurface flow is (Figure 12). Review of the assessment data also indicates a high percentage of depressional wetlands and lakes in this area. Taken together, this information suggests the presence of shallow local groundwater systems that support these aquatic areas through groundwater discharge.
Figure 13. Example of Important Groundwater Discharge Areas Map for Coastal
Landscape Group WRIA 13, Thurston County. Darkest analysis units are the most important (High rating) and lightest analysis units are the least important (Low rating) for groundwater discharge. Results shown in quantiles.

Puget Sound Characterization Project: Version 2 Methods, Models and Analysis 20 March 2010
Step 5: Map ‘Impairment Areas’ and Rank Analysis units by Watershed Process
Key Questions:
What human activities have impaired each watershed process? Where do these activities occur and what is the relative severity of the impairment?
Methods: This step identifies analysis units where human activities are likely
damaging the watershed process. Many human activities affect the physical characteristics of a watershed, and thus, have the potential to impair watershed processes. For example, construction of impervious surfaces, such as roads or buildings, can prevent the recharge of groundwater. This reduces the amount of groundwater available and increases the amount of surface runoff.
In some cases, it is not possible to map the activities that impair the processes. For
example, the databases used do not map the specific locations where wetlands are ditched or streams are channelized. In this instance, we use the land use type as an indicator of the probability that these impairments are present. Thus, urban wetlands are rated as having more of these impairments relative to rural wetlands.
Step 4 of each Appendix, B through G, describes our current understanding of the
relationships between indicators and their effects on each watershed process. The numeric model for identifying impairments results in a relative ranking of each analysis unit within the analysis area from least to most impaired (Figure 14).
GIS analyses: The section on “Models” of each appendix describes the individual
analyses and scoring methods for each model of impairments to a process. After combining various layers of digital data, each analysis unit receives a relative score. This score is grouped into one of four ratings: High, Moderate to High, Moderate, or Low. Table 3 lists the datasets used for these analyses in Puget Sound.
Products: The GIS analyses result in a summary map displaying the rating of
impairments for each analysis unit relative to other analysis units (Figure 14 - 17). The darker the color the higher the level of impairment the analysis unit has relative to other analysis units within the analysis unit.
Example: Impairments to the water process were analyzed for WRIA 11 and 13,
Thurston County. Units within each landscape group were analyzed separately from those in other landscape groups. Thus, the Snow-dominated Mountainous analysis units were compared to one another, as were the analysis units

Puget Sound Characterization Project: Version 2 Methods, Models and Analysis 21 March 2010
Figure 14. Example of Overall Impairments Map for Water Flow Processes, WRIA 11 and 13, Thurston County for Water Process. The darkest pink areas are the most impaired. Results are in quantiles.
Figure 15. Example of Impairments Map for Surface Water Storage for WRIA 11 and 13, Thurston County for Water Process. [HISW]The darkest “pink” analysis units are the most impaired.

Puget Sound Characterization Project: Version 2 Methods, Models and Analysis 22 March 2010
in the Lowland Group. In this way, each landscape unit has analysis units ranked from high to low impairment.
Impairments to the water flow process are displayed as separate components in
order to address potential environmental issues within WRIA 11 and 13, including lowland flooding and low flows in streams. Figure 14 shows the areas that have impaired surface storage. If these areas are located below areas important for delivery (Figure 8) then restoration actions are recommended. If these same areas have low impairment then protection is recommended.
Impairments to recharge and discharge areas are presented in Figures 16 and 17.
The impairments can be compared to the important areas for recharge and discharge shown in Figures 11 and 12 in order to select appropriate land use actions. Table 2 presents the methods for evaluating results from separate components of the water flow assessment.
Figure 16. Example of Imairments to Recharge Areas for WRIA 11 and 13, Thurston County. [HI_R] The darkest analysis units are the most impaired within the landscape unit, and the lightest analysis units are the least impaired. Results shown in quantiles.

Puget Sound Characterization Project: Version 2 Methods, Models and Analysis 23 March 2010
Figure 17. Example of Impairments to Discharge Areas for WRIA 11 and 13, Thurston County . [HI_HD] The darkest analysis units are the most impaired within the landscape unit, and the lightest analysis units are the least impaired. Results shown in quantiles.
This indicates that this large area of shallow discharge has been affected by rural activities which suggests the hydrology of wetland and lakes are at risk.

Puget Sound Characterization Project: Version 2 Methods, Models and Analysis 24 March 2010
Step 6: Identify Analysis units for Protection and Restoration and Recommended
Actions
Key Questions:
What are the environmental issues within your analysis area? Where are the most important analysis units for supporting watershed processes related to these issues? Where are watershed processes still intact or minimally impaired? Where have watershed processes been impaired? What actions can be taken to address watershed scale issues by protecting relatively intact processes and repairing impaired processes This step provides the user with data for initiating the development of a watershed
based management framework (Figure 23). The watershed based management framework consists of four parts: characterize prescribe solutions, take actions, and monitor results. Step 6 addresses the characterize and prescribe solutions portion of the management plan.
A complete characterization requires use of data from landscape assessment of fish
and wildlife and other key watershed processes such as delivery and movement of nutrients, sediment and wood. Phase II of the Puget Sound Characterization Project will provide assessment of fish and wildlife and some key water quality processes.
It is important that the user work with a watershed team, either the Puget Sound
Technical team or local watershed experts, in interpreting and applying the step 6 data correctly. Tables 2 and 3 provide specific examples of using data from individual components of the “water flow process” model to address environmental issues within the watershed. Figures 19, 20 and 21 show the results of that analysis.
Methods: Completion of Steps 4 and 5 produces two sets of maps for each
component of a watershed process. For example, the analysis results include individual sets of maps for the delivery, surface water, and groundwater components. The first map in each set locates analysis units most important for supporting a watershed process, while the second locates analysis units with relative impairment to these processes. The water flow assessment data were placed into four groups of “high, medium high, medium and low”. Data frequency distribution provides the basis for grouping into each category so that the top 25% of the scores were placed in the high, the next 25% in the medium high…).
The final step combines the results of the importance and impairment maps,
resulting in recommended watershed management actions. The watershed management matrix can help in selecting both recommended options for each

Puget Sound Characterization Project: Version 2 Methods, Models and Analysis 25 March 2010
management category (Figure 18) and the appropriate type of action. Each analysis unit has a rating for importance and a rating for impairments that places it into one of the “boxes” in the management matrix.
Figure 18. Watershed Management Matrix. The rating for importance is on the vertical axes, and
rating for impairment is along the horizontal axes. The combination of these two indicates suitability of the analysis unit for protection, restoration, or an area where land use activities will have “less impact to processes.” The suggested categories in each of the sixteen boxes are intended to provide an initial framework for evaluating land use actions. The codes for the rating scores, shown as High (H), Medium High (MH), Medium (M) and Low (L), depict importance ratings in “Red” and impairment ratings in “black.”
Analysis units rating high for importance and low for impairment will be in the upper left
corner of the matrix. These analysis units will be the most suitable candidates for protection, ensuring that the associated watershed process will remain intact. Analysis units rating high for importance and high for impairment will be most suitable for restoration. Focusing restoration in these units will increase the likelihood that associated watershed processes will be restored. Based on the color scheme from the Watershed Management Matrix, a general description of the type of land use activities and protection and restoration actions is presented in the text box on page 26.

Puget Sound Characterization Project: Version 2 Methods, Models and Analysis 26 March 2010
TABLE 2 - Interpreting Map Results- Understanding What Important Areas Do and Possible Actions to Offset Impairments Identified Process Component
Description of Component
Important Areas - Look for : and locate the following features within Hydro Unit
Areas of Higher Impairment Look for: and locate the following land cover types with Hydro Unit
How Impairment Affects Process Component
General Actions if Synthesis Maps Show:
General Actions if Synthesis Maps Show:
DDeelliivveerryy MMaappss – Mountainous Group
The type of precipitation and timing for its movement across the landscape in a hydro unit.
Rain-on-snow & Snow Dominated areas
Loss of Forest Cover in Rain–on-snow and Snow Dominated area.
Increases the rate of snow melt which in turn increases downstream flooding.
Reforest
Minimize logging impacts in rain-on-snow and snow dominated areas.
DDeelliivveerryy MMaappss –– Lowland & Coastal Groups
The type of precipitation and timing for its movement across the landscape in a hydro unit.
Rainfall dominated areas (which would occur throughout the unit)
Impervious surfaces
Prevents infiltration and reduces residence time on the surface, thus allowing precipitation to flow overland and reach streams and wetlands more rapidly.
Re-establish natural cover or use other green infrastructure measures
For new development protect forest cover through clustering of structures, roads, utilities and limit clearing to approximately 35% of a site (forest retained on 65%)
SSttoorraaggee MMaappss –– Mountainous, Lowland and Coastal Group
The relative amount of surface storage in a hydrologic unit
Depressional wetlands and floodplains. For Mountainous groups this will primarily be in alluvial valleys. In lowland groups depressional wetlands are located in terraces and floodplains.
Urban and rural development that intersects areas where depressional wetlands and floodplains are located.
Ditching and draining will reduce storage capacity of wetlands. Diking and channelization also reduces storage of floodplains. In urban areas these impacts are usually greater with the filling, diking and draining of wetlands and floodplains. The net result of these impairments is increased channel velocity and greater erosion and flooding downstream.
For wetlands, re-establish natural hydrology by plugging ditches that drain wetland, and restore natural outlet and native vegetation (to slow water). For floodplains, re-establish overbank flooding by removing dikes/levees or raising incised channel. Also remove any floodplain fill.
Protect and maintain existing condition by preventing development in floodplains or depressional wetlands and limit sediment transport into depressional wetlands by maintaining adequate buffers.

Puget Sound Characterization Project: Version 2 Methods, Models and Analysis 27 March 2010
TABLE 2 - Interpreting Map Results- Understanding What Important Areas Do and Possible Actions to Offset Impairments Identified
Process Component
Description of Component
Important Areas - Look for : and locate the following features within Hydro Unit
Areas of Higher Impairment Look for: and locate the following land cover types with Hydro Unit
How Impairment Affects Process Component
General Actions if Synthesis Maps Show:
General Actions if Synthesis Maps Show:
RReecchhaarrggee MMaappss– Mountainous, Lowland and Coastal Group
The infiltration of surface water into the ground.
Coarse and fine grained surface deposits. Generally, the rate and quantity is greater in coarse grained deposits which includes alluvium (valley bottoms) and outwash deposits.
The amount of impervious surface.
Greater cover and intensity of development (impervious surfaces) significantly reduces the amount of infiltration and recharge that would otherwise occur.
Avoid or minimize impacts to recharge areas through clustering and provide native cover on balance of site to facilitate infiltration. Existing urban development can be retrofitted using green infrastructure measures (replace paving with perme-able surfaces & native cover).
Locate higher intensity development in areas with lower permeability. Otherwise, select land use activities that minimize the use of impervious surfaces. This includes agriculture and clustered low density residential development.
DDiisscchhaarrggee MMaappss –– Mountainous, Lowland and Coastal Group
Areas on the landscape where groundwater moves to the surface in the form of springs, seeps and in floodplains of streams and wetlands.
Slope wetlands in all landscape groups. Alluvial valleys in mountainous areas and broad floodplains in lowland group.
Urban and rural development that intersects areas where alluvial valleys are located and slope wetlands. Location and quantity of wells.
Well pumpage can lower groundwater table and reduce quantity of subsurface water that moves towards and discharges in slope wetlands (usually lower part of hillslopes) and alluvial valleys. Rural and urban development can change the location of where groundwater discharges by installation of roads, ditches, foundations and fill.
Reduce pumpage levels in areas that are important recharge areas. Restore natural discharge patterns by plugging/removing ditches and fill.
Protect and maintain discharge areas by preventing development that will permanently alter natural discharge patterns (impervious surfaces and structures). Other uses such as agriculture should avoid use of ditches in discharge zones.

Puget Sound Characterization Project: Version 2 Methods, Models and Analysis 28 March 2010

Puget Sound Characterization Project: Version 2 Methods, Models and Analysis 29 March 2010
Table 3 – Examples of Addressing Environmental Issues Using Results of Assessment for Water Flow Processes Watershed Issue
Process Component & Landscape Group
Process Component & Landscape Group
Impairment Actions
Lowland Flooding: Rain-on-Snow events
Delivery in Mountainous Group
Storage in Lowland Group
Look for:
Analysis Units ranking high for delivery + greatest area of “rain-on-snow” and “snow dominated” zones. See Figure 8 and 9
Analysis units ranking high for storage in the watershed and located downstream of delivery areas in column 2. See Figure 10
High impairment for delivery areas and low impairment rating for storage areas See Figure 14 and 15
Protect floodplain and depression areas in throughout the watershed and restore forested cover in mountainous group. See Figure 20
High impairment for storage and low for delivery areas See Fig. 14 and 15
Restore depressional, wetland and floodplain storage throughout watershed. See Figure 20.
Table 3 continued. Examples of Addressing Environmental Issues Using Results of Assessment for Water Flow Processes
Important areas for rain on snow and snow dominated processes in upper watershed of WRIA 11 & 13
Overall impairment map above shows high impairment in the rain dominated delivery area and low impairment in the “rain on snow” delivery area.
IImmppaaiirrmmeenntt ttoo ssttoorraaggee
Lower relative impairment for “storage” process in upper alluvial valley but higher in lower reaches
The upper alluvial valley requires a “protection” (darker geen areas) management strategy due to relatively low impairment and high important.
The lower alluvial valley requires a “restoration” (bright yellow) management strategy as does the rain dominated delivery area.
SSttoorraaggee MMaapp Overall Impairments

Puget Sound Characterization Project: Version 2 Methods, Models and Analysis 30 March 2010
Watershed Issue
Process Component & Landscape Group
Process Component & Landscape Group
Impairment Actions
Reduced Base Flows in Streams
Recharge, all Landscape Groups
Discharge, all Landscape Groups
Look for:
Analysis Units ranking high for recharge in Mountainous Group or in upper and mid watershed of Lowland or Coastal Group. See Figure 11
Analysis units ranking high for discharge in floodplains and slope wetlands, and located downgradient of recharge areas in column 2. See Figure 12
High impairment to recharge areas, and low impairment to discharge areas. See Figure 16 & 17
Restore recharge in rural areas through low impact development measures, and elimination of drainage systems (ditches, drain tiles) and stormwater retrofit programs in urban areas. Protect discharge areas. See Figure 21 and 22
High impairment to discharge areas, low impairment to recharge areas. See Fig 16 & 17
Restore floodplain & slope discharge areas by eliminating diversions of discharge flows by drainage systems on slopes and in floodplains. Protect recharge areas. See Figure 21 and 22
Darker blue areas are important for recharge
The red outlined area is important for discharge but not for recharge due to presence of fine grained deposits. This discharge supports creeks & wetlands throughout this area. The yellow outline discharge area is supported, in part, by recharge from up gradient “rain on snow” areas. Both discharge and recharge processes are important in the area outlined by the black circle
IImmppaaiirrmmeenntt ttoo RReecchhaarrggee
IImmppaaiirrmmeenntt ttoo DDiisscchhaarrggee
Overall, the maps suggest that impairment to recharge is focused in urban areas. Upper watershed is not appearing to contribute to any low flow issues. Discharge impairments are more widespread
DDiisscchhaarrggee RReecchhaarrggee
Discharge
Recharge

Puget Sound Characterization Project: Version 2 Methods, Models and Analysis 31 March 2010
Analysis units where protection is a priority (green): Development may be suitable
in analysis units that rate high for importance but have not yet been impaired (dark green). Extra care should be taken, however, to establish land use patterns (i.e. land use types, activities, development policies, standards and regulations) that protect and maintain watershed processes. Analysis units with a lighter green color in the matrix may have a lower rating of relative importance but also play an important role in sustaining down-gradient aquatic ecosystems. In these analysis units the management of land use can include traditional measures for protecting land from human activities (e.g., open space, conservation easements) as well as environmentally friendly infrastructure (clustering, rain gardens, and permeable pavement).
Analysis units best suited for restoration (yellow): These analysis units have some
impairments of a process but also rated high for importance. Zoning and regulations in these analysis units should promote development that restores areas important to watershed processes (excluding heavily urbanized areas). This could include specific measures that allow impacts in analysis units identified as suitable for development to be mitigated in restoration areas. Restoration in “dark yellow” analysis units will have the most significant benefit in restoring watershed processes and aiding in sustaining down-gradient aquatic ecosystems. Restoration activities can involve restoring the natural condition of the site or focus on restoring the process. For instance, restoring the recharge component could involve increasing surface water retention through restoring depression wetlands or floodplain areas or replacing impervious surfaces with permeable pavement and recharge ponds.
Analysis units where further disturbance will have the least impact on watershed
processes (orange and red): Orange and red analysis units have lower levels of importance for watershed processes and higher levels of impairment, and should be considered less sensitive to future impairment. Measures should still be applied at the site scale that protect water quality and quantity functions and significant habitat functions.
GIS display: Combine the final ratings for importance and level of impairment for
each analysis unit and represent them using the following scheme: Green – Analysis units best suited for Protection Yellow - Analysis units best suited for Restoration Orange to Gray – Analysis units where future disturbance have less impact. Product: A map showing management recommendations (or options) for each
analysis unit.
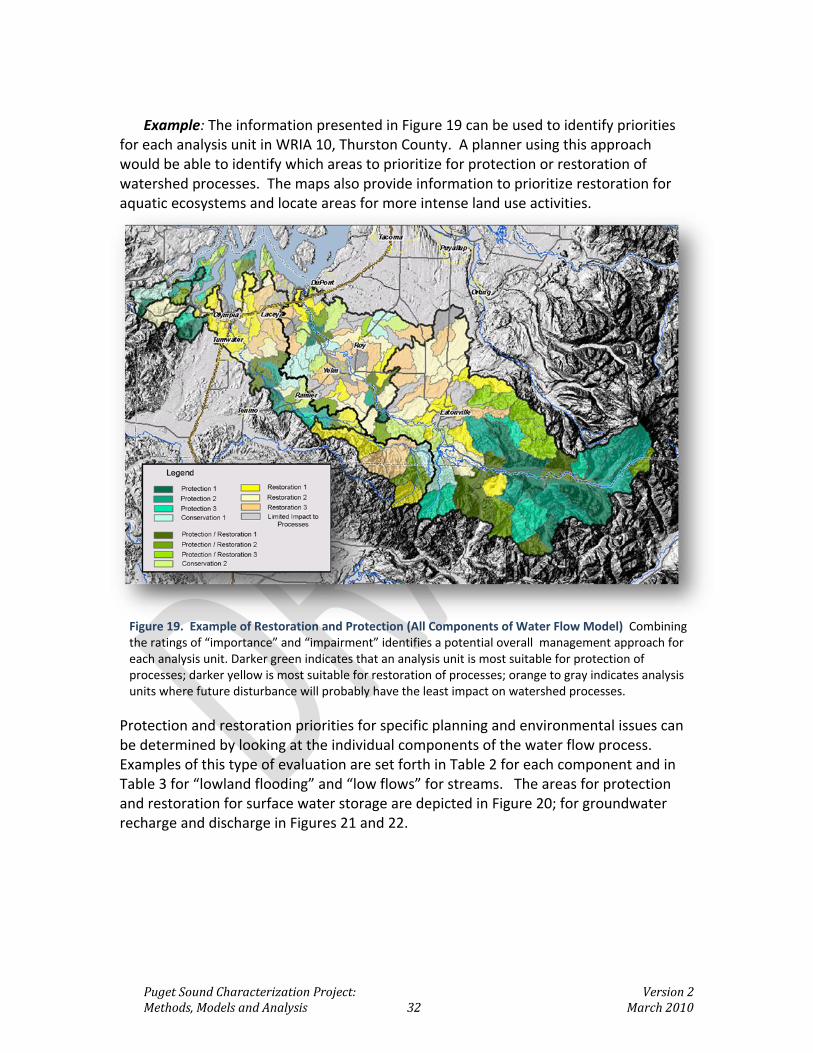
Puget Sound Characterization Project: Version 2 Methods, Models and Analysis 32 March 2010
Example: The information presented in Figure 19 can be used to identify priorities
for each analysis unit in WRIA 10, Thurston County. A planner using this approach would be able to identify which areas to prioritize for protection or restoration of watershed processes. The maps also provide information to prioritize restoration for aquatic ecosystems and locate areas for more intense land use activities.
Figure 19. Example of Restoration and Protection (All Components of Water Flow Model) Combining the ratings of “importance” and “impairment” identifies a potential overall management approach for each analysis unit. Darker green indicates that an analysis unit is most suitable for protection of processes; darker yellow is most suitable for restoration of processes; orange to gray indicates analysis units where future disturbance will probably have the least impact on watershed processes.
Protection and restoration priorities for specific planning and environmental issues can be determined by looking at the individual components of the water flow process. Examples of this type of evaluation are set forth in Table 2 for each component and in Table 3 for “lowland flooding” and “low flows” for streams. The areas for protection and restoration for surface water storage are depicted in Figure 20; for groundwater recharge and discharge in Figures 21 and 22.

Puget Sound Characterization Project: Version 2 Methods, Models and Analysis 33 March 2010
Figure 20. Example of Restoration and Protection (Surface Water Storage). [SW_RP_Q] Combining the ratings of “importance” and “impairment” identifies the most suitable management approach for each analysis unit. Darker green is most suitable for protection of processes; light blue/green is suitable for conservation of processes; darker yellow is most suitable for restoration of processes; orange to gray indicates analysis units where future disturbance will probably have the least impact on watershed processes.
Figures 20 to 22 show a different pattern of restoration and protection for surface water storage and groundwater recharge and discharge relative to Figure 19. A large area to the west and north of Eatonville is a priority for restoration of surface water storage (Figure 20). This area presently has a high concentration of depressional wetlands and lakes that contribute to storage. These results would suggest that local plans and policies promote restoration of storage capacity in this area, which in turn should reduce flooding and erosion downstream. Restoration of recharge (Figure 21), however, is not a significant priority in this same area but is an important priority for a large area within and adjacent to the Cities of Olympia, Tumwater and Lacey. This would suggest implementation of Low Impact Development measures to cluster development, increase floodplain storage and flood energy attenuation by reforestation, and reduce the amount of hard surfaces within these recharge areas. Overall, Figure 19 indicates that the upper watershed for the WRIA 11, is relatively unimpaired and management measures should continue to focus on protecting these areas. For WRIA 13, the upper watershed has a greater degree of impairment including impacts to the storage, recharge and discharge components (Figure 15 to 17). This
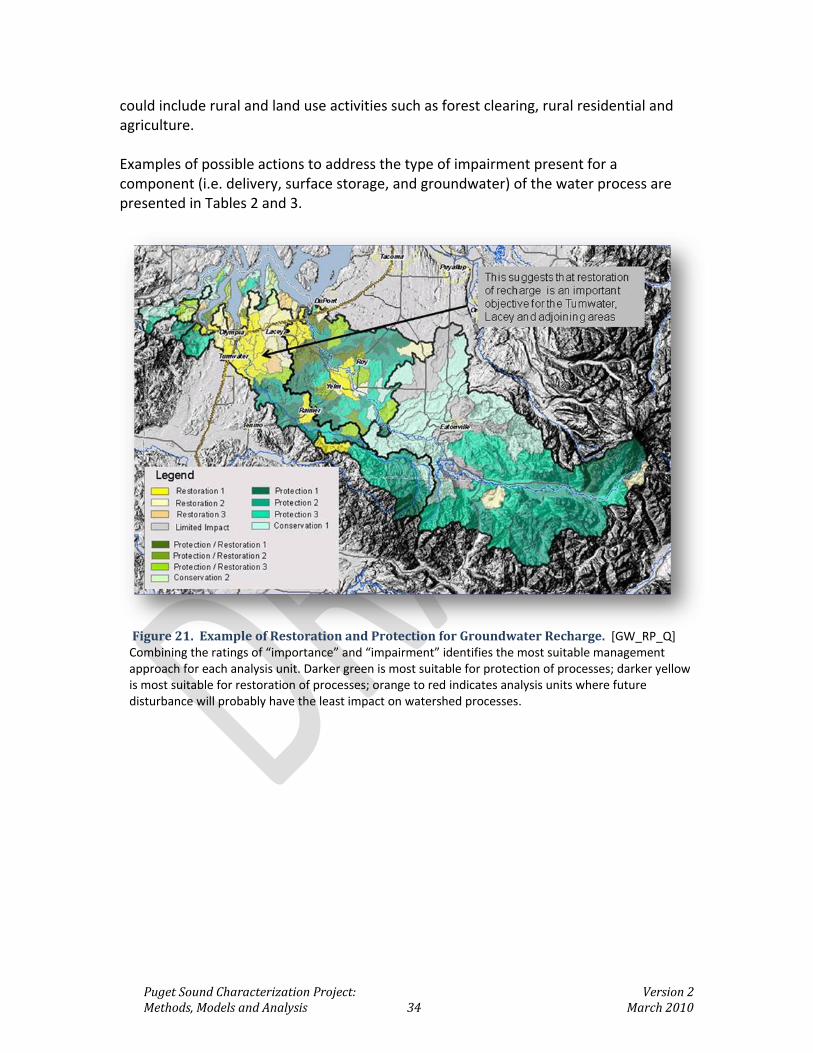
Puget Sound Characterization Project: Version 2 Methods, Models and Analysis 34 March 2010
could include rural and land use activities such as forest clearing, rural residential and agriculture. Examples of possible actions to address the type of impairment present for a component (i.e. delivery, surface storage, and groundwater) of the water process are presented in Tables 2 and 3.
Figure 21. Example of Restoration and Protection for Groundwater Recharge. [GW_RP_Q] Combining the ratings of “importance” and “impairment” identifies the most suitable management approach for each analysis unit. Darker green is most suitable for protection of processes; darker yellow is most suitable for restoration of processes; orange to red indicates analysis units where future disturbance will probably have the least impact on watershed processes.

Puget Sound Characterization Project: Version 2 Methods, Models and Analysis 35 March 2010
Figure 22. Example of Restoration and Protection for Groundwater Discharge. [GW_D_Q] Combining the ratings of “importance” and “impairment” identifies the most suitable management approach for each analysis unit. Darker green is most suitable for protection of processes; darker yellow is most suitable for restoration of processes; orange to red indicates analysis units where future disturbance will probably have the least impact on watershed processes.

Puget Sound Characterization Project: Version 2 Methods, Models and Analysis 36 March 2010
Incorporating Results into Existing Planning Efforts
Framework for Planning
The information generated by this assessment is most useful when applied to a
watershed based planning framework incorporating adaptive management principles (Figure 23). A more detailed discussion of this planning framework is presented in Guidance for Protecting and Managing Wetlands in Western Washington, Volume 2, Chapters 4 and 5 (Granger et al. 2005).
Figure 23. A general framework for planning at the landscape scale. This represents a suggested framework that local governments could use in protecting and managing aquatic ecosystems through land use planning.
The methods described here for mapping important areas and relative impairments
to watershed processes address the first box of Figure 23, “Characterize Watershed Processes.” Planners can then use this information to develop preliminary solutions (box 2, “Prescribe Solutions”) including alternative scenarios for development/ management. Examples include:

Puget Sound Characterization Project: Version 2 Methods, Models and Analysis 37 March 2010
Selecting the appropriate types and intensity of development for different locations
Changing zoning to better protect the ecological services provided by the environment
Identifying the best locations for mitigation
Identifying the types of mitigation needed in different areas
Locating the best areas for cost-effective restoration The “Take Actions” step in Figure 23 implements solutions when scenarios for future
development and management are analyzed, locally reviewed, and accepted. Actions could include adopting updates for comprehensive plans or Shoreline Master Programs with specific provisions based on the analyses.
The final, and most important step in the framework, is monitoring the results of the
adopted plan. This determines if the provisions of the plan are effectively protecting and/or restoring aquatic ecosystems. Feedback from this monitoring effort can be used to modify or “adapt” the plan to correct those aspects that are not meeting the objectives of protection and restoration.
Successful watershed planning uses larger scale information (i.e. the assessment) to
help identify planning solutions at smaller scales. We suggest the use of three planning scales: broad, mid, and fine. Table 4 suggests the type of tool appropriate at each scale.
Scale Tool Information Provided
Broad Scale– Multiple analysis units
Assessment, using our approach, or another similar watershed analysis method.
Identify and map important areas within an analysis area.
Mid Scale– Analysis unit Rating of subunits using scoring models – Appendix B
Identify best areas for protection, restoration, and types of land use activities. Helps evaluate existing restoration projects within a watershed context.
Fine Scale– Reach, catchment or project site within analysis unit
Synthesis Table (see table 4) and site assessment tools including rating of wetland functions, wetland delineation, groundwater monitoring,
Identify specific planning solution at fine scale based on broad and mid-scale information.
Table 4– Integrating information across scales to identify planning solutions
Birch Bay Watershed Management Plan
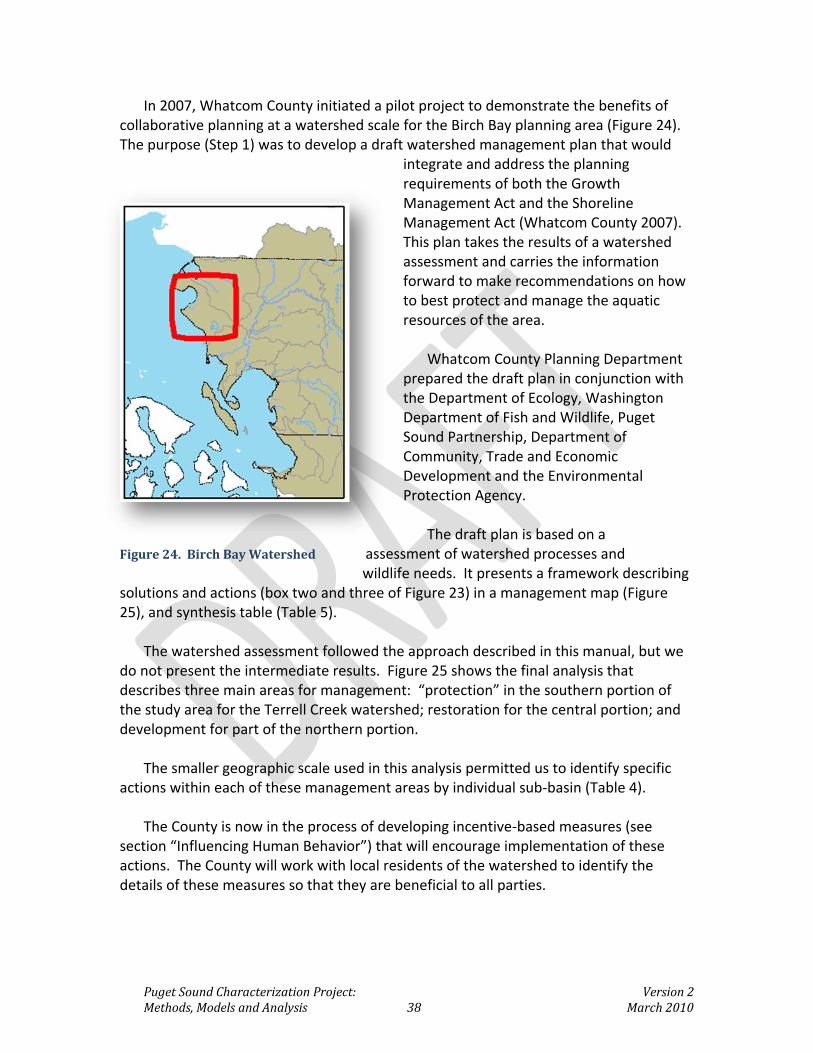
Puget Sound Characterization Project: Version 2 Methods, Models and Analysis 38 March 2010
In 2007, Whatcom County initiated a pilot project to demonstrate the benefits of collaborative planning at a watershed scale for the Birch Bay planning area (Figure 24). The purpose (Step 1) was to develop a draft watershed management plan that would
integrate and address the planning requirements of both the Growth Management Act and the Shoreline Management Act (Whatcom County 2007). This plan takes the results of a watershed assessment and carries the information forward to make recommendations on how to best protect and manage the aquatic resources of the area.
Whatcom County Planning Department
prepared the draft plan in conjunction with the Department of Ecology, Washington Department of Fish and Wildlife, Puget Sound Partnership, Department of Community, Trade and Economic Development and the Environmental Protection Agency.
The draft plan is based on a
Figure 24. Birch Bay Watershed assessment of watershed processes and wildlife needs. It presents a framework describing
solutions and actions (box two and three of Figure 23) in a management map (Figure 25), and synthesis table (Table 5).
The watershed assessment followed the approach described in this manual, but we
do not present the intermediate results. Figure 25 shows the final analysis that describes three main areas for management: “protection” in the southern portion of the study area for the Terrell Creek watershed; restoration for the central portion; and development for part of the northern portion.
The smaller geographic scale used in this analysis permitted us to identify specific
actions within each of these management areas by individual sub-basin (Table 4). The County is now in the process of developing incentive-based measures (see
section “Influencing Human Behavior”) that will encourage implementation of these actions. The County will work with local residents of the watershed to identify the details of these measures so that they are beneficial to all parties.
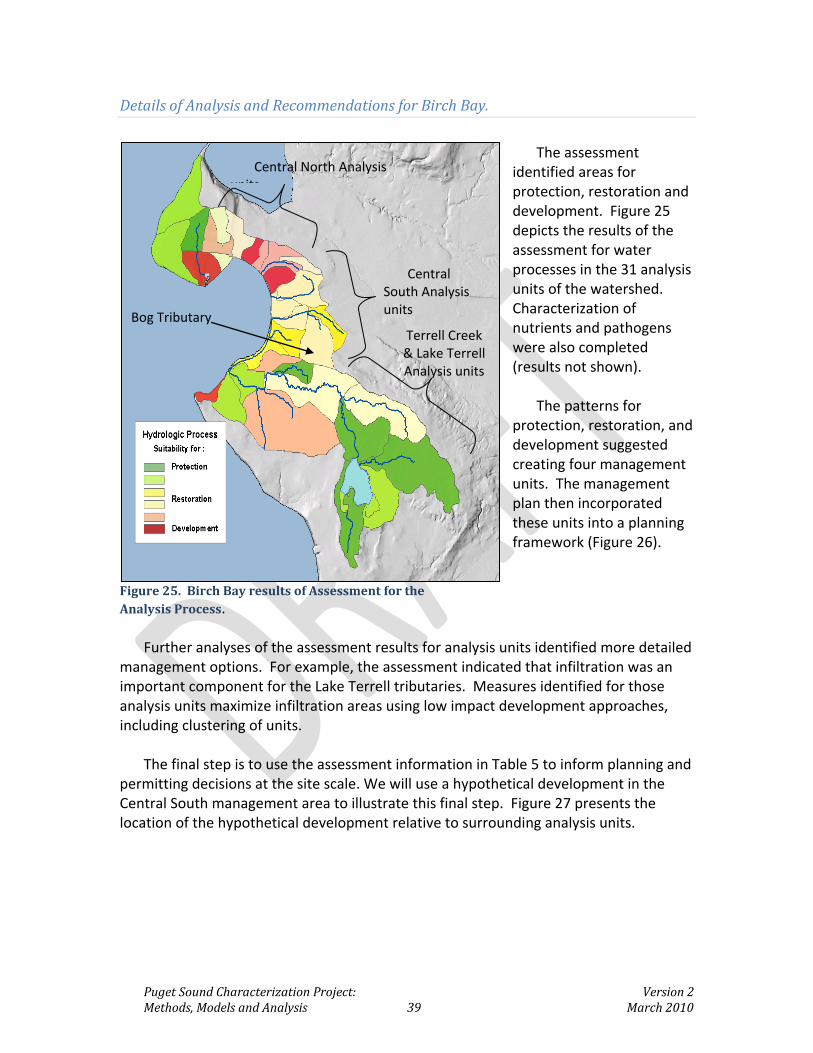
Puget Sound Characterization Project: Version 2 Methods, Models and Analysis 39 March 2010
Central South Analysis units
Terrell Creek & Lake Terrell Analysis units
Central North Analysis units
Bog Tributary
Details of Analysis and Recommendations for Birch Bay.
The assessment
identified areas for protection, restoration and development. Figure 25 depicts the results of the assessment for water processes in the 31 analysis units of the watershed. Characterization of nutrients and pathogens were also completed (results not shown).
The patterns for
protection, restoration, and development suggested creating four management units. The management plan then incorporated these units into a planning framework (Figure 26).
Figure 25. Birch Bay results of Assessment for the Analysis Process.
Further analyses of the assessment results for analysis units identified more detailed
management options. For example, the assessment indicated that infiltration was an important component for the Lake Terrell tributaries. Measures identified for those analysis units maximize infiltration areas using low impact development approaches, including clustering of units.
The final step is to use the assessment information in Table 5 to inform planning and
permitting decisions at the site scale. We will use a hypothetical development in the Central South management area to illustrate this final step. Figure 27 presents the location of the hypothetical development relative to surrounding analysis units.

Puget Sound Characterization Project: Version 2 Methods, Models and Analysis 40 March 2010
Figure 26. Watershed Management Plan for Birch Bay Watershed. Map represents synthesis of assessment of analysis processes from Figure 25 and wildlife assessment. The “yellow, red and green” outlines represent the recommended management approach for these areas with “yellow” representing areas more suitable for restoration of watershed processes and wildlife habitat; “ green” representing an area more suitable for protection of watershed processes and wildlife habitat; and “red” representing an area more suitable for more intense development activities

Puget Sound Characterization Project: Version 2 Methods, Models and Analysis 41 March 2010
Reach or Site Name Rating of Processes
and Functions (Step 4 of this guidance)
Rating of Impairment (Step 5 of this Guidance)
Recommended Solutions
Bog Tributary (see Figure 25– Central South Tributaries)
Processes – Potential is high for water flow process. Important area for groundwater discharge and surface storage (use assessment of important areas for water processes or existing info from basin plans for this rating )
Functions – Potential is high for functions. Historically a depressional wetland complex, including a large forested bog. High species richness for plant, amphibian, bird, fish and mammal species. (For functions use existing information from Priority Habitat and Species program, Salmonscape, local wetland inventories, local wildlife experts and watershed plans. Use wetland rating system results if available)
Processes – Moderate to High. The hydrology of the bog and adjoining wetlands has been altered by ditching and draining. This has reduced groundwater level and storage in the wetland complex, in turn affecting the flow regime in Terrell Creek. (Use assessment of impairments for this rating or existing info from basin plans). Functions - Extensive clearing of forest and scrub-shrub and emergent habitat has reduced species richness (Use wetland rating system tool or similar to qualify impairment of functions at the site scale. Also use existing basin plan information, including proper functioning conditions analysis).
Land Use – Key area for restoration. Measures to transfer develop rights (i.e. Transfer of Development Rights) and/or conservation easements in conjunction with clustering of development units are appropriate to protect and restore this depressional wetland complex. Restoration measures. Restore hydrology by blocking or plugging large ditches draining to the north and west of bog complex (see Figure 19). Decommission smaller ditches in adjoining depression wetlands and replant with scrub-shrub and forested species.
Table 5. Example of Synthesis Table for Birch Bay Watershed. Integrates broad and mid scale information in order to identify solutions at the fine scale (e.g. reach, catchment, and site). This table format applies to any analysis area using watershed information. Paragraphs in “italics” provide guidance for synthesizing information in the table for any watershed (Source: Whatcom County Draft Birch Bay Watershed Planning Pilot Study, 2007)
The hypothetical development is located at the southern edge of the Central South
Management units (Figure 25), in which Restoration is the primary management objective (Table 5). Recommendations at the analysis unit scale call for use of banking to restore wetland functions in the South Central analysis units and use of transfer of development credits to move development away from these important restoration areas. The proposed development site is also within a analysis unit characterized as suitable for development. As part of the management plan, the County identified
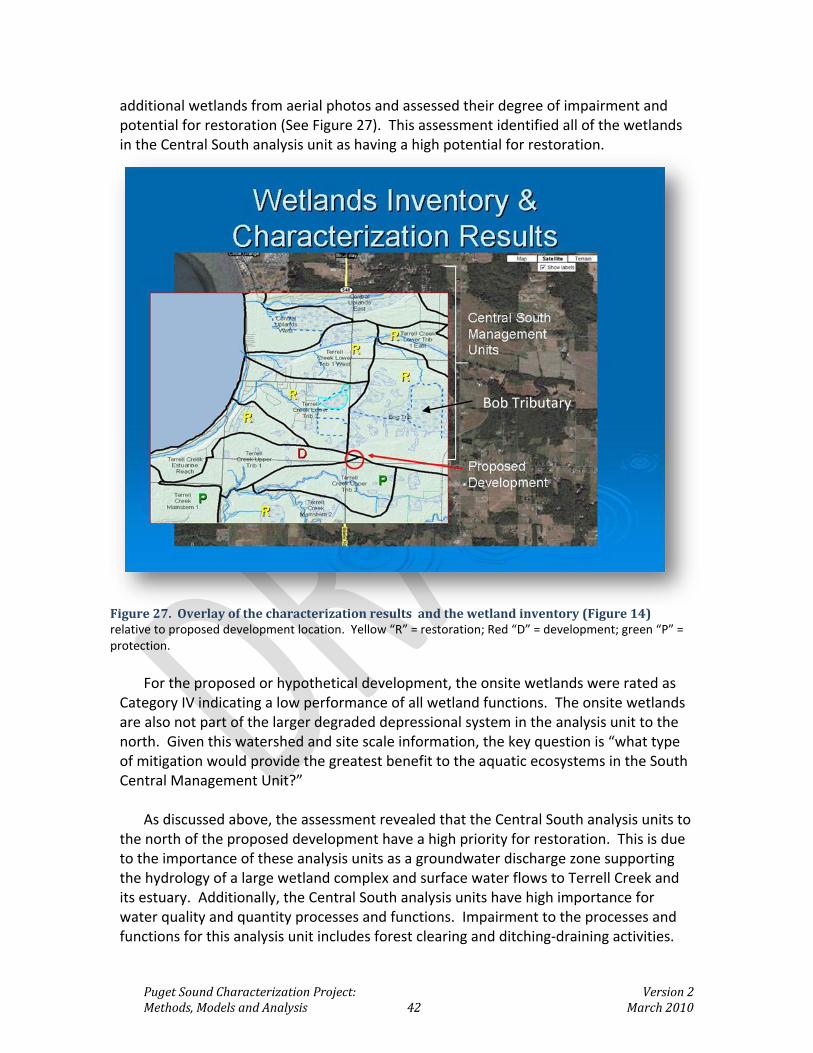
Puget Sound Characterization Project: Version 2 Methods, Models and Analysis 42 March 2010
additional wetlands from aerial photos and assessed their degree of impairment and potential for restoration (See Figure 27). This assessment identified all of the wetlands in the Central South analysis unit as having a high potential for restoration.
Figure 27. Overlay of the characterization results and the wetland inventory (Figure 14) relative to proposed development location. Yellow “R” = restoration; Red “D” = development; green “P” = protection.
For the proposed or hypothetical development, the onsite wetlands were rated as
Category IV indicating a low performance of all wetland functions. The onsite wetlands are also not part of the larger degraded depressional system in the analysis unit to the north. Given this watershed and site scale information, the key question is “what type of mitigation would provide the greatest benefit to the aquatic ecosystems in the South Central Management Unit?”
As discussed above, the assessment revealed that the Central South analysis units to
the north of the proposed development have a high priority for restoration. This is due to the importance of these analysis units as a groundwater discharge zone supporting the hydrology of a large wetland complex and surface water flows to Terrell Creek and its estuary. Additionally, the Central South analysis units have high importance for water quality and quantity processes and functions. Impairment to the processes and functions for this analysis unit includes forest clearing and ditching-draining activities.
Bob Tributary

Puget Sound Characterization Project: Version 2 Methods, Models and Analysis 43 March 2010
Because these activities do not result in permanent changes (e.g. as with impervious surfaces and structures) to processes and functions, they can be restored. The assessment results and management recommendations suggest that protecting the wetlands onsite has less ecological benefit than restoring the degraded wetland ecosystems to the north of the proposed project.
Using the Watershed Planning Framework with Existing State Planning Laws
The methods described in this document can assist planners in meeting the planning
goals for resource protection contained in state and local environmental laws and regulations. This includes the Growth Management Act (Chapter 36.70A.060) the Shoreline Management Act (Chapter 90.58), and the State Environmental Policy Act (Chapter 43.21C). Furthermore, these methods are an acceptable approach to completing a “assessment of functions and ecosystem wide processes” as specified in WAC 173-26-201(3)(d)(i).
Additionally, this framework for watershed planning is useful to non-profit
organizations and other governmental entities that restore, manage, or conserve aquatic resources. A detailed discussion of the application of landscape planning to the protection of wetland ecosystems is presented in chapters 2, 6 and 7 of Granger et al. (2005).
Growth Management Act. The Growth Management Act (GMA) requires local
governments to develop comprehensive plans and to adopt critical area regulations in order to meet the fourteen GMA planning goals. Comprehensive plans are intended to conserve the state’s resource lands protect our environment, and promote economic development that is sustainable (RCW 36.70A.010). Comprehensive plans are intended to be a cooperative and coordinated approach amongst jurisdictions and private parties. The methods presented in this document are ideally suited for helping local governments meet these goals in a cooperative manner because they:
Identify watershed processes operating across jurisdictional boundaries.
Support protection of critical areas by considering important areas for watershed processes, and also identify those areas where development will have the least impacts.
Evaluate the effect of future land use on watershed processes.
Identify watershed processes operating across jurisdictional boundaries.
Support protection of critical areas by considering important areas for watershed processes, and also identify those areas where development will have the least impacts (location of Urban Growth Areas).
Evaluate the effect of future land use on watershed processes.

Puget Sound Characterization Project: Version 2 Methods, Models and Analysis 44 March 2010
This type of information will provide an understanding of the most appropriate
areas for effective protection and restoration, and how existing or future land uses, both within and outside particular jurisdictional boundaries, may impair watershed processes.
Additionally, this guidance will allow local governments to develop Critical Area
Ordinances (CAO’s) that are tailored to their specific landscape. Ecologists have known for some time that natural resources require management at the watershed scale (Dale et al. 2000). Presently, however, many local governments have adopted a generalized set of regulations for critical areas using guidance developed by Ecology for use statewide, which can make watershed-based permit decisions difficult. New federal mitigation rules require a watershed analysis to determine appropriate mitigation sites. The Department of Commerce is updating its administrative rules in 2009 to guide local governments in implementing the GMA, including recommendations to use watershed-based mitigation schemes consistent with the best available science.
Application of this framework to the development or revision of CAO’s would allow
jurisdictions to identify:
both existing and future environmental problems that would affect aquatic resources; and
areas where actions would be most effective in addressing these local/regional environmental problems. This could include identification of areas where specific types mitigation would be most effective in addressing ecosystem problems and areas of lower importance where standard regulatory measures could be relaxed such as buffer widths.
The information can also be used to identify areas best suited for using innovative
measures such as mitigation banks and fee-in-lieu programs.
Shoreline Management Act. The Shoreline Management Act (SMA) states that “shorelines of the state are among the most valuable and fragile of its natural resources and that there is great concern throughout the state relating to their utilization, protection, restoration, and preservation.” Similar to the stated purpose of the GMA, the SMA goes on to state that there is “a clear and urgent demand for a planned, rational, and concerted effort, jointly performed by federal, state, and local governments, to prevent the inherent harm in an uncoordinated and piecemeal development of the state's shorelines.”
Ecology adopted new Shoreline Master Program Guidelines in 2003 that require jurisdictions to incorporate information on the physical, chemical, and biological processes and functions that drive shoreline resources.

Puget Sound Characterization Project: Version 2 Methods, Models and Analysis 45 March 2010
The new guidelines implement the policy of the Shoreline Management Act for the
protection of shoreline natural resources through the protection and restoration of ecological functions and ecosystem-wide processes necessary to sustain these natural resources. The guidelines specifically state that effective management of shorelines depends on sustaining the functions provided by: (1) ecosystem-wide processes (i.e., flow and movement of water, sediment, and organic materials and movement of fish and wildlife); and (2) individual components and localized processes such as those associated with shoreline vegetation, soils, and water movement through the soil and across the land (WAC 173.26.201(2)(c)).
Further, the new guidelines require that SMP policies and regulations ensure “no net loss” of ecological functions necessary to sustain shoreline ecosystems. Updated SMPs must regulate new development in a manner that is protective of existing ecological functions and provide policies that “promote restoration of impaired ecological functions” (WAC 173.26.201(2)(c) and (f)).
Because the shoreline guidelines contain many of the same landscape principles that are addressed in this document, the methods presented for describing and mapping important areas for watershed processes can be useful to local governments updating their SMP. Specifically, under the new guidelines these methods can be used to:
▬ Conduct the assessment of ecosystem-wide processes (WAC 173.26.201(3)(d)(i)).
▬ Identify areas appropriate for restoration and protection as part of the restoration plan element (WAC.173.26.201(2)(f)).
▬ Identify land use designations and development standards that protect ecosystem-wide processes (WAC 173.26.201(3)(f)).
▬ Meet “no net loss” requirements while allowing for mitigation flexibility (WAC 173-26-186(8) and 173.26.201(3)(d)(i)(E).
▬ Address cumulative impacts in developing master programs (WAC 173.26.201(3)(d)(iii).
For more information on the updated SMP guidelines, see: http://www.ecy.wa.gov/programs/sea/SMA/index.html
Other Approaches

Puget Sound Characterization Project: Version 2 Methods, Models and Analysis 46 March 2010
Various methods have been developed to analyze individual aquatic resources and the nearby landscape in which they occur. Battelle developed a method for characterizing and assessing marine shorelines to identify the best areas for restoration (Diefenderfer 2007). Those marine methods were applied in conjunction with the freshwater methods presented in this document for shoreline planning in Jefferson County.
The methods for analyzing the functions and characteristics of individual wetlands have been extensively tested in the State (Hruby et al. 1999, 2000, Hruby 2004a, b). Appendix A-2 of Granger et al. (2005) also discusses other methods that have been used to analyze individual wetland sites. Methods for analyzing specific stream reaches have been developed by natural resources agencies (e.g., NOAA’s properly functioning conditions). However, methods for analyzing the larger geographic scales are only starting to be developed and applied in Washington.
Influencing Human Behavior
The following section is excerpted from the Puget Sound Partnership Habitat Issues Paper, 2008.
Washington currently has a long list of incentives, education and stewardship programs, which may influence human activities in a way that results in positive outcomes for the environment. A summary of those programs is set forth in Appendix P1-2 of the Habitat Issues Paper. It should be noted that this is not an exhaustive list and there may be programs, which should be added to it. With regard to incentive programs, these activities provide landowners with benefits that in turn, induce them to protect or restore the ecosystem processes, structures and functions on their land.
Landowner Incentives Programs include:
(1) Direct Financial Incentives (grants, subsidized loans, cost-shares, leases);
(2) Indirect Financial Incentives (property tax or sales tax relief, such as Public Benefit Rating System programs);
(3) Acquisition of Property and/or Conservation Easements;
(4) Technical Assistance (referrals, education, training, design assistance programs); and
(5) Recognition and certification for products or operations.
Puget Sound has a history of success with landowner incentive programs. For example, many Conservation Districts throughout Puget Sound have been quite

Puget Sound Characterization Project: Version 2 Methods, Models and Analysis 47 March 2010
successful in working with rural landowners and farmers to create and implement individual farm plans. As a result, landowners and farmers have planted and fenced stream buffers and reduced the introduction of nutrients and pathogens to downstream aquatic ecosystems.
Another successful tool is the Public Benefit Rating System program (PBRS), a form of indirect financial incentive. This tool is available today under state law, and has been proven effective in protecting critical habitats in urban and rural areas. For example, King, Clark and Whatcom counties have used the voluntary PBRS program to reduce property taxes in exchange for a landowner granting protective habitat easements and/or restoring habitat on private property.
Conservation Markets encourage the sale of conservation products or credits from private land. Few examples exist for these types of incentives outside of wetland banking, although interest in these programs in growing. (See, e.g., the Ecosystem Services Marketplace program, an innovative water quality trading program designed to reduce stream temperatures in the Willamette Basin; and Green House Gases (GHG) emission cap and trade programs being discussed across the nation).
Stewardship Programs include land sales or exchanges, conservation easements, transfer or purchase of development rights. Acquiring property has the potential to provide long-term protection to habitat resources from a variety of risks. Public agencies, as well as non-governmental organizations such as land trusts and conservancies, often acquire property in one of two ways: acquire the entire property through a fee simple transaction, or, acquire a portion of a property’s rights by either stripping the property of its development rights or acquiring a conservation easement with associated long-term deed restrictions and covenants. Successful examples of such stewardship programs include the Cascade Land Conservancy’s acquisition efforts through its long-term protection plan known as the Cascade Agenda, and the King County and Snohomish County Transfer of Development Rights/Purchase of Development Rights Programs.
Education Programs include public and private outreach and education programs, which are either passive in nature (where a resident simply receives information in the mail or at an event), or active (where training occurs with the expectation that a person will volunteer to protect or monitor some portion of the ecosystem or the health of a species). There are many natural resource education programs designed to be taught in K-12 schools (e.g., education programs designed by state agencies such as WDFW or counties under their NPDES permit programs, and private programs such as Salish Sea Expeditions). There are programs for adults, as well, such as beach-watcher and beach seining volunteer organizations for salmon recovery; watershed-keeper education programs and the like. These programs may result in long-term volunteer engagement in efforts to protect and restore local aquatic systems; however, their effectiveness has yet to be measured on a comprehensive scale.
Puget Sound CharacterizationProject: Version 2 Methods, Models, and Analysis 48 March 2010
References
Bedford, B.L. 1996. The need to define analysis equivalence at the landscape scale for
freshwater wetland mitigation. Ecological Applications 6:57-68. Bedford, B.L. and E.M. Preston. 1988. Developing the scientific basis for assessing
cumulative effects of wetland loss and degradation on landscape functions: Status, perspectives and prospects. Environmental Management 12(5): 751-771.
Beechie, T. and S. Bolton. 1999. An approach to restoring salmonid habitat-forming
processes in Pacific Northwest watersheds. Fisheries Habitat 24:6-15. Beechie, T.J., G. Pess, E. Beamer, G. Lucchetti, and R.E. Bilby. 2003. Chap 8: Role of
watershed assessment in recovery planning for salmon. In: Restoration of Puget Sound Rivers. Eds: D.R. Montgomery, S. Bolton, D.B. Booth, and L. Wall. University of Washington Press. 194-225 pp.
Benda, L., N.L. Poff, D. Miller, T. Dunne, G. Reeves, G. Pess, and M. Pollock. 2004. The
newwork dynamics hypothesis: how channel networks structure riverine habitats. Bioscience 54: 412-427.
Booth, D.B., J.R. Karr, S. Schauman, C.R. Konrad, S.A. Morley, M.G. Larson, and S.J. Burges. 2004. Reviving urban streams: land use, hydrology, biology, and human behavior. Journal of the American Water Resources Association 40(5): 1351-1364
Buffington, J.M., R.D. Woodsmith, D.B. Booth, and D.R. Montgomery. 2003. Fluvial
processes in Puget Sound rivers and the Pacific Northwest. In: Restoration of Puget Sound Rivers. Eds: D.R. Montgomery, S. Bolton, D.B. Booth, and L. Wall. University of Washington Press. 46-78 pp.
Dale, V.H., S. Brown, R.A. Haeuber, N.T. Hobbs, N. Huntly, R.J. Naiman, W.E. Riebsame,
M.G. Turner, and T.J. Valone. 2000. Ecological principles and guidelines for managing the use of land. Ecological Applications 10(3): 639-670.
Department of Ecology Water Quality Program. 2005. Stormwater Management Manual
for Western Washington, Volumes I – V. Publication # 05-10-029 to 05-10-033. Diefenderfer, H.L., K.L. Sobocinski, R.M. Thom, C.W. May, S.L. Southard, A.B. Borde, J.
Vavrinec, and N.K. Sather, Multi-scale analysis of restoration priorities for marine
Puget Sound CharacterizationProject: Version 2 Methods, Models, and Analysis 49 March 2010
shoreline planning. Environmental Management. Submitted December, 2007, In Revision
Fuerstenberg, R. 1998. Needs of Salmon in the City: Habitat in the Urban Landscape. In: Proceedings of the 1st Salmon in the City Conference, May 20-21, 1998. Mt. Vernon, WA.
Frankenstein, G. 2000. Blooms of Ulvoids in Puget Sound. Puget Sound Water Quality Action Team Publication, Office of the Governor. 22 pp.
Frissell, C.A. and S.C. Ralph. 1998. Stream and watershed restoration. In: Naiman, R.J. and R.E. Bilby. River Ecology and Management: Lessons from the Pacific Coastal Ecoregion. Springer, New York, New York. 599-624 pp.
Gersib, R. 2001. The need for process-driven, watershed-based wetland restoration in
Washington State. Proceedings of the Puget Sound Research Conference 2001. Glasoe, S. and A. Christy. 2004. Literature Review and Analysis: Coastal Urbanization
and Microbial Contamination of Shellfish Growing Areas. Puget Sound Action Team Publication #PSAT04-09.
Gove, N.E., R.T. Edwards, and L.L. Conquest. 2001. Effects of scale on land use and
water quality relationships: A longitudinal basin-wide perspective. Journal of the American Water Resources Association 37(6):1721 – 1734.
Granger, T., T. Hruby, A. McMillan, D. Peters, J. Rubey, D. Sheldon, S. Stanley, E.
Stockdale. April 2005. Wetlands in Washington State – Volume 2: Guidance for Protecting and Managing Wetlands. Washington State Department of Ecology. Publication #05-06-008. Olympia, WA.
Hidding, M.C. and A.T.J. Teunissen. 2002. Beyond fragmentation: new concepts for
urban-rural development. Landscape and Urban Planning 58(2/4): 297-308. Hobbie, J.E. (ed). 2000. Estuarine Science: A Synthetic approach to Research and
Practice. Island Press, Washington D.C. 539 p.
Hruby, T. 2004a. Washington State Wetland Rating System for Eastern Washington –
Revised. Washington State Department of Ecology Publication #04-06-015. Olympia, WA.
Hruby, T. 2004b. Washington State Wetland Rating System for Western Washington –
Revised. Washington State Department of Ecology Publication #04-06-025. Olympia, WA.

Puget Sound CharacterizationProject: Version 2 Methods, Models, and Analysis 50 March 2010
Hruby, T., S. Stanley, T. Granger, T. Duebendorfer, R. Friesz, B. Lang, B. Leonard, K.
March and A. Wald. 2000. Methods for Assessing Wetland Functions Volume II: Depressional Wetlands in the Columbia Basin of Eastern Washington. Washington State Department of Ecology Publication #00-06-47. Available at: http://www.ecy.wa.gov/biblio/0006047.html
Hruby, T., T. Granger, K. Brunner, S. Cooke, K. Dublonica, R. Gersib, L. Reinelt, K. Richter,
D. Sheldon, E. Teachout, A. Wald and F. Weinmann. 1999. Methods for Assessing Wetland Functions Volume 1: Riverine and Depressional Wetlands in the Lowlands of Western Washington Part 1 Assessment Methods. Washington State Department of Ecology Publication #99-115. Available at: http://www.ecy.wa.gov/programs/sea/wfap/westernwfapmethods.html#Download
Kauffman, J.B., R.L. Beschta, N. Otting, and D. Lytjen. 1997. An ecological perspective of
riparian and stream restoration in the western United States. Fisheries (5):12-24. King County. 2007. King County Shoreline Master Program, Appendix E: Technical
Appendix (Shoreline Inventory and Characterization: Methodology and Results). Available at: http://www.metrokc.gov/shorelines/shoreline-master-program-plan.aspx
Kruckeberg,A.R., 1991. Natural history of Puget Sound country. University of Washington Press, Seattle Washington. 480 p.
McClain, M.E., E.W. Boyer, C.L. Dent, S.E. Gergel, N.B. Grimm, P.M. Groffman, S.C. Hart, J.W. Harvey, C.A. Johnston, E. Mayorga, W.H. McDowell, and G. Pinay. 2003. Biogeochemical hot spots and hot moments at the interface of terrestrial and aquatic ecosystems. Ecosystems 6:301-312.
McDonnell, J. J., et al. (2007), Moving beyond heterogeneity and process complexity: A
new vision for watershed hydrology, Water Resources Research, 43. Mitsch, W.J. and R.F. Wilson. 1996. Improving the success of wetland creation and
restoration with know-how, time, and self-design. Ecological Applications (6): 77-83.
Naiman, Robert J., and Robert E. Bilby, editors. 1998. River ecology and management:
lessons from the Pacific coastal ecoregion. Springer-Verlag, New York.
Naiman, R.J., T.J. Beechie, L.E. Benda, D.R. Berg, P.A. Bisson, L.H. MacDonald, M.D. O’Connor, P.L. Olson, and E.A. Steel. 1992. Fundamental elements of ecologically healthy watersheds in the Pacific Northwest Coastal Ecoregion. In:
Puget Sound CharacterizationProject: Version 2 Methods, Models, and Analysis 51 March 2010
Watershed Management: Balancing Sustainability and Environmental Change. Eds R.J. Naiman. New York: Springer Verlag. 27-188 pp.
National Research Council (NRC). 1996. Committee on Protection and Management of Pacific Northwest Anadromous Salmonids. Upstream: Salmon and Society in the Pacific Northwest. Washington D.C. National Academy Press. 472 p.
National Research Council. 2001. Committee on Mitigating Wetland Losses. Compensating for wetland losses under the Clean Water Act. Washington, D.C.: National Academy Press. 348 pp.
Poiani, K.A., B.D. Richter, M.G. Anderson, and H.E. Richter. 1996. Biodiversity
conservation at multiple scales: Functional sites, landscapes, and networks. Bioscience 50(2): 133-146.
Preston, E.M. and B.L. Bedford. 1988. Evaluating cumulative effects on wetland
functions: A conceptual overview and generic framework. Environmental Management 12(5): 565-583.
Reice, S.R.,R. Wissmar, R. Naiman. 1990. Disturbance regimes, resilience and recovery of
animal communities and habitat in lotic ecosystems. Environmental Management 14(5):647-659
Reid, L.M. 1998. Cumulative watershed effects and watershed analysis. In River Ecology and Management. Lessons from the Pacific Coastal Ecoregion. Springer, New York. 705 pp.
Roni, P., T.J. Beechie, R.E. Bilby, F.E. Leonetti, M.M. Pollock, and G.R. Pess. 2002. A
review of stream restoration techniques and a hierarchical strategy for prioritizing restoration in Pacific Northwest watersheds. North American Journal of Fisheries Management 22. 1-20 pp.
Ruckelshaus, M.H. and M.K. McClure (coordinators). 2007. Sound Science: Synthesizing
ecological and socioeconomic information about the Puget Sound Ecosystem. Prepared in cooperation with the Sound Science collaborative team. U.S. Department of Commerce, National Oceanic & Atmospheric Administration (NMFS), Northwest Fisheries Science Center, Seattle, Washington. 93 p.
Shreffler, D.K. and R.M. Thom. 1993. Restoration of urban estuaries: new approaches for site location and design. Prepared for: Washington State Department of Natural Resources, Aquatic Lands Division, Olympia Washington. Battelle Laboratories. 107 pp.
Simenstad, C., M. Logsdon, K. Fresh, H. Shipman, M. Detheir, L. Newton. 2006.
Conceptual model for assessing restoration of Puget Sound nearshore

Puget Sound CharacterizationProject: Version 2 Methods, Models, and Analysis 52 March 2010
ecosystems. Puget Sound Nearshore Partnership Report No. 2006-03. Published by the Washington Sea Grant Program, University of Washington, Seattle, Washington. Available at http://pugetsoundnearshore.org.
Spence, B. C., G. A. Lomnicky, R. M. Hughes, and R. P. Novitzki. 1996. An ecosystem approach to salmonid conservation. Draft report No. TR-4501-96-6057. ManTech Environmental Research Services Corporation, Corvallis, Oregon.
Stanley, S., J. Brown, and S. Grigsby. 2005. Protecting Aquatic Ecosystems: A Guide for Puget Sound Planners to Understand Watershed Processes. Washington State Department of Ecology. Publication #05-06-027. Olympia, WA.
Stanley, S and S. Grigsby. October 2008. Watershed Assessment and Analysis of Clark County, Washington. Final. Washington State Department of Ecology Publication. Olympia, Washington.
University of Washington (UW) Urban Ecology Research Lab. 2008. Puget Sound Future
Scenarios. Draft report, January 2008. Seattle, Washington. 68 p. Available at: http://online.caup.washington.edu/projects/futurewithout/pdfs/scenarios_report.pdf
Vaccaro, J.J., A.J. Hansen Jr., and M.A. Jones. 1998. Landscape Framework of the Puget Sound Aquifer System, Washington and British Columbia. Part of the Regional Aquifer-System Analysis – Puget- Willamette Lowland. U.S. Geological Survey Professional Paper 1424 – D, 77 pp.
Whatcom County Planning and Development Services, 2007. Birch Bay Watershed
Planning Pilot Study. Available at: http://www.co.whatcom.wa.us/pds/shorelines_critical_areas/workproducts.jsp
Winter, T.C. 1988. Conceptual framework for assessment of cumulative impacts on the
hydrology of non-tidal wetlands. Environmental Management 12:605-620. Winter, T.C. 2001. The concept of hydrologic landscapes. Journal of the American
Water Resources Association. 37(2): 335-349. Winter, T.C., J.W. Harvey, O.L. Franke, and W.M. Alley. 1998. Ground Water and
Surface Water: A Single Resource. U.S. Geological Survey Circular 1139. 79 pp.
Williams, G.D., and R.M. Thom. 2001. Marine and Estuarine Shoreline Modification Issues. Prepared by Battelle Marine Science Laboratory. Prepared for Washington Department of Fish and Wildlife, Washington Department of Ecology, and Washington Department of Transportation. Sequim, WA. 136 p. Available at http://wdfw.wa.gov/hab/ahg/finalsl.pdf.