puget sound watershed characterization...
TRANSCRIPT
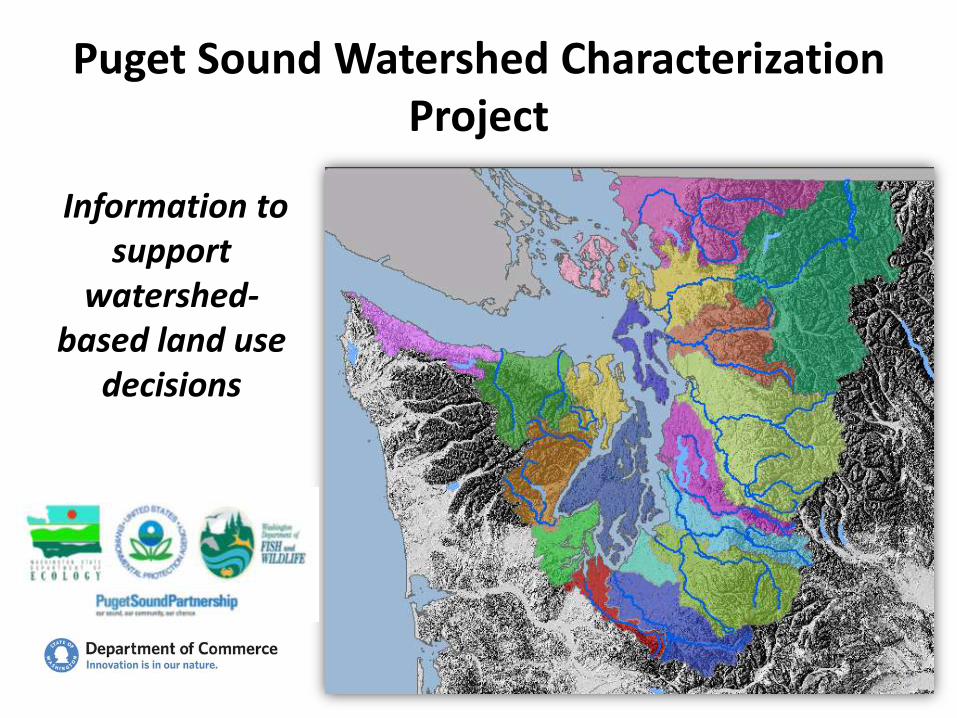
Information to support
watershed-based land use
decisions
Puget Sound Watershed Characterization Project
1

Concerns that have been expressed regarding PS Characterization
From meetings with EPA, letters, Habitat Advisory Committee comments we have heard:
• Concern that PS Watershed Characterization is
inconsistent with and should not supplant Salmon Recovery Plans
• Tribes need to be engaged in PS Watershed Characterization - bring in local data to improve results
• Concerns with Habitat Assessments done by WDFW

Focus of this meeting
– Discuss Tribal concerns regarding the Puget Sound Watershed Characterization
– How PS Watershed Characterization might support Salmon Recovery efforts.
– Discuss the roles and potential applications of watershed characterization and salmon recovery plans in land use planning and policy.
– Initiate conversations of how WCTAT should work with tribal staff to incorporate finer scale data and assessments into local plans being developed in conjunction with the WCTAT.
Overview of PS Characterization and initial applications of assessments to local planning efforts
Who is using currently PS Characterization. Who will?
Integrating assessments and other data to provide guidance in local planning: current application – Kitsap County Nisqually integration work – initial analysis
Discussion on how to bring finer-scale tribal and local data into assessment framework – efficient and effective.
PUGET SOUND WATERSHED CHARACTERIZATION
Brief Overview

The Puget Sound Watershed Characterization Project
• A multi-agency effort to provide land use planners with a watershed context for decision making – Comprehensive Plan updates – Shoreline Master Program – Sub-area plans
• A resource for conservation planners and restoration practitioners across Puget Sound. – Inform mitigation or restoration design at coarse scale – TDR programs – Conservation easements

Identify Important Areas for Supporting Processes
6
Infiltration & Recharge
Storage
Groundwater discharge
Delivery of water
Longshore drift
Objectives of Characterization
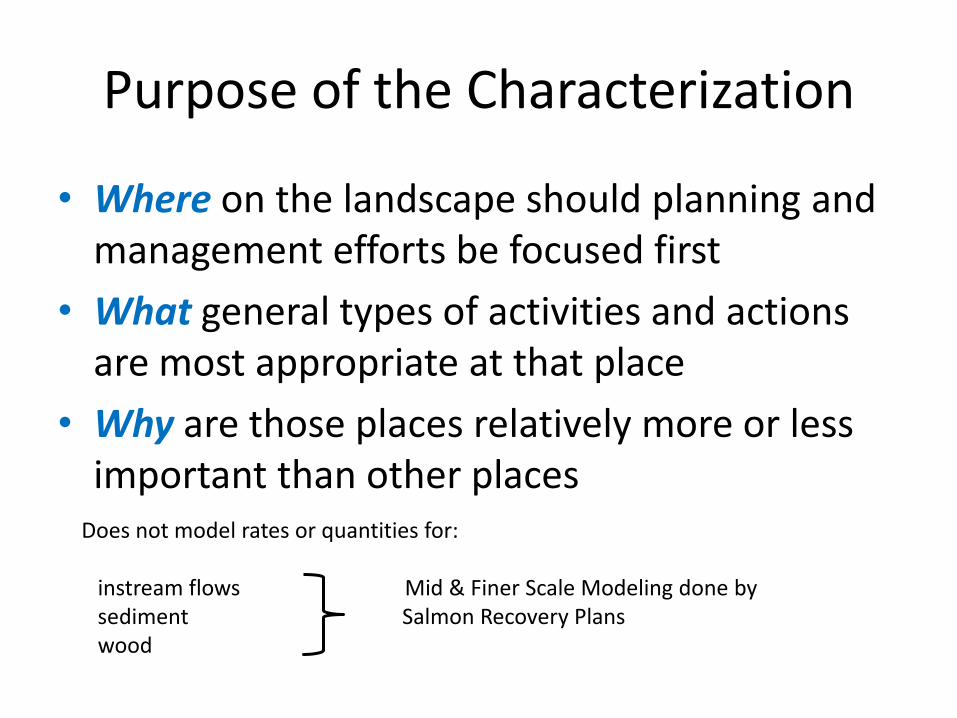
Purpose of the Characterization
• Where on the landscape should planning and management efforts be focused first
• What general types of activities and actions are most appropriate at that place
• Why are those places relatively more or less important than other places
Does not model rates or quantities for: instream flows Mid & Finer Scale Modeling done by sediment Salmon Recovery Plans wood

Helps protect/restore processes that maintain healthy stream systems
Ecosystem Services:
..such as water and sediment movement at the watershed scale
..such as a stream channel or estuary delta
Mid Scale
..such as habitat for birds
Fine Scale
Broad Scale
8
Broad scale – water flow assessment
Mid & fine scale - In stream flows modeled by Salmon recovery plan
Water Flow model establishes overall land-use recommendations

Complements Salmon Recovery Efforts Broad scale – water flow assessment
Mid & fine scale - Salmon recovery plan, using finer scale data, identifies specific location & design of stream restoration
Water Flow assessment deals with upland land use that controls the delivery & movement of water to streams
Yellow colors tell planners that land-use practices should support restoration of watershed processes Green colors indicate that land-use practices should continue protecting watershed processes

Puget Sound Watershed Characterization
Assessment of: Water Flow & Water
Quality Processes – Vol.1 Terrestrial & Freshwater
habitats – Vol. 2 Marine Shoreline habitats –
Vol. 2
Currently developing a Multi Scale Framework – Integrate & Interpret
assessments and other important local data across spatial scales – Vol. 3
10
WATER RESOURCES ASSESSMENTS Volume 1

Water Resources Assessments • Water Flow Importance and Degradation models for
– Delivery + Movement + Loss
• Water Quality Export Potential and Degradation models for
– Nitrogen – Phosphorus – Sediment – Metals – Pathogens
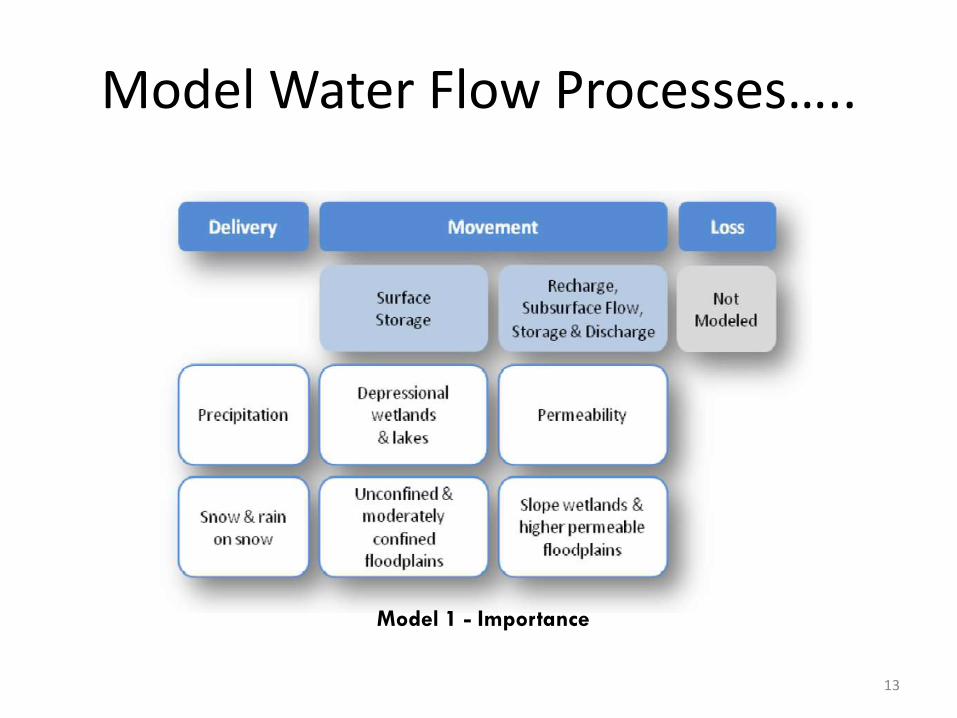
Model Water Flow Processes…..
Model 2 13
Model 1 - Importance

Model Water Flow Processes…..
Model 2 14
Model 2 – Degradation to Water Flow
Processes
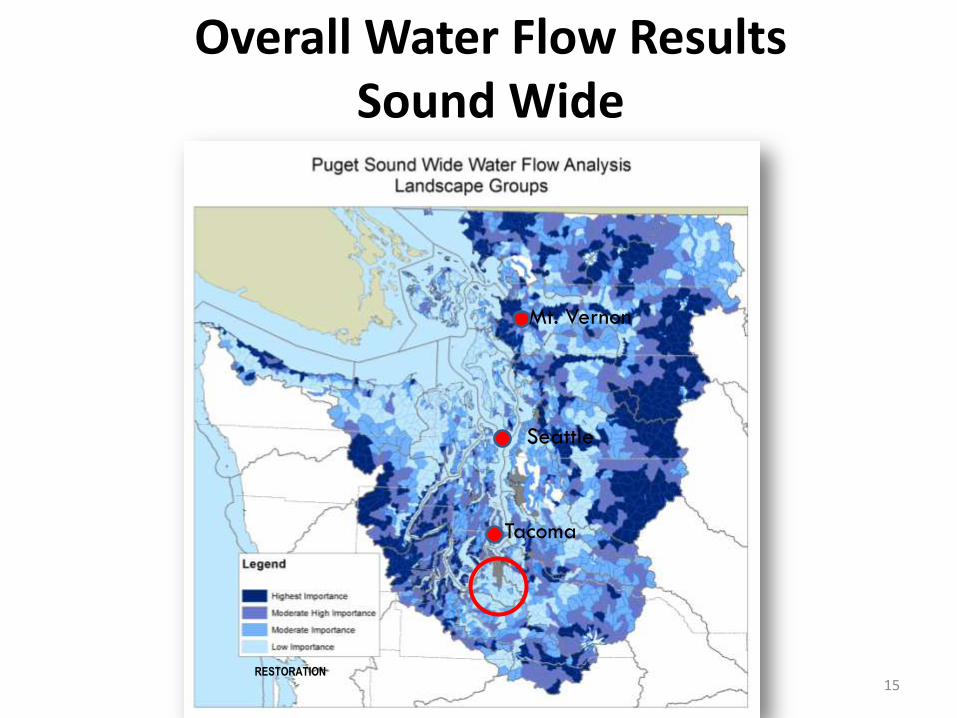
Overall Water Flow Results Sound Wide
15 RESTORATION
Seattle
Mt. Vernon
Tacoma


Combine Importance and Degradation models for certain planning scenarios
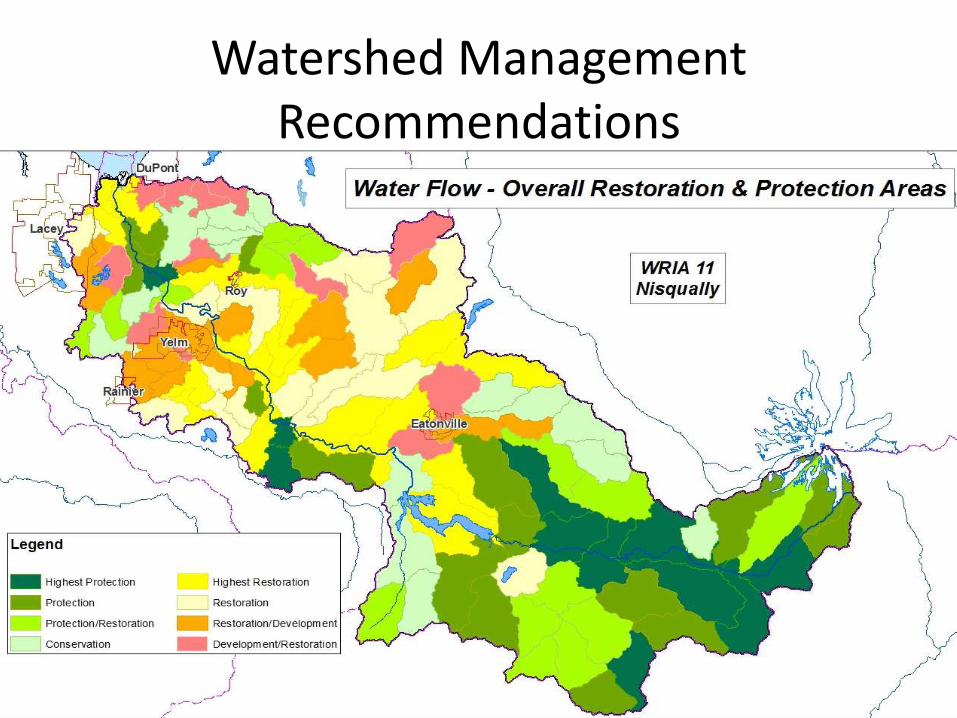
Watershed Management Recommendations

Complements Salmon Recovery Efforts Broad scale – water flow assessment
Mid & fine scale - Salmon recovery plan, using finer scale data, identifies specific location & design of stream restoration
Water Flow assessment deals with upland land use that controls the delivery & movement of water to streams
Yellow colors tell planners that land use practices need to be changed. Green colors indicate that current practices are OK

Water Quality Models
Source – Sink Models for: • Sediment • Phosphorus • Metals • Nitrogen • Pathogens
Export Potential – how readily a given AU can deliver sediment (or N, Metals, etc.) based on landscape features.
Degradation - N-SPECT model that characterizes the degree of existing degradation to processes (sediment, N, Metals, etc.) based on land-use type.
Can combine the two models to provide guidance on which areas to prioritize
Protection or Restoration actions
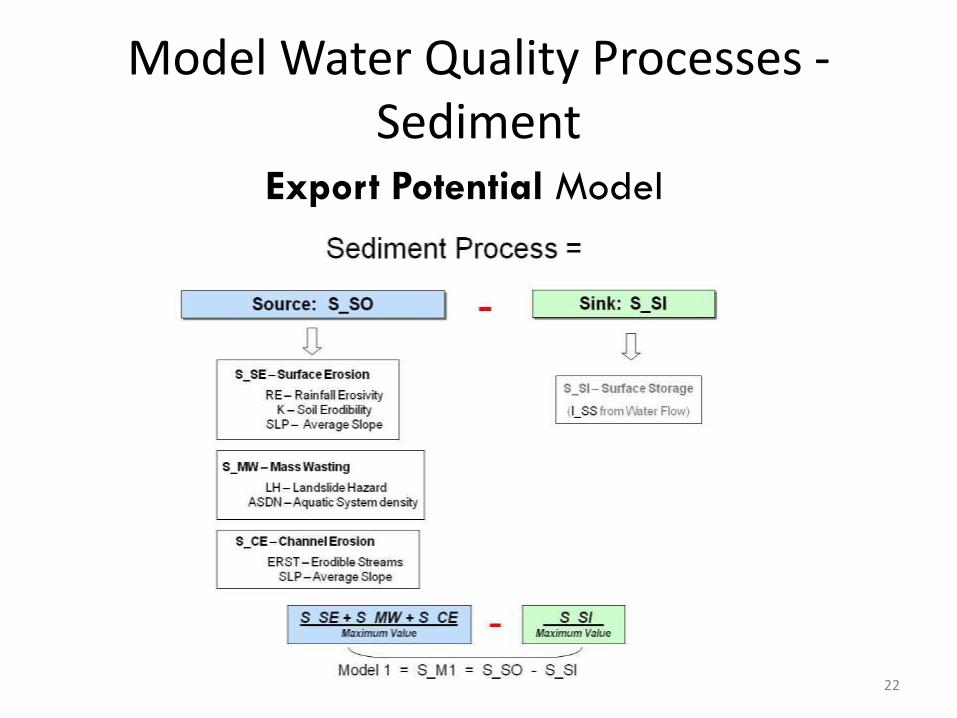
Model Water Quality Processes - Sediment
Model 2
Export Potential Model
22
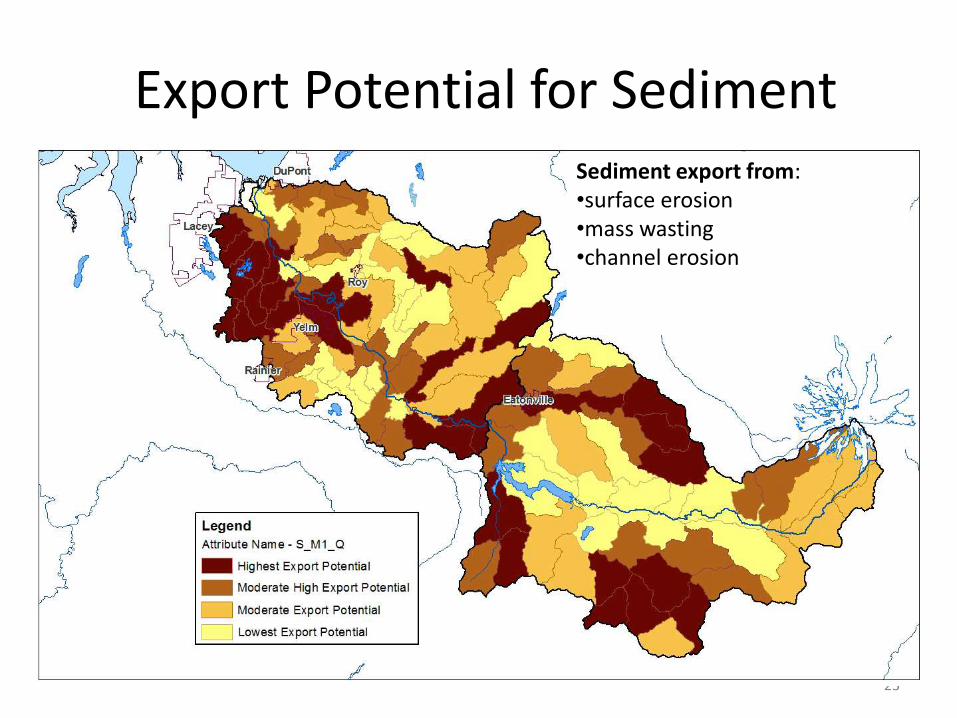
Export Potential for Sediment
23
Sediment export from: •surface erosion •mass wasting •channel erosion
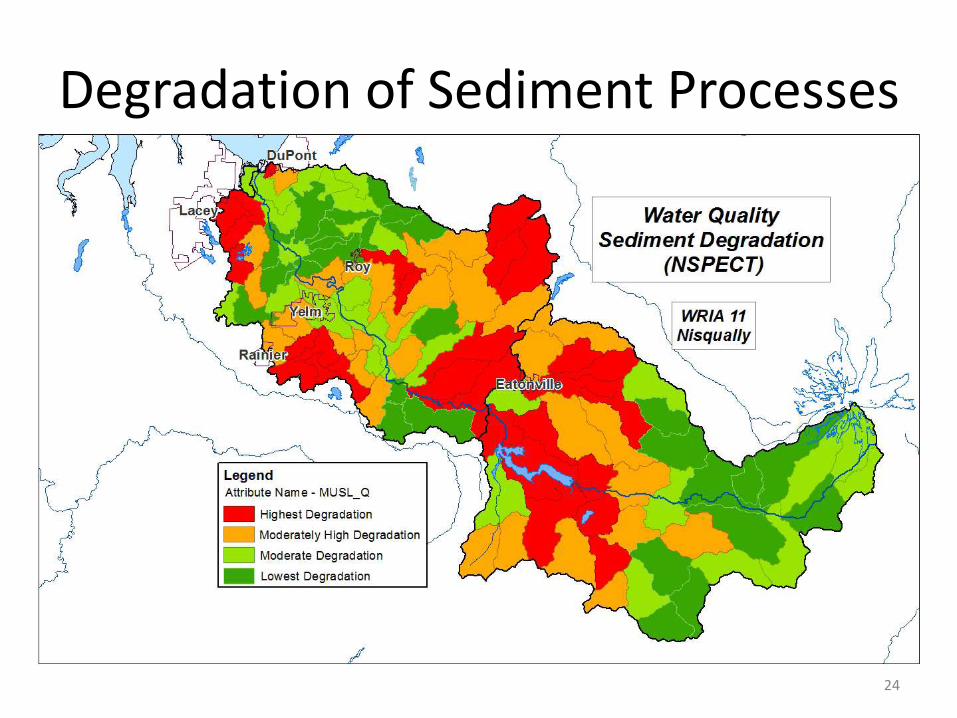
Degradation of Sediment Processes
24
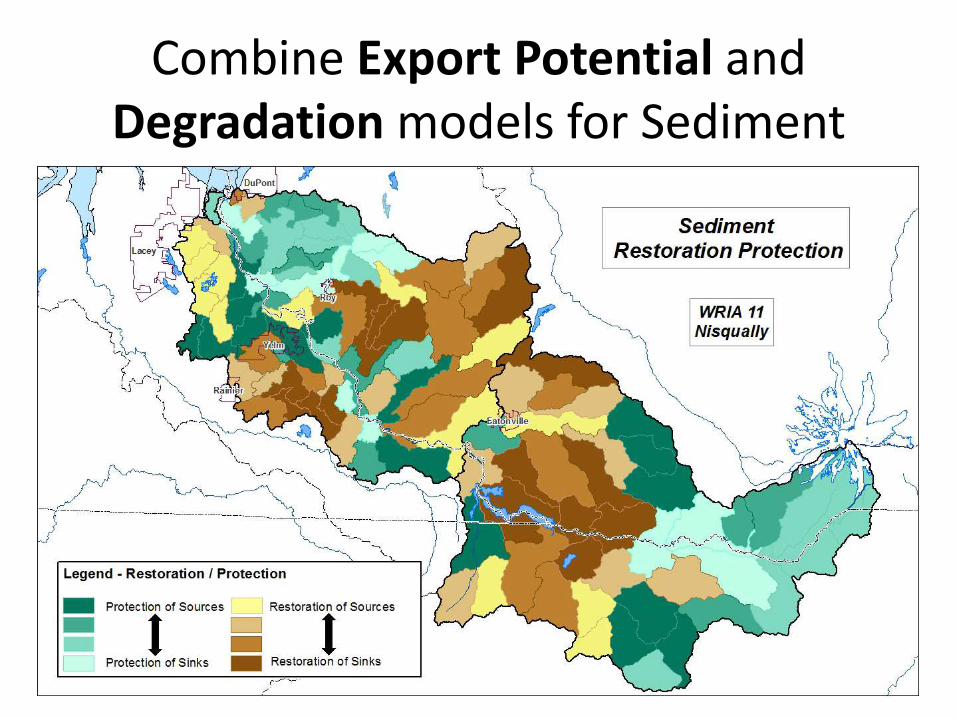
Combine Export Potential and Degradation models for Sediment
25

HABITAT RESOURCES ASSESSMENTS
Volume 2
Habitat Resources
Three Models
• Terrestrial Habitat
• Freshwater (Lotic) Habitat
• Marine Shoreline Habitat

highest relative value = last place to put new houses
lowest relative value = first place to put new houses 0
100
Relative Conservation Value

Terrestrial Assessment

Index
Priority Habitats
and Species
Landscape Integrity
Terrestrial Assessment Model
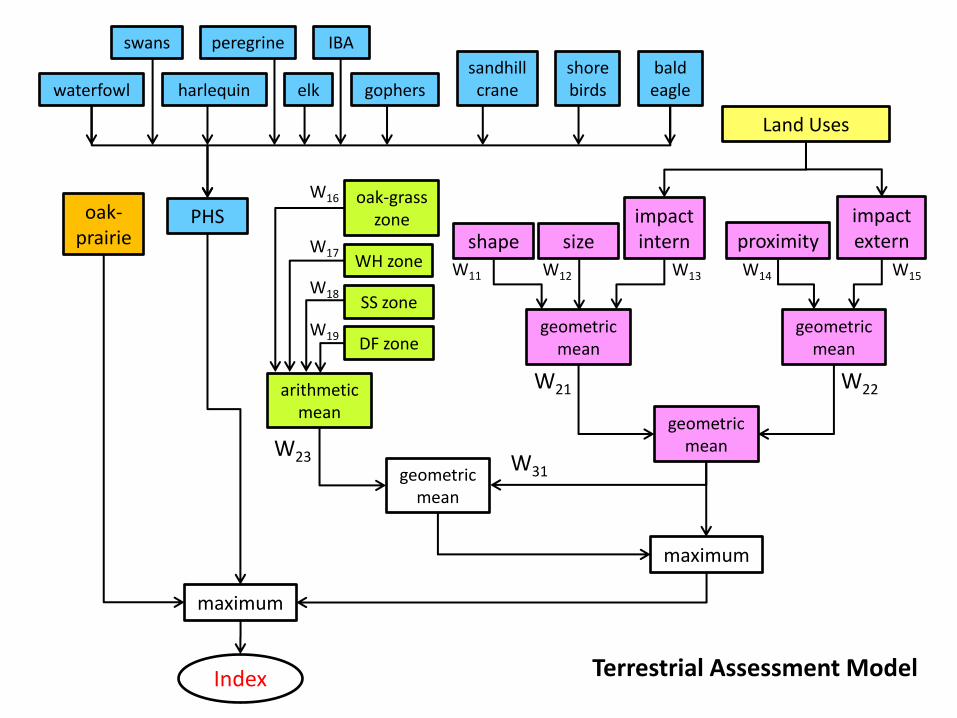
Terrestrial Assessment Model
shape impact intern proximity
impact extern
geometric mean
geometric mean
size
arithmetic mean
oak-prairie
PHS
maximum
geometric mean
maximum
SS zone
oak-grass zone
DF zone
WH zone
Index
waterfowl
swans
sandhill crane
shore birds gophers
IBA peregrine
bald eagle harlequin elk
W22 W21
W14 W15 W11 W13 W12
W31
W23
W16
W17
W18
W19
Land Uses
geometric mean
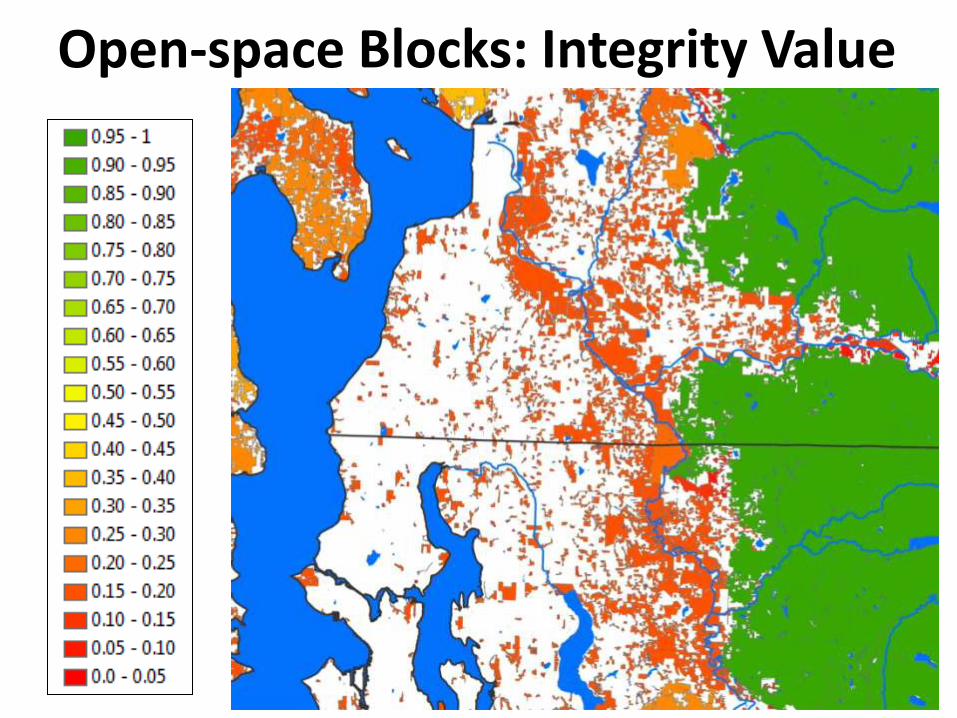
Open-space Blocks: Integrity Value

Intersection with Analysis Units
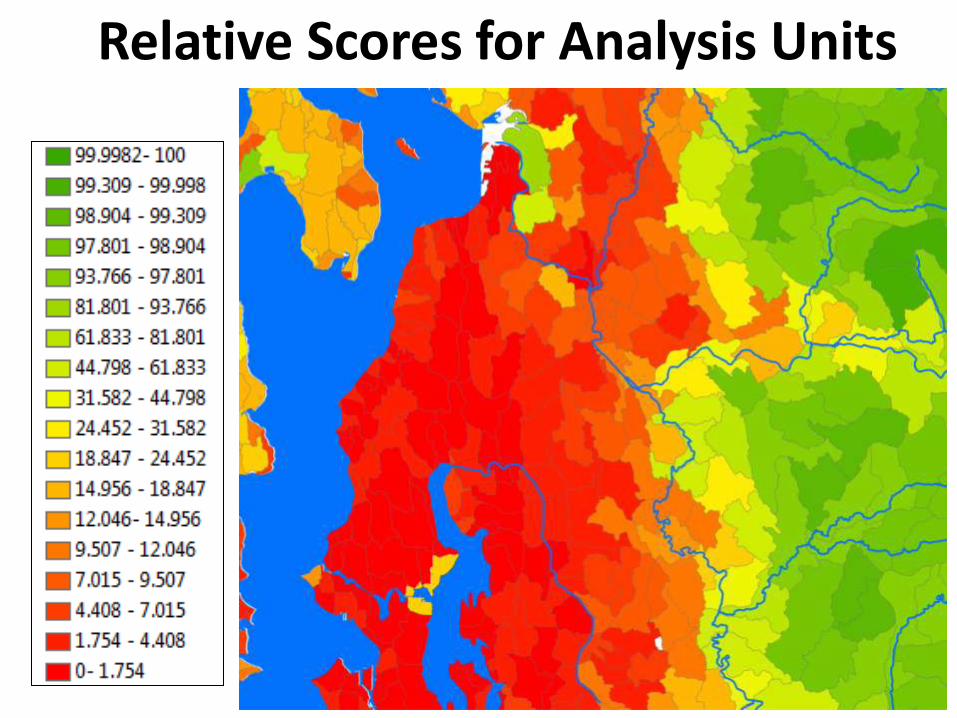
Relative Scores for Analysis Units

Freshwater Assessment

Index
Accumulative Downstream
Habitats
Salmonid Habitats
Hydro-geomorphic
Features
Freshwater Index

Upstream and Downstream
A

Index
Accumulative Downstream
Habitats
Salmonid Habitats
Hydro-geomorphic
Features
Freshwater Index

Local Habitats
Index
Accumulative Downstream Habitats
Salmonid Habitats
Hydrogeomorphic Features
Wetland Density
Floodplain Density
Habitat Quality
Stock Status
Ecological Integrity
IP models
Local IBI
Upstream IBI
Species Presence

Wetlands & Floodplains
Accumulative Downstream Habitats
Salmonid Habitats Index

Freshwater: Sum of Attributes
Seattle
Bellingham
Serves many “functions”
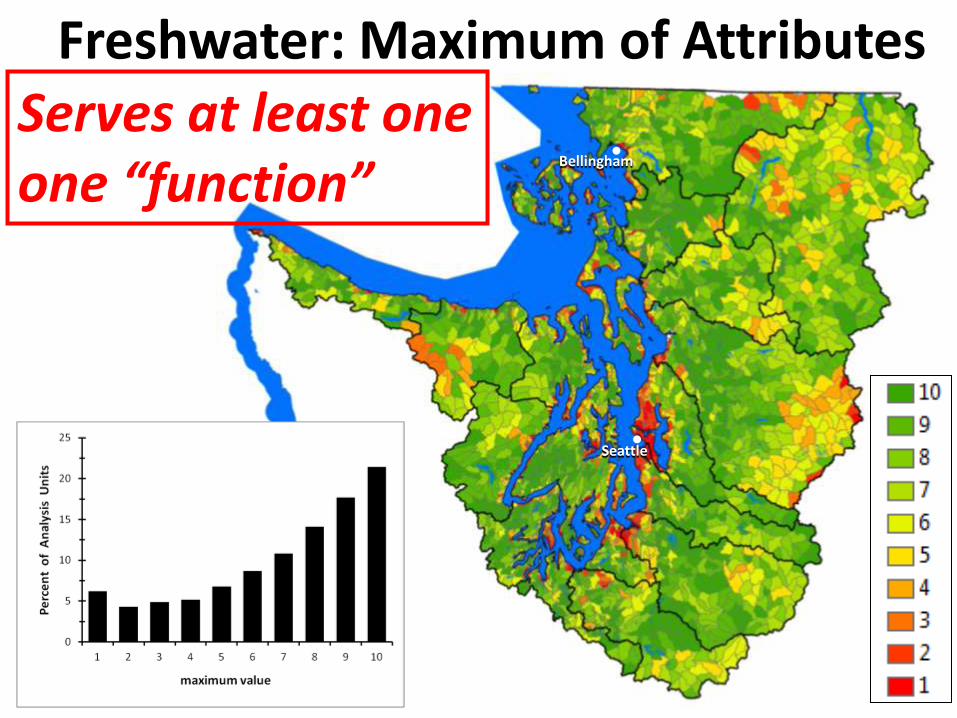
Freshwater: Maximum of Attributes
Seattle
Bellingham
Serves at least one one “function”
Marine Shorelines Assessment

Spatial Units
land side: 400 m
marine side: 400 m or low-low tide
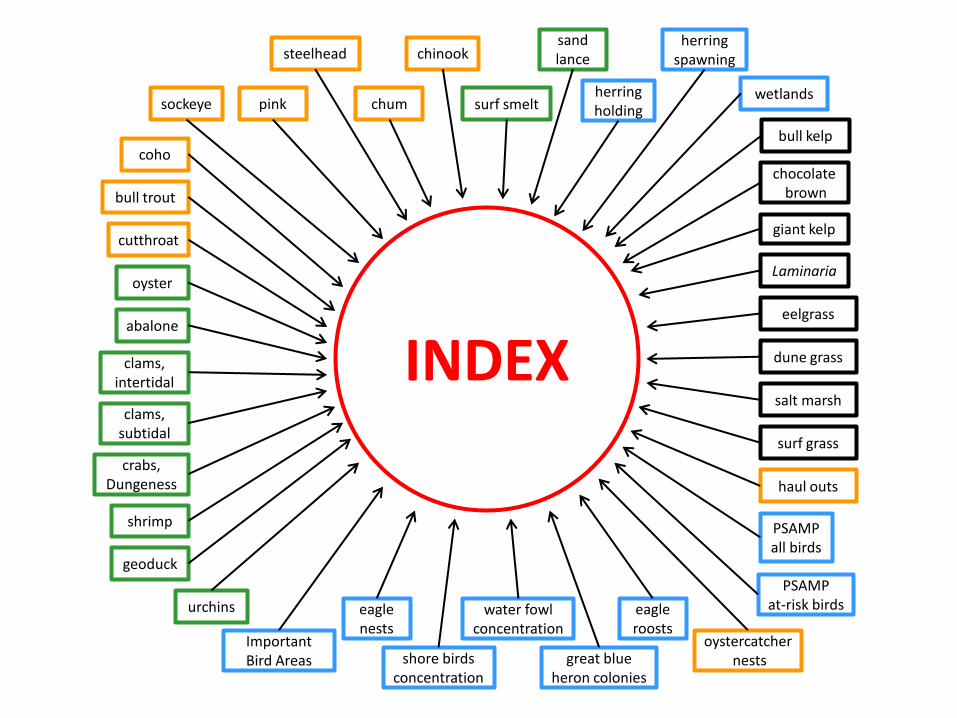
INDEX clams, intertidal
abalone
crabs, Dungeness
urchins
shrimp
oyster
herring holding
herring spawning
surf smelt
sand lance
PSAMP all birds
PSAMP at-risk birds water fowl
concentration
shore birds concentration
eagle roosts
oystercatcher nests great blue
heron colonies
Laminaria
giant kelp
dune grass
bull kelp
chocolate brown
salt marsh
surf grass
bull trout
chinook
chum
cutthroat
sockeye pink
coho
steelhead
eagle nests
geoduck
clams, subtidal
haul outs
wetlands
eelgrass
Important Bird Areas


Results - Average of all Components
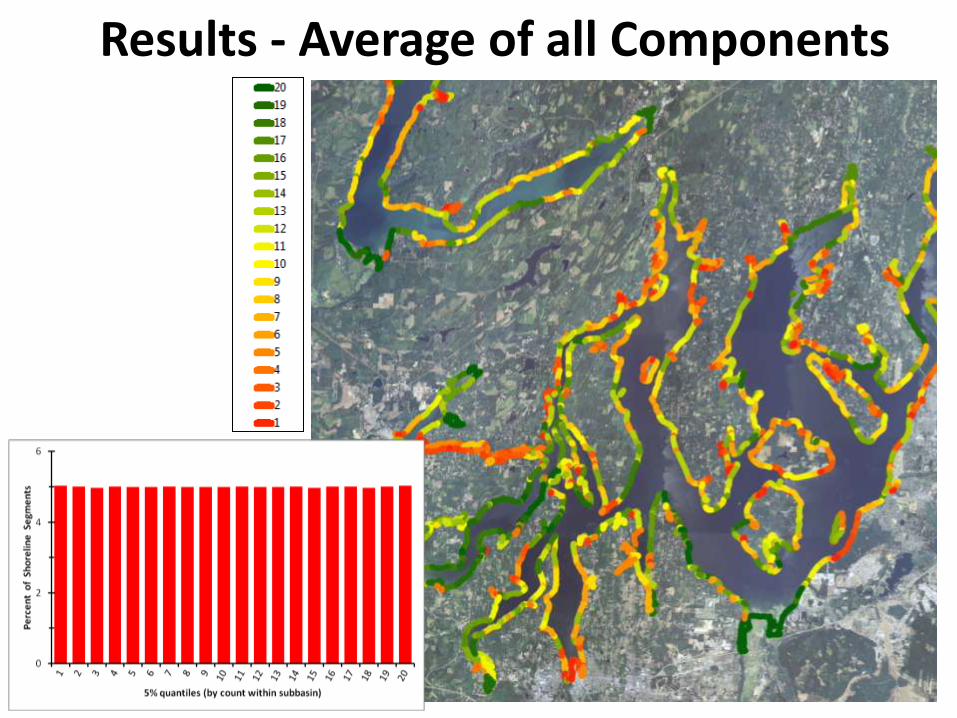
Results - Average of all Components
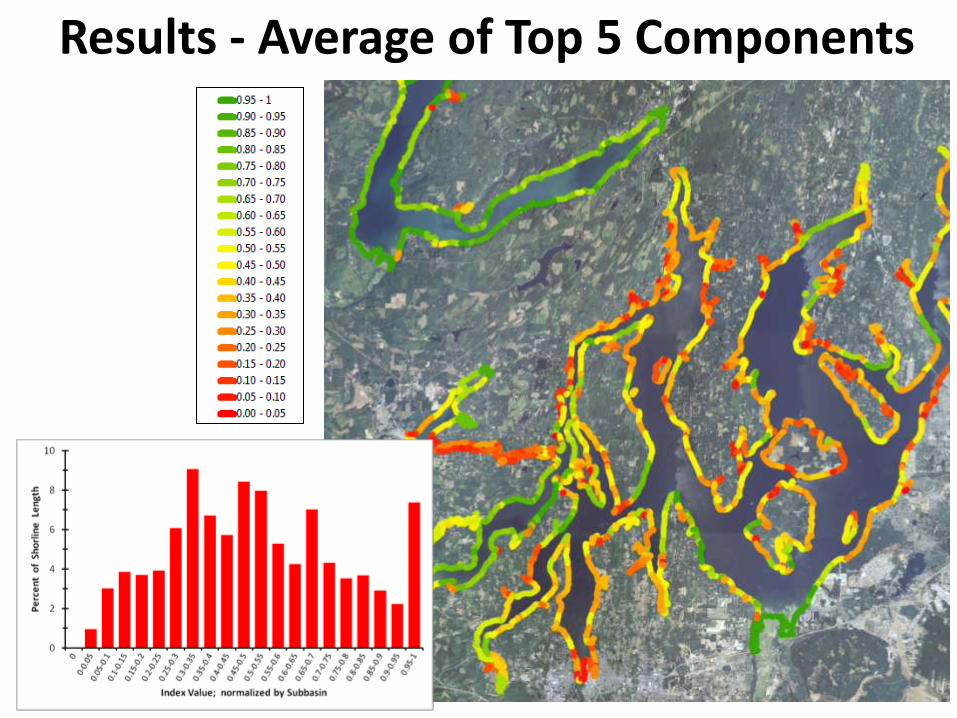
Results - Average of Top 5 Components

Assessment Development Process
Revision of 2nd Proposal
Final Report and “Final” Assessment Results
2nd Review by Expert Panel
Draft Report and Draft Assessment Results
Straw-man Proposal
Review of Report by subset of Expert Panel and others
Revision of Draft Methods and Report
1st Review by Expert Panel
Revision of 1st Proposal

Expert Panel Curtis Tanner U. S. Fish &Wildlife Service Paul Cereghino National Marine Fisheries Service Hugh Shipman Washington Dept of Ecology Helen Berry Washington Dept of Natural Res. Si Simenstad University of Washington Terry Wright Northwest Indian Fisheries Comm. David Fyfe Northwest Indian Fisheries Comm. Scott Pearson WDFW Dayv Lowry WDFW
Reviewers of Draft Report Ron Thom Pacific Northwest Laboratory Val Cullinan Pacific Northwest Laboratory Megan Dethier University of Washington Eric Beamer Skagit River Cooperative Paul Cereghino National Marine Fisheries Service
Marine Shoreline Assessment

Expert Panel Shallin Busch NOAA George Pess NOAA Bob Bilby Weyerhaeuser Co. Ken Currens NWIFC / PSP Mara Zimmerman WDFW Kirk Krueger WDFW Ken Warheit WDFW
Reviewers of Draft Report Shallin Busch NOAA George Pess NOAA Ken Currens NWIFC / PSP
Freshwater Assessment

Expert Panel John Pierce WDFW Joe Rocchio Washington Natural Heritage Program Rex Crawford Washington Natural Heritage Program
Reviewers of Draft Report John Gamon Washington Natural Heritage Program John Marzluff University of Washington John Withey University of Washington
Terrestrial Assessment

Peer Review Periods
Terrestrial October 14, 2011 to May 4, 2012
Marine Shorelines February 10, 2012 to May 4, 2012
Freshwater November 16, 2011 to May 4, 2012
Meeting at NWIFC for all 3 Assessments May 2, 2012

There are ways to deal with shortcomings in the models
• Appreciate tribal concerns with habitat models
• Want to bring more accurate local data into local assessments
• WCTAT could facilitate incorporation of tribal data and local priorities into land-use plans developed in conjunction with local governments.
• Tribes need to engage in local planning processes to provide their perspective and expertise

WHO IS, AND WILL BE USING THE CHARACTERIZATION?
Watershed-based information to support local land-use decisions

Comprehensive Plan updates
• Where PS Watershed Characterization may be the most effective – – integrate both shoreline and upland planning efforts – Coordinates and integrates planning by jurisdictions
within a watershed
• Examples – Sub-area plans (e.g. Gorst) – UGA adjustments (e.g. Birch Bay) – Thurston Co. Comprehensive plan update – Skagit Co. watershed planning efforts (Envision and PS
Characterization)

Research Conference 2003
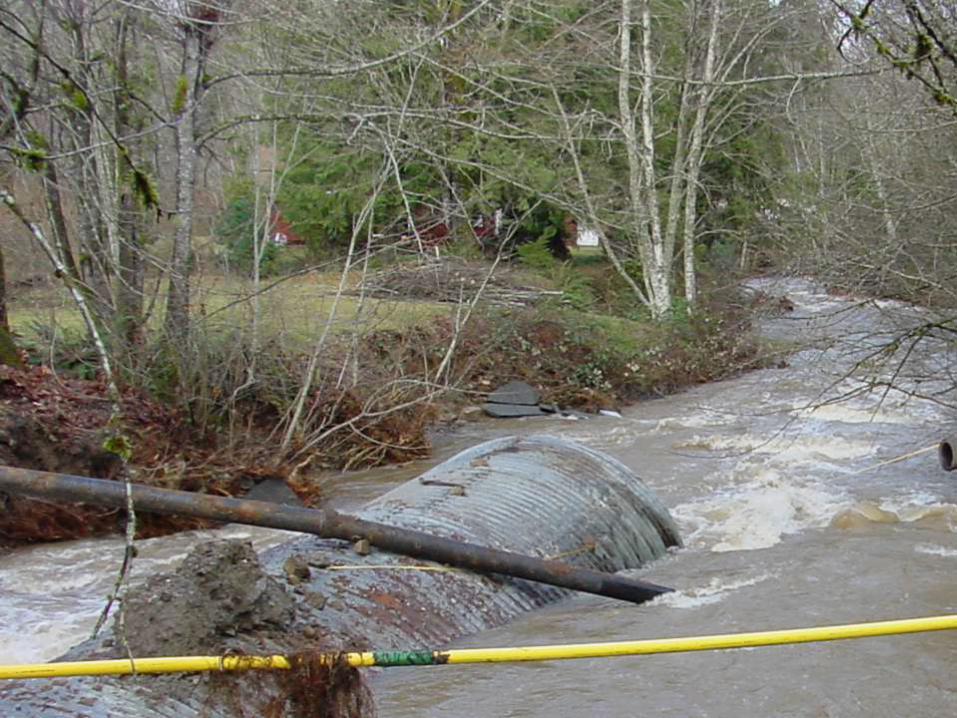
Chico Watershed Planning Project
• Pilot Project for Kitsap County DCD
• Planning by Watershed
• Chico is home to Kitsap’s largest salmon run
• Alternative Futures Planning
Research Conference 2003
Chico Watershed Planning Project
• Pilot Project for Kitsap County DCD
• Planning by Watershed
• Chico is home to Kitsap’s largest salmon run
• Alternative Futures Planning
Research Conference 2003
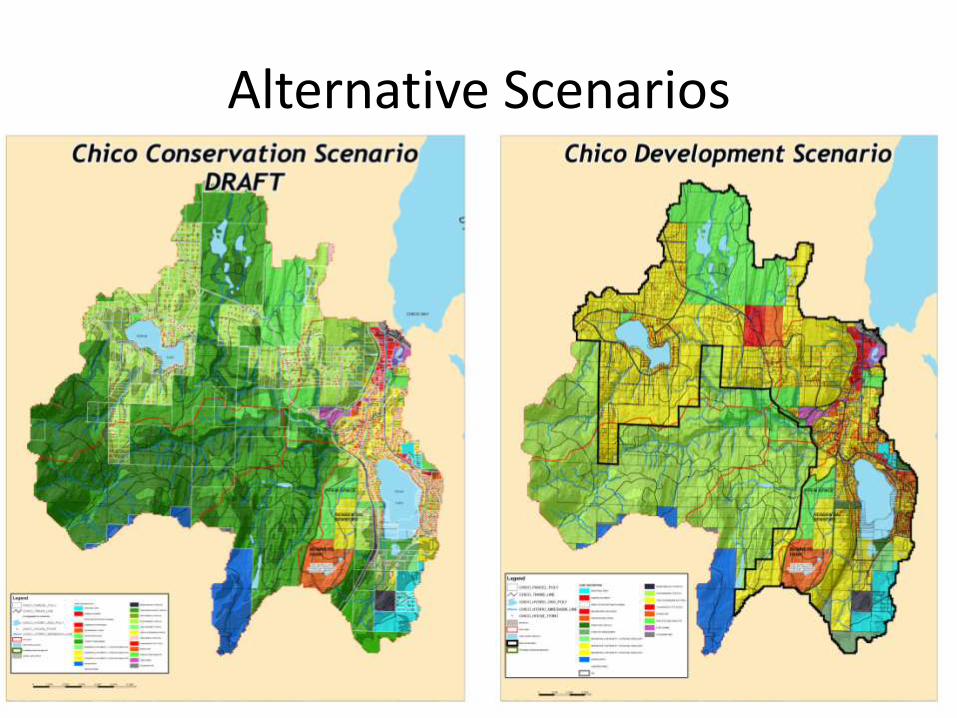
Alternative Scenarios
Research Conference 2003
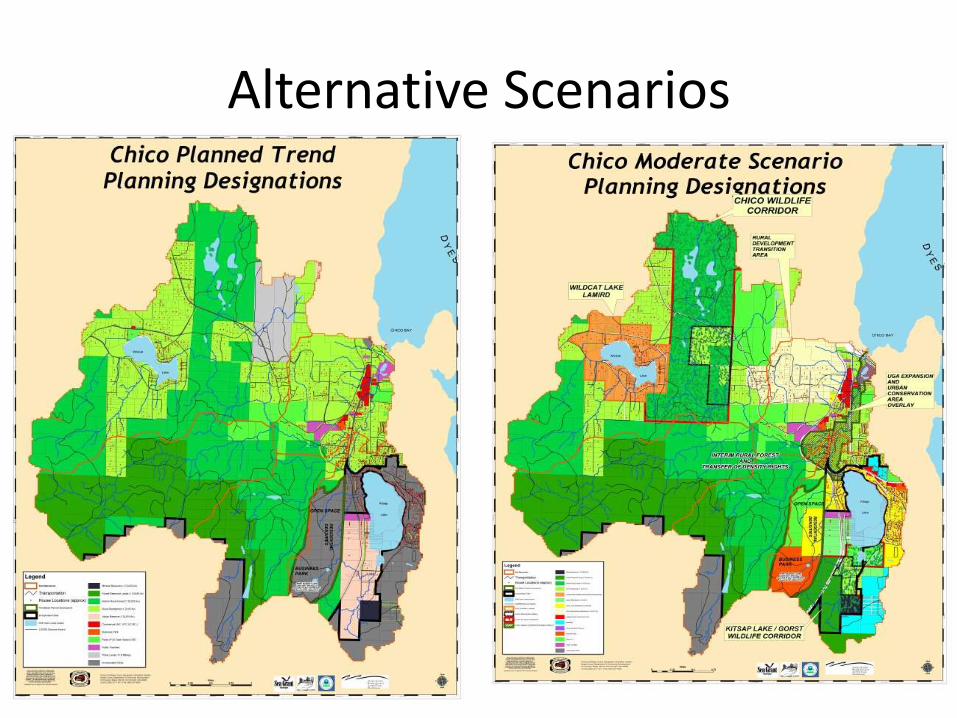
Alternative Scenarios
Research Conference 2003
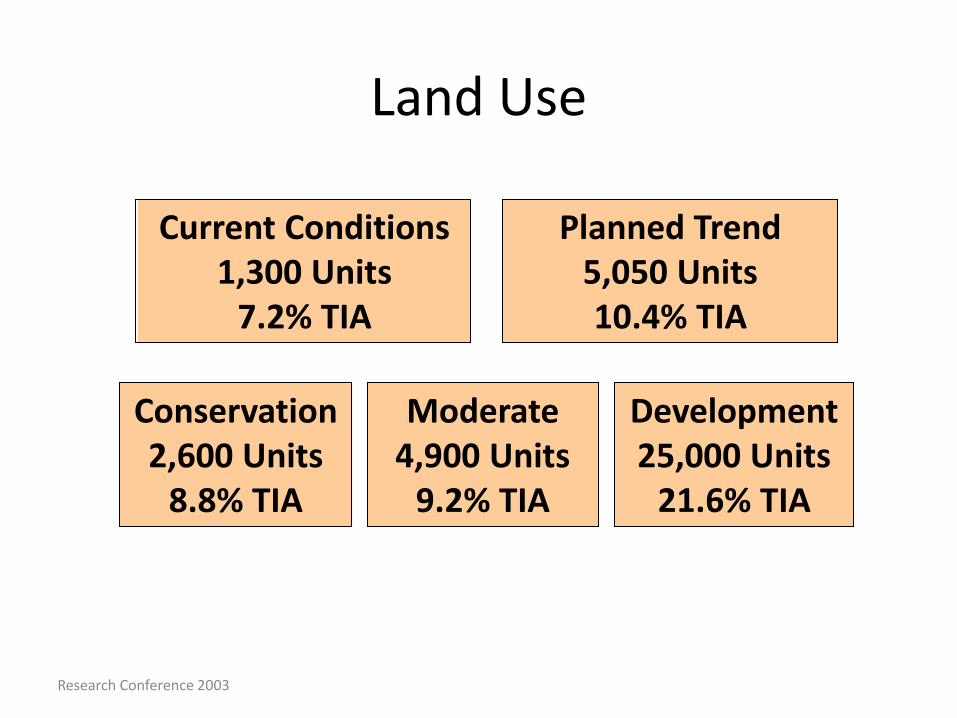
Land Use
Conservation 2,600 Units
8.8% TIA
Planned Trend 5,050 Units 10.4% TIA
Current Conditions 1,300 Units
7.2% TIA
Moderate 4,900 Units
9.2% TIA
Development 25,000 Units
21.6% TIA

Shoreline Master Plan Updates
• Currently required to use a watershed-based analysis, such as PS Watershed Characterization to inform update of SMPs across Puget Sound
• Next round of updates in 6-8 years – looking to evaluate and refine the PS Watershed Characterization to better inform updates

National Estuary Program grants
• NEP rounds 1 & 2 – currently funded and encouraged to use PS Watershed Characterization or other watershed-based approach: – Skagit County – TDR program – King County – Market based tools for Land Protection and
Restoration – Nisqually Tribe – Upper Nisqually ecosystem service pilot – Whatcom Co. – Ecosystem service market pilot – Kitsap Co. – Planning by Watershed – City of Mukilteo - Regional Stormwater Master Plan – Hood Canal CC – Regional Stormwater Retrofit plan – In
Lieu Fee and Integrated Watershed Management Plan – The Nature Conservancy – Floodplains by Design

National Estuary Program grants
• Round 3 funding – upcoming
– Focus on improving watershed management including:
• Type,
• location and
• design of development (new and/or re-development)
– Result in planning tools that are integrated into:
• Local comprehensive plans, shoreline master plans, and regulatory codes
Long-term Goal – •growth is primarily focused in the appropriate areas
within UGAs •activities outside of UGAs are managed to protect and
restore watershed processes.
Eligible to receive funding – •local governments •Special purpose districts, •Federally-recognized tribal governments, •Tribal consortia
Encouraging regional approaches and partnerships to address problems at a watershed scale
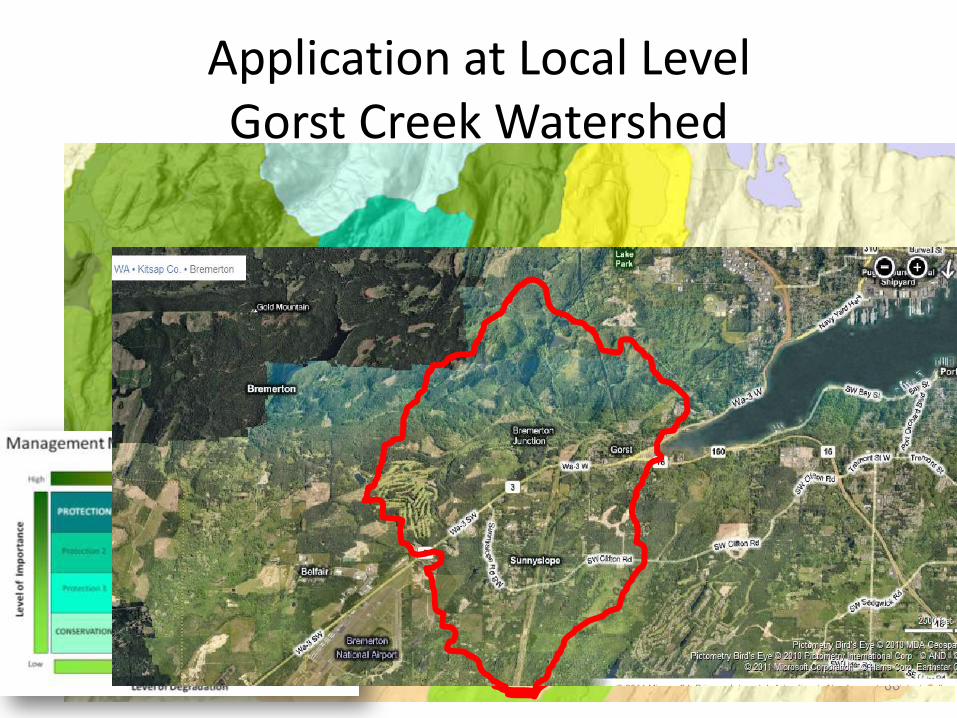
Application at Local Level Gorst Creek Watershed
66

Integrating Water Flow and Habitat Assessments
67

Watershed Management Zones based on priorities within Gorst watershed .
68

PUGET SOUND WATERSHED CHARACTERIZATION IN LOCAL PLANNING
Example from Kitsap County

ASSESSMENT INTEGRATION AND INTERPRETATION
Volume 3
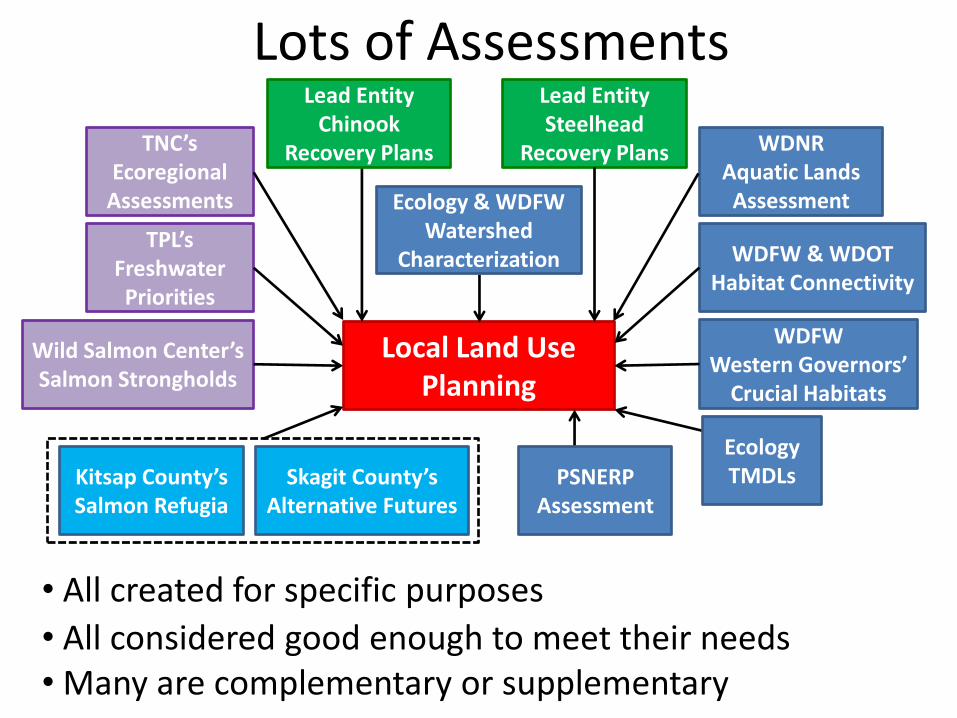
Local Land Use Planning
Lots of Assessments
• All considered good enough to meet their needs
TNC’s Ecoregional
Assessments
• All created for specific purposes
WDFW & WDOT Habitat Connectivity
WDFW Western Governors’
Crucial Habitats
TPL’s Freshwater Priorities
WDNR Aquatic Lands Assessment
Wild Salmon Center’s Salmon Strongholds
Lead Entity Steelhead
Recovery Plans
• Many are complementary or supplementary
Ecology & WDFW Watershed
Characterization
Ecology TMDLs
Lead Entity Chinook
Recovery Plans
PSNERP Assessment
Kitsap County’s Salmon Refugia
Skagit County’s Alternative Futures

Purpose of the Characterization
• Where on the landscape should planning and management efforts be focused first
• What general types of activities and actions are most appropriate at that place
• Why are those places relatively more or less important than other places
Does not model rates or quantities for: instream flows Mid & Finer Scale Modeling done by sediment Salmon Recovery Plans wood

Sound Wide Results – Water Flow
73 RESTORATION
jSeattle
Mt. Vernon
Bellingham
Tacoma

Interpreting Assessment Results: WHERE
Step 1 – Using the importance scores, locate the most important places (i.e. assessment units) within a study area.
Upper watershed has largest area of high importance
Upper
Lower
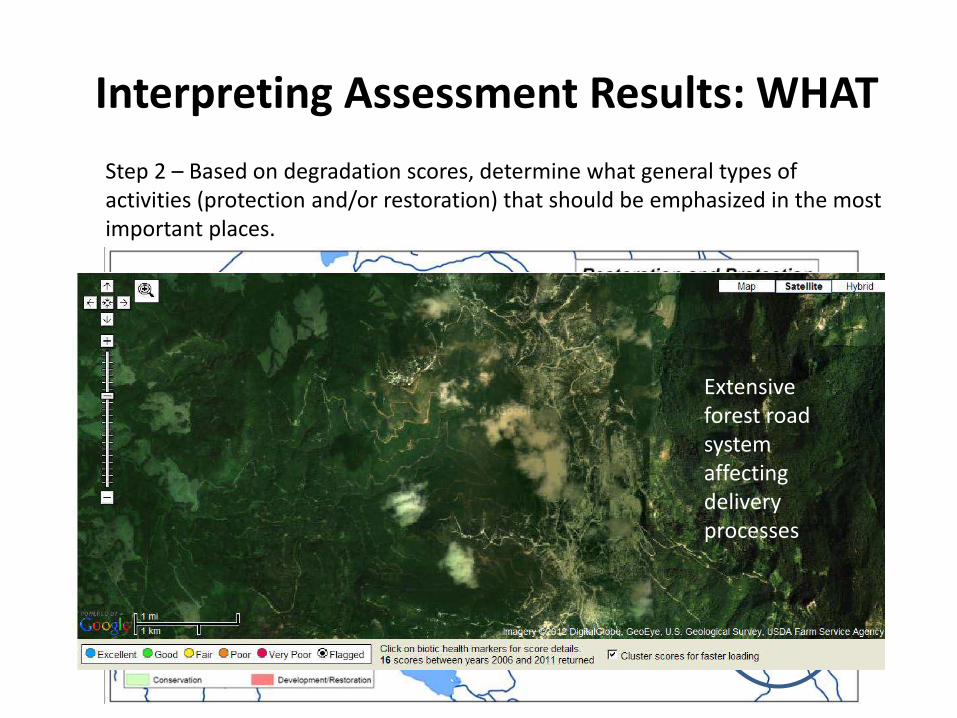
Interpreting Assessment Results: WHAT
Step 2 – Based on degradation scores, determine what general types of activities (protection and/or restoration) that should be emphasized in the most important places.
Extensive forest road system affecting delivery processes

Interpreting Assessment Results: WHAT
Step 2 – Based on degradation scores, determine what general types of activities (protection and/or restoration) that should be emphasized in the most important places.
Storage processes degraded in lower watershed by agricultural activities

Interpreting Assessment Results: WHY
Step 3 – Construct tables that summarize results for the processes that comprise importance and degradation scores. Understanding why should lead to recommendations for more specific management actions.
Upper
Lower
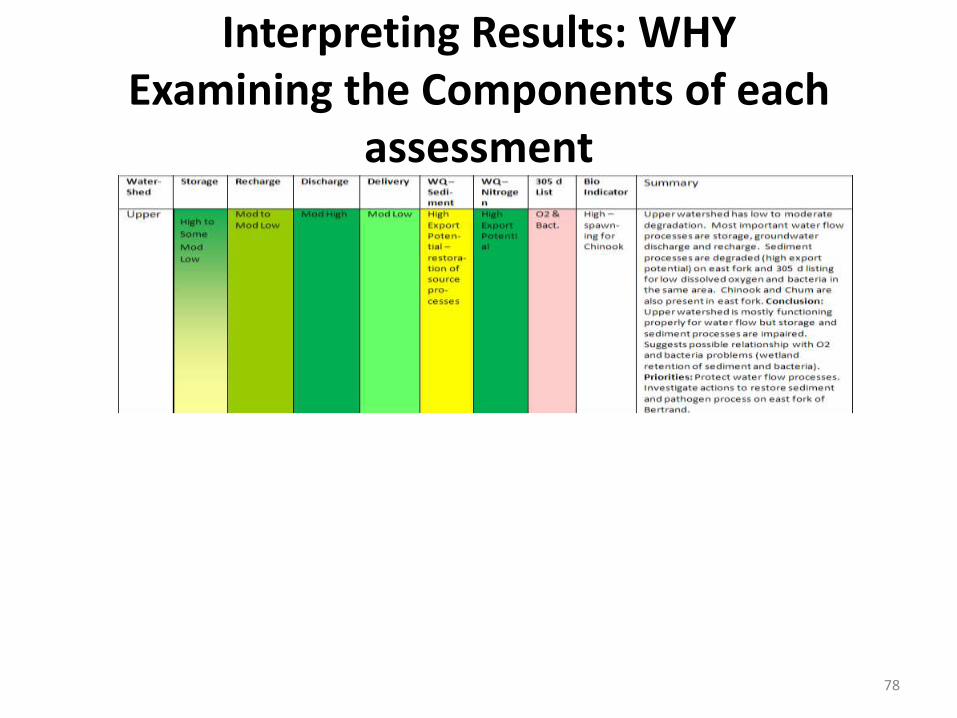
Interpreting Results: WHY Examining the Components of each
assessment
78
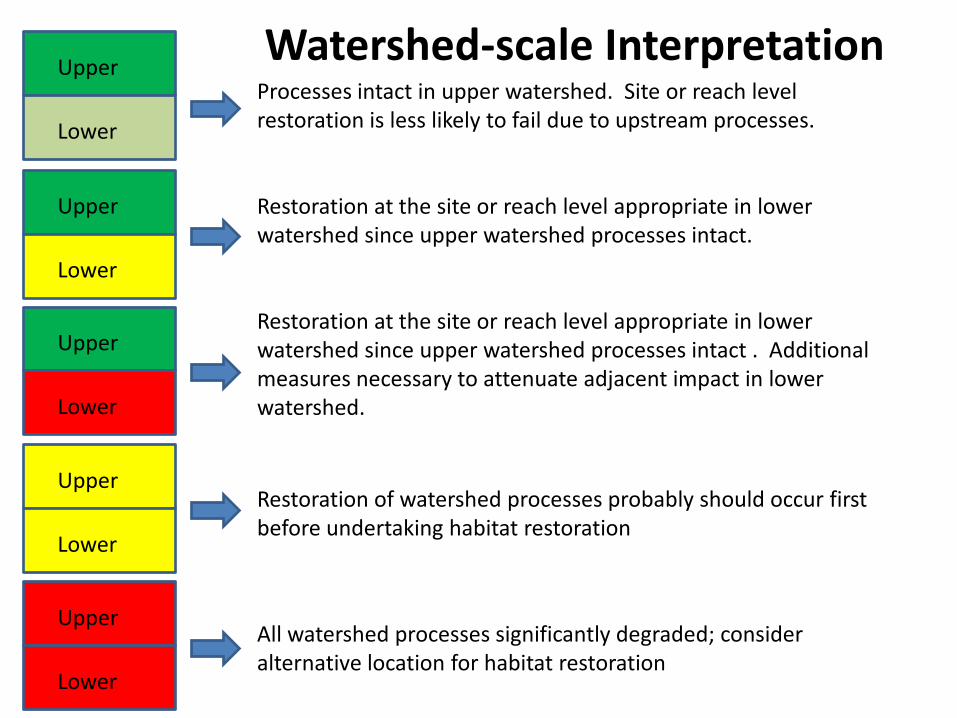
Watershed-scale Interpretation Processes intact in upper watershed. Site or reach level restoration is less likely to fail due to upstream processes. Restoration at the site or reach level appropriate in lower watershed since upper watershed processes intact. Restoration at the site or reach level appropriate in lower watershed since upper watershed processes intact . Additional measures necessary to attenuate adjacent impact in lower watershed.
Upper
Lower
Upper
Lower
Upper
Lower
Restoration of watershed processes probably should occur first before undertaking habitat restoration
Upper
Lower
Upper
Lower
All watershed processes significantly degraded; consider alternative location for habitat restoration

Index of Watershed Condition
This index tells you the condition of the watershed above an assessment unit. If the upper watershed is not significantly degraded then the downstream assessment unit is a good place for instream restoration
Higher values indicate processes are intact and will support stream structure and function – restoration will have a higher chance of success

Complements Salmon Recovery Efforts Broad scale – water flow assessment
Mid & fine scale - Salmon recovery plan tells us this is a good location for restoration
Watershed condition index tells us that upper watershed processes are intact and will contribute to long-term success of restoration projects

Complements Salmon Recovery Efforts Broad scale – water flow assessment
Mid & fine scale - Salmon recovery plan tells us this is a good location for restoration
Water Flow assessment also evaluates upland land use within individual AUs that control the delivery & movement of water to streams
Water Flow assessment also tells us that most of the upper watershed AUs require land-use activities that are protective of processes
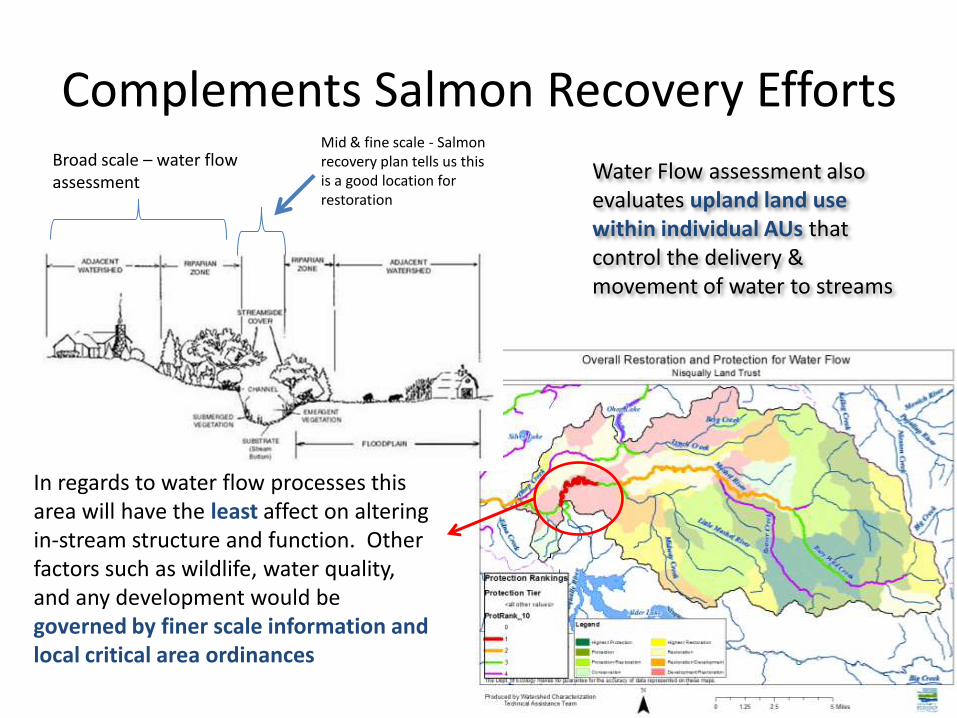
Complements Salmon Recovery Efforts Broad scale – water flow assessment
Mid & fine scale - Salmon recovery plan tells us this is a good location for restoration
In regards to water flow processes this area will have the least affect on altering in-stream structure and function. Other factors such as wildlife, water quality, and any development would be governed by finer scale information and local critical area ordinances
Water Flow assessment also evaluates upland land use within individual AUs that control the delivery & movement of water to streams

Concerns that have been expressed regarding PS Characterization
From meetings with EPA, letters, Habitat Advisory Committee comments we have heard:
• Concern that PS Watershed Characterization is
inconsistent with and should not supplant Salmon Recovery Plans
• Tribes need to be engaged in PS Watershed Characterization - bring in local data to improve results
• Concerns with Habitat Assessments done by WDFW

Next Steps – Volume 3
• Integrate, Synthesize and Apply Assessment Results – Must be in a format that helps inform planning
decisions for land use and other related actions (e.g. stormwater and restoration priorities)
– Current thinking is to use case studies to illustrate how to integrate, synthesize and apply
– Have to decide on what array of case studies
• Methods Manual
• Web Display
85
Discussion
• How do we effectively bring finer-scale tribal data into our assessment framework
• Process for reaching out to appropriate tribal participation when working on local plans
• Potential for tribal input into Phase 2 (integration) of the Characterization Project