electrical characterization of pathri-rao watershed in...
TRANSCRIPT

Electrical characterization of Pathri-Rao watershed in Himalayan foothills region, Uttarakhand, India��
�Sudha1, 4, M. Israil2, D. C. Singhal3, P. K. Gupta2, S. Shimeles2, V. K. Sharma3 and J. Rai4
1 Institut für Geophysik und Meteorology, Universität zu Köln, Germany, 2 Department of Earth Sciences, Indian Institute of Technology Roorkee, India, 3 Department of Hydrology, Indian Institute of Technology Roorkee, India, and
4Department of Physics, Indian Institute of Technology Roorkee, India
Abstract Geoelectrical techniques have been used to define the geometry of aquifer system in
Pathri-Rao watershed situated in the Piedmont zone of Himalayan foothill region, Uttarakhand, India. This has been done by integrating the results of dc resistivity and electromagnetic data recorded from the area. 2D resistivity imaging and time domain electromagnetic were carried out to define horizontal and vertical geometry of aquifer system and to infer the local groundwater flow condition. On the basis of resistivity values it has been found that shallow and deeper aquifers have different degree of interaction in the area. The study demonstrates the versatility of geoelectrical techniques.
Keywords: Electrical resistivity imaging, Piedmont zone, Himalayan foothill region, Aquifer system.
Introduction
The rate of withdrawal of groundwater in the piedmont area is increasing continuously due to the increasing pace of population growth, agricultural and industrial development. The over-exploitation of groundwater is manifested by the lowering of water table and creating regional imbalance associated with the problem of water scarcity for domestic, agricultural and industrial use. Hence, the detail identification of aquifer system is essential for the sustainable development of groundwater in the piedmont area of Himalayan foothill region.
The aquifer delineation based on the surface hydrogeological and geomorphologic features and do not provide reliable data of subsurface features of aquifer system. For a better understanding of aquifer system in a multi-aquifer system in the piedmont zone, geophysical methods can provide a better estimate of the depth,
thickness and lateral extent of the aquifer system. Recent development in the geoelectrical data acquisition and interpretation methodology provides electrical image of subsurface feature which could be directly used to infer the aquifer configuration. The geoelectrical image can be used to define the depth, thickness, horizontal extent and surface elevation of aquifer system. Thus by combining the data on the surface hydrogeological features with the subsurface information obtained from the geoelectrical investigations, one may define the subsurface features and details of aquifer geometry. Venkateswara Rao and Briz-Kishore (1991) have used the geophysical and hydrogeological methods for estimating the groundwater potential in arid and semi-arid areas of south India, where more than 80% of the land is underlain by crystalline rocks. Edet and Okereke (1997, 2002) used a similar approach for the Oban massif, Nigeria and calculated the groundwater potential in the area. Shahid and Nath (1999) have also used
22. Kolloquium Elektromagnetische Tiefenforschung, Hotel Maxičky, Děčín, Czech Republic, October 1-5, 2007 273
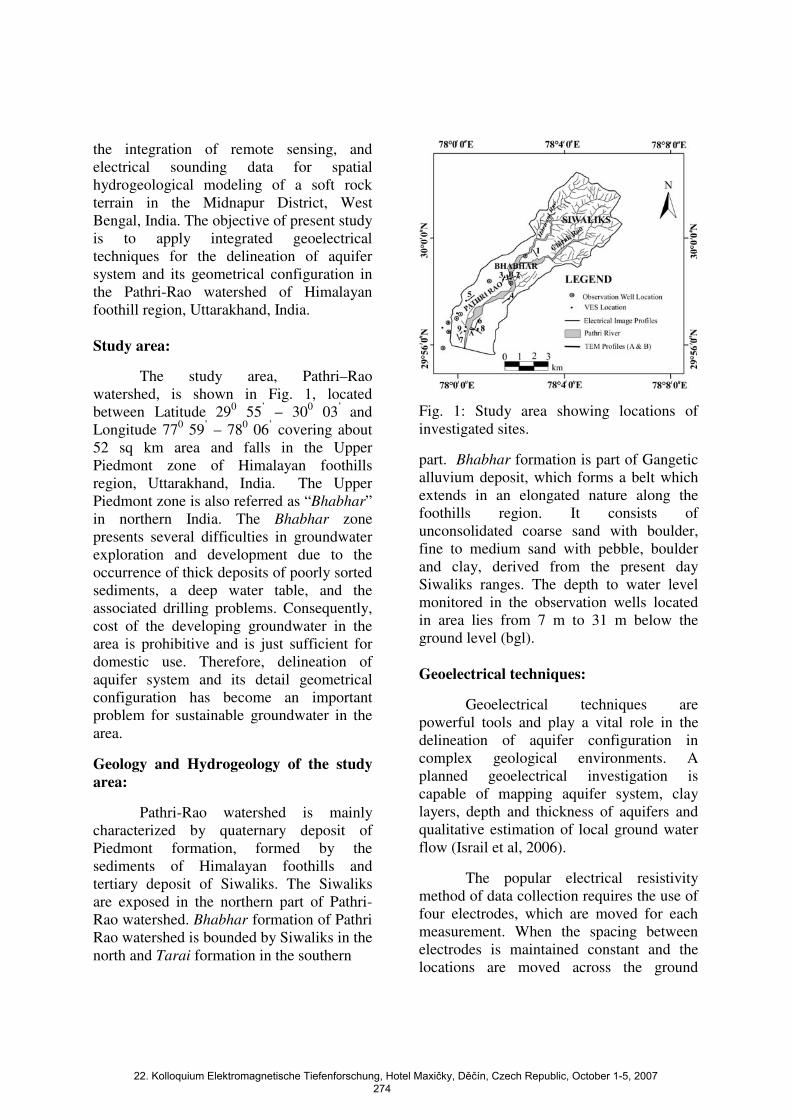
the integration of remote sensing, and electrical sounding data for spatial hydrogeological modeling of a soft rock terrain in the Midnapur District, West Bengal, India. The objective of present study is to apply integrated geoelectrical techniques for the delineation of aquifer system and its geometrical configuration in the Pathri-Rao watershed of Himalayan foothill region, Uttarakhand, India. Study area:
The study area, Pathri–Rao watershed, is shown in Fig. 1, located between Latitude 290 55’ – 300 03’ and Longitude 770 59’ – 780 06’ covering about 52 sq km area and falls in the Upper Piedmont zone of Himalayan foothills region, Uttarakhand, India. The Upper Piedmont zone is also referred as “Bhabhar” in northern India. The Bhabhar zone presents several difficulties in groundwater exploration and development due to the occurrence of thick deposits of poorly sorted sediments, a deep water table, and the associated drilling problems. Consequently, cost of the developing groundwater in the area is prohibitive and is just sufficient for domestic use. Therefore, delineation of aquifer system and its detail geometrical configuration has become an important problem for sustainable groundwater in the area.
Geology and Hydrogeology of the study area:
Pathri-Rao watershed is mainly characterized by quaternary deposit of Piedmont formation, formed by the sediments of Himalayan foothills and tertiary deposit of Siwaliks. The Siwaliks are exposed in the northern part of Pathri-Rao watershed. Bhabhar formation of Pathri Rao watershed is bounded by Siwaliks in the north and Tarai formation in the southern
Fig. 1: Study area showing locations of investigated sites.
part. Bhabhar formation is part of Gangetic alluvium deposit, which forms a belt which extends in an elongated nature along the foothills region. It consists of unconsolidated coarse sand with boulder, fine to medium sand with pebble, boulder and clay, derived from the present day Siwaliks ranges. The depth to water level monitored in the observation wells located in area lies from 7 m to 31 m below the ground level (bgl). Geoelectrical techniques:
Geoelectrical techniques are powerful tools and play a vital role in the delineation of aquifer configuration in complex geological environments. A planned geoelectrical investigation is capable of mapping aquifer system, clay layers, depth and thickness of aquifers and qualitative estimation of local ground water flow (Israil et al, 2006).
The popular electrical resistivity method of data collection requires the use of four electrodes, which are moved for each measurement. When the spacing between electrodes is maintained constant and the locations are moved across the ground
22. Kolloquium Elektromagnetische Tiefenforschung, Hotel Maxičky, Děčín, Czech Republic, October 1-5, 2007 274

surface, a profile of apparent resistivity values across an area can be developed. When the spacing between electrodes is varied around a central location, a sounding is developed by spreading the electrodes further apart for each measurement. 1D inversion is used to model the geological features by geophysical parameters such as depth, thickness and resistivity.
Electrical image profiling using multi – electrodes resistivity imaging system, facilitates simultaneous recording of profiling and sounding data efficiently. Loke & Barker (Loke and Barker, 1996) have developed a rapid least squares inversion method for the data collected by multi – electrode resistivity system. Resistivity method is not successful in the area where galvanic contact of electrode to the ground is not possible or the surface is highly resistive. In such areas, inductive method (Electromagnetic) is more effective. Time Domain Electromagnetic (TEM) method does not require any galvanic contact with the ground for the current injection. Therefore, it can also be used in the highly resistive ground.
Thus the integration of Veritcal Electrical Sounding (VES), Electrical Image Profile (EIP) and TEM data can be effectively used to determine the aquifer configuration in a complex geological environment.
Geoelectrical Data Acquisition and Interpretation:
The location of 11 VES, 9 EIP and 2 TEM profiles are shown in Fig. 1. VES data were collected using Schlumberger configuration with maximum electrode spacing of 900.0 m. As northern zone of the area is restricted and is inaccessible, therefore the survey was carried out only in the southern part. The electrode spacing is sufficient to provide information about
resistivity variation in near surface and deeper than 100 m, which is capable of delineating shallow and deeper aquifers. The least squares method is used to invert apparent resistivity data in terms of resistivity and thickness of subsurface layer. Interpreted 1D model consists of 3 to 5 layers with varying resistivity and thicknesses. Root mean square (rms) error obtained between the observed and modeled apparent resistivity lies below 6 % in all data sets. The resistivity of top layer in the northern part of the study area is very high. The resistivity decreases in deeper layer indicating the saturated condition in deeper zone. In southern area, the resistivity is relatively lower at all depths in comparison to the northern zone. For geological interpretation, the resistivity values are calibrated with known lithology from available borehole data. An example of lithological correlation of resistivity values obtained from the interpretation of measured apparent resistivity in the area is shown in Fig 2.
Fig. 2: Lithological correlation of resistivity data in Bhabhar zone.
With the objective to map the detailed lateral and vertical variation of resistivity in
22. Kolloquium Elektromagnetische Tiefenforschung, Hotel Maxičky, Děčín, Czech Republic, October 1-5, 2007 275
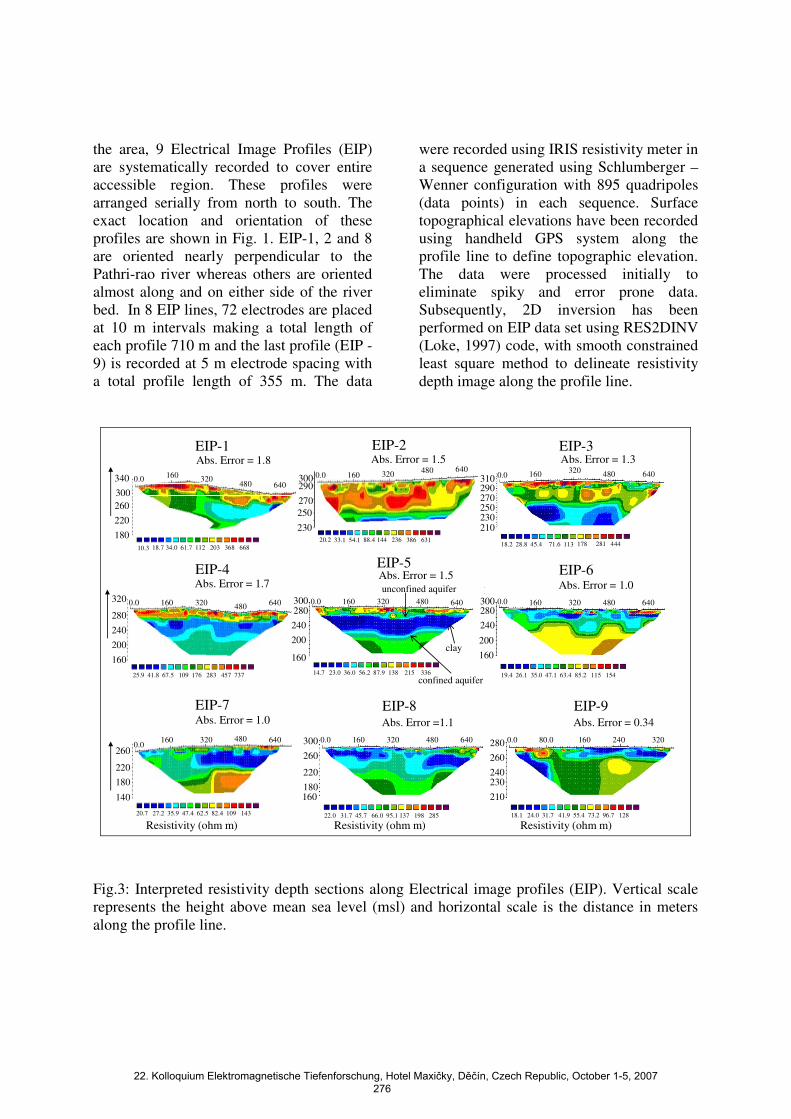
the area, 9 Electrical Image Profiles (EIP) are systematically recorded to cover entire accessible region. These profiles were arranged serially from north to south. The exact location and orientation of these profiles are shown in Fig. 1. EIP-1, 2 and 8 are oriented nearly perpendicular to the Pathri-rao river whereas others are oriented almost along and on either side of the river bed. In 8 EIP lines, 72 electrodes are placed at 10 m intervals making a total length of each profile 710 m and the last profile (EIP -9) is recorded at 5 m electrode spacing with a total profile length of 355 m. The data
were recorded using IRIS resistivity meter in a sequence generated using Schlumberger – Wenner configuration with 895 quadripoles (data points) in each sequence. Surface topographical elevations have been recorded using handheld GPS system along the profile line to define topographic elevation. The data were processed initially to eliminate spiky and error prone data. Subsequently, 2D inversion has been performed on EIP data set using RES2DINV (Loke, 1997) code, with smooth constrained least square method to delineate resistivity depth image along the profile line.
EIP-2Abs. Error = 1.8EIP-1
Abs. Error = 1.5 Abs. Error = 1.3EIP-3
Abs. Error = 1.7EIP-4 Abs. Error = 1.5
EIP-5
Abs. Error = 1.0EIP-6
Abs. Error = 1.0EIP-7
Resistivity (ohm m)
Abs. Error =1.1EIP-8
Resistivity (ohm m)
Abs. Error = 0.34EIP-9
Resistivity (ohm m)
180
220
260300
340
10.3 18.7 34.0 61.7 112 203 368 668
0.0 160 320480 640
300290
270250
230
6404803201600.0
20.2 33.1 54.1 88.4 144 236 386 631
6404803201600.0310290270250230210
18.2 28.8 45.4 71.6 113 178 281 444
19.4 26.1 35.0 47.1 63.4 85.2 115 154
300280
240
200
160
0.0 160 320 480 640
160
200
240
280300 0.0 160 320 480 640
14.7 23.0 36.0 56.2 87.9 138 215 336
0.0 160 320 480 640
25.9 41.8 67.5 109 176 283 457 737
6404803201600.0
140
180
220
260
20.7 27.2 35.9 47.4 62.5 82.4 109 143
6404803201600.0
160180
220
260
300
22.0 31.7 45.7 66.0 95.1 137 198 285
210
230240
260
280 0.0 160 32080.0 240
18.1 24.0 31.7 41.9 55.4 73.2 96.7 128
unconfined aquifer
clay
confined aquifer
280
240
200
160
320
Fig.3: Interpreted resistivity depth sections along Electrical image profiles (EIP). Vertical scale represents the height above mean sea level (msl) and horizontal scale is the distance in meters along the profile line.
22. Kolloquium Elektromagnetische Tiefenforschung, Hotel Maxičky, Děčín, Czech Republic, October 1-5, 2007 276

Fig 3 shows the 2D model representing resistivity-depth section along nine EIP’s lines. The absolute root mean square error between the observed apparent resistivity data and the modelled one is less than 1.7 in all cases (Fig. 3). These geoelectrical sections present a systematic variation of electrical resistivity with depth along each profile line. In the northern area unconsolidated coarse materials and boulders transported from Siwalik Hills are characterized by very high resistivity (900 �m) for near surface unsaturated layer. At a depth of about 30 m, the resistivity is low (50 �m) indicating saturated sand below the river channel (Harnaul Rao). Further southward, EIP-2 indicates comparatively low resistivity (600 �m) of near surface formation. Underneath the top resistive layer a consistent aquifer zone dipping towards southwest is delineated, which is characterized by low resistivity range (50- 100 �m). EIP-3 is also located near to EIP-2 oriented approximately along the river bed. A very low resistivity (18 �m) zone is present underneath the ends of the profile; these low resistivity zones are discontinuous in the middle of the profile (EIP-3). Further south to it, in EIP-4 and EIP-5, the low resistivity zone extends almost all along the entire profile line. EIP-5 represents a typical example of the existence of two aquifer system (shallow at about 10 m depth and deeper at nearly 30 m depth) separated by a thick clay layer. Further towards south, as indicated by EIP-6 to 9, the saturated zone is at shallower depths, which finally intersects the ground surface as manifested by the spring line (Israil et al, 2006). Thus the profiles oriented in different directions show the configuration of aquifer zone and its elevation along the profile line. The aquifer zones are normally dipping southward, indicating local groundwater flow direction from north to south in the area. The direction of groundwater flow delineated
from electrical images is consistent with the local hydrogeological setting. The middle part of study area is a typical example of two aquifers separated by a thick impermeable clay layer (EIP-5). Similar hydrogeological conditions are also revealed on the eastern side of the Pathri Rao River (Fig. 3).
In the study area, unconsolidated, and unsaturated coarse material transported from the Siwalik Hills, is represented by a high resistivity (900 �m), saturated sand with pebbles by a resistivity range of 30-100�m and saturated clay by a resistivity range of 10-25 �m.
The time domain electromagnetic (TEM) data along two profiles (A & B) is shown in Fig. 1. Zonge GDP-32 NanoTEM system has been used to record data from 25 stations along two profiles (10 stations in profile A and 15 stations in profile B) with a station spacing of 20 m. The TEM technique does not require galvanic contact of electrode with the ground and hence it can be used in a very high resistivity ground also. Here our purpose is to improve the interpretation by comparing the dc and TEM results. The depth of investigation of TEM data is determined by the time at which the signal decays to noise level, the source strength, loop size and the earth’s resistivity (Spies, 1989). In the present investigations, we have used 20x20 m2 transmitter loop powered by 12 volts battery and 5x5 m2 receiver loop placed in the centre of the transmitter. The data collected from the field are processed and interpreted to generate resistivity-depth image from the decay curve. For this purpose we used the STEMINV software package (MacInnes & Raymond, 2001), which is a smooth model inversion technique. The inversion results are presented as the isolines of resistivity values along the two profiles in Fig. 4(A & B). The resistivity section obtained from
22. Kolloquium Elektromagnetische Tiefenforschung, Hotel Maxičky, Děčín, Czech Republic, October 1-5, 2007 277

TEM profile A & B can be compared with the EIP profiles EIP-8 & Eip-3 respectively. The interpreted TEM section along profile ‘A’ and EIP-8 both are showing the resistive layer at the top up to the depth of 10 m and below this resistive layer, there is a conductive layer which is approximately 20 m thick. Resistivity starts increasing again beneath this conductive layer. The interpreted section along TEM profile ‘B’ shows approximately 40 m thick resistive layer at the top and below this layer resistivity starts decreasing. Hence, the resistivity depth section obtained from TEM data at shallow depth broadly agrees with the corresponding resistivity depth section obtained by imaging and VES data.
(A)
(B)
Fig. 4: Smoothed resistivity depth section obtained from Time domain Electromagnetic (TEM) data along two profiles (A & B).
Conclusion:
Aquifer geometry and groundwater flow direction in a complex geological environment of Himalayan foothills regions are defined on the basis of integrated VES, EIP and TEM geo-electrical techniques. The
study indicates high resistivity of unsaturated unconsolidated and porous coarse material of Bhabhar formation. Finer subsurface material in saturated condition towards the southern part is indicated by low resistivity. Two aquifers separated by a clay formation are inferred in the middle part of the area. The clay layer is discontinuous in some areas indicating interconnection between the two aquifers.
References:
1. Edet A.E., Okereke C.S., Assessment of hydrogeological conditions in basement aquifers of the Precambrian Oban massif, southeastern Nigeria. Journal of Applied Geophysics, 36, Issue 4, 1997, 195-204.
2. Edet A.E., Okereke C.S., Delineation of shallow groundwater aquifers in the coastal plain sands of Calabar area (Southern Nigeria) using surface resistivity and hydrogeological data. Journal of African Earth Sciences, 2002, 35, Number 3, 433-443(11).
3. Israil, M., Mufid al-hadithi, Singhal, D. C., Kumar, B., Groundwater-recharge estimation using a surface electrical resistivity method in the Himalayan foothill region, India. Hydrogeology Journal, 2006, 14, 44-50.
4. Loke, M.H. and Barker R.D., Rapid Least-squares inversion of apparent resistivity pseudosections by a quasi-Newton Method. Geophysical Prospecting, 1996, V.44, 131-152.
5. Loke, M.H., RES2DINV ver. 3.3 for Windows 3.1, 95, and NT. Advanced Geosciences, 1997, 66.
6. MacInnes S. & Raymond M. 2001. STEMINV Documentation – Smooth Model TEM inversion, version 3.00. Zonge Engineering and Research Organisation Inc.
7. Shahid, S., Nath, S.K., GIS Integrated of remote sensing and electrical
22. Kolloquium Elektromagnetische Tiefenforschung, Hotel Maxičky, Děčín, Czech Republic, October 1-5, 2007 278

sounding data for hydrogeological exploration. Journal of Spatial Hydrology, 1999, 2(1), 1-12.
8. Spies, Depth of investigation in electromagnetic sounding methods. Geophysics, 1989, 54, 872-888.
9. Venkateswara Rao, B., Briz- Kishore, B.H., A methodology for locating of potential aquifers in a typical semi-arid region in India using resistivity and hydrogeological parameters. Geoexploration, 1991, 27, 55-64.
22. Kolloquium Elektromagnetische Tiefenforschung, Hotel Maxičky, Děčín, Czech Republic, October 1-5, 2007 279