prediction of the soil-water characteristic curve from ... · pdf fileprediction of the...
TRANSCRIPT
Prediction of the Soil-Water Characteristic Curve fromGrain-Size Distribution and Volume-Mass Properties
Murray D. FredlundD.G. FredlundG.W. Wilson
Department of Civil EngineeringUniversity of Saskatchewan
Saskatoon, Sask.S7N 5A9
Fax: (306) 966-5427 Email: [email protected]
ABSTRACTThis paper presents a method of estimating the soil-water characteristic curve from the grain-size
distribution curve and volume-mass properties. The grain-size distribution is divided into smallgroups of uniformly-sized particles. A packing porosity and soil-water characteristic curve isassumed for each group of particles. The incremental soil-water characteristic curves are thensummed to produce a final soil-water characteristic curve. Prediction of the soil-water characteristiccurve from grain-size distribution allows for a inexpensive description of the behavior ofunsaturated soils. The soil-water characteristic curve forms the basis for computer modelling ofprocesses in unsaturated soils.
INTRODUCTIONThis paper presents a model for the
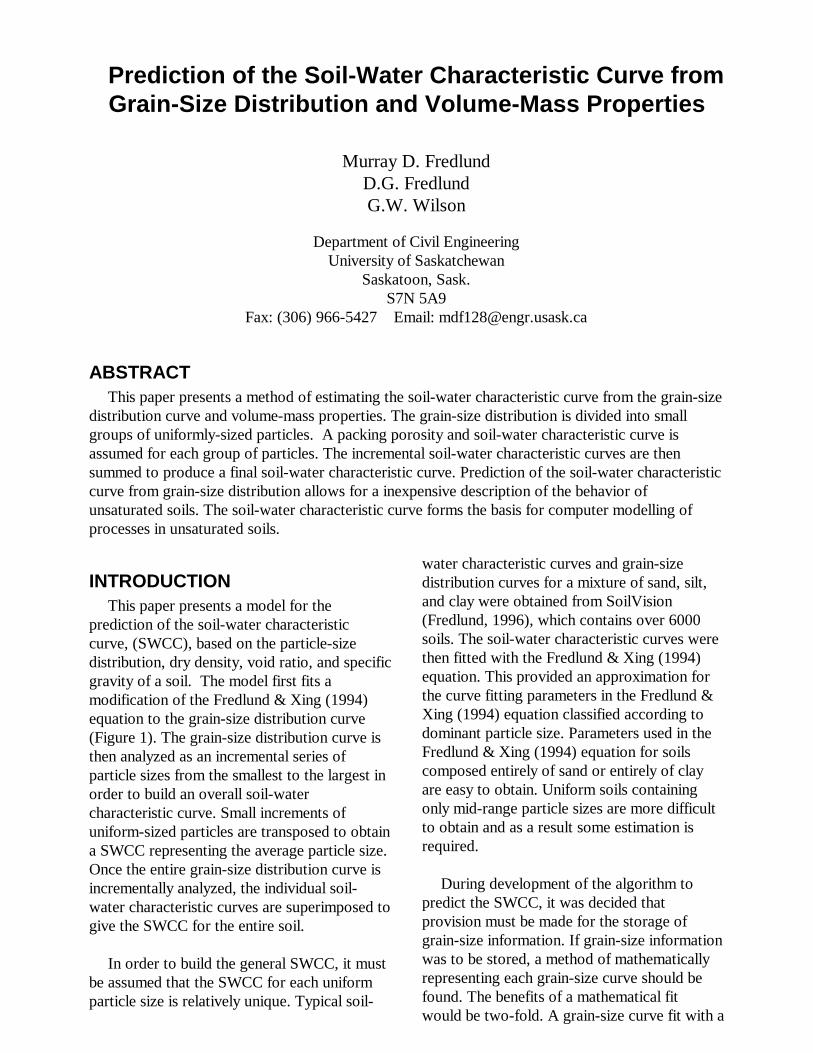
prediction of the soil-water characteristiccurve, (SWCC), based on the particle-sizedistribution, dry density, void ratio, and specificgravity of a soil. The model first fits amodification of the Fredlund & Xing (1994)equation to the grain-size distribution curve(Figure 1). The grain-size distribution curve isthen analyzed as an incremental series ofparticle sizes from the smallest to the largest inorder to build an overall soil-watercharacteristic curve. Small increments ofuniform-sized particles are transposed to obtaina SWCC representing the average particle size.Once the entire grain-size distribution curve isincrementally analyzed, the individual soil-water characteristic curves are superimposed togive the SWCC for the entire soil.
In order to build the general SWCC, it mustbe assumed that the SWCC for each uniformparticle size is relatively unique. Typical soil-
water characteristic curves and grain-sizedistribution curves for a mixture of sand, silt,and clay were obtained from SoilVision(Fredlund, 1996), which contains over 6000soils. The soil-water characteristic curves werethen fitted with the Fredlund & Xing (1994)equation. This provided an approximation forthe curve fitting parameters in the Fredlund &Xing (1994) equation classified according todominant particle size. Parameters used in theFredlund & Xing (1994) equation for soilscomposed entirely of sand or entirely of clayare easy to obtain. Uniform soils containingonly mid-range particle sizes are more difficultto obtain and as a result some estimation isrequired.
During development of the algorithm topredict the SWCC, it was decided thatprovision must be made for the storage ofgrain-size information. If grain-size informationwas to be stored, a method of mathematicallyrepresenting each grain-size curve should befound. The benefits of a mathematical fitwould be two-fold. A grain-size curve fit with a
3rd Brazilian Symposium on Unsaturated Soils, Rio de Janeiro, Brazil, April 22-25, 1997
2
mathematical equation would then allowfurther computations to be performed on thecurve. It was reasoned that a prediction of thesoil-water characteristic curve would bepossible if the grain-size distribution could be
fit with an equation. This idea was thenimplemented in the form of a least-squarescurve-fitting algorithm which allowed for fittingof the grain-size distribution data.
0%
10%
20%
30%
40%
50%
60%
70%
80%
90%
100%
0.0001 0.001 0.01 0.1 1 10 100
Particle Size (mm)
Per
cent
Pas
sing
Fit curveExperimental
Figure 1 Fit of grain-size curve using a modified Fredlund & Xing (1994) equation (# 10741)
The second benefit of mathematicallyrepresenting each grain-size curve was that itwould provide coefficients of indices by whichgrain-size curves could be classified. Thiswould allow the ability to search the databasefor soils with grain-size curves within aspecified band. This technique has proveninvaluable in performing sensitivity analyses onsoil parameters.
THEORY FOR MATHEMATICALLYREPRESENTING THE GRAIN-SIZEDISTRIBUTION CURVE
Previous research work to fit the grain-sizecurves was reviewed (Wagner, 1994). The
research by Wagner presented severallognormal distributions capable of fitting thegrain-size curve. Providing a meaningfulrepresentation of the grain-size data in theextremes proved difficult for a lognormaldistribution.
Due to similarity between the shape of thegrain-size distribution and the shape of the soil-water characteristic curve, a different approachwas taken. The Fredlund & Xing (1994)equation, which had previously been used to fitSWCC data, provided a flexible and continuousequation that could be fit by the nonlinearregression using three parameters. Theequation was modified to permit the fitting ofgrain-size curves. The modified equation, [0.1],
3rd Brazilian Symposium on Unsaturated Soils, Rio de Janeiro, Brazil, April 22-25, 1997
3
allowed for a continuous fit and proper definition of the extremes of the curve.
[0.1]
where:Pp(d) = percent passing a particular grain-size, dga = fitting parameter corresponding to the initial break in the grain-size curve,gn = fitting parameter corresponding to the maximum slope of grain-size curve,gm = fitting parameter corresponding to the curvature of the grain-size curve,d = particle diameter (mm),dr = residual particle diameter (mm),dm = minimum particle diameter (mm)
THEORY OF PREDICTING THESOIL-WATER CHARACTERISTICCURVE FROM THE GRAIN-SIZEDISTRIBUTION
The mathematical fit of the grain-sizedistribution led to the development of analgorithm capable of predicting the soil-watercharacteristic curve. A review of currentresearch showed that one of two approacheshave typically been taken in the prediction ofthe soil-water characteristic curve from grain-size. The first approach entails a statisticalestimation of properties describing the SWCCfrom grain-size and volume-mass properties(Gupta, 1979; Ahuja, 1985; Ghosh; 1980;
Aberg, 1996) It appeared that a theoreticalapproach to the problem would hopefullyprovide superior predictions.
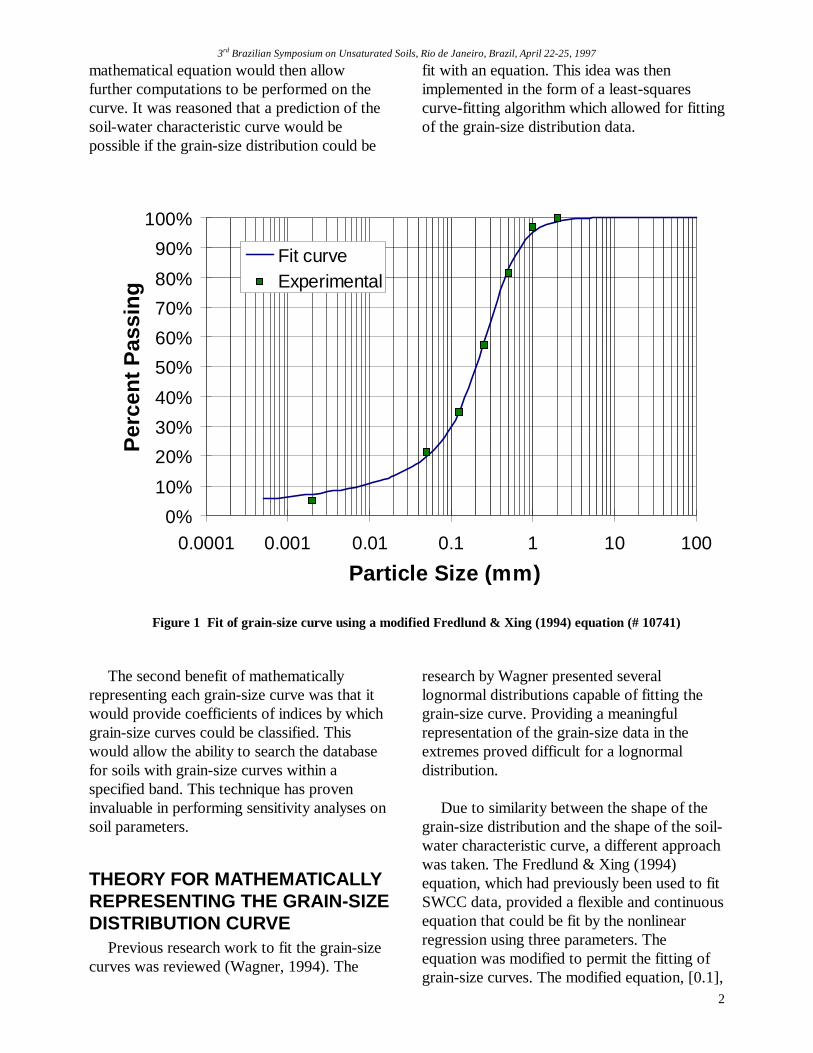
The second approach was theoretical andinvolved converting the grain-size distributionto a pore-size distribution which was thendeveloped into a SWCC (Arya, 1981). Thisresearch was duplicated and compared toexperimental data. Difficulty was encounteredin generating a reasonable SWCC along theentire range. Predicted soil-water characteristiccurves typically showed abnormal “humps” andfell to zero volumetric water content longbefore the experimental data was completelydesaturated (Figure 2).
P dg
d
d
d
d
d
p
a
g g
r
r
m
nm
( )
ln exp( )
ln
ln
=
+
−+
+
1
1
1
1
1
7
3rd Brazilian Symposium on Unsaturated Soils, Rio de Janeiro, Brazil, April 22-25, 1997
4
0
0.05
0.1
0.15
0.2
0.25
0.3
0.35
0.01 1 100 10000 1000000Suction (kPa)
Vol
umet
ric W
ater
Con
tent
Actual
Estimation frompore-size
Figure 2 Illustration of abnormalities associated with prediction of SWCC from pore-size distribution
A new approach is proposed for predictingthe soil-water characteristic curve from thegrain-size distribution curve. It was assumedthat a soil composed entirely of a uniform,homogeneous particle size would have a uniquesoil-water characteristic curve. The shape ofthe SWCC for pure sands, pure silts and pureclays was known. Using a best-fit analysis withthe Fredlund & Xing (1994) equation, threeparameters were computed for each soil type.It was then assumed that these parameterscould be associated with a dominant particlesize on the grain-size plot. The uniqueness ofthe soil parameters was confirmed by queryingthe SoilVision database for plots of the ‘n’ and‘m’ parameters versus the percent sand, silt,and clay of a soil. It was hypothesized that as asoil tended towards uniformity, the ‘n’ and ‘m’parameters would show a trend towards aparticular value. The particle sizes fallingbetween pure clays, pure silts and pure sandswere then approximated.
This resulted in the production of two plots,one for the ‘n’ parameter, and one for the ‘m’parameter. These plots described the variationin the ‘n’ and ‘m’ parameters with grain-size.This allowed n and m parameters to beestimated for any soil composed of uniformdiameter particles.
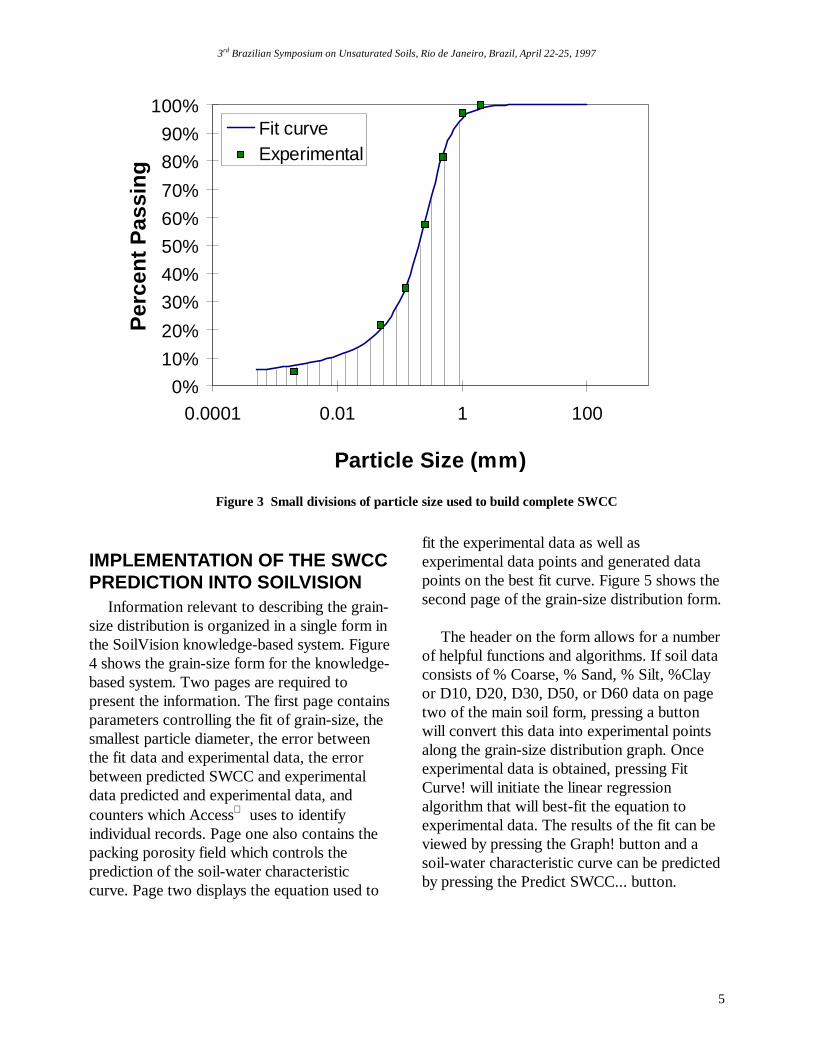
The grain-size distribution curve can bedivided up into small divisions of uniform soilparticles. Starting at the smallest diameter size,a packing porosity was estimated (Harr, 1977)for each division and a soil-water characteristiccurve estimated as shown in Figure 3. Thedivisional soil-water characteristic curves canthen be summed starting with the smallestparticle size and continuing until the volume ofpore space is equal to that of the entireheterogeneous soil. The result is a theoreticallypredicted soil-water characteristic curve.
3rd Brazilian Symposium on Unsaturated Soils, Rio de Janeiro, Brazil, April 22-25, 1997
5
0%
10%
20%
30%
40%
50%
60%
70%
80%
90%
100%
0.0001 0.01 1 100
Particle Size (mm)
Per
cent
Pas
sing
Fit curveExperimental
Figure 3 Small divisions of particle size used to build complete SWCC
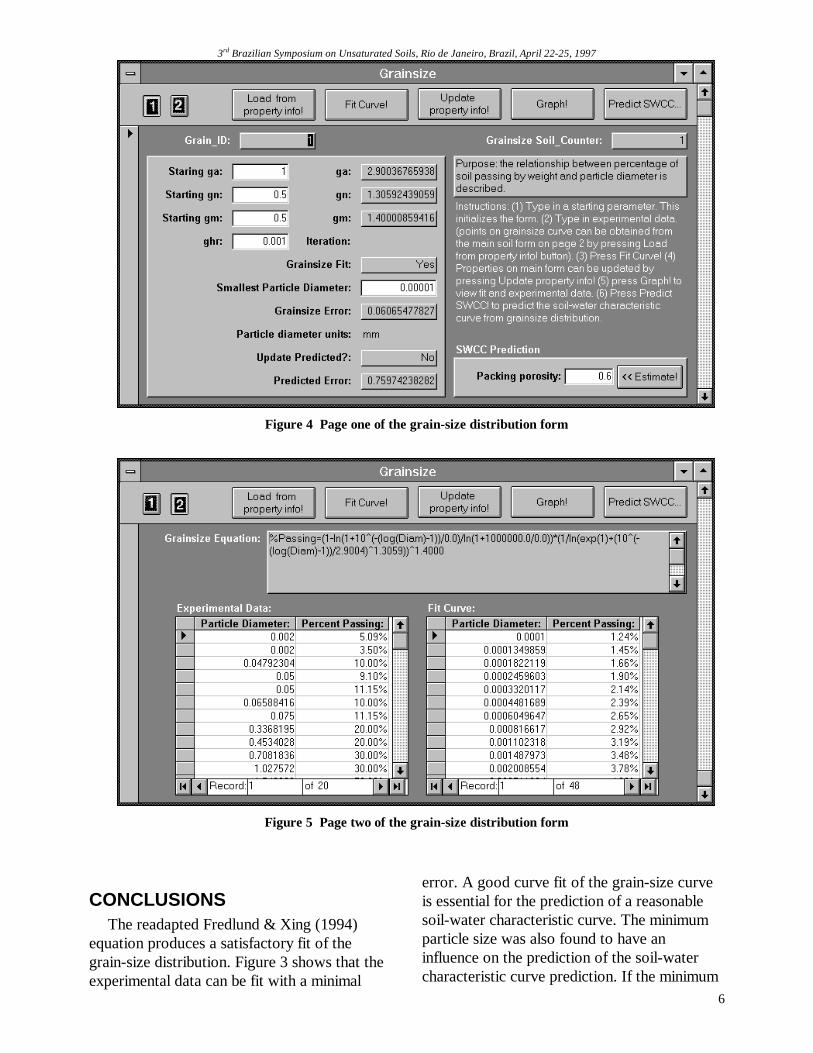
IMPLEMENTATION OF THE SWCCPREDICTION INTO SOILVISION
Information relevant to describing the grain-size distribution is organized in a single form inthe SoilVision knowledge-based system. Figure4 shows the grain-size form for the knowledge-based system. Two pages are required topresent the information. The first page containsparameters controlling the fit of grain-size, thesmallest particle diameter, the error betweenthe fit data and experimental data, the errorbetween predicted SWCC and experimentaldata predicted and experimental data, andcounters which Access uses to identifyindividual records. Page one also contains thepacking porosity field which controls theprediction of the soil-water characteristiccurve. Page two displays the equation used to
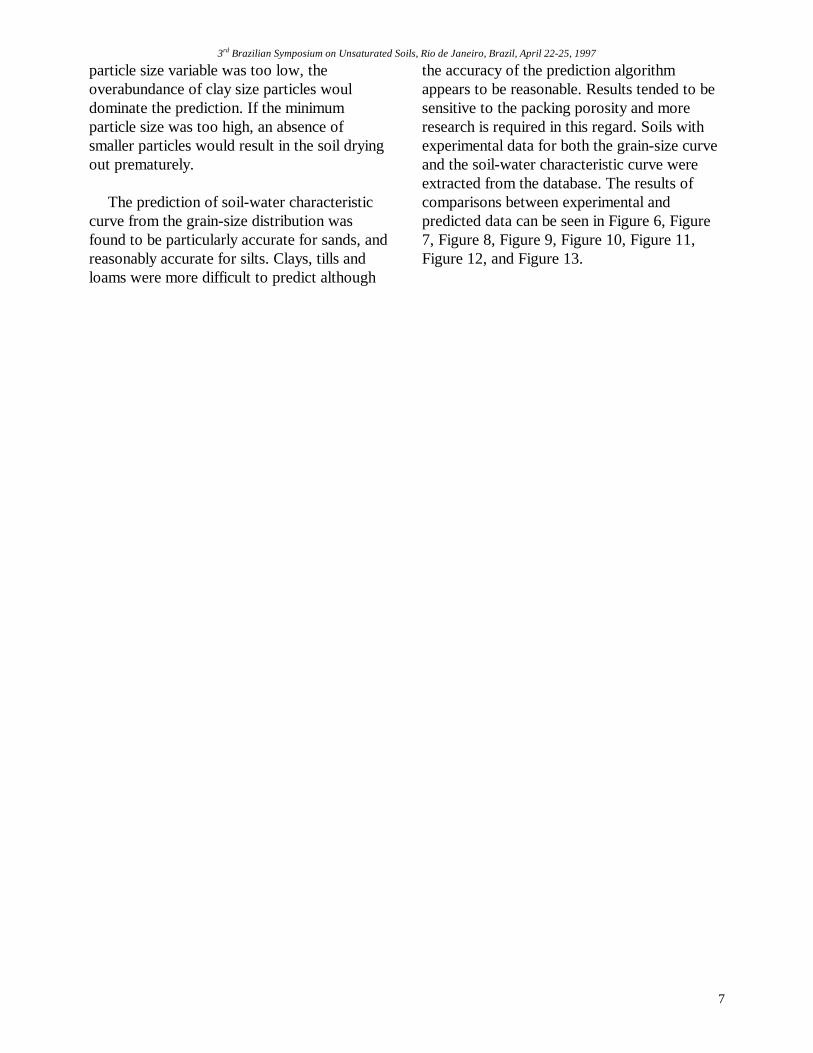
fit the experimental data as well asexperimental data points and generated datapoints on the best fit curve. Figure 5 shows thesecond page of the grain-size distribution form.
The header on the form allows for a numberof helpful functions and algorithms. If soil dataconsists of % Coarse, % Sand, % Silt, %Clayor D10, D20, D30, D50, or D60 data on pagetwo of the main soil form, pressing a buttonwill convert this data into experimental pointsalong the grain-size distribution graph. Onceexperimental data is obtained, pressing FitCurve! will initiate the linear regressionalgorithm that will best-fit the equation toexperimental data. The results of the fit can beviewed by pressing the Graph! button and asoil-water characteristic curve can be predictedby pressing the Predict SWCC... button.
3rd Brazilian Symposium on Unsaturated Soils, Rio de Janeiro, Brazil, April 22-25, 1997
6
Figure 4 Page one of the grain-size distribution form
Figure 5 Page two of the grain-size distribution form
CONCLUSIONSThe readapted Fredlund & Xing (1994)
equation produces a satisfactory fit of thegrain-size distribution. Figure 3 shows that theexperimental data can be fit with a minimal
error. A good curve fit of the grain-size curveis essential for the prediction of a reasonablesoil-water characteristic curve. The minimumparticle size was also found to have aninfluence on the prediction of the soil-watercharacteristic curve prediction. If the minimum
3rd Brazilian Symposium on Unsaturated Soils, Rio de Janeiro, Brazil, April 22-25, 1997
7
particle size variable was too low, theoverabundance of clay size particles wouldominate the prediction. If the minimumparticle size was too high, an absence ofsmaller particles would result in the soil dryingout prematurely.
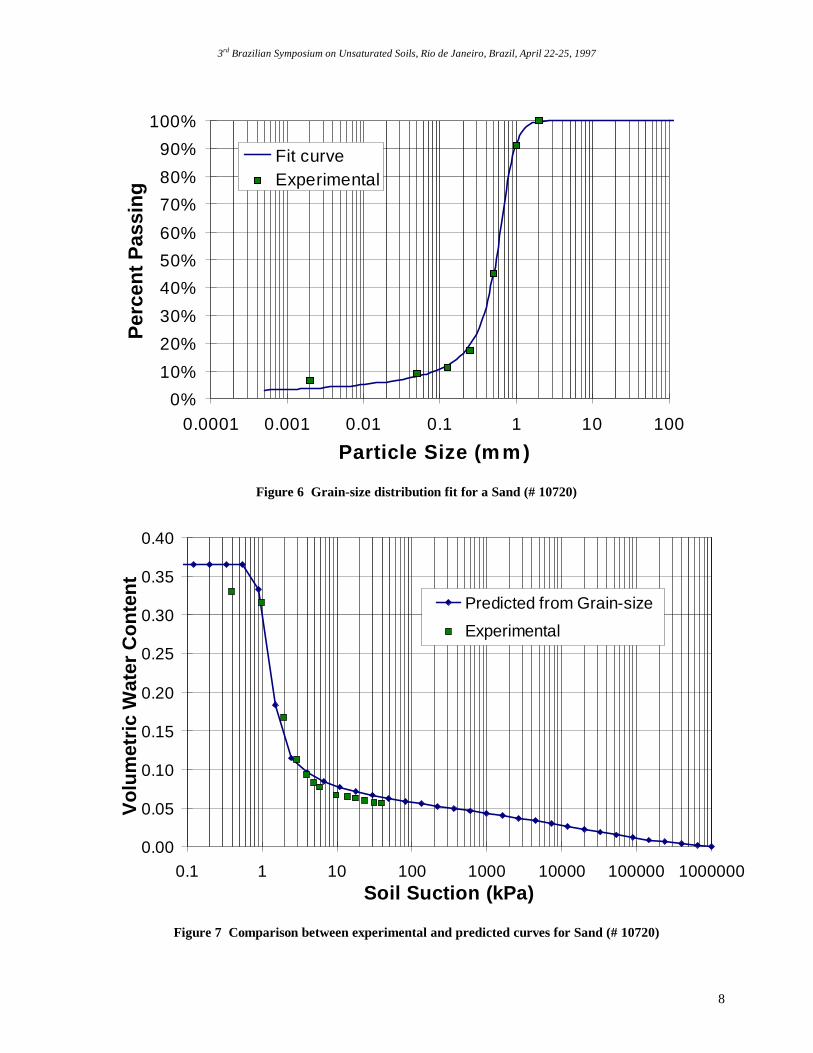
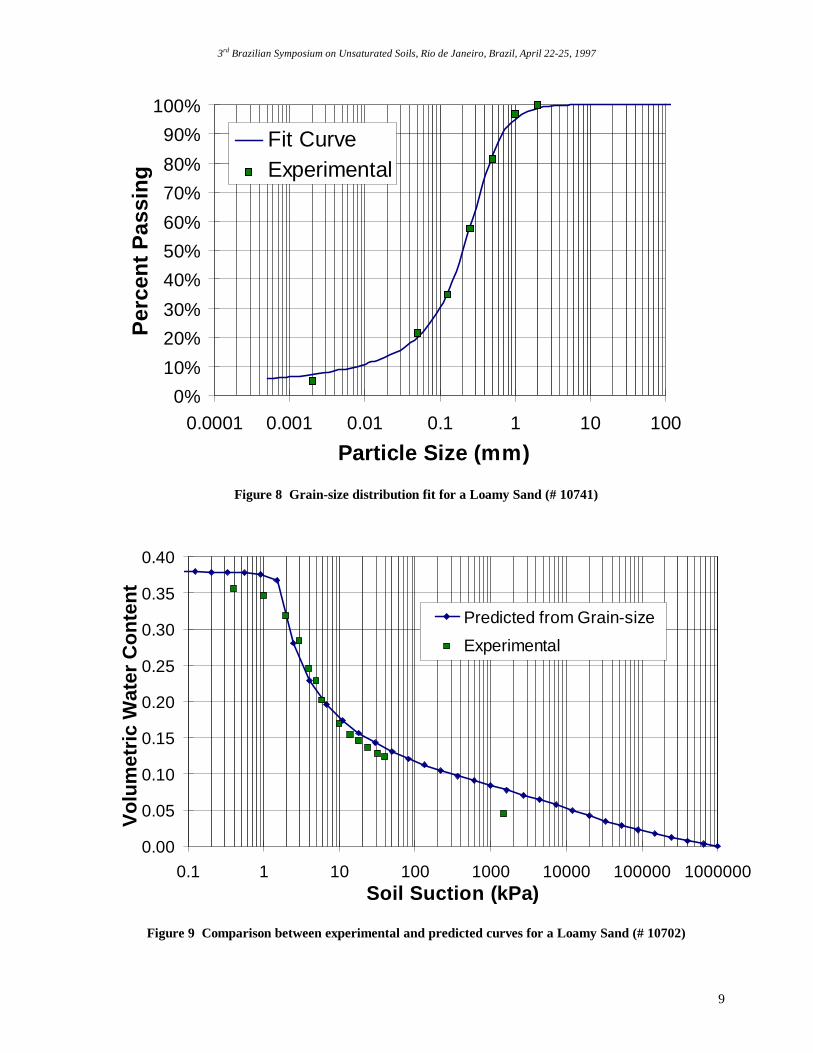
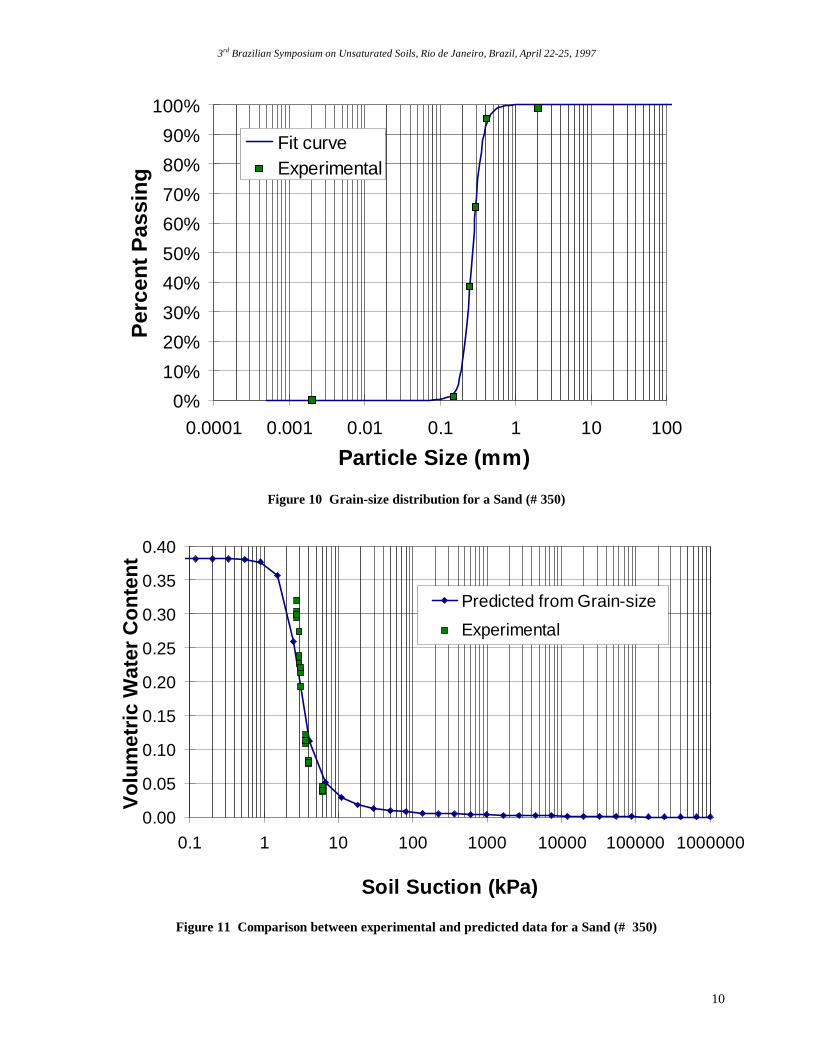
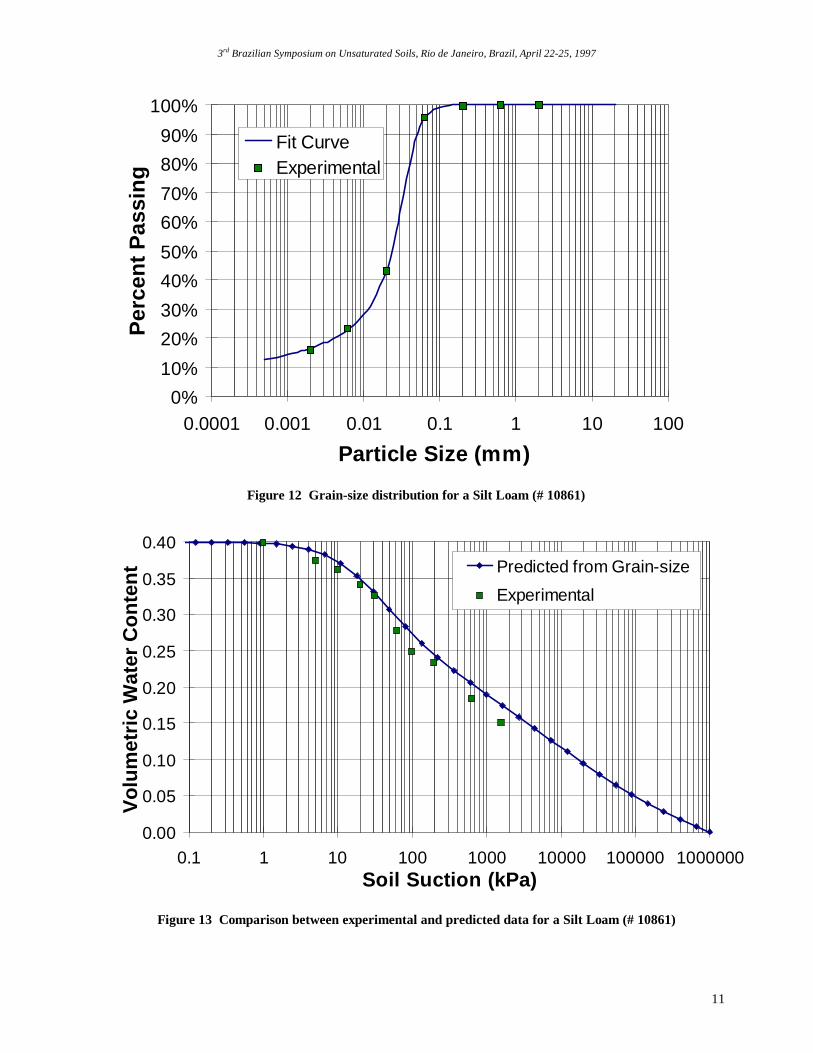
The prediction of soil-water characteristiccurve from the grain-size distribution wasfound to be particularly accurate for sands, andreasonably accurate for silts. Clays, tills andloams were more difficult to predict although
the accuracy of the prediction algorithmappears to be reasonable. Results tended to besensitive to the packing porosity and moreresearch is required in this regard. Soils withexperimental data for both the grain-size curveand the soil-water characteristic curve wereextracted from the database. The results ofcomparisons between experimental andpredicted data can be seen in Figure 6, Figure7, Figure 8, Figure 9, Figure 10, Figure 11,Figure 12, and Figure 13.
3rd Brazilian Symposium on Unsaturated Soils, Rio de Janeiro, Brazil, April 22-25, 1997
8
0%
10%
20%
30%
40%
50%
60%
70%
80%
90%
100%
0.0001 0.001 0.01 0.1 1 10 100
Particle Size (m m )
Per
cent
Pas
sing
Fit curveExperimental
Figure 6 Grain-size distribution fit for a Sand (# 10720)
0.00
0.05
0.10
0.15
0.20
0.25
0.30
0.35
0.40
0.1 1 10 100 1000 10000 100000 1000000Soil Suction (kPa)
Vol
umet
ric W
ater
Con
tent Predicted from Grain-size
Experimental
Figure 7 Comparison between experimental and predicted curves for Sand (# 10720)
3rd Brazilian Symposium on Unsaturated Soils, Rio de Janeiro, Brazil, April 22-25, 1997
9
0%
10%
20%
30%
40%
50%
60%
70%
80%
90%
100%
0.0001 0.001 0.01 0.1 1 10 100
Particle Size (mm)
Per
cent
Pas
sing
Fit CurveExperimental
Figure 8 Grain-size distribution fit for a Loamy Sand (# 10741)
0.00
0.05
0.10
0.15
0.20
0.25
0.30
0.35
0.40
0.1 1 10 100 1000 10000 100000 1000000Soil Suction (kPa)
Vol
umet
ric W
ater
Con
tent Predicted from Grain-size
Experimental
Figure 9 Comparison between experimental and predicted curves for a Loamy Sand (# 10702)
3rd Brazilian Symposium on Unsaturated Soils, Rio de Janeiro, Brazil, April 22-25, 1997
10
0%
10%
20%
30%
40%
50%
60%
70%
80%
90%
100%
0.0001 0.001 0.01 0.1 1 10 100
Particle Size (mm)
Per
cent
Pas
sing
Fit curveExperimental
Figure 10 Grain-size distribution for a Sand (# 350)
0.00
0.05
0.10
0.15
0.20
0.25
0.30
0.35
0.40
0.1 1 10 100 1000 10000 100000 1000000
Soil Suction (kPa)
Vol
umet
ric W
ater
Con
tent
Predicted from Grain-size
Experimental
Figure 11 Comparison between experimental and predicted data for a Sand (# 350)
3rd Brazilian Symposium on Unsaturated Soils, Rio de Janeiro, Brazil, April 22-25, 1997
11
0%
10%
20%
30%
40%
50%
60%
70%
80%
90%
100%
0.0001 0.001 0.01 0.1 1 10 100
Particle Size (mm)
Per
cent
Pas
sing
Fit CurveExperimental
Figure 12 Grain-size distribution for a Silt Loam (# 10861)
0.00
0.05
0.10
0.15
0.20
0.25
0.30
0.35
0.40
0.1 1 10 100 1000 10000 100000 1000000Soil Suction (kPa)
Vol
umet
ric W
ater
Con
tent
Predicted from Grain-size
Experimental
Figure 13 Comparison between experimental and predicted data for a Silt Loam (# 10861)
3rd Brazilian Symposium on Unsaturated Soils, Rio de Janeiro, Brazil, April 22-25, 1997
12
ACKNOWLEDGEMENTSI wish to acknowledge the help of G.W.
Wilson in forming some of the ideas for thisprediction. Also of note was the help I recievedfrom Sai Vanapalli locating previous researchdone in this field.
REFERENCESAberg, B., 1996, Void sizes in granular soils,
Journal of Geotechnical Engineering, Vol.122, No. 3, pp. 236-239
Ahuja, L.R., Naney, J.W., and Williams, R.D.,1985, Estimating soil-water characteristicsfrom simpler properties or limited data, SoilSci. Soc. Am. Journal., Vol. 49, pp. 1100-1105.
Arya, L.M., and Paris J.F., 1981, Aphysicoempirical model to predict the soilmoisture characteristic from particle-sizedistribution and bulk density data, SoilScience Society of America Journal, Vol.45, pp. 1023-1030.
Fredlund, M.D., Sillers, W.S., Fredlund, D.G.,Wilson, G.W., 1996, Design of aknowledge-based system for unsaturatedsoil properties, Third Canadian Conferenceon Computing in Civil and BuildingEngineering, pp. 659-677
Ghosh, R.K., 1980, Estimation of soil-moisture characteristics from mechanicalproperties of soils, Soil Science Journal,Vol. 130, No. 2, pp. 60-63
Gupta, S.C., and Larson, W.E., 1979,Estimating soil-water retentioncharacteristics from particle size distribution,organic matter percent, and bulk density,Water Resources Research Journal, Vol. 15,No. 6, pp. 1633-1635
Harr, M.E., 1977, Mechanics of particulatemedia, McGraw - Hill International BookCompany, New York, 27-33
Wagner, L.E., and Ding, D., 1994,Representing aggregate size distributions asmodified lognormal distributions, AmericanSociety of Agricultural Engineers, Vol. 37,No. 3, pp. 815-821