interpretation of soil-water characteristic curves …...interpretation of soil-water characteristic...
TRANSCRIPT
15
Advances in Unsaturated Soils – Caicedo et al. (eds)© 2013 Taylor & Francis Group, London, ISBN 978-0-415-62095-6
Interpretation of soil-water characteristic curves when volume change occurs as soil suction is changed
D.G. FredlundGolder Associates Ltd., Saskatoon, SK, Canada
S.L. HoustonSchool of Sustainable Engineering and the Built Environment, Arizona State University, Tempe, AZ, USA
ABSTRACT: The soil-water characteristic curve, SWCC, has become a valuable tool for the estimation of unsaturated soil property functions, USPF, in geotechnical engineering practice. At the same time, indiscriminate usage of the estimation techniques for unsaturated soils can lead to erroneous analytical results and poor engineering judgment. Soils that undergo significant volume changes as soil suction is changed constitute one situation where erroneous estimations can occur. In particular, it is the evaluation of the correct air-entry value for the soil that has a significant effect on the estimation of subsequent USPFs. This paper defines the characteristics of a high volume change material and then proceeds to describe how the SWCC laboratory results can be properly interpreted with the assistance of a shrinkage curve. Two laboratory data sets are presented and used to illustrate how the test data should be inter-preted in the case of high volume change soils. There have also been developments in the design of SWCC laboratory equipment with the result that both overall volume change and water content change can be monitored when measuring SWCCs. As a result, all volume-mass properties can be calculated. One such apparatus is described along with a description of its benefits and limitations.
relationship between the amount of water in a soil and soil suction. Within unsaturated soil mechan-ics, the drying (or desorption) SWCC branch has received the most attention. Disturbance of the soil samples has historically been of limited con-cern, or at least neglected, in both agriculture and geotechnical engineering, with disturbed and remolded soil samples often being used for labora-tory testing.
Some of the concepts and measurement pro-cedures for determining the relationship between the amount of water in a soil and soil suction (i.e., SWCC) are now receiving increased research inter-est as unsaturated soil mechanics is increasingly being used in geotechnical engineering applica-tions. It was prudent and appropriate that con-sideration be given in geotechnical engineering to the wealth of knowledge that has accumulated within soil physics and agriculture. Along with the wealth of accumulated knowledge and experience, however, there are serious differences between the goals to be achieved in agriculture-related disci-plines and the goals of geotechnical engineering. Unfortunately, many of these limitations have often been overlooked in the eagerness to make use of the SWCC. Unfortunately, the laboratory test procedures from soil physics and the application
1 INTRODUCTION
The soil-water characteristic curve, SWCC, has become an important relationship to determine when applying unsaturated soil mechanics in engineering practice. The technologies related to the SWCC were originally developed in soil physics and agriculture-related disciplines. These technologies have slowly been embraced, with some modifications, in the application of unsaturated soil mechanics (Fredlund, 2002; Fredlund and Rahardjo, 1993).
Soil physics has primarily promoted the use of the SWCC within agriculture for the estimation of the water storage characteristics of soils near the ground surface. Unsaturated soil mechanics has primarily utilized the SWCC for the estima-tion of unsaturated soil property functions which are subsequently used in numerical modelling solutions of geotechnical engineering problems (Fredlund, 2010). It has long been recognized that there are independent drying and wetting branches for the SWCC, as well as an infinite number of scanning curves between the drying and wetting branches. However, the SWCC has often been treated in both agriculture and geotechnical engi-neering as though it were a single approximate
16
of the SWCC theory in geotechnical engineering have not been fully researched prior to usage in geotechnical engineering. As a consequence, geo-technical engineers are now faced with the need to reconsider various aspects of the application of the SWCC. Some of the areas requiring further research for geotechnical engineering applications are highlighted in this paper.
2 THE PATH FORWARD
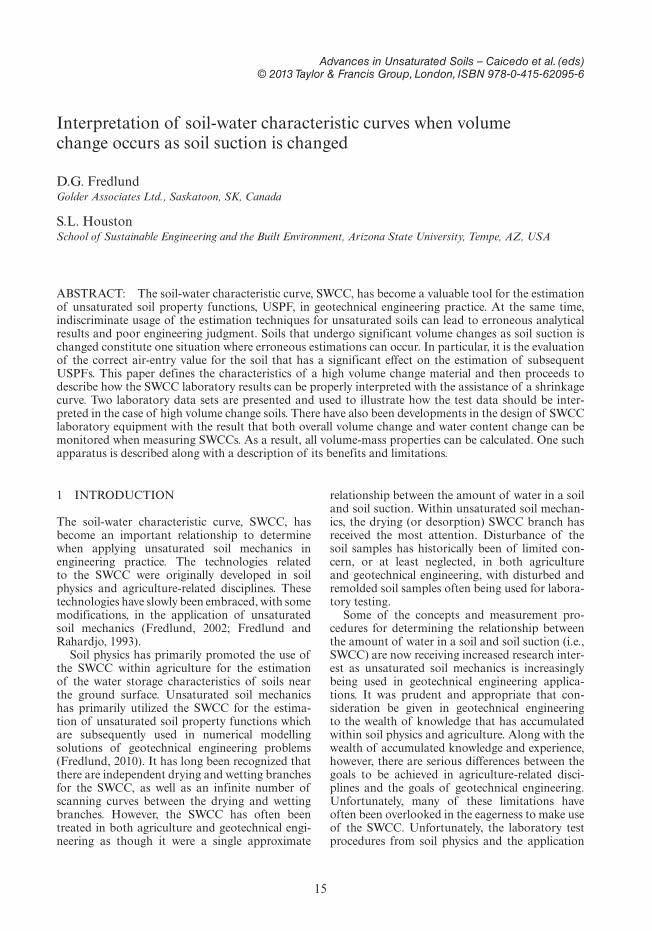
There are two approaches that could be taken with regard to further refinement in the applica-tion of the SWCC in unsaturated soil mechanics (Figure 1). First, it is possible that modified labo-ratory test procedures be developed and used for the measurement of the amount of water in the soil versus soil suction relationships in geotechnical engineering. It is also possible that new laboratory test equipment be designed to more realistically simulate field conditions. Second, it is possible that an additional, independent test be performed that would assist with the interpretation of a conven-tional gravimetric water content SWCC. An inde-pendent laboratory test that can be performed is a “shrinkage curve” test. The shrinkage curve test provides a fixed relationship between the gravimet-ric water content and the instantaneous void ratio of the soil. The authors would suggest that both of the above-mentioned approaches be given consid-eration. A review of the research literature shows that modified apparatuses for geotechnical appli-cations have already become a trend for measur-ing the SWCC. Alternate testing procedures have also been proposed in the research literature. In particular, the need for a modification to the deter-mination of an appropriate SWCC has arisen in situations where the soil changes volume as soil suction is changed.
The development of testing apparatuses that measure the SWCC under controlled suction and net normal stress, along with volume change meas-urements, is appealing for many geotechnical engi-neering problems (i.e., left branch in Figure 1). The approach that suggests adding a shrinkage test to assist in the interpretation of the SWCC (i.e., right branch in Figure 1), blends in well with the proce-dures that have already been used in engineering practice as well as agriculture-related disciplines. In other words, the existing laboratory test proce-dures associated with the SWCC would continue to be used; or available data sets used, however, greater care needs to be taken in the interpretation and application of the results in engineering prac-tice. This approach may be particularly appealing when net normal stress is relatively low in the field application.
This paper presents information on both of the above-suggested options for accommodating vol-ume change that occurs as a result of soil suction changes. The paper also describes the procedures related to the determination of appropriate SWCCs for geotechnical engineering practice. The scope of the paper embraces consideration of sand, silt and clay textured soils and the differences involved in the interpretation of the laboratory results. Dif-ferences in interpretation primarily depend upon the amount of volume change experienced dur-ing the application of soil suction at a given net normal stress. Another objective is to illustrate the importance of the shrinkage curve in interpreting the SWCC laboratory test results. Laboratory test results are presented for highly plastic soils that are initially prepared in a slurry condition. These mate-rials undergo significant volume change as soil suc-tion is increased. Data is obtained using modified Ko equipment to determine the SWCC curve, with volume change, on a compacted expansive soil.
3 EXAMPLES OF VOLUME CHANGE AS SOIL SUCTION IS CHANGED
The conventional application of the SWCC for the estimation of unsaturated soil property functions commences with the assumption that the soil does not significantly change volume as soil suction is increased. This assumption may be reasonable for low compressibility sands, silts and dense coarse-grained soils. However, there are other situations where the geotechnical engineer must determine unsaturated soil property functions when the soil undergoes considerable volume change with changes in soil suction. Such applications include wetting and drying of expansive clays, wetting of collapsible soils, and drying of slurry materials.
A common situation where extreme vol-ume change occurs in the soil as soil suction is increased, involves the drying of initially wet or slurry materials. Sludge material and slurry mate-rial (e.g., Mature Fine Tailings, MFT, from the Oil
Figure 1. Approaches that can be taken to accommodate volume changes associated with soil suction changes.
17
Sands operation), are deposited at water contents well above the liquid limit of the material (e.g., w = 100%). The material is deposited in ponds and allowed to dry in order to increase its shear strength. The geotechnical engineer is called upon to undertake numerical modelling simulations of the drying process. Volume changes in excess of 100% are common, and failure to take volume change into consideration yields erroneous results during the drying simulation.
Almost any situation where a soil starts under very wet conditions and is subjected to drying will result in significant volume change. The material may be initially saturated and may remain near saturation, as soil suction increases during the drying process. Estimation procedures that have historically been proposed for the calculation of unsaturated soil property functions assume that a decrease in water content corresponds to a decrease in the degree of saturation of the soil. This may not always be the case and consequently the estimation procedures will give erroneous results when either gravimetric water content or volumetric water con-tent SWCCs are used to calculate unsaturated soil properties such as the permeability functions.
Expansive soils problems are often associated with the soil taking on water as a result of infil-tration. This is an adsorption process that involves the wetting SWCC. The effect of hysteresis needs to be taken into consideration as well as the effect of volume changes that occur as the soil dries or goes towards saturation.
Collapsible soils follow a different drying stress path than wetting stress path. The collapsible soil may initially be in a relatively dry state with sub-stantial soil suction. As the soil imbibes water the volume of the soil decreases (or collapses). This has been a difficult stress path to simulate through numerical modelling. Volume change as soil suc-tion is decreased has an effect on the determination of suitable unsaturated soil property functions.
This paper mainly focuses on the estimation of suitable SWCCs for soils that have high initial water content. At the same time it is recognized that there may be other stress paths that might need to be simulated in geotechnical engineering practice. This paper also discusses the benefits that can be accrued through use of modified pres-sure plate apparatuses for the measurement of the SWCC.
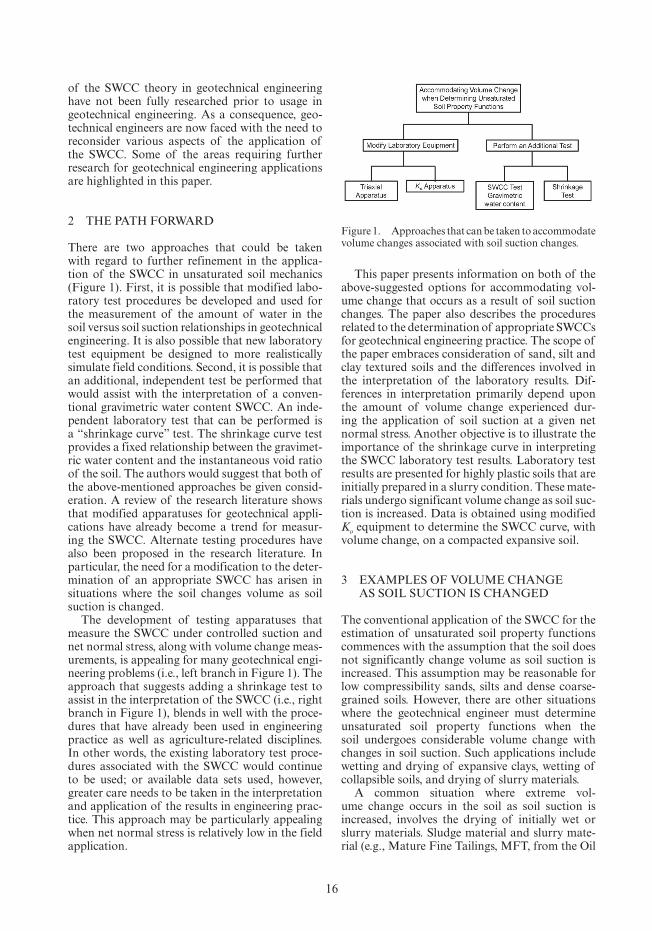
4 DESCRIPTION OF SWCC TEST PROCEDURES COMMONLY USED IN SOIL PHYSICS
Historically, soil specimens have been initially saturated, placed on a pressure plate apparatus
under very light confining stress and subjected to increasing matric suction values while equilibrium water contents were measured. The equilibrium water content (for each applied matric suction), was generally established in one to three days depending upon the soil type. Applied air pres-sures were applied to the soil specimen(s) and the matric suction was established through use of the axis-translation technique. Pressure plate appara-tuses were developed that either tested one or mul-tiple soil specimens simultaneously.
Matric suction values were increased on a loga-rithm scale (i.e., doubling the applied air pressure), until the air-entry value of the ceramic pressure plate was reached. The ceramic pressure plates gen-erally had air-entry values ranging from 100 kPa to 1,500 kPa. The high range of soil suctions (i.e., beyond 1,500 kPa), were generally applied using vapour pressure equalization of small soil samples placed above saturated salt solutions in a vacuum desiccator.
Changes in the amount of water in the soil were either determined through measurement of changes in the overall mass of the soil specimens or the change in the volume of water expelled from the soil under each applied matric suction. In either case, the laboratory results were gener-ally presented as a graph of volumetric water content on the ordinate versus the logarithm of soil suction. The assumption was made that the initial soil specimen was initially saturated. A sec-ond assumption was also made in presenting the laboratory results; namely, that the overall vol-ume of the soil specimens did not change as the applied soil suction were increased. This assump-tion allowed measurements of changes in the mass of water in the soil to be used to back-calculate volumetric water contents for all applied soil suc-tion values.
The above-mentioned testing procedure has served the agriculture-related disciplines quite well where the primary objective was to quantify the water storage in the soil under various applied suction conditions. It should be noted that while the SWCC used in agriculture is usually plotted as a graph of volumetric water content versus soil suction, the plot is only rigorously correct provided there is no volume change as soil suc-tion is increased. All changes in the mass or vol-ume of water removed as soil suction is changed are referenced back to the original volume of the soil specimen. It should be noted that volumetric water content is rigorously defined as the volume of water in the soil referenced to the instantaneous overall volume. Consequently, volumetric water content is correctly defined from gravimetric water content change alone only when no overall volume change occurs.
18
5 DESCRIPTION OF SWCC TEST PROCEDURES COMMONLY USED IN GEOTECHNICAL ENGINEERING
The purpose for which the SWCC laboratory results are used in geotechnical engineering is quite differ-ent from that of the agriculture disciplines and as a result, questions arise as to whether it is necessary to change the SWCC test procedure, the interpre-tation procedure or both. This paper shows that application of the SWCC in geotechnical engineer-ing is somewhat different from applications in agri-culture, primarily because soil volume change in response to wetting and loading for many geotech-nical engineering applications can be substantial.
Test procedures that had been used in agriculture for several decades began to be used in geotechnical engineering subsequent to 1960 (Fredlund, 1964). The need to measure the SWCC became apparent when it was realized that changes in the suction of a soil pro-duced an independent effect on soil behavior from changes in total stress. Engineering problems associ-ated with expansive soils provided the initial impetus for understanding swelling soil behavior in terms of changes in soil suction. In most cases, the expansive soils had substantial clay content and underwent considerable volume change during the swelling proc-ess associated with wetting. In addition, subsequent applications of matric suction resulted in a decrease in the volume of the soil specimens. There are other applications of unsaturated soil mechanics in geo-technical engineering that involve soil volume change due to change in soil suction. Examples involve the drying of initially slurry materials and the wetting of collapsible soils. For drying of initially slurried soils there can be extremely large volume changes associ-ated with the application of soil suction.
The primary application of SWCCs in geotech-nical engineering has been for the estimation of unsaturated soil properties such as permeability function (i.e., hydraulic conductivity versus soil suction) (e.g., Fredlund et al., 1994; van Genutchen, 1980), and the shear strength function, (i.e., shear strength versus soil suction) (e.g., Vanapalli et al., 1996; Fredlund et al., 1996). The estimation of realistic hydraulic conductivity functions depends on the separation of volume changes that might occur while the soil remains saturated from volume changes that occur as the soil desaturates.
Conventional testing procedures adopted within soil physics have not made a clear distinction between these two volume change mechanisms. Direct acceptance and adoption of soil physics SWCC testing procedures can result in serious deficiencies when testing materials that undergo volume change as soil suction is increased. Stated another way, it is not sufficient to measure changes in the mass or volume of water removed from the
soil between various applied soil suctions. Rather, it is necessary to quantify the amount of volume change that occurs and to separate the volume changes that occur while the soil remains satu-rated from the volume changes (and water content changes) that occur as the soil desaturates. The estimation procedures for unsaturated soil prop-erty functions is different when the soil is undergo-ing volume change from the situation where there is no volume change as soil suction is changed.
The differences in physical processes associated with the two types of volume change give rise to the need to be able to measure both changes in the volume of water mass as well as actual (or instan-taneous) volume changes of the soil specimen. Two approaches to addressing this need for volume change measurements are considered in this paper. The first approach considers modifying the labora-tory SWCC apparatuses such that the volume of the soil specimens is measured during the test. Devices that have been developed to meet this need are dis-cussed later in this paper. The second approach suggests using an independent test to measure the relationship between gravimetric water content and void ratio. The required laboratory test is referred to as a shrinkage test and details related to this pro-cedure are subsequently outlined in this paper.
6 USE OF SIGMOIDAL EQUATIONS FOR SWCCS
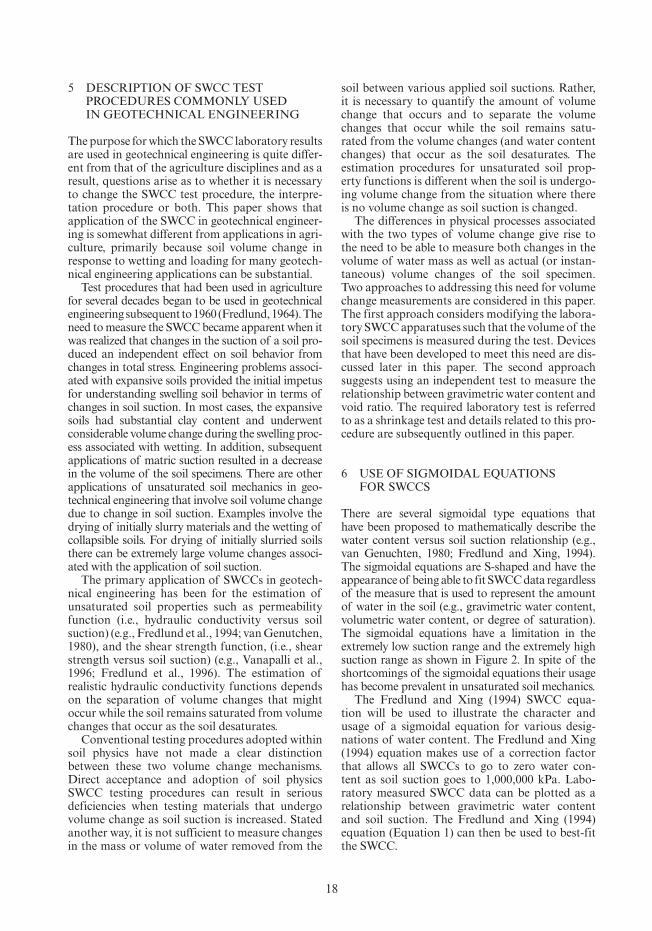
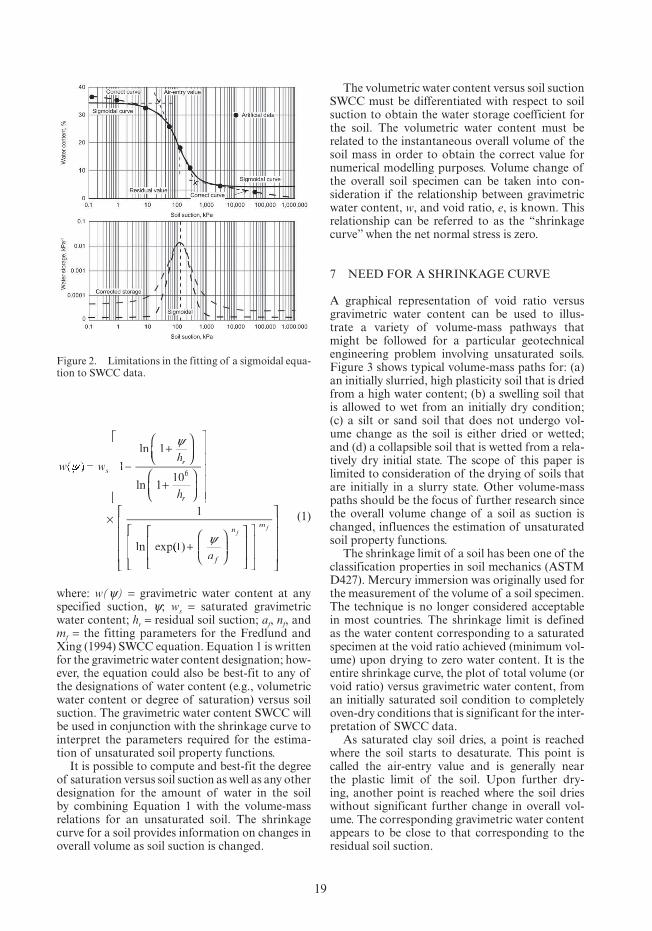
There are several sigmoidal type equations that have been proposed to mathematically describe the water content versus soil suction relationship (e.g., van Genuchten, 1980; Fredlund and Xing, 1994). The sigmoidal equations are S-shaped and have the appearance of being able to fit SWCC data regardless of the measure that is used to represent the amount of water in the soil (e.g., gravimetric water content, volumetric water content, or degree of saturation). The sigmoidal equations have a limitation in the extremely low suction range and the extremely high suction range as shown in Figure 2. In spite of the shortcomings of the sigmoidal equations their usage has become prevalent in unsaturated soil mechanics.
The Fredlund and Xing (1994) SWCC equa-tion will be used to illustrate the character and usage of a sigmoidal equation for various desig-nations of water content. The Fredlund and Xing (1994) equation makes use of a correction factor that allows all SWCCs to go to zero water con-tent as soil suction goes to 1,000,000 kPa. Labo-ratory measured SWCC data can be plotted as a relationship between gravimetric water content and soil suction. The Fredlund and Xing (1994) equation (Equation 1) can then be used to best-fit the SWCC.
19
w wh
h
srh
rh
( )
ln
ln
ln exp
ψ ))
ψ
−w
+⎛⎝⎜⎛⎛⎝⎝
⎞⎠⎟⎞⎞⎠⎠
+⎛
⎝⎜⎛⎛
⎝⎝
⎞
⎠⎟⎞⎞
⎠⎠
⎡
⎣
⎢⎡⎡
⎢⎢⎢
⎢⎢⎢
⎢⎢⎢
⎢⎣⎣⎢⎢
⎤
⎦
⎥⎤⎤
⎥⎥⎥
⎥⎥⎥
⎥⎥⎥
⎥⎦⎦⎥⎥
×
1
1
110
1
6
( )(( +⎛
⎝⎜⎛⎛
⎝⎝
⎞
⎠⎟⎞⎞
⎠⎠
⎡
⎣
⎢⎡⎡
⎢⎣⎣
⎢⎢⎤
⎦
⎥⎤⎤
⎥⎦⎦
⎥⎥⎡
⎣
⎢⎡⎡
⎢⎣⎣
⎢⎢⎤
⎦
⎥⎤⎤
⎥⎦⎦
⎥⎥
⎡
⎣
⎢⎡⎡
⎢⎢⎢
⎢⎢⎢
⎢⎣⎣
⎢⎢
⎤
⎦
⎥⎤⎤
⎥⎥⎥
⎥⎥⎥
⎥⎦⎦
⎥⎥ψaf
nm
ff
(1)
where: w(ψ) = gravimetric water content at any specified suction, ψ; ws = saturated gravimetric water content; hr = residual soil suction; af, nf, and mf = the fitting parameters for the Fredlund and Xing (1994) SWCC equation. Equation 1 is written for the gravimetric water content designation; how-ever, the equation could also be best-fit to any of the designations of water content (e.g., volumetric water content or degree of saturation) versus soil suction. The gravimetric water content SWCC will be used in conjunction with the shrinkage curve to interpret the parameters required for the estima-tion of unsaturated soil property functions.
It is possible to compute and best-fit the degree of saturation versus soil suction as well as any other designation for the amount of water in the soil by combining Equation 1 with the volume-mass relations for an unsaturated soil. The shrinkage curve for a soil provides information on changes in overall volume as soil suction is changed.
The volumetric water content versus soil suction SWCC must be differentiated with respect to soil suction to obtain the water storage coefficient for the soil. The volumetric water content must be related to the instantaneous overall volume of the soil mass in order to obtain the correct value for numerical modelling purposes. Volume change of the overall soil specimen can be taken into con-sideration if the relationship between gravimetric water content, w, and void ratio, e, is known. This relationship can be referred to as the “shrinkage curve” when the net normal stress is zero.
7 NEED FOR A SHRINKAGE CURVE
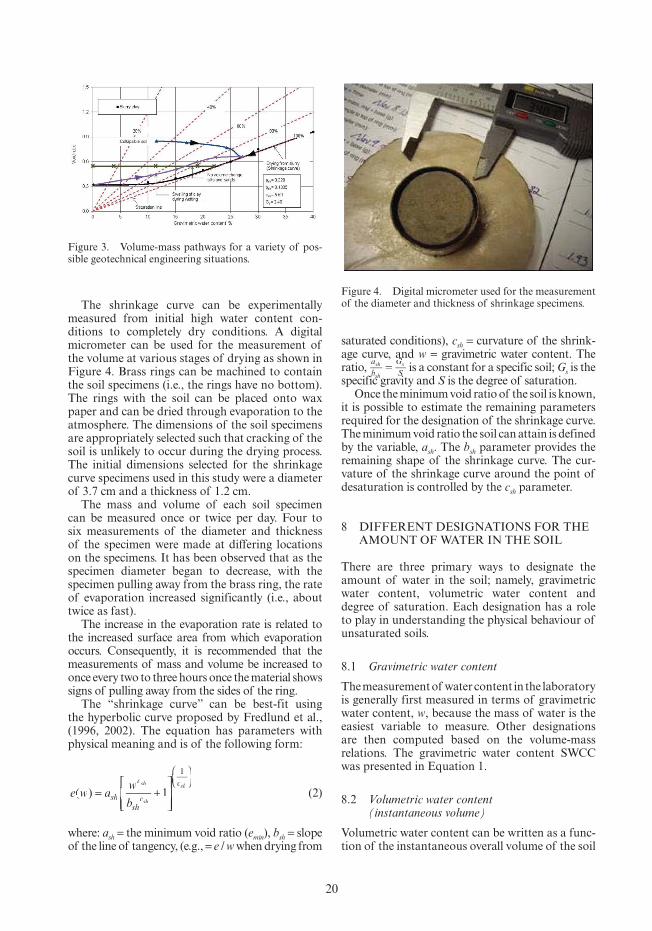
A graphical representation of void ratio versus gravimetric water content can be used to illus-trate a variety of volume-mass pathways that might be followed for a particular geotechnical engineering problem involving unsaturated soils. Figure 3 shows typical volume-mass paths for: (a) an initially slurried, high plasticity soil that is dried from a high water content; (b) a swelling soil that is allowed to wet from an initially dry condition; (c) a silt or sand soil that does not undergo vol-ume change as the soil is either dried or wetted; and (d) a collapsible soil that is wetted from a rela-tively dry initial state. The scope of this paper is limited to consideration of the drying of soils that are initially in a slurry state. Other volume-mass paths should be the focus of further research since the overall volume change of a soil as suction is changed, influences the estimation of unsaturated soil property functions.
The shrinkage limit of a soil has been one of the classification properties in soil mechanics (ASTM D427). Mercury immersion was originally used for the measurement of the volume of a soil specimen. The technique is no longer considered acceptable in most countries. The shrinkage limit is defined as the water content corresponding to a saturated specimen at the void ratio achieved (minimum vol-ume) upon drying to zero water content. It is the entire shrinkage curve, the plot of total volume (or void ratio) versus gravimetric water content, from an initially saturated soil condition to completely oven-dry conditions that is significant for the inter-pretation of SWCC data.
As saturated clay soil dries, a point is reached where the soil starts to desaturate. This point is called the air-entry value and is generally near the plastic limit of the soil. Upon further dry-ing, another point is reached where the soil dries without significant further change in overall vol-ume. The corresponding gravimetric water content appears to be close to that corresponding to the residual soil suction.
Figure 2. Limitations in the fitting of a sigmoidal equa-tion to SWCC data.
20
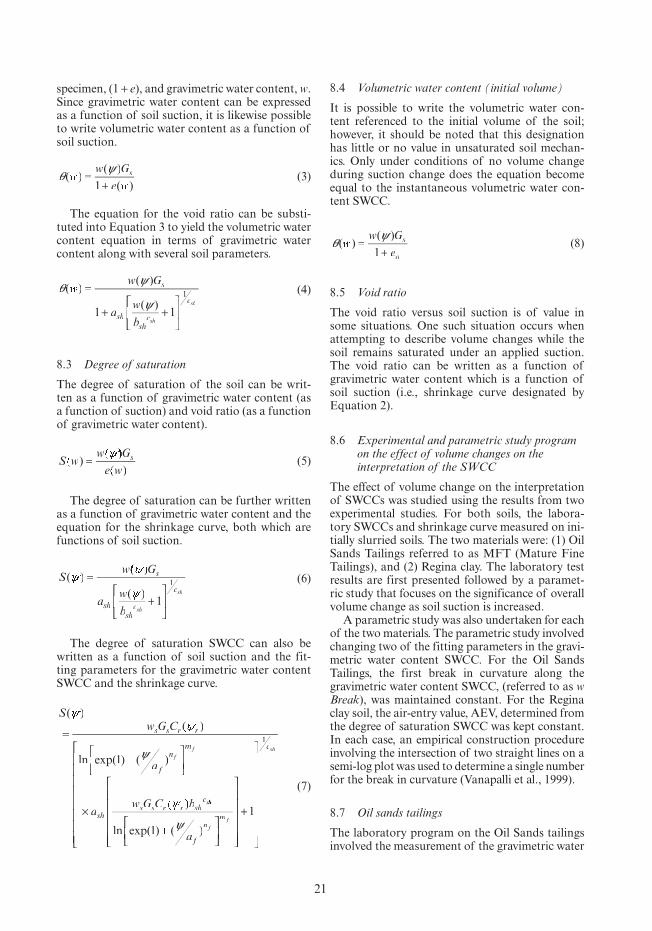
The shrinkage curve can be experimentally measured from initial high water content con-ditions to completely dry conditions. A digital micrometer can be used for the measurement of the volume at various stages of drying as shown in Figure 4. Brass rings can be machined to contain the soil specimens (i.e., the rings have no bottom). The rings with the soil can be placed onto wax paper and can be dried through evaporation to the atmosphere. The dimensions of the soil specimens are appropriately selected such that cracking of the soil is unlikely to occur during the drying process. The initial dimensions selected for the shrinkage curve specimens used in this study were a diameter of 3.7 cm and a thickness of 1.2 cm.
The mass and volume of each soil specimen can be measured once or twice per day. Four to six measurements of the diameter and thickness of the specimen were made at differing locations on the specimens. It has been observed that as the specimen diameter began to decrease, with the specimen pulling away from the brass ring, the rate of evaporation increased significantly (i.e., about twice as fast).
The increase in the evaporation rate is related to the increased surface area from which evaporation occurs. Consequently, it is recommended that the measurements of mass and volume be increased to once every two to three hours once the material shows signs of pulling away from the sides of the ring.
The “shrinkage curve” can be best-fit using the hyperbolic curve proposed by Fredlund et al., (1996, 2002). The equation has parameters with physical meaning and is of the following form:
e aw
bsh
c
shb c
csh
sh
sh
( )w += ash
⎡
⎣⎢⎡⎡
⎣⎣⎢⎢⎣⎣⎣⎣
⎤
⎦⎥⎤⎤
⎦⎦⎥⎥⎦⎦⎦⎦
⎛⎝⎜⎛⎛⎝⎝
⎞⎠⎟⎞⎞⎠⎠
1
1
(2)
where: ash = the minimum void ratio (emin), bsh = slope of the line of tangency, (e.g., = e / w when drying from
saturated conditions), csh = curvature of the shrink-age curve, and w = gravimetric water content. The ratio,
a
b
G
Ssh
shbsG= is a constant for a specific soil; Gs is the
specific gravity and S is the degree of saturation.Once the minimum void ratio of the soil is known,
it is possible to estimate the remaining parameters required for the designation of the shrinkage curve. The minimum void ratio the soil can attain is defined by the variable, ash. The bsh parameter provides the remaining shape of the shrinkage curve. The cur-vature of the shrinkage curve around the point of desaturation is controlled by the csh parameter.
8 DIFFERENT DESIGNATIONS FOR THE AMOUNT OF WATER IN THE SOIL
There are three primary ways to designate the amount of water in the soil; namely, gravimetric water content, volumetric water content and degree of saturation. Each designation has a role to play in understanding the physical behaviour of unsaturated soils.
8.1 Gravimetric water content
The measurement of water content in the laboratory is generally first measured in terms of gravimetric water content, w, because the mass of water is the easiest variable to measure. Other designations are then computed based on the volume-mass relations. The gravimetric water content SWCC was presented in Equation 1.
8.2 Volumetric water content (instantaneous volume)
Volumetric water content can be written as a func-tion of the instantaneous overall volume of the soil
Figure 3. Volume-mass pathways for a variety of pos-sible geotechnical engineering situations.
Figure 4. Digital micrometer used for the measurement of the diameter and thickness of shrinkage specimens.
21
specimen, (1 + e), and gravimetric water content, w. Since gravimetric water content can be expressed as a function of soil suction, it is likewise possible to write volumetric water content as a function of soil suction.
θ ψ( )θθ ( )ψ
( )
w G( )ψe(
sG=
+1 (3)
The equation for the void ratio can be substi-tuted into Equation 3 to yield the volumetric water content equation in terms of gravimetric water content along with several soil parameters.
θ ψ( )θθ ( )ψ( )
( )ψ
w G( )ψ
aw
b
sG
shshb c
c
sh
sh
=⎡
⎣⎢⎡⎡
⎣⎣
⎤
⎦⎥⎤⎤
⎦⎦1
( )ψw1 +ψ( )ψ+ ash ⎢
1 (4)
8.3 Degree of saturation
The degree of saturation of the soil can be writ-ten as a function of gravimetric water content (as a function of suction) and void ratio (as a function of gravimetric water content).
Sw G
esG
( )w( )
( )w=
ψ (5)
The degree of saturation can be further written as a function of gravimetric water content and the equation for the shrinkage curve, both which are functions of soil suction.
Sw G
aw
b
sG
shshb c
c
sh
sh
( )( )
( )
ψ ))ψ
ψ ))
=
+⎡
⎣⎢⎡⎡
⎣⎣
⎤
⎦⎥⎤⎤
⎦⎦1
1
(6)
The degree of saturation SWCC can also be written as a function of soil suction and the fit-ting parameters for the gravimetric water content SWCC and the shrinkage curve.
Sw G C
a
aw G C b
s sG r rCC
f
nm
shs sG r rCC shb c
f
f
s
( )( )r
ln exp( ) ( )
)r
ψ ))
ψ=
⎡⎣⎢⎡⎡⎣⎣
⎤⎦⎥⎤⎤⎦⎦
×
1
hh
f
f
a f
nm
ln exp( ) ( )1
1⎡⎣⎢⎡⎡⎣⎣
⎤⎦⎥⎤⎤⎦⎦
⎡
⎣
⎢⎡⎡
⎢⎢⎢
⎢⎢⎢
⎢⎢⎢
⎢⎣⎣⎢⎢
⎤
⎦
⎥⎤⎤
⎥⎥⎥
⎥⎥⎥
⎥⎥⎥
⎥⎦⎦⎥⎥
+
⎡
⎣
⎢⎡⎡
⎢⎢⎢
⎢⎢⎢
⎢⎢⎢
⎢⎢⎢
⎢⎢⎢
⎢⎢⎢
⎢⎣⎣⎢⎢
⎤
⎦
⎥⎤⎤
⎥⎥⎥
⎥⎥⎥
⎥⎥⎥
ψ⎥⎥⎥⎥⎥⎥
⎥⎥⎥⎥⎥
⎥⎥⎥
⎥⎦⎦⎥⎥
1csh
(7)
8.4 Volumetric water content (initial volume)
It is possible to write the volumetric water con-tent referenced to the initial volume of the soil; however, it should be noted that this designation has little or no value in unsaturated soil mechan-ics. Only under conditions of no volume change during suction change does the equation become equal to the instantaneous volumetric water con-tent SWCC.
θ ψ( )θθ ( )ψ( )w G( )ψ
esG
o
=+1
(8)
8.5 Void ratio
The void ratio versus soil suction is of value in some situations. One such situation occurs when attempting to describe volume changes while the soil remains saturated under an applied suction. The void ratio can be written as a function of gravimetric water content which is a function of soil suction (i.e., shrinkage curve designated by Equation 2).
8.6 Experimental and parametric study program on the effect of volume changes on the interpretation of the SWCC
The effect of volume change on the interpretation of SWCCs was studied using the results from two experimental studies. For both soils, the labora-tory SWCCs and shrinkage curve measured on ini-tially slurried soils. The two materials were: (1) Oil Sands Tailings referred to as MFT (Mature Fine Tailings), and (2) Regina clay. The laboratory test results are first presented followed by a paramet-ric study that focuses on the significance of overall volume change as soil suction is increased.
A parametric study was also undertaken for each of the two materials. The parametric study involved changing two of the fitting parameters in the gravi-metric water content SWCC. For the Oil Sands Tailings, the first break in curvature along the gravimetric water content SWCC, (referred to as w Break), was maintained constant. For the Regina clay soil, the air-entry value, AEV, determined from the degree of saturation SWCC was kept constant. In each case, an empirical construction procedure involving the intersection of two straight lines on a semi-log plot was used to determine a single number for the break in curvature (Vanapalli et al., 1999).
8.7 Oil sands tailings
The laboratory program on the Oil Sands tailings involved the measurement of the gravimetric water
22
content SWCC and the shrinkage curve. The Oil Sands Tailings were prepared with sand to fines ratio, SFR, of 0.1. The liquid limit was 55%, plas-tic limit 22%, and specific gravity, Gs, was 2.40. Approximately 60% of the material classifies as clay size particles.
The analysis of the test results assumed that the initial starting (saturated) gravimetric water content was increased while the remaining curve-fitting parameters were kept constant. In other words, the first break in curvature along the gravi-metric water content SWCC, (w Break), was kept constant. Changes in the air-entry values from the degree of saturation SWCC, (i.e., AEV or air-entry value) were then determined.
If the soil did not undergo any volume change, then the “w Break” and the AEV would be equal, or the ratio of AEV to w Break would be equal to 1.0. Consequently, the ratio of AEV to w Break can be used as a measure of the effect of volume change on the interpretation of the correct air-en-try value for the soil.
8.8 Regina clay
The Regina clay had a liquid limit of 75%, a plas-tic limit of 25% and contained 50% clay size parti-cles. The material was prepared as slurry and then subjected to various consolidation pressures under one-dimensional loading. After the applied load was removed, the soil specimens were subjected to various applied matric suction values. High suc-tion values were applied through equalization in a constant relative humidity environment. The para-metric study then assumed that the air-entry value determined from the degree of saturation SWCC remained at a constant value. (This was confirmed by the experimental results). The “w Break” on the gravimetric water content SWCCs were then com-pared to the air-entry value for the soil. The ratio of AEV to w Break was used as a measure of the effect of volume change on the interpretation of the correct air-entry value for the soil.
8.9 Presentation of the laboratory measurements on oil sands tailings
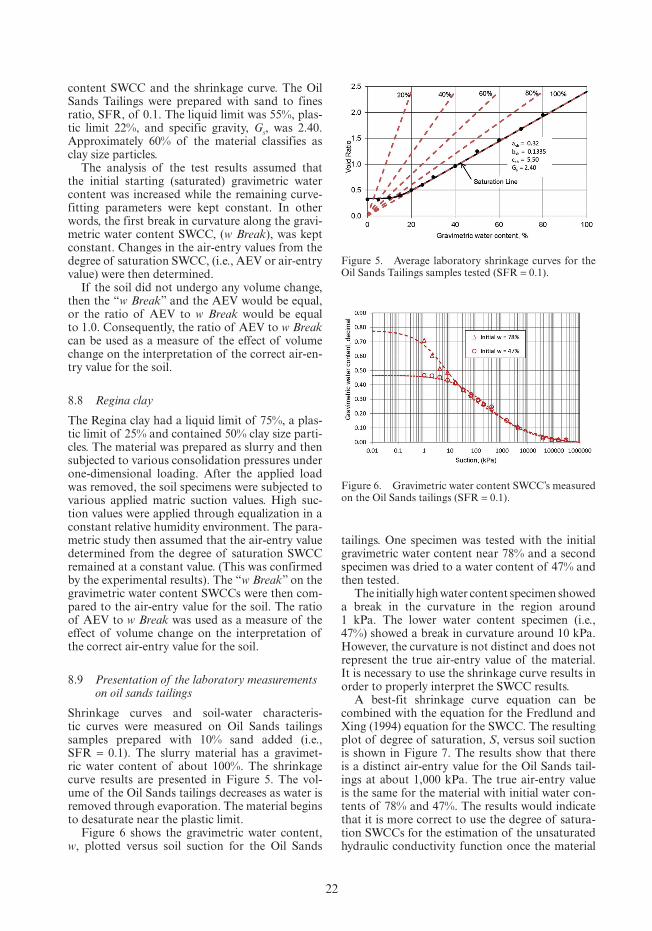
Shrinkage curves and soil-water characteris-tic curves were measured on Oil Sands tailings samples prepared with 10% sand added (i.e., SFR = 0.1). The slurry material has a gravimet-ric water content of about 100%. The shrinkage curve results are presented in Figure 5. The vol-ume of the Oil Sands tailings decreases as water is removed through evaporation. The material begins to desaturate near the plastic limit.
Figure 6 shows the gravimetric water content, w, plotted versus soil suction for the Oil Sands
tailings. One specimen was tested with the initial gravimetric water content near 78% and a second specimen was dried to a water content of 47% and then tested.
The initially high water content specimen showed a break in the curvature in the region around 1 kPa. The lower water content specimen (i.e., 47%) showed a break in curvature around 10 kPa. However, the curvature is not distinct and does not represent the true air-entry value of the material. It is necessary to use the shrinkage curve results in order to properly interpret the SWCC results.
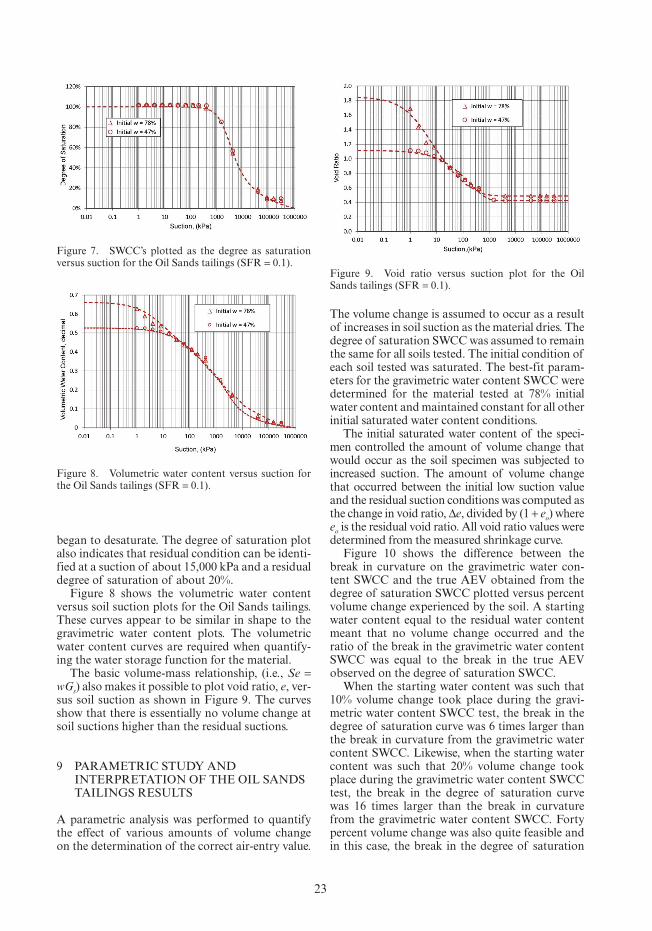
A best-fit shrinkage curve equation can be combined with the equation for the Fredlund and Xing (1994) equation for the SWCC. The resulting plot of degree of saturation, S, versus soil suction is shown in Figure 7. The results show that there is a distinct air-entry value for the Oil Sands tail-ings at about 1,000 kPa. The true air-entry value is the same for the material with initial water con-tents of 78% and 47%. The results would indicate that it is more correct to use the degree of satura-tion SWCCs for the estimation of the unsaturated hydraulic conductivity function once the material
Figure 5. Average laboratory shrinkage curves for the Oil Sands Tailings samples tested (SFR = 0.1).
Figure 6. Gravimetric water content SWCC’s measured on the Oil Sands tailings (SFR = 0.1).
23
began to desaturate. The degree of saturation plot also indicates that residual condition can be identi-fied at a suction of about 15,000 kPa and a residual degree of saturation of about 20%.
Figure 8 shows the volumetric water content versus soil suction plots for the Oil Sands tailings. These curves appear to be similar in shape to the gravimetric water content plots. The volumetric water content curves are required when quantify-ing the water storage function for the material.
The basic volume-mass relationship, (i.e., Se = wGs) also makes it possible to plot void ratio, e, ver-sus soil suction as shown in Figure 9. The curves show that there is essentially no volume change at soil suctions higher than the residual suctions.
9 PARAMETRIC STUDY AND INTERPRETATION OF THE OIL SANDS TAILINGS RESULTS
A parametric analysis was performed to quantify the effect of various amounts of volume change on the determination of the correct air-entry value.
The volume change is assumed to occur as a result of increases in soil suction as the material dries. The degree of saturation SWCC was assumed to remain the same for all soils tested. The initial condition of each soil tested was saturated. The best-fit param-eters for the gravimetric water content SWCC were determined for the material tested at 78% initial water content and maintained constant for all other initial saturated water content conditions.
The initial saturated water content of the speci-men controlled the amount of volume change that would occur as the soil specimen was subjected to increased suction. The amount of volume change that occurred between the initial low suction value and the residual suction conditions was computed as the change in void ratio, Δe, divided by (1 + eo) where eo is the residual void ratio. All void ratio values were determined from the measured shrinkage curve.
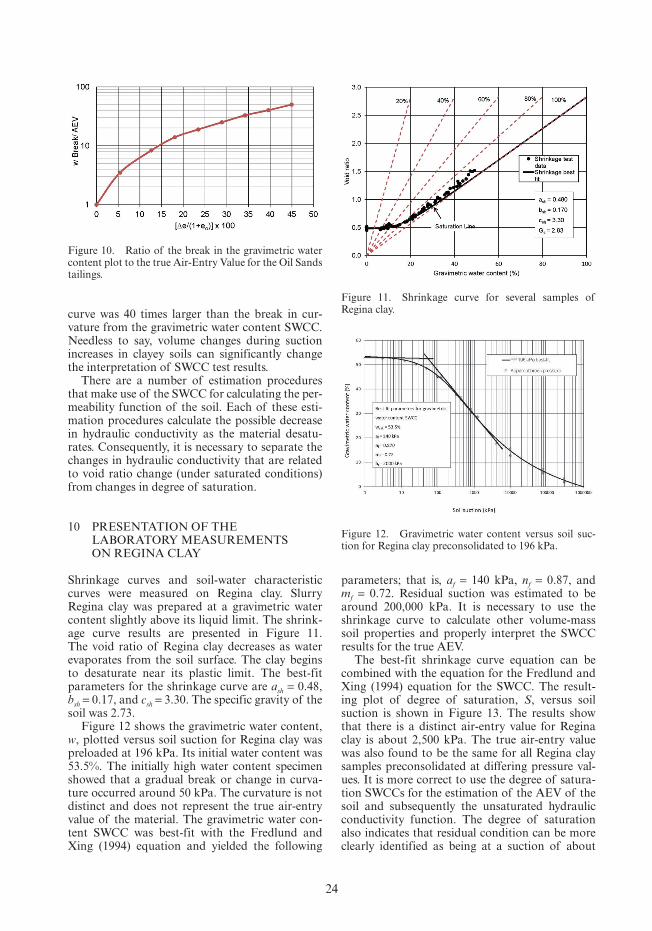
Figure 10 shows the difference between the break in curvature on the gravimetric water con-tent SWCC and the true AEV obtained from the degree of saturation SWCC plotted versus percent volume change experienced by the soil. A starting water content equal to the residual water content meant that no volume change occurred and the ratio of the break in the gravimetric water content SWCC was equal to the break in the true AEV observed on the degree of saturation SWCC.
When the starting water content was such that 10% volume change took place during the gravi-metric water content SWCC test, the break in the degree of saturation curve was 6 times larger than the break in curvature from the gravimetric water content SWCC. Likewise, when the starting water content was such that 20% volume change took place during the gravimetric water content SWCC test, the break in the degree of saturation curve was 16 times larger than the break in curvature from the gravimetric water content SWCC. Forty percent volume change was also quite feasible and in this case, the break in the degree of saturation
Figure 7. SWCC’s plotted as the degree as saturation versus suction for the Oil Sands tailings (SFR = 0.1).
Figure 8. Volumetric water content versus suction for the Oil Sands tailings (SFR = 0.1).
Figure 9. Void ratio versus suction plot for the Oil Sands tailings (SFR = 0.1).
24
curve was 40 times larger than the break in cur-vature from the gravimetric water content SWCC. Needless to say, volume changes during suction increases in clayey soils can significantly change the interpretation of SWCC test results.
There are a number of estimation procedures that make use of the SWCC for calculating the per-meability function of the soil. Each of these esti-mation procedures calculate the possible decrease in hydraulic conductivity as the material desatu-rates. Consequently, it is necessary to separate the changes in hydraulic conductivity that are related to void ratio change (under saturated conditions) from changes in degree of saturation.
10 PRESENTATION OF THE LABORATORY MEASUREMENTS ON REGINA CLAY
Shrinkage curves and soil-water characteristic curves were measured on Regina clay. Slurry Regina clay was prepared at a gravimetric water content slightly above its liquid limit. The shrink-age curve results are presented in Figure 11. The void ratio of Regina clay decreases as water evaporates from the soil surface. The clay begins to desaturate near its plastic limit. The best-fit parameters for the shrinkage curve are ash = 0.48, bsh = 0.17, and csh = 3.30. The specific gravity of the soil was 2.73.
Figure 12 shows the gravimetric water content, w, plotted versus soil suction for Regina clay was preloaded at 196 kPa. Its initial water content was 53.5%. The initially high water content specimen showed that a gradual break or change in curva-ture occurred around 50 kPa. The curvature is not distinct and does not represent the true air-entry value of the material. The gravimetric water con-tent SWCC was best-fit with the Fredlund and Xing (1994) equation and yielded the following
parameters; that is, af = 140 kPa, nf = 0.87, and mf = 0.72. Residual suction was estimated to be around 200,000 kPa. It is necessary to use the shrinkage curve to calculate other volume-mass soil properties and properly interpret the SWCC results for the true AEV.
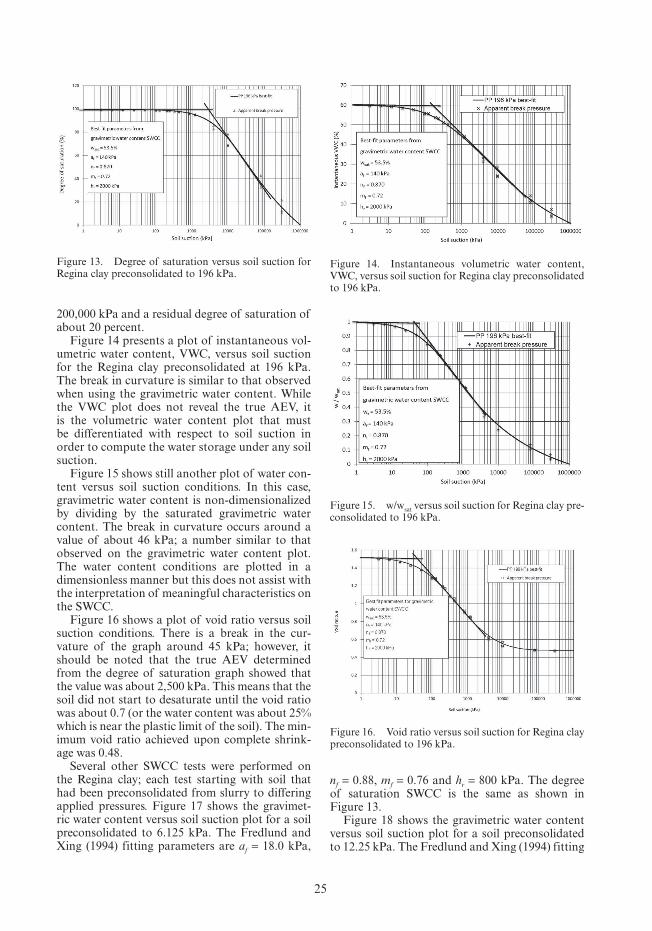
The best-fit shrinkage curve equation can be combined with the equation for the Fredlund and Xing (1994) equation for the SWCC. The result-ing plot of degree of saturation, S, versus soil suction is shown in Figure 13. The results show that there is a distinct air-entry value for Regina clay is about 2,500 kPa. The true air-entry value was also found to be the same for all Regina clay samples preconsolidated at differing pressure val-ues. It is more correct to use the degree of satura-tion SWCCs for the estimation of the AEV of the soil and subsequently the unsaturated hydraulic conductivity function. The degree of saturation also indicates that residual condition can be more clearly identified as being at a suction of about
Figure 10. Ratio of the break in the gravimetric water content plot to the true Air-Entry Value for the Oil Sands tailings.
Figure 11. Shrinkage curve for several samples of Regina clay.
Figure 12. Gravimetric water content versus soil suc-tion for Regina clay preconsolidated to 196 kPa.
25
200,000 kPa and a residual degree of saturation of about 20 percent.
Figure 14 presents a plot of instantaneous vol-umetric water content, VWC, versus soil suction for the Regina clay preconsolidated at 196 kPa. The break in curvature is similar to that observed when using the gravimetric water content. While the VWC plot does not reveal the true AEV, it is the volumetric water content plot that must be differentiated with respect to soil suction in order to compute the water storage under any soil suction.
Figure 15 shows still another plot of water con-tent versus soil suction conditions. In this case, gravimetric water content is non-dimensionalized by dividing by the saturated gravimetric water content. The break in curvature occurs around a value of about 46 kPa; a number similar to that observed on the gravimetric water content plot. The water content conditions are plotted in a dimensionless manner but this does not assist with the interpretation of meaningful characteristics on the SWCC.
Figure 16 shows a plot of void ratio versus soil suction conditions. There is a break in the cur-vature of the graph around 45 kPa; however, it should be noted that the true AEV determined from the degree of saturation graph showed that the value was about 2,500 kPa. This means that the soil did not start to desaturate until the void ratio was about 0.7 (or the water content was about 25% which is near the plastic limit of the soil). The min-imum void ratio achieved upon complete shrink-age was 0.48.
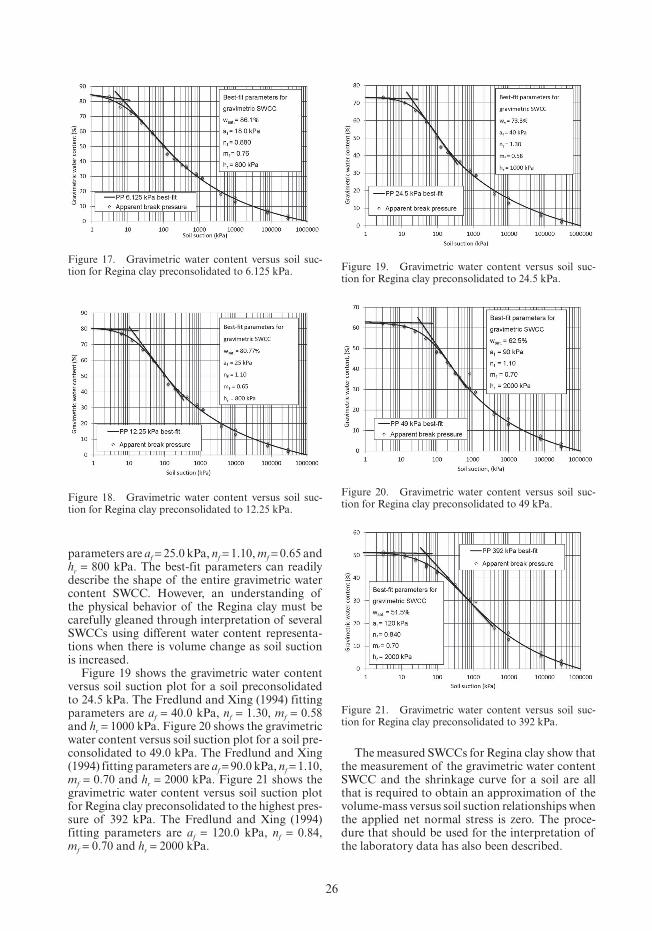
Several other SWCC tests were performed on the Regina clay; each test starting with soil that had been preconsolidated from slurry to differing applied pressures. Figure 17 shows the gravimet-ric water content versus soil suction plot for a soil preconsolidated to 6.125 kPa. The Fredlund and Xing (1994) fitting parameters are af = 18.0 kPa,
Figure 13. Degree of saturation versus soil suction for Regina clay preconsolidated to 196 kPa.
Figure 14. Instantaneous volumetric water content, VWC, versus soil suction for Regina clay preconsolidated to 196 kPa.
Figure 15. w/wsat versus soil suction for Regina clay pre-consolidated to 196 kPa.
Figure 16. Void ratio versus soil suction for Regina clay preconsolidated to 196 kPa.
nf = 0.88, mf = 0.76 and hr = 800 kPa. The degree of saturation SWCC is the same as shown in Figure 13.
Figure 18 shows the gravimetric water content versus soil suction plot for a soil preconsolidated to 12.25 kPa. The Fredlund and Xing (1994) fitting
26
parameters are af = 25.0 kPa, nf = 1.10, mf = 0.65 and hr = 800 kPa. The best-fit parameters can readily describe the shape of the entire gravimetric water content SWCC. However, an understanding of the physical behavior of the Regina clay must be carefully gleaned through interpretation of several SWCCs using different water content representa-tions when there is volume change as soil suction is increased.
Figure 19 shows the gravimetric water content versus soil suction plot for a soil preconsolidated to 24.5 kPa. The Fredlund and Xing (1994) fitting parameters are af = 40.0 kPa, nf = 1.30, mf = 0.58 and hr = 1000 kPa. Figure 20 shows the gravimetric water content versus soil suction plot for a soil pre-consolidated to 49.0 kPa. The Fredlund and Xing (1994) fitting parameters are af = 90.0 kPa, nf = 1.10, mf = 0.70 and hr = 2000 kPa. Figure 21 shows the gravimetric water content versus soil suction plot for Regina clay preconsolidated to the highest pres-sure of 392 kPa. The Fredlund and Xing (1994) fitting parameters are af = 120.0 kPa, nf = 0.84, mf = 0.70 and hr = 2000 kPa.
The measured SWCCs for Regina clay show that the measurement of the gravimetric water content SWCC and the shrinkage curve for a soil are all that is required to obtain an approximation of the volume-mass versus soil suction relationships when the applied net normal stress is zero. The proce-dure that should be used for the interpretation of the laboratory data has also been described.
Figure 18. Gravimetric water content versus soil suc-tion for Regina clay preconsolidated to 12.25 kPa.
Figure 19. Gravimetric water content versus soil suc-tion for Regina clay preconsolidated to 24.5 kPa.
Figure 20. Gravimetric water content versus soil suc-tion for Regina clay preconsolidated to 49 kPa.
Figure 21. Gravimetric water content versus soil suc-tion for Regina clay preconsolidated to 392 kPa.
Figure 17. Gravimetric water content versus soil suc-tion for Regina clay preconsolidated to 6.125 kPa.
27
11 INTERPRETATION OF THE RESULTS ON REGINA CLAY
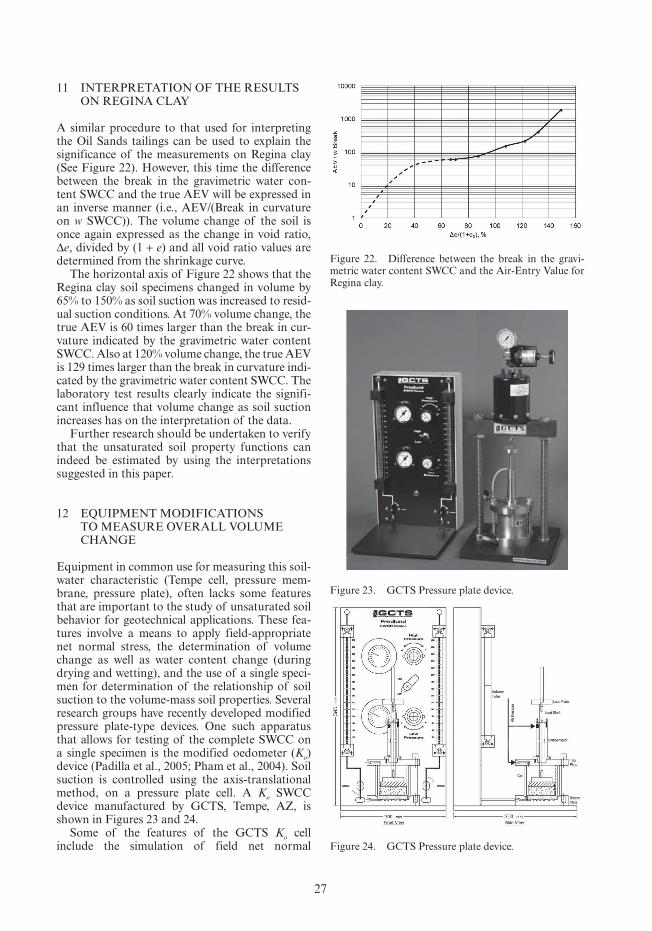
A similar procedure to that used for interpreting the Oil Sands tailings can be used to explain the significance of the measurements on Regina clay (See Figure 22). However, this time the difference between the break in the gravimetric water con-tent SWCC and the true AEV will be expressed in an inverse manner (i.e., AEV/(Break in curvature on w SWCC)). The volume change of the soil is once again expressed as the change in void ratio, Δe, divided by (1 + e) and all void ratio values are determined from the shrinkage curve.
The horizontal axis of Figure 22 shows that the Regina clay soil specimens changed in volume by 65% to 150% as soil suction was increased to resid-ual suction conditions. At 70% volume change, the true AEV is 60 times larger than the break in cur-vature indicated by the gravimetric water content SWCC. Also at 120% volume change, the true AEV is 129 times larger than the break in curvature indi-cated by the gravimetric water content SWCC. The laboratory test results clearly indicate the signifi-cant influence that volume change as soil suction increases has on the interpretation of the data.
Further research should be undertaken to verify that the unsaturated soil property functions can indeed be estimated by using the interpretations suggested in this paper.
12 EQUIPMENT MODIFICATIONS TO MEASURE OVERALL VOLUME CHANGE
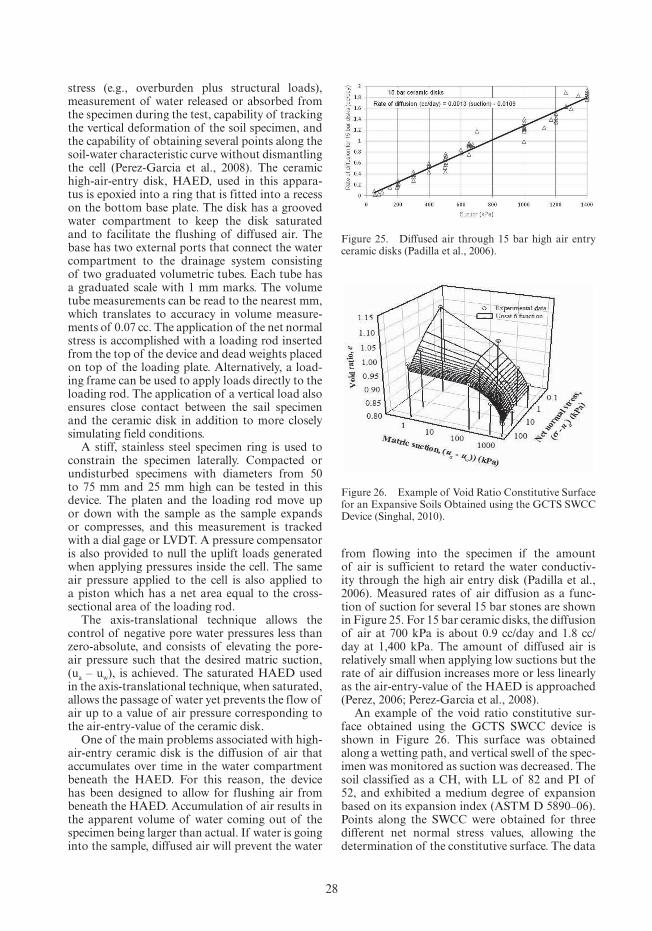
Equipment in common use for measuring this soil-water characteristic (Tempe cell, pressure mem-brane, pressure plate), often lacks some features that are important to the study of unsaturated soil behavior for geotechnical applications. These fea-tures involve a means to apply field-appropriate net normal stress, the determination of volume change as well as water content change (during drying and wetting), and the use of a single speci-men for determination of the relationship of soil suction to the volume-mass soil properties. Several research groups have recently developed modified pressure plate-type devices. One such apparatus that allows for testing of the complete SWCC on a single specimen is the modified oedometer (Ko) device (Padilla et al., 2005; Pham et al., 2004). Soil suction is controlled using the axis-translational method, on a pressure plate cell. A Ko SWCC device manufactured by GCTS, Tempe, AZ, is shown in Figures 23 and 24.
Some of the features of the GCTS Ko cell include the simulation of field net normal
Figure 22. Difference between the break in the gravi-metric water content SWCC and the Air-Entry Value for Regina clay.
Figure 23. GCTS Pressure plate device.
Figure 24. GCTS Pressure plate device.
28
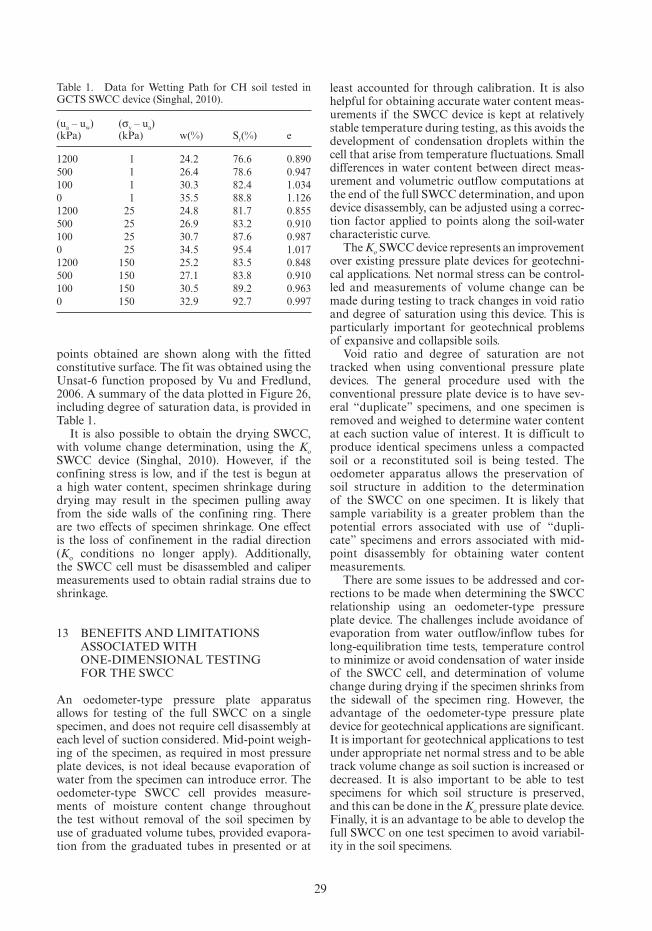
stress (e.g., overburden plus structural loads), measurement of water released or absorbed from the specimen during the test, capability of tracking the vertical deformation of the soil specimen, and the capability of obtaining several points along the soil-water characteristic curve without dismantling the cell (Perez-Garcia et al., 2008). The ceramic high-air-entry disk, HAED, used in this appara-tus is epoxied into a ring that is fitted into a recess on the bottom base plate. The disk has a grooved water compartment to keep the disk saturated and to facilitate the flushing of diffused air. The base has two external ports that connect the water compartment to the drainage system consisting of two graduated volumetric tubes. Each tube has a graduated scale with 1 mm marks. The volume tube measurements can be read to the nearest mm, which translates to accuracy in volume measure-ments of 0.07 cc. The application of the net normal stress is accomplished with a loading rod inserted from the top of the device and dead weights placed on top of the loading plate. Alternatively, a load-ing frame can be used to apply loads directly to the loading rod. The application of a vertical load also ensures close contact between the sail specimen and the ceramic disk in addition to more closely simulating field conditions.
A stiff, stainless steel specimen ring is used to constrain the specimen laterally. Compacted or undisturbed specimens with diameters from 50 to 75 mm and 25 mm high can be tested in this device. The platen and the loading rod move up or down with the sample as the sample expands or compresses, and this measurement is tracked with a dial gage or LVDT. A pressure compensator is also provided to null the uplift loads generated when applying pressures inside the cell. The same air pressure applied to the cell is also applied to a piston which has a net area equal to the cross-sectional area of the loading rod.
The axis-translational technique allows the control of negative pore water pressures less than zero-absolute, and consists of elevating the pore-air pressure such that the desired matric suction, (ua – uw), is achieved. The saturated HAED used in the axis-translational technique, when saturated, allows the passage of water yet prevents the flow of air up to a value of air pressure corresponding to the air-entry-value of the ceramic disk.
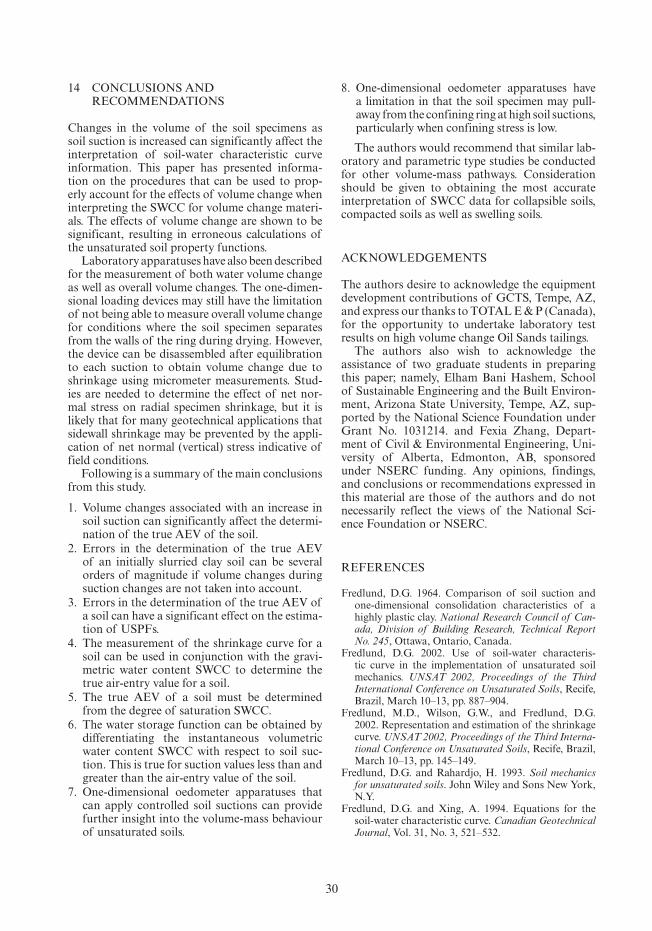
One of the main problems associated with high-air-entry ceramic disk is the diffusion of air that accumulates over time in the water compartment beneath the HAED. For this reason, the device has been designed to allow for flushing air from beneath the HAED. Accumulation of air results in the apparent volume of water coming out of the specimen being larger than actual. If water is going into the sample, diffused air will prevent the water
from flowing into the specimen if the amount of air is sufficient to retard the water conductiv-ity through the high air entry disk (Padilla et al., 2006). Measured rates of air diffusion as a func-tion of suction for several 15 bar stones are shown in Figure 25. For 15 bar ceramic disks, the diffusion of air at 700 kPa is about 0.9 cc/day and 1.8 cc/day at 1,400 kPa. The amount of diffused air is relatively small when applying low suctions but the rate of air diffusion increases more or less linearly as the air-entry-value of the HAED is approached (Perez, 2006; Perez-Garcia et al., 2008).
An example of the void ratio constitutive sur-face obtained using the GCTS SWCC device is shown in Figure 26. This surface was obtained along a wetting path, and vertical swell of the spec-imen was monitored as suction was decreased. The soil classified as a CH, with LL of 82 and PI of 52, and exhibited a medium degree of expansion based on its expansion index (ASTM D 5890–06). Points along the SWCC were obtained for three different net normal stress values, allowing the determination of the constitutive surface. The data
Figure 25. Diffused air through 15 bar high air entry ceramic disks (Padilla et al., 2006).
Figure 26. Example of Void Ratio Constitutive Surface for an Expansive Soils Obtained using the GCTS SWCC Device (Singhal, 2010).
29
points obtained are shown along with the fitted constitutive surface. The fit was obtained using the Unsat-6 function proposed by Vu and Fredlund, 2006. A summary of the data plotted in Figure 26, including degree of saturation data, is provided in Table 1.
It is also possible to obtain the drying SWCC, with volume change determination, using the Ko SWCC device (Singhal, 2010). However, if the confining stress is low, and if the test is begun at a high water content, specimen shrinkage during drying may result in the specimen pulling away from the side walls of the confining ring. There are two effects of specimen shrinkage. One effect is the loss of confinement in the radial direction (Ko conditions no longer apply). Additionally, the SWCC cell must be disassembled and caliper measurements used to obtain radial strains due to shrinkage.
13 BENEFITS AND LIMITATIONS ASSOCIATED WITH ONE-DIMENSIONAL TESTING FOR THE SWCC
An oedometer-type pressure plate apparatus allows for testing of the full SWCC on a single specimen, and does not require cell disassembly at each level of suction considered. Mid-point weigh-ing of the specimen, as required in most pressure plate devices, is not ideal because evaporation of water from the specimen can introduce error. The oedometer-type SWCC cell provides measure-ments of moisture content change throughout the test without removal of the soil specimen by use of graduated volume tubes, provided evapora-tion from the graduated tubes in presented or at
least accounted for through calibration. It is also helpful for obtaining accurate water content meas-urements if the SWCC device is kept at relatively stable temperature during testing, as this avoids the development of condensation droplets within the cell that arise from temperature fluctuations. Small differences in water content between direct meas-urement and volumetric outflow computations at the end of the full SWCC determination, and upon device disassembly, can be adjusted using a correc-tion factor applied to points along the soil-water characteristic curve.
The Ko SWCC device represents an improvement over existing pressure plate devices for geotechni-cal applications. Net normal stress can be control-led and measurements of volume change can be made during testing to track changes in void ratio and degree of saturation using this device. This is particularly important for geotechnical problems of expansive and collapsible soils.
Void ratio and degree of saturation are not tracked when using conventional pressure plate devices. The general procedure used with the conventional pressure plate device is to have sev-eral “duplicate” specimens, and one specimen is removed and weighed to determine water content at each suction value of interest. It is difficult to produce identical specimens unless a compacted soil or a reconstituted soil is being tested. The oedometer apparatus allows the preservation of soil structure in addition to the determination of the SWCC on one specimen. It is likely that sample variability is a greater problem than the potential errors associated with use of “dupli-cate” specimens and errors associated with mid-point disassembly for obtaining water content measurements.
There are some issues to be addressed and cor-rections to be made when determining the SWCC relationship using an oedometer-type pressure plate device. The challenges include avoidance of evaporation from water outflow/inflow tubes for long-equilibration time tests, temperature control to minimize or avoid condensation of water inside of the SWCC cell, and determination of volume change during drying if the specimen shrinks from the sidewall of the specimen ring. However, the advantage of the oedometer-type pressure plate device for geotechnical applications are significant. It is important for geotechnical applications to test under appropriate net normal stress and to be able track volume change as soil suction is increased or decreased. It is also important to be able to test specimens for which soil structure is preserved, and this can be done in the Ko pressure plate device. Finally, it is an advantage to be able to develop the full SWCC on one test specimen to avoid variabil-ity in the soil specimens.
Table 1. Data for Wetting Path for CH soil tested in GCTS SWCC device (Singhal, 2010).
(ua – uw)(kPa)
(σy – ua)(kPa) w(%) Sr(%) e
1200 1 24.2 76.6 0.890
500 1 26.4 78.6 0.947
100 1 30.3 82.4 1.034
0 1 35.5 88.8 1.126
1200 25 24.8 81.7 0.855
500 25 26.9 83.2 0.910
100 25 30.7 87.6 0.987
0 25 34.5 95.4 1.017
1200 150 25.2 83.5 0.848
500 150 27.1 83.8 0.910
100 150 30.5 89.2 0.963
0 150 32.9 92.7 0.997
30
14 CONCLUSIONS AND RECOMMENDATIONS
Changes in the volume of the soil specimens as soil suction is increased can significantly affect the interpretation of soil-water characteristic curve information. This paper has presented informa-tion on the procedures that can be used to prop-erly account for the effects of volume change when interpreting the SWCC for volume change materi-als. The effects of volume change are shown to be significant, resulting in erroneous calculations of the unsaturated soil property functions.
Laboratory apparatuses have also been described for the measurement of both water volume change as well as overall volume changes. The one-dimen-sional loading devices may still have the limitation of not being able to measure overall volume change for conditions where the soil specimen separates from the walls of the ring during drying. However, the device can be disassembled after equilibration to each suction to obtain volume change due to shrinkage using micrometer measurements. Stud-ies are needed to determine the effect of net nor-mal stress on radial specimen shrinkage, but it is likely that for many geotechnical applications that sidewall shrinkage may be prevented by the appli-cation of net normal (vertical) stress indicative of field conditions.
Following is a summary of the main conclusions from this study.
1. Volume changes associated with an increase in soil suction can significantly affect the determi-nation of the true AEV of the soil.
2. Errors in the determination of the true AEV of an initially slurried clay soil can be several orders of magnitude if volume changes during suction changes are not taken into account.
3. Errors in the determination of the true AEV of a soil can have a significant effect on the estima-tion of USPFs.
4. The measurement of the shrinkage curve for a soil can be used in conjunction with the gravi-metric water content SWCC to determine the true air-entry value for a soil.
5. The true AEV of a soil must be determined from the degree of saturation SWCC.
6. The water storage function can be obtained by differentiating the instantaneous volumetric water content SWCC with respect to soil suc-tion. This is true for suction values less than and greater than the air-entry value of the soil.
7. One-dimensional oedometer apparatuses that can apply controlled soil suctions can provide further insight into the volume-mass behaviour of unsaturated soils.
8. One-dimensional oedometer apparatuses have a limitation in that the soil specimen may pull-away from the confining ring at high soil suctions, particularly when confining stress is low.
The authors would recommend that similar lab-oratory and parametric type studies be conducted for other volume-mass pathways. Consideration should be given to obtaining the most accurate interpretation of SWCC data for collapsible soils, compacted soils as well as swelling soils.
ACKNOWLEDGEMENTS
The authors desire to acknowledge the equipment development contributions of GCTS, Tempe, AZ, and express our thanks to TOTAL E & P (Canada), for the opportunity to undertake laboratory test results on high volume change Oil Sands tailings.
The authors also wish to acknowledge the assistance of two graduate students in preparing this paper; namely, Elham Bani Hashem, School of Sustainable Engineering and the Built Environ-ment, Arizona State University, Tempe, AZ, sup-ported by the National Science Foundation under Grant No. 1031214. and Fexia Zhang, Depart-ment of Civil & Environmental Engineering, Uni-versity of Alberta, Edmonton, AB, sponsored under NSERC funding. Any opinions, findings, and conclusions or recommendations expressed in this material are those of the authors and do not necessarily reflect the views of the National Sci-ence Foundation or NSERC.
REFERENCES
Fredlund, D.G. 1964. Comparison of soil suction and one-dimensional consolidation characteristics of a highly plastic clay. National Research Council of Can-ada, Division of Building Research, Technical Report No. 245, Ottawa, Ontario, Canada.
Fredlund, D.G. 2002. Use of soil-water characteris-tic curve in the implementation of unsaturated soil mechanics. UNSAT 2002, Proceedings of the Third International Conference on Unsaturated Soils, Recife, Brazil, March 10–13, pp. 887–904.
Fredlund, M.D., Wilson, G.W., and Fredlund, D.G. 2002. Representation and estimation of the shrinkage curve. UNSAT 2002, Proceedings of the Third Interna-tional Conference on Unsaturated Soils, Recife, Brazil, March 10–13, pp. 145–149.
Fredlund, D.G. and Rahardjo, H. 1993. Soil mechanics for unsaturated soils. John Wiley and Sons New York, N.Y.
Fredlund, D.G. and Xing, A. 1994. Equations for the soil-water characteristic curve. Canadian Geotechnical Journal, Vol. 31, No. 3, 521–532.
31
Fredlund, D.G., Xing, A., and Huang, S.Y. 1994. Pre-dicting the permeability function for unsaturated soils using the soil-water characteristic curve, Canadian Geotechnical Journal, Vol. 31, No. 4, pp. 533–546.
Fredlund, D.G., Xing, A., Fredlund, M.D., and Barbour, S. L. 1996. The relationship of the unsaturated soil shear strength to the soil-water characteristic curve, Canadian Geotechnical Journal, Vol. 33, pp. 440–448.
Fredlund, M.D. 2010. User’s Manual for SVFlux, Satu-rated-Unsaturated Numerical Modeling. SoilVision Systems, Saskatoon, Canada.
Padilla, J.M., Perera, Y.Y., Houston, W.N., and Fredlund, D.G. 2005. A new soil-water characteristic curve device. Proceedings of Advanced Experimental Unsaturated Soil Mechanics, An International Sym-posium, EXPERUS 2005, Trento, Italy, June 27–29, pp. 15–22.
Padilla, J.M., Perera, Y.Y., Houston, W.N., Perez, N., and Fredlund, D.G. 2006. Quantification of air diffusion through high air entry ceramic disks. Proceedings of the Fourth International Conference on Unsaturated Soils. Arizona, 1852–1863
Perez, N. 2006. Development of a protocol for the assess-ment of unsaturated soil properties. PhD dissertation. Arizona State University.
Perez-Garcia, N., Houston, S. Houston, W., and Padilla, M., 2008. An odedometer-type pressure plate SWCC apparatus, ASTM Geotechnical Testing Jour-nal, Vol 31, No. 2, pp 115–123.
Pham, H., Fredlund, D.G., and Padilla, J.M. 2004. Use of the GCTS apparatus for the measurement of soil-water characteristic curves. Proceedings of the 57th Canadian Geotechnical Conference, Quebec City, Quebec, Oct. 24–27, pp. 1–6.
Singhal, S. 2010. Expansive Soil Behavior: Property Measurement Techniques and Heave Predction Meth-ods. Ph.D. Disseration, Arizona State University, Tempe, AZ, USA.
Van Genuchten, M.T. 1980. A closed-form equation for predicting the hydraulic conductivity of unsaturated soils. Soil Science Society of America Journal, Vol. 44, pp. 892–898.
Vanapalli, S.K., D.G., and Pufahl, D.E. 1996. The rela-tionship between the soil-water characteristic curve and the unsaturated shear strength of a compacted glacial till, Geotechnical Testing Journal, ASTM, Vol. 19, No.2, pp. 259–268.
Vu, H.Q. and Fredlund, D.G. 2006. Challenges to mod-eling heave in expansive soil, Canadian Geotechnical Journal, Vol. 43, pp. 1249–1272.