water retention and characteristic curve properties/swc_2004.pdf · water retention and...
TRANSCRIPT
278 WATER RETENTION AND CHARACTERISTIC CURVE
WATER RETENTION AND CHARACTERISTIC CURVE
M Tuller, University of Idaho, Moscow, ID, USA
D Or, University of Connecticut, Storrs, CT, USA
� 2005, Elsevier Ltd. All Rights Reserved.
Introduction
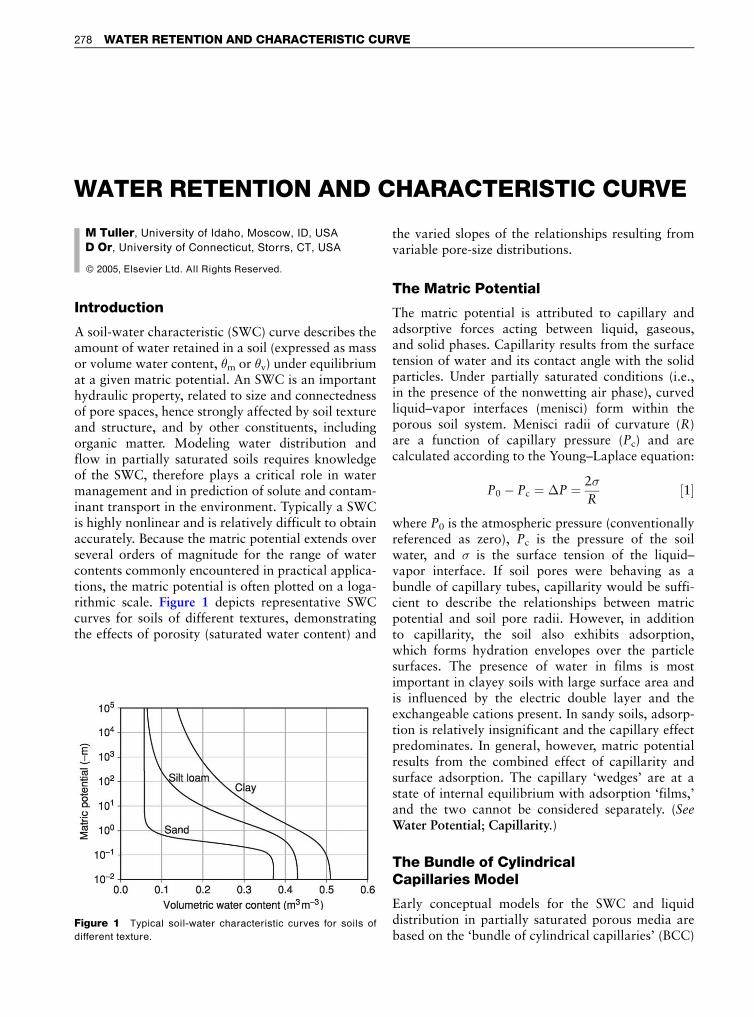
A soil-water characteristic (SWC) curve describes theamount of water retained in a soil (expressed as massor volume water content, �m or �v) under equilibriumat a given matric potential. An SWC is an importanthydraulic property, related to size and connectednessof pore spaces, hence strongly affected by soil textureand structure, and by other constituents, includingorganic matter. Modeling water distribution andflow in partially saturated soils requires knowledgeof the SWC, therefore plays a critical role in watermanagement and in prediction of solute and contam-inant transport in the environment. Typically a SWCis highly nonlinear and is relatively difficult to obtainaccurately. Because the matric potential extends overseveral orders of magnitude for the range of watercontents commonly encountered in practical applica-tions, the matric potential is often plotted on a loga-rithmic scale. Figure 1 depicts representative SWCcurves for soils of different textures, demonstratingthe effects of porosity (saturated water content) and
Figure 1 Typical soil-water characteristic curves for soils of
different texture.
the varied slopes of the relationships resulting fromvariable pore-size distributions.
The Matric Potential
The matric potential is attributed to capillary andadsorptive forces acting between liquid, gaseous,and solid phases. Capillarity results from the surfacetension of water and its contact angle with the solidparticles. Under partially saturated conditions (i.e.,in the presence of the nonwetting air phase), curvedliquid–vapor interfaces (menisci) form within theporous soil system. Menisci radii of curvature (R)are a function of capillary pressure (Pc) and arecalculated according to the Young–Laplace equation:
P0 � Pc ¼ �P ¼ 2�
R½1�
where P0 is the atmospheric pressure (conventionallyreferenced as zero), Pc is the pressure of the soilwater, and � is the surface tension of the liquid–vapor interface. If soil pores were behaving as abundle of capillary tubes, capillarity would be suffi-cient to describe the relationships between matricpotential and soil pore radii. However, in additionto capillarity, the soil also exhibits adsorption,which forms hydration envelopes over the particlesurfaces. The presence of water in films is mostimportant in clayey soils with large surface area andis influenced by the electric double layer and theexchangeable cations present. In sandy soils, adsorp-tion is relatively insignificant and the capillary effectpredominates. In general, however, matric potentialresults from the combined effect of capillarity andsurface adsorption. The capillary ‘wedges’ are at astate of internal equilibrium with adsorption ‘films,’and the two cannot be considered separately. (SeeWater Potential; Capillarity.)
The Bundle of CylindricalCapillaries Model
Early conceptual models for the SWC and liquiddistribution in partially saturated porous media arebased on the ‘bundle of cylindrical capillaries’ (BCC)
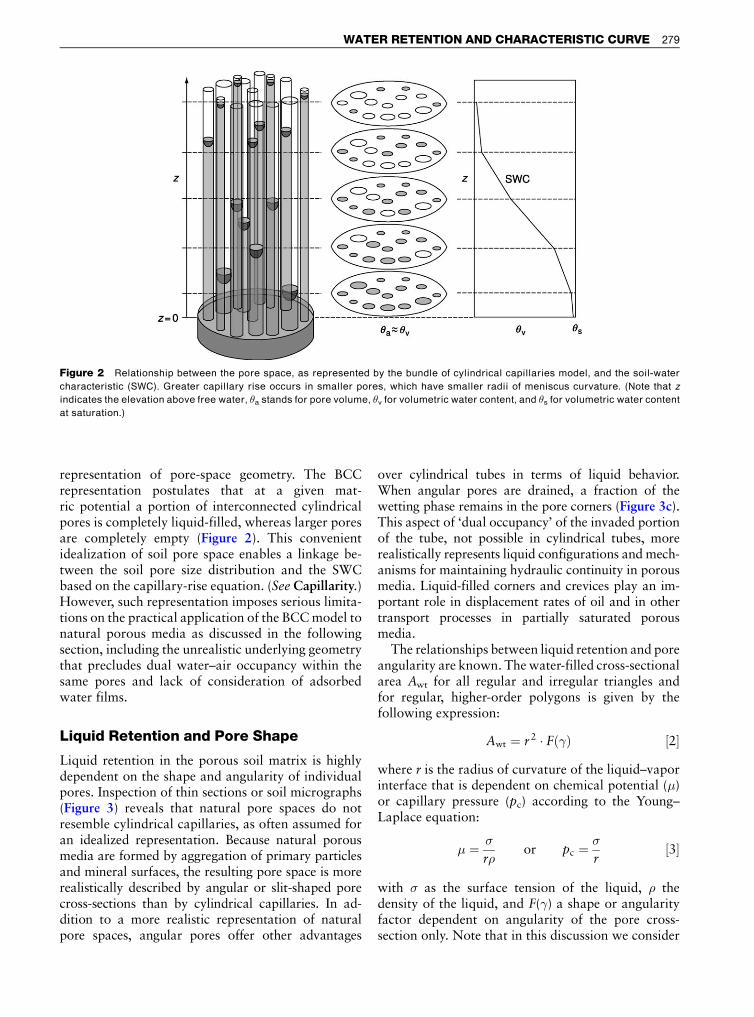
Figure 2 Relationship between the pore space, as represented by the bundle of cylindrical capillaries model, and the soil-water
characteristic (SWC). Greater capillary rise occurs in smaller pores, which have smaller radii of meniscus curvature. (Note that z
indicates the elevation above free water, �a stands for pore volume, �v for volumetric water content, and �s for volumetric water content
at saturation.)
WATER RETENTION AND CHARACTERISTIC CURVE 279
representation of pore-space geometry. The BCCrepresentation postulates that at a given mat-ric potential a portion of interconnected cylindricalpores is completely liquid-filled, whereas larger poresare completely empty (Figure 2). This convenientidealization of soil pore space enables a linkage be-tween the soil pore size distribution and the SWCbased on the capillary-rise equation. (See Capillarity.)However, such representation imposes serious limita-tions on the practical application of the BCC model tonatural porous media as discussed in the followingsection, including the unrealistic underlying geometrythat precludes dual water–air occupancy within thesame pores and lack of consideration of adsorbedwater films.
Liquid Retention and Pore Shape
Liquid retention in the porous soil matrix is highlydependent on the shape and angularity of individualpores. Inspection of thin sections or soil micrographs(Figure 3) reveals that natural pore spaces do notresemble cylindrical capillaries, as often assumed foran idealized representation. Because natural porousmedia are formed by aggregation of primary particlesand mineral surfaces, the resulting pore space is morerealistically described by angular or slit-shaped porecross-sections than by cylindrical capillaries. In ad-dition to a more realistic representation of naturalpore spaces, angular pores offer other advantages
over cylindrical tubes in terms of liquid behavior.When angular pores are drained, a fraction of thewetting phase remains in the pore corners (Figure 3c).This aspect of ‘dual occupancy’ of the invaded portionof the tube, not possible in cylindrical tubes, morerealistically represents liquid configurations and mech-anisms for maintaining hydraulic continuity in porousmedia. Liquid-filled corners and crevices play an im-portant role in displacement rates of oil and in othertransport processes in partially saturated porousmedia.
The relationships between liquid retention and poreangularity are known. The water-filled cross-sectionalarea Awt for all regular and irregular triangles andfor regular, higher-order polygons is given by thefollowing expression:
Awt ¼ r 2 � Fð�Þ ½2�
where r is the radius of curvature of the liquid–vaporinterface that is dependent on chemical potential (�)or capillary pressure (pc) according to the Young–Laplace equation:
� ¼ �
r�or pc ¼
�
r½3�
with � as the surface tension of the liquid, � thedensity of the liquid, and F(�) a shape or angularityfactor dependent on angularity of the pore cross-section only. Note that in this discussion we consider
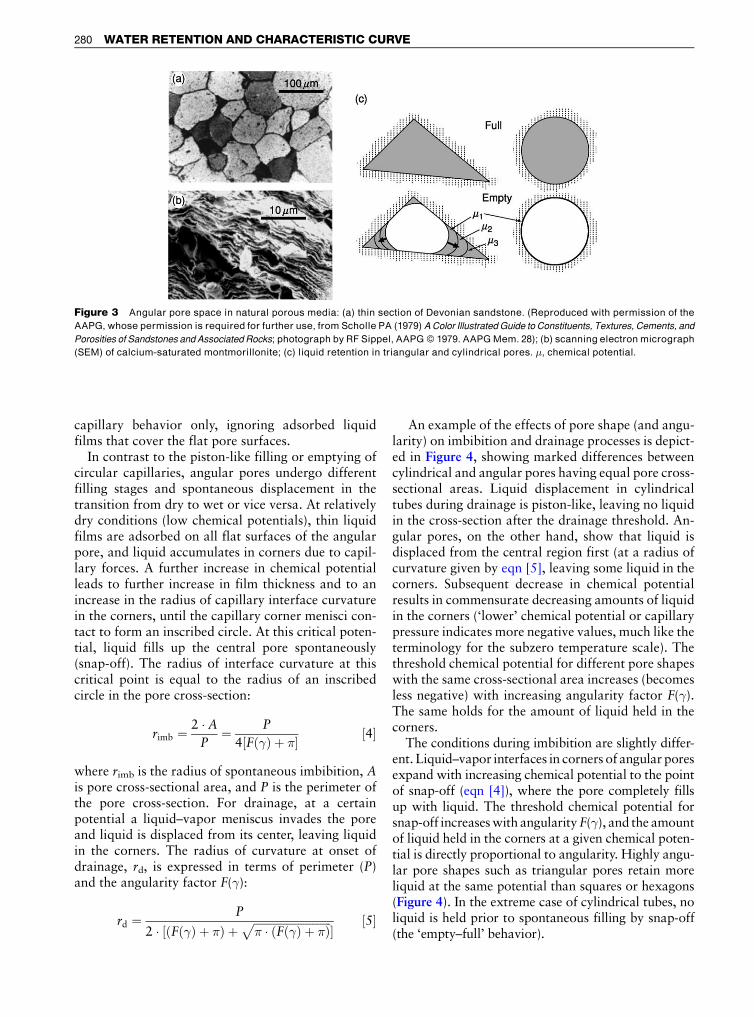
Figure 3 Angular pore space in natural porous media: (a) thin section of Devonian sandstone. (Reproduced with permission of the
AAPG, whose permission is required for further use, from Scholle PA (1979) A Color Illustrated Guide to Constituents, Textures, Cements, and
Porosities of Sandstones and Associated Rocks; photograph by RF Sippel, AAPG � 1979. AAPG Mem. 28); (b) scanning electron micrograph
(SEM) of calcium-saturated montmorillonite; (c) liquid retention in triangular and cylindrical pores. �, chemical potential.
280 WATER RETENTION AND CHARACTERISTIC CURVE
capillary behavior only, ignoring adsorbed liquidfilms that cover the flat pore surfaces.
In contrast to the piston-like filling or emptying ofcircular capillaries, angular pores undergo differentfilling stages and spontaneous displacement in thetransition from dry to wet or vice versa. At relativelydry conditions (low chemical potentials), thin liquidfilms are adsorbed on all flat surfaces of the angularpore, and liquid accumulates in corners due to capil-lary forces. A further increase in chemical potentialleads to further increase in film thickness and to anincrease in the radius of capillary interface curvaturein the corners, until the capillary corner menisci con-tact to form an inscribed circle. At this critical poten-tial, liquid fills up the central pore spontaneously(snap-off). The radius of interface curvature at thiscritical point is equal to the radius of an inscribedcircle in the pore cross-section:
rimb ¼ 2 � A
P¼ P
4½Fð�Þ þ �� ½4�
where rimb is the radius of spontaneous imbibition, Ais pore cross-sectional area, and P is the perimeter ofthe pore cross-section. For drainage, at a certainpotential a liquid–vapor meniscus invades the poreand liquid is displaced from its center, leaving liquidin the corners. The radius of curvature at onset ofdrainage, rd, is expressed in terms of perimeter (P)and the angularity factor F(�):
rd ¼ P
2 � ½ðFð�Þ þ �Þ þffiffiffiffiffiffiffiffiffiffiffiffiffiffiffiffiffiffiffiffiffiffiffiffiffiffiffiffi� � ðFð�Þ þ �Þ
p�
½5�
An example of the effects of pore shape (and angu-larity) on imbibition and drainage processes is depict-ed in Figure 4, showing marked differences betweencylindrical and angular pores having equal pore cross-sectional areas. Liquid displacement in cylindricaltubes during drainage is piston-like, leaving no liquidin the cross-section after the drainage threshold. An-gular pores, on the other hand, show that liquid isdisplaced from the central region first (at a radius ofcurvature given by eqn [5], leaving some liquid in thecorners. Subsequent decrease in chemical potentialresults in commensurate decreasing amounts of liquidin the corners (‘lower’ chemical potential or capillarypressure indicates more negative values, much like theterminology for the subzero temperature scale). Thethreshold chemical potential for different pore shapeswith the same cross-sectional area increases (becomesless negative) with increasing angularity factor F(�).The same holds for the amount of liquid held in thecorners.
The conditions during imbibition are slightly differ-ent. Liquid–vapor interfaces in corners of angular poresexpand with increasing chemical potential to the pointof snap-off (eqn [4]), where the pore completely fillsup with liquid. The threshold chemical potential forsnap-off increases with angularity F(�), and the amountof liquid held in the corners at a given chemical poten-tial is directly proportional to angularity. Highly angu-lar pore shapes such as triangular pores retain moreliquid at the same potential than squares or hexagons(Figure 4). In the extreme case of cylindrical tubes, noliquid is held prior to spontaneous filling by snap-off(the ‘empty–full’ behavior).
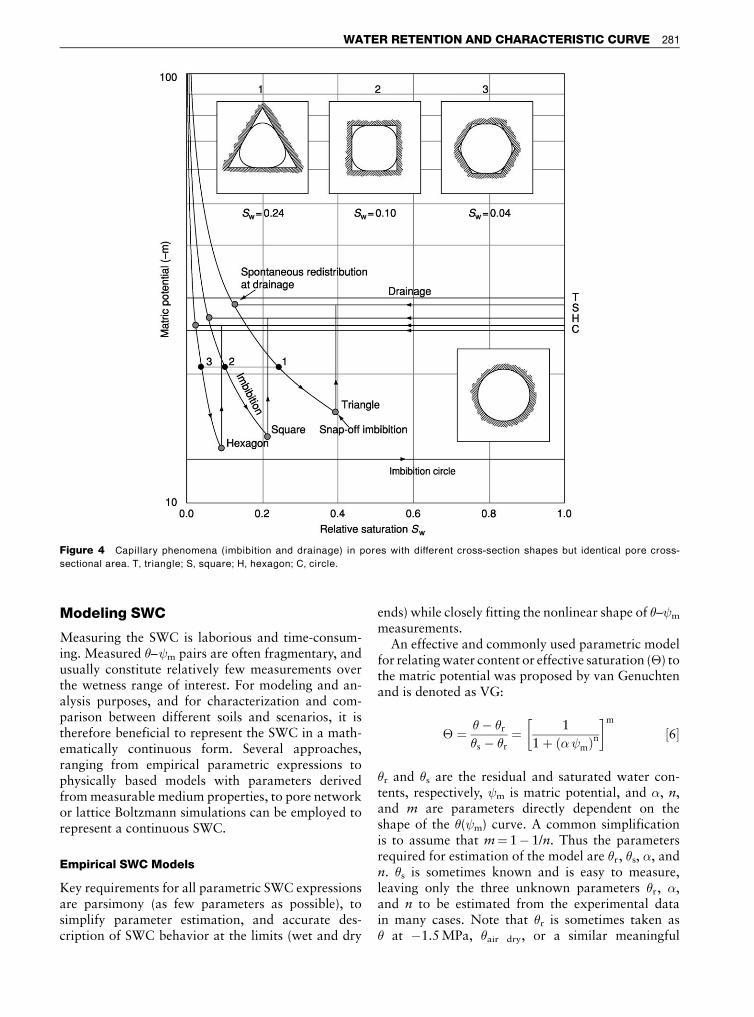
Figure 4 Capillary phenomena (imbibition and drainage) in pores with different cross-section shapes but identical pore cross-
sectional area. T, triangle; S, square; H, hexagon; C, circle.
WATER RETENTION AND CHARACTERISTIC CURVE 281
Modeling SWC
Measuring the SWC is laborious and time-consum-ing. Measured �– m pairs are often fragmentary, andusually constitute relatively few measurements overthe wetness range of interest. For modeling and an-alysis purposes, and for characterization and com-parison between different soils and scenarios, it istherefore beneficial to represent the SWC in a math-ematically continuous form. Several approaches,ranging from empirical parametric expressions tophysically based models with parameters derivedfrom measurable medium properties, to pore networkor lattice Boltzmann simulations can be employed torepresent a continuous SWC.
Empirical SWC Models
Key requirements for all parametric SWC expressionsare parsimony (as few parameters as possible), tosimplify parameter estimation, and accurate des-cription of SWC behavior at the limits (wet and dry
ends) while closely fitting the nonlinear shape of �– m
measurements.An effective and commonly used parametric model
for relating water content or effective saturation (�) tothe matric potential was proposed by van Genuchtenand is denoted as VG:
� ¼ �� �r
�s � �r¼ 1
1 þ ð� mÞn
� �m
½6�
�r and �s are the residual and saturated water con-tents, respectively, m is matric potential, and �, n,and m are parameters directly dependent on theshape of the �( m) curve. A common simplificationis to assume that m¼ 1� 1/n. Thus the parametersrequired for estimation of the model are �r, �s, �, andn. �s is sometimes known and is easy to measure,leaving only the three unknown parameters �r, �,and n to be estimated from the experimental datain many cases. Note that �r is sometimes taken as� at �1.5 MPa, �air dry, or a similar meaningful
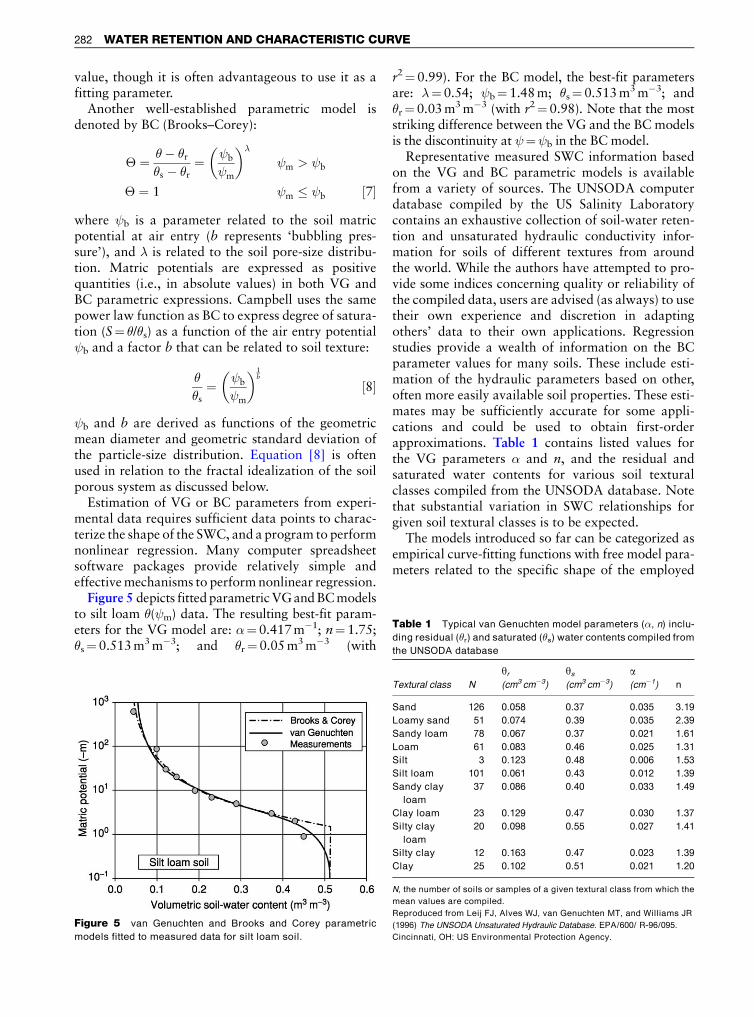
Table 1 Typical van Genuchten model parameters (�, n) inclu-
ding residual (�r) and saturated (�s) water contents compiled from
the UNSODA database
282 WATER RETENTION AND CHARACTERISTIC CURVE
value, though it is often advantageous to use it as afitting parameter.
Another well-established parametric model isdenoted by BC (Brooks–Corey):
� ¼ �� �r
�s � �r¼ b
m
� �
m > b
� ¼ 1 m b ½7�
where b is a parameter related to the soil matricpotential at air entry (b represents ‘bubbling pres-sure’), and is related to the soil pore-size distribu-tion. Matric potentials are expressed as positivequantities (i.e., in absolute values) in both VG andBC parametric expressions. Campbell uses the samepower law function as BC to express degree of satura-tion (S¼ �/�s) as a function of the air entry potential b and a factor b that can be related to soil texture:
�
�s¼ b
m
� �1b
½8�
b and b are derived as functions of the geometricmean diameter and geometric standard deviation ofthe particle-size distribution. Equation [8] is oftenused in relation to the fractal idealization of the soilporous system as discussed below.
Estimation of VG or BC parameters from experi-mental data requires sufficient data points to charac-terize the shape of the SWC, and a program to performnonlinear regression. Many computer spreadsheetsoftware packages provide relatively simple andeffective mechanisms to perform nonlinear regression.
Figure 5 depicts fitted parametric VG and BC modelsto silt loam �( m) data. The resulting best-fit param-eters for the VG model are: �¼ 0.417 m�1; n¼ 1.75;�s¼ 0.513 m3 m�3; and �r¼ 0.05 m3 m�3 (with
Figure 5 van Genuchten and Brooks and Corey parametric
models fitted to measured data for silt loam soil.
r2¼ 0.99). For the BC model, the best-fit parametersare: ¼ 0.54; b¼ 1.48 m; �s¼ 0.513 m3 m�3; and�r¼ 0.03 m3 m�3 (with r2¼ 0.98). Note that the moststriking difference between the VG and the BC modelsis the discontinuity at ¼ b in the BC model.
Representative measured SWC information basedon the VG and BC parametric models is availablefrom a variety of sources. The UNSODA computerdatabase compiled by the US Salinity Laboratorycontains an exhaustive collection of soil-water reten-tion and unsaturated hydraulic conductivity infor-mation for soils of different textures from aroundthe world. While the authors have attempted to pro-vide some indices concerning quality or reliability ofthe compiled data, users are advised (as always) to usetheir own experience and discretion in adaptingothers’ data to their own applications. Regressionstudies provide a wealth of information on the BCparameter values for many soils. These include esti-mation of the hydraulic parameters based on other,often more easily available soil properties. These esti-mates may be sufficiently accurate for some appli-cations and could be used to obtain first-orderapproximations. Table 1 contains listed values forthe VG parameters � and n, and the residual andsaturated water contents for various soil texturalclasses compiled from the UNSODA database. Notethat substantial variation in SWC relationships forgiven soil textural classes is to be expected.
The models introduced so far can be categorized asempirical curve-fitting functions with free model para-meters related to the specific shape of the employed
Textural class N
yr
(cm3 cm�3)
ys
(cm3 cm�3)
a(cm�1) n
Sand 126 0.058 0.37 0.035 3.19
Loamy sand 51 0.074 0.39 0.035 2.39
Sandy loam 78 0.067 0.37 0.021 1.61
Loam 61 0.083 0.46 0.025 1.31
Silt 3 0.123 0.48 0.006 1.53
Silt loam 101 0.061 0.43 0.012 1.39
Sandy clay
loam
37 0.086 0.40 0.033 1.49
Clay loam 23 0.129 0.47 0.030 1.37
Silty clay
loam
20 0.098 0.55 0.027 1.41
Silty clay 12 0.163 0.47 0.023 1.39
Clay 25 0.102 0.51 0.021 1.20
N, the number of soils or samples of a given textural class from which the
mean values are compiled.
Reproduced from Leij FJ, Alves WJ, van Genuchten MT, and Williams JR
(1996) The UNSODA Unsaturated Hydraulic Database. EPA/600/ R-96/095.
Cincinnati, OH: US Environmental Protection Agency.
WATER RETENTION AND CHARACTERISTIC CURVE 283
mathematical function, rather than to physical proper-ties of the porous medium. Relationships betweenthe SWC and the pore-size distribution have beenestablished, which can be described as a statisticallog-normal distribution function. Brutsaert, and morerecently Kosugi, established relationships betweenthe SWC and the pore-size distribution, which can bedescribed as a statistical log-normal distributionfunction. They idealized the soil porous system as aBCC with log-normal distributed radii, and apply thecapillary-rise equation to establish a relationshipbetween the matric potential and effective mediumsaturation. (See Capillarity.)
The applicability of the latter models is limited tocoarse-textured soils and to conditions where capil-lary forces are the major contributor to the matricpotential. They tend to fail in finer-textured soils withhigh specific surface area (e.g., clay soils) where ad-sorptive surface forces dominate, especially underdrier conditions. (See Water Potential.)
Fractal Representation of the Soil PoreSpace and the SWC
Fractals are hierarchical, often highly complex,spatial, or temporal systems that are generated withiterative algorithms obeying simple scaling rules.Patterns within such systems repeat themselves overa defined range of scales (self-similarity). This enablesthe reproduction of statistical properties of a particu-lar pattern at other length or time scales. Fractalgeometry can be applied to describe quantitativelyirregularity and shape of natural objects by esti-mating their fractal dimension. Several theoreticalmodels have been proposed to derive the SWC fromthe fractal representations of the soil porous system.There are two general approaches, based on eithersurface or mass fractals. Surface fractal models assumethat water is only present in the form of adsorbedliquid films on pore surfaces, whereas mass fractalmodels assume that only capillary water obeying thecapillary-rise equation is present within the fractalsystem. As with the BCC approach, fractal modelsfor the SWC are based on derivation of the pore-size
Figure 6 Basic unit elements of the angular pore space model of T
Adsorption and capillary condensation in porous media-liquid re
Resources Research 35(7): 1949–1964.)
distribution from the fractal structure under consider-ation, neglecting pore connectivity and topologyissues. Crawford presented the following relationshipbetween the mass-fractal dimension (Dm) and thedegree of saturation (S):
S ¼ m
b
� �ðDm�deÞ½9�
where m is the matric potential under consideration, b is the matric potential at the air entry point, and de isthe embedding dimension. The embedding dimensionequals 2 in two-dimensional systems and 3 in three-dimensional space. Note that the mass-fractal dimen-sion Dm is always less than de. Due to the identicalfunctional form, eqn [9] is commonly equated withCampbell’s version of the B&C SWC function (eqn[8]) to derive Campbell’s b-factor from the fractaldimension (b ¼ �1/(Dm � de)).
Fractal approaches are limited due to the assump-tion that fractal scaling is valid over an infinite rangeof matric potentials. In reality natural porous mediahave lower and upper scaling limits related to theirminimum and maximum pore sizes. Perfect propo-sed a mass-based model for the SWC that accountsfor the finite range of the matric potential. Systemsthat are fractal over a finite range of scales are calledprefractal.
Physically Based Models for the SWC
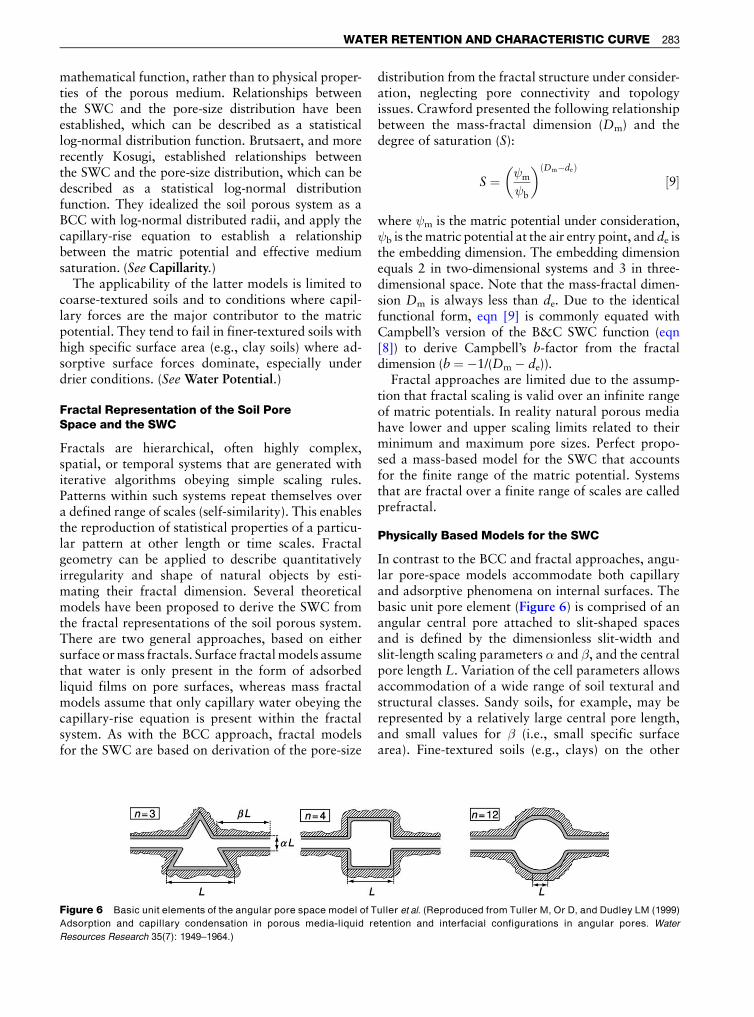
In contrast to the BCC and fractal approaches, angu-lar pore-space models accommodate both capillaryand adsorptive phenomena on internal surfaces. Thebasic unit pore element (Figure 6) is comprised of anangular central pore attached to slit-shaped spacesand is defined by the dimensionless slit-width andslit-length scaling parameters � and �, and the centralpore length L. Variation of the cell parameters allowsaccommodation of a wide range of soil textural andstructural classes. Sandy soils, for example, may berepresented by a relatively large central pore length,and small values for � (i.e., small specific surfacearea). Fine-textured soils (e.g., clays) on the other
uller et al. (Reproduced from Tuller M, Or D, and Dudley LM (1999)
tention and interfacial configurations in angular pores. Water
284 WATER RETENTION AND CHARACTERISTIC CURVE
hand can be represented by relatively small L andlarge � to account for the high internal surface areasoften observed in such soils.
Despite the higher complexity of the angular pore-space model, it has distinct advantages over the morecommonly applied BCC approach. First, angularpores more realistically represent natural porousmedium pore space and allow dual occupancy of wet-ting and nonwetting phases (see the section LiquidRetention and Pore Shape, above). The potentialof accommodating adsorptive surface forces leads toa more accurate derivation of the SWC for porousmedia with high specific surface areas as well as underdry conditions.
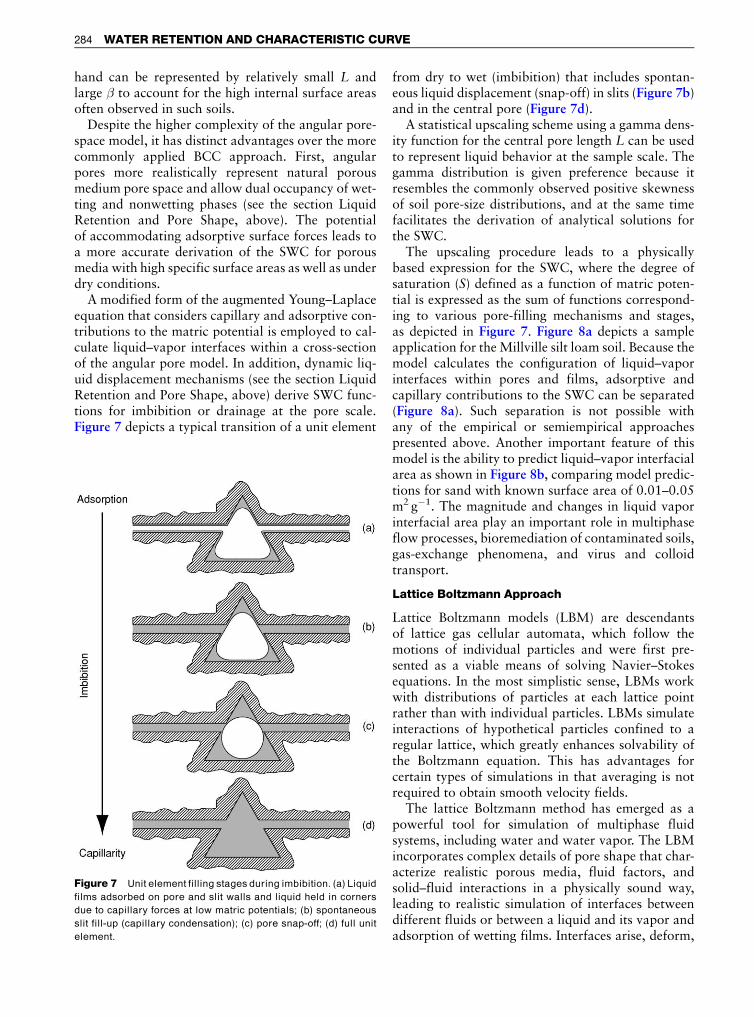
A modified form of the augmented Young–Laplaceequation that considers capillary and adsorptive con-tributions to the matric potential is employed to cal-culate liquid–vapor interfaces within a cross-sectionof the angular pore model. In addition, dynamic liq-uid displacement mechanisms (see the section LiquidRetention and Pore Shape, above) derive SWC func-tions for imbibition or drainage at the pore scale.Figure 7 depicts a typical transition of a unit element
Figure 7 Unit element filling stages during imbibition. (a) Liquid
films adsorbed on pore and slit walls and liquid held in corners
due to capillary forces at low matric potentials; (b) spontaneous
slit fill-up (capillary condensation); (c) pore snap-off; (d) full unit
element.
from dry to wet (imbibition) that includes spontan-eous liquid displacement (snap-off) in slits (Figure 7b)and in the central pore (Figure 7d).
A statistical upscaling scheme using a gamma dens-ity function for the central pore length L can be usedto represent liquid behavior at the sample scale. Thegamma distribution is given preference because itresembles the commonly observed positive skewnessof soil pore-size distributions, and at the same timefacilitates the derivation of analytical solutions forthe SWC.
The upscaling procedure leads to a physicallybased expression for the SWC, where the degree ofsaturation (S) defined as a function of matric poten-tial is expressed as the sum of functions correspond-ing to various pore-filling mechanisms and stages,as depicted in Figure 7. Figure 8a depicts a sampleapplication for the Millville silt loam soil. Because themodel calculates the configuration of liquid–vaporinterfaces within pores and films, adsorptive andcapillary contributions to the SWC can be separated(Figure 8a). Such separation is not possible withany of the empirical or semiempirical approachespresented above. Another important feature of thismodel is the ability to predict liquid–vapor interfacialarea as shown in Figure 8b, comparing model predic-tions for sand with known surface area of 0.01–0.05m2 g�1. The magnitude and changes in liquid vaporinterfacial area play an important role in multiphaseflow processes, bioremediation of contaminated soils,gas-exchange phenomena, and virus and colloidtransport.
Lattice Boltzmann Approach
Lattice Boltzmann models (LBM) are descendantsof lattice gas cellular automata, which follow themotions of individual particles and were first pre-sented as a viable means of solving Navier–Stokesequations. In the most simplistic sense, LBMs workwith distributions of particles at each lattice pointrather than with individual particles. LBMs simulateinteractions of hypothetical particles confined to aregular lattice, which greatly enhances solvability ofthe Boltzmann equation. This has advantages forcertain types of simulations in that averaging is notrequired to obtain smooth velocity fields.
The lattice Boltzmann method has emerged as apowerful tool for simulation of multiphase fluidsystems, including water and water vapor. The LBMincorporates complex details of pore shape that char-acterize realistic porous media, fluid factors, andsolid–fluid interactions in a physically sound way,leading to realistic simulation of interfaces betweendifferent fluids or between a liquid and its vapor andadsorption of wetting films. Interfaces arise, deform,
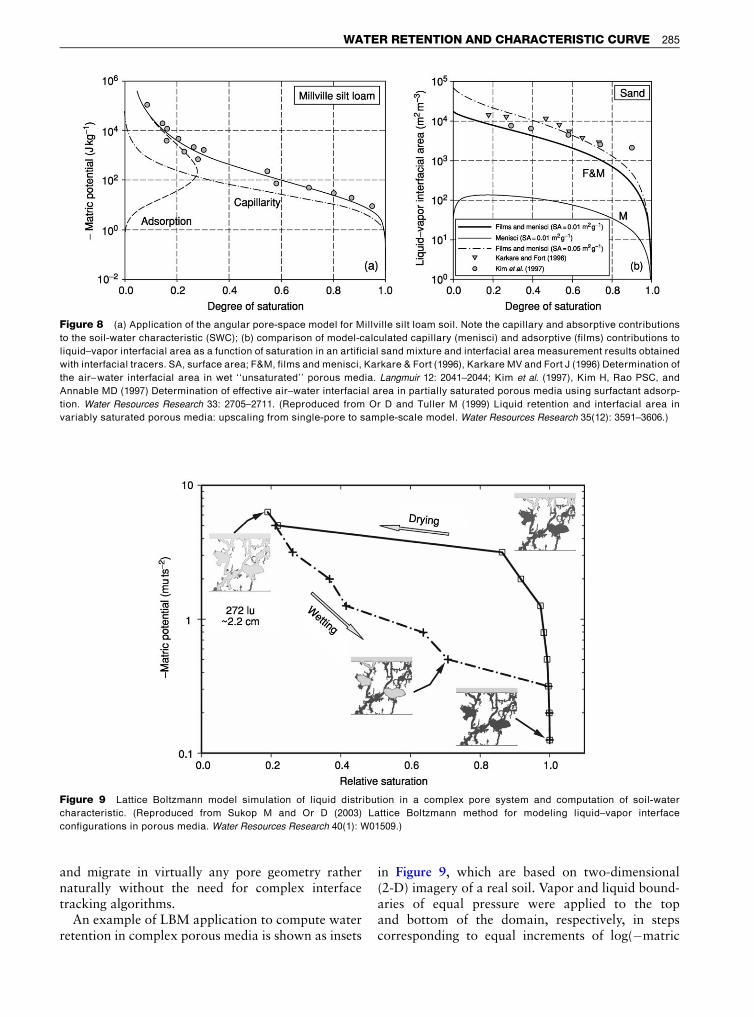
Figure 8 (a) Application of the angular pore-space model for Millville silt loam soil. Note the capillary and absorptive contributions
to the soil-water characteristic (SWC); (b) comparison of model-calculated capillary (menisci) and adsorptive (films) contributions to
liquid–vapor interfacial area as a function of saturation in an artificial sand mixture and interfacial area measurement results obtained
with interfacial tracers. SA, surface area; F&M, films and menisci, Karkare & Fort (1996), Karkare MV and Fort J (1996) Determination of
the air–water interfacial area in wet ‘‘unsaturated’’ porous media. Langmuir 12: 2041–2044; Kim et al. (1997), Kim H, Rao PSC, and
Annable MD (1997) Determination of effective air–water interfacial area in partially saturated porous media using surfactant adsorp-
tion. Water Resources Research 33: 2705–2711. (Reproduced from Or D and Tuller M (1999) Liquid retention and interfacial area in
variably saturated porous media: upscaling from single-pore to sample-scale model. Water Resources Research 35(12): 3591–3606.)
Figure 9 Lattice Boltzmann model simulation of liquid distribution in a complex pore system and computation of soil-water
characteristic. (Reproduced from Sukop M and Or D (2003) Lattice Boltzmann method for modeling liquid–vapor interface
configurations in porous media. Water Resources Research 40(1): W01509.)
WATER RETENTION AND CHARACTERISTIC CURVE 285
and migrate in virtually any pore geometry rathernaturally without the need for complex interfacetracking algorithms.
An example of LBM application to compute waterretention in complex porous media is shown as insets
in Figure 9, which are based on two-dimensional(2-D) imagery of a real soil. Vapor and liquid bound-aries of equal pressure were applied to the topand bottom of the domain, respectively, in stepscorresponding to equal increments of log(�matric
286 WATER RETENTION AND CHARACTERISTIC CURVE
potential). The matric potential is expressed in massunits per time step squared (equivalent to energy perunit volume in a 3-D system). Each potential step wasterminated when the relative change in fluid mass inthe domain was negligibly small. The simulated liquidbehavior and SWC curve show appreciable differ-ences in fluid configurations during wetting anddrying that resulted from hysteresis.
Pore Network Models and the SWC
Network models were first developed by Fatt, basedon the idea that pore space may be represented as aninterconnected network of capillary tubes whose radiirepresent the dimensions of the pores within a porousmedium. For a given matric potential, liquid–vaporinterfacial configurations within the network canbe determined exactly, based on pore-scale capillaryand dynamic displacement considerations. Themacroscopic SWC is then determined based on geo-metric volume averaging of the spatially distributedliquid within the network. A primary advantage ofpore network models is explicit consideration of poreconnectivity and topology in a simplified and math-ematically tractable framework. Some of the limita-tions involve oversimplification of pore-scale physics(e.g., neglect of adsorptive pore-scale processes),incomplete understanding of interface migration androuting, inadequate technologies for inference of net-work parameters from real samples, and significant
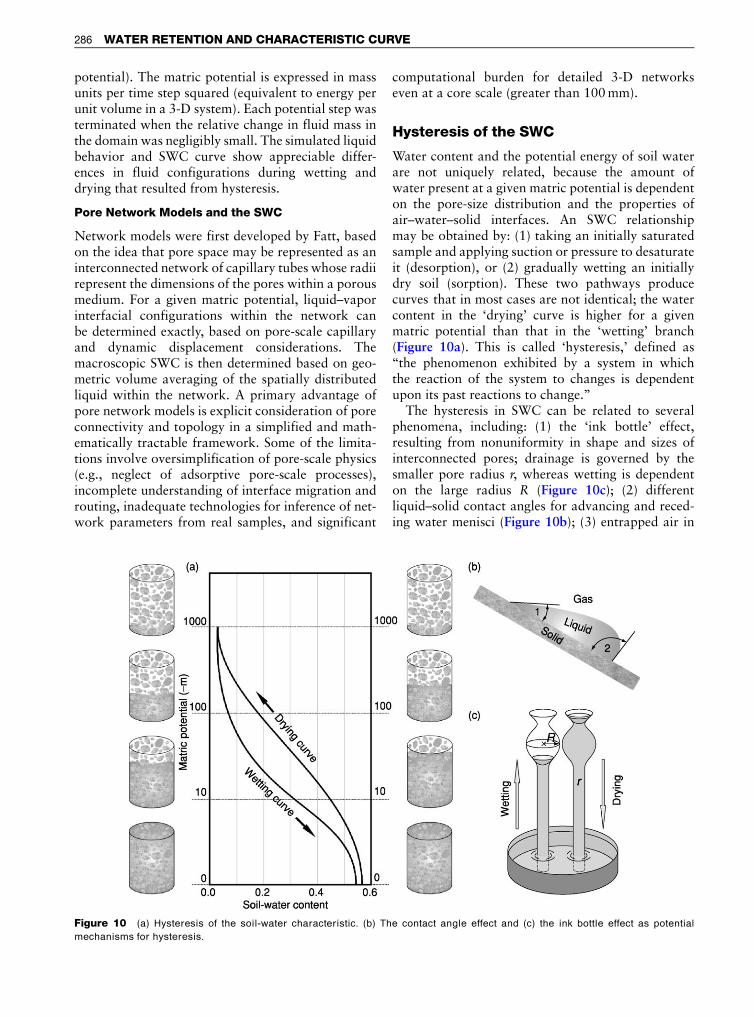
Figure 10 (a) Hysteresis of the soil-water characteristic. (b) Th
mechanisms for hysteresis.
computational burden for detailed 3-D networkseven at a core scale (greater than 100 mm).
Hysteresis of the SWC
Water content and the potential energy of soil waterare not uniquely related, because the amount ofwater present at a given matric potential is dependenton the pore-size distribution and the properties ofair–water–solid interfaces. An SWC relationshipmay be obtained by: (1) taking an initially saturatedsample and applying suction or pressure to desaturateit (desorption), or (2) gradually wetting an initiallydry soil (sorption). These two pathways producecurves that in most cases are not identical; the watercontent in the ‘drying’ curve is higher for a givenmatric potential than that in the ‘wetting’ branch(Figure 10a). This is called ‘hysteresis,’ defined as‘‘the phenomenon exhibited by a system in whichthe reaction of the system to changes is dependentupon its past reactions to change.’’
The hysteresis in SWC can be related to severalphenomena, including: (1) the ‘ink bottle’ effect,resulting from nonuniformity in shape and sizes ofinterconnected pores; drainage is governed by thesmaller pore radius r, whereas wetting is dependenton the large radius R (Figure 10c); (2) differentliquid–solid contact angles for advancing and reced-ing water menisci (Figure 10b); (3) entrapped air in
e contact angle effect and (c) the ink bottle effect as potential
WATER RETENTION AND CHARACTERISTIC CURVE 287
a newly wetted soil (e.g., pore doublet); and (4) swell-ing and shrinking of the soil under wetting anddrying. The role of individual factors remains unclearand is subject to ongoing research.
Part of the hysteresis phenomena may be attributedto measurement artifacts, for example due to diff-erences between tension- and pressure-induced desa-turation. A potentially important aspect of desorptionmethods under tension is the possibility of liquiddisplacement (drainage) even in the absence of a con-tinuous gaseous phase due to cavitation initiated byencapsulated gas bubbles or the liquid’s own vaporpressure. Surface heterogeneity and impurities insoil and rock water are conducive to lowering thecavitation threshold.
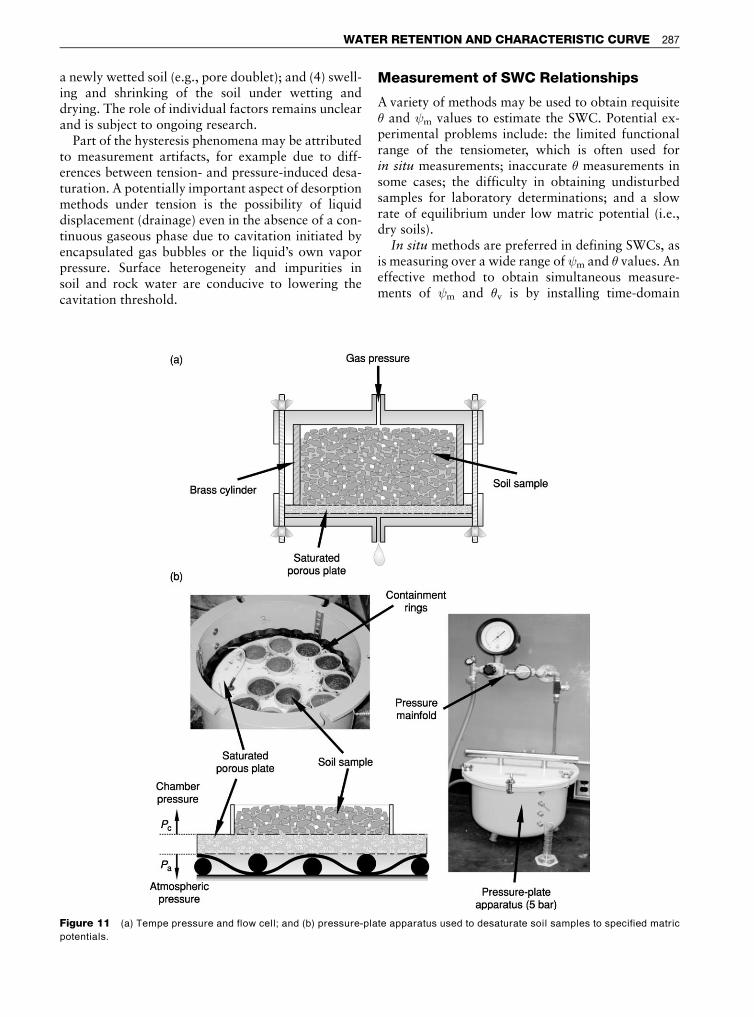
Figure 11 (a) Tempe pressure and flow cell; and (b) pressure-pla
potentials.
Measurement of SWC Relationships
A variety of methods may be used to obtain requisite� and m values to estimate the SWC. Potential ex-perimental problems include: the limited functionalrange of the tensiometer, which is often used forin situ measurements; inaccurate � measurements insome cases; the difficulty in obtaining undisturbedsamples for laboratory determinations; and a slowrate of equilibrium under low matric potential (i.e.,dry soils).
In situ methods are preferred in defining SWCs, asis measuring over a wide range of m and � values. Aneffective method to obtain simultaneous measure-ments of m and �v is by installing time-domain
te apparatus used to desaturate soil samples to specified matric
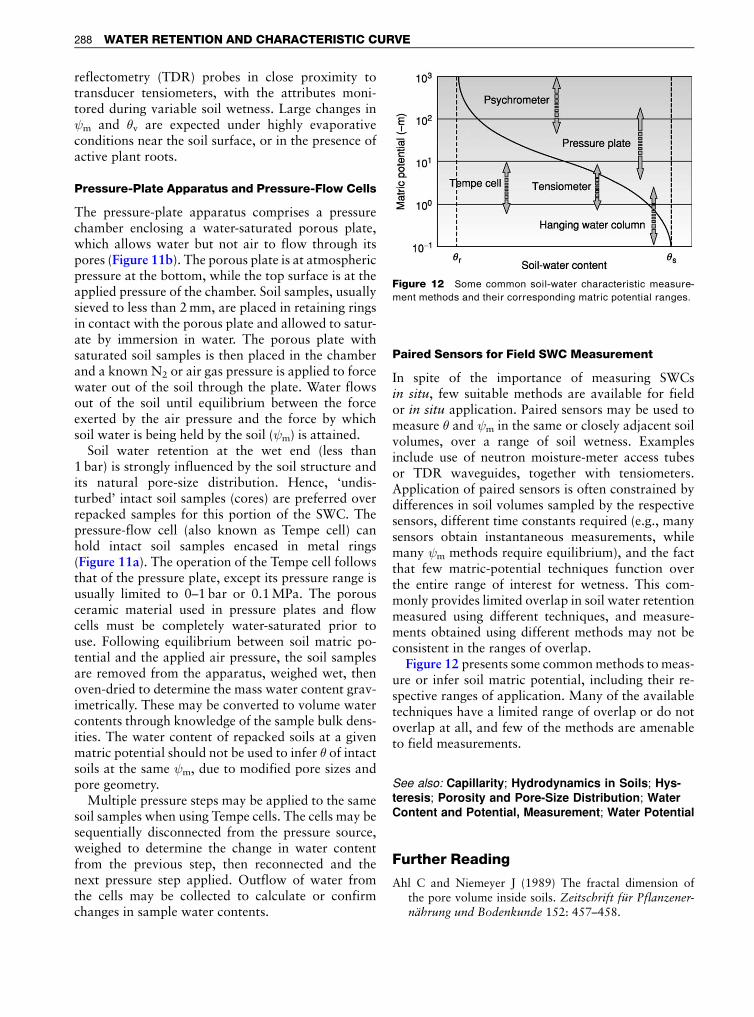
Figure 12 Some common soil-water characteristic measure-
ment methods and their corresponding matric potential ranges.
288 WATER RETENTION AND CHARACTERISTIC CURVE
reflectometry (TDR) probes in close proximity totransducer tensiometers, with the attributes moni-tored during variable soil wetness. Large changes in m and �v are expected under highly evaporativeconditions near the soil surface, or in the presence ofactive plant roots.
Pressure-Plate Apparatus and Pressure-Flow Cells
The pressure-plate apparatus comprises a pressurechamber enclosing a water-saturated porous plate,which allows water but not air to flow through itspores (Figure 11b). The porous plate is at atmosphericpressure at the bottom, while the top surface is at theapplied pressure of the chamber. Soil samples, usuallysieved to less than 2 mm, are placed in retaining ringsin contact with the porous plate and allowed to satur-ate by immersion in water. The porous plate withsaturated soil samples is then placed in the chamberand a known N2 or air gas pressure is applied to forcewater out of the soil through the plate. Water flowsout of the soil until equilibrium between the forceexerted by the air pressure and the force by whichsoil water is being held by the soil ( m) is attained.
Soil water retention at the wet end (less than1 bar) is strongly influenced by the soil structure andits natural pore-size distribution. Hence, ‘undis-turbed’ intact soil samples (cores) are preferred overrepacked samples for this portion of the SWC. Thepressure-flow cell (also known as Tempe cell) canhold intact soil samples encased in metal rings(Figure 11a). The operation of the Tempe cell followsthat of the pressure plate, except its pressure range isusually limited to 0–1 bar or 0.1 MPa. The porousceramic material used in pressure plates and flowcells must be completely water-saturated prior touse. Following equilibrium between soil matric po-tential and the applied air pressure, the soil samplesare removed from the apparatus, weighed wet, thenoven-dried to determine the mass water content grav-imetrically. These may be converted to volume watercontents through knowledge of the sample bulk dens-ities. The water content of repacked soils at a givenmatric potential should not be used to infer � of intactsoils at the same m, due to modified pore sizes andpore geometry.
Multiple pressure steps may be applied to the samesoil samples when using Tempe cells. The cells may besequentially disconnected from the pressure source,weighed to determine the change in water contentfrom the previous step, then reconnected and thenext pressure step applied. Outflow of water fromthe cells may be collected to calculate or confirmchanges in sample water contents.
Paired Sensors for Field SWC Measurement
In spite of the importance of measuring SWCsin situ, few suitable methods are available for fieldor in situ application. Paired sensors may be used tomeasure � and m in the same or closely adjacent soilvolumes, over a range of soil wetness. Examplesinclude use of neutron moisture-meter access tubesor TDR waveguides, together with tensiometers.Application of paired sensors is often constrained bydifferences in soil volumes sampled by the respectivesensors, different time constants required (e.g., manysensors obtain instantaneous measurements, whilemany m methods require equilibrium), and the factthat few matric-potential techniques function overthe entire range of interest for wetness. This com-monly provides limited overlap in soil water retentionmeasured using different techniques, and measure-ments obtained using different methods may not beconsistent in the ranges of overlap.
Figure 12 presents some common methods to meas-ure or infer soil matric potential, including their re-spective ranges of application. Many of the availabletechniques have a limited range of overlap or do notoverlap at all, and few of the methods are amenableto field measurements.
See also: Capillarity; Hydrodynamics in Soils; Hys-teresis; Porosity and Pore-Size Distribution; WaterContent and Potential, Measurement; Water Potential
Further Reading
Ahl C and Niemeyer J (1989) The fractal dimension ofthe pore volume inside soils. Zeitschrift fur Pflanzener-nahrung und Bodenkunde 152: 457–458.

WATER RETENTION AND CHARACTERISTIC CURVE 289
Berkowitz B and Ewing RP (1998) Percolation theory andnetwork modeling applications in soil physics. Surveysin Geophysics 19: 23–72.
Bird NRA, Bartoli F, and Dexter AR (1996) Water retentionmodels for fractal soil structures. European Journal ofSoil Science 47: 1–6.
Brooks RH and Corey AT (1964) Hydraulic Propertiesof Porous Media. Hydrology Papers, No. 3. Fort Collins,CO: Colorado State University Press.
Celia MA, Reeves PC, and Ferrand LA (1995) Recentadvances in pore scale models for multiphase flow inporous media. US National Report of the InternationalUnion of Geodesy and Geophysics 1991–1994. Reviewsof Geophysics 33: 1049–1057.
Chen S and Doolen GD (1998) Lattice Boltzmann methodfor fluid flows. Annual Review of Fluid Mechanics 30:329–364.
Crawford JW (1994) The relationship between structureand the hydraulic conductivity of soil. European Journalof Soil Science 45: 493–502.
Dullien FAL (1992) Porous Media: Fluid Transport andPore Structure, 2nd edn. San Diego, CA: AcademicPress.
Gimenez D, Perfect E, Rawls WJ, and Pachepsky YA (1997)Fractal models for predicting soil hydraulic properties: areview. Engineering Geology 48: 161–183.
Haines WB (1930) Studies in the physical properties of soil.V. The hysteresis effect in capillary properties, and themodes of moisture distribution associated therewith.Journal of Agricultural Science 20: 97–116.
Kutilek M and Nielsen DR (1994) Soil Hydrology. Reis-kirchen, Germany: Catena-Verlag.
Leij FJ, Alves WJ, van Genuchten MT, and Williams JR(1996) The UNSODA Unsaturated Hydraulic Data-base. EPA/600/R-96/095. Cincinnati, OH: US Environ-mental Protection Agency.
Li Y and Wardlaw NC (1986) Mechanisms of nonwettingphase trapping during imbibition at slow rates. Journalof Colloid Interface Science 109: 473–486.
Mandelbrot BB (1975) Les Objets Fractals: Forme, Hasardet Dimension. Paris, France: Flammarion.
Mandelbrot BB (1982) The Fractal Geometry of Nature.San Francisco, CA: Freeman.
Mualem Y (1976) A new model for predicting the hydraulicconductivity of unsaturated porous media. Water Re-sources Research 12(3): 513–522.
Mualem Y (1984) A modified dependent domain theory ofhysteresis. Soil Science 137: 283–291.
Or D and Tuller M (1999) Liquid retention and interfacialarea in variably saturated porous media: upscaling fromsingle-pore to sample-scale model. Water ResourcesResearch 35(12): 3591–3606.
Or D and Tuller M (2002) Cavitation during desaturationof porous media under tension. Water ResourcesResearch 38(5): 19.
Or D, Groeneveld DP, Loague K, and Rubin Y (1991)Evaluation of Single and Multi-parameter Methodsfor Estimating Soil-Water Characteristic Curves. Geo-technical Engineering Report No. UCB/GT/91-07.Berkeley, CA: University of California Press.
Pachepsky YA, Shcherbakov RA, and Korsunskaya LP(1995) Scaling of soil water retention using a fractalmodel. Soil Science 159: 99–104.
Perfect E (1999) Estimating soil mass fractal dimensionsfrom water retention curves. Geoderma 88: 221–231.
Rawls WJ and Brakensiek DL (1989) Estimation of soilwater retention and hydraulic properties. In: Morel-Seytoux HJ (ed.) Unsaturated Flow in Hydraulic Mo-deling Theory and Practice, pp. 275–300. NATOASI Series. Series C: Mathematical and physical sciences,No. 275.
Sahimi M (1995) Flow and Transport in Porous Media andFractured Rock. Weinheim, Germany: VCH-Verlag.
Scholle PA (1979) A Color Illustrated Guide to Constitu-ents, Textures, Cements, and Porosities of Sandstonesand Associated Rocks. American Association of Petrol-eum Geologists Memorandum 28. Julsa, OK: AmericanAssociation of Petroleum Geologists.
Tuller M and Or D (2001) Hydraulic conductivity of vari-ably saturated porous media – laminar film and cornerflow in angular pore space. Water Resources Research37(5): 1257–1276.
Tuller M, Or D, and Dudley LM (1999) Adsorption andcapillary condensation in porous media-liquid retentionand interfacial configurations in angular pores. WaterResources Research 35(7): 1949–1964.
Tyler SWI and Wheatcraft SW (1990) Fractal processesin soil water retention. Water Resources Research 26:1047–1054.
van Genuchten MT (1980) A closed-form equation for pre-dicting the hydraulic conductivity of unsaturated soils.Soil Science Society of America Journal 44: 892–898.