predicting the soil water characteristic curve from the
TRANSCRIPT
1
Predicting the soil water characteristic curve from the particle size
distribution based on a pore space geometry containing slit-shaped
spaces
Chen-chao Chang, Dong-hui Cheng
School of Environmental Sciences and Engineering, Chang’an University, Xi’an, 710054, China; 5
Key Laboratory of Subsurface Hydrology and Ecological Effects in Arid Region (Chang’an University), Ministry of
Education, Xi’ an, China
Correspondence to: Dong-hui Cheng ([email protected])
Abstract. Traditional models employed to predict the soil water characteristic curve (SWC) from the particle size
distribution (PSD) always underestimate the water content in the dry range of the SWC. Using the measured physical 10
parameters of 48 soil samples from the UNSODA unsaturated soil hydraulic property database, these errors were proven to
originate from the underestimation of the pore volume fraction of the minimum pore diameter range. A method was
therefore proposed to improve the estimation of the water content in the high suction range using a pore model comprising a
circle-shaped central pore connected to slit-shaped spaces; in this model, the pore volume fraction of the minimum pore
diameter range and the corresponding water content were accordingly increased. The SWCs predicted using the improved 15
method reasonably approximated the measured SWCs, and which were more accurate than those obtained using traditional
method in the dry range of the SWC.
1 Introduction
The soil water characteristic curve (SWC), which represents the relationship between the water pressure and water content, is
fundamental to researching water flow and chemical transport in unsaturated media (Pollacco et al., 2017). Direct 20
measurements of the SWC consume both time and money (Arya and Paris, 1981;Mohammadi and Vanclooster, 2011), while
estimating the SWC from the particle size distribution (PSD) is both rapid and economical. Therefore, a number of
associated conceptual and physical models have been proposed.
The first attempt to directly translate a PSD into an SWC was performed by Arya and Paris (1981) (hereinafter referred to as
the AP model). In this model, the PSD is divided into multiple size fractions and the bulk and particle densities of the 25
natural-structure sample are uniformly applied to each particle size fraction, from which it follows that the relative pore
fraction and the relative solid fraction are equal. Thus, the degree of saturation can be set equal to the cumulative PSD
function. The soil suction head can be obtained using the capillary equation based on a “bundle of cylindrical tubes” model,
and the pore size in the equation is determined by scaling the pore length and pore volume (Arya et al., 2008). Based on the
Hydrol. Earth Syst. Sci. Discuss., https://doi.org/10.5194/hess-2017-668Manuscript under review for journal Hydrol. Earth Syst. Sci.Discussion started: 5 December 2017c© Author(s) 2017. CC BY 4.0 License.
2
principle of the AP model, many researchers have focused on improving the suction head calculations, which are commonly
based on the capillary equation; however, various methods are used to translate the particle diameter into the pore diameter
(Haverkamp et al., 1986;Zhuang et al., 2001;Mohammadi and Vanclooster, 2011;Jensen et al., 2015). Some models estimate
the pore diameter based on particle packing patterns (e.g., the MV model), while others utilize the proportionality factor
between the pore size and the associated particle diameter (e.g., the HP model and two-stage approach). However, the 5
scheme employed to estimate the water content has not been modified and follows the approach of the AP model.
However, these traditional models which follow the water content calculation approach of the AP model underestimate the
water content in the dry range of the SWC (Hwang and Powers, 2003;Meskini-vishkaee et al., 2014). Therefore, some
researchers have attempted to improve the water content calculation approach by attributing model errors to both a
simplified pore geometry and an incomplete desorption of residual water in the soil pore within the high matric suction head 10
range (Tuller et al., 1999;Mohammadi and Meskini-Vishkaee, 2012). Recent findings revealed the existence of corner water,
lens water and film water in soils at high matric suction head (Tuller et al., 1999;Mohammadi and Meskini-Vishkaee,
2012;Or and Tuller, 1999;Shahraeeni and Or, 2010;Tuller and Or, 2005). Therefore, Mohammadi and Meskini-Vishkaee
(2012) slightly improved upon the traditional MV model and predicted the SWC based on the PSD while considering
adsorbed water film and lens water between the soil particles. Tuller et al. (1999) proposed a pore space geometry containing 15
slit-shaped spaces and derived a corresponding SWC that considered water film and water in angular-shaped pores; however,
the SWC failed to describe experimental data at an intermediate water content due to the limitations of the gamma
distribution function used to characterize the pore size distribution (PoSD) (Lebeau and Konrad, 2010). Moreover, this
model was mathematically complex. Mohammadi and Meskini-Vishkaee (2013) incorporated the residual water content into
the MV model and consequently decreased the magnitude of the underestimation in the dry range of the SWC. However, an 20
accurate estimation of the residual water content remains a challenge.
Many traditional models are based on a “bundle of cylindrical tubes” representation of the pore space geometry (Arya and
Paris, 1981;Zhuang et al., 2001), which results in intrinsic errors when predicting water flow in variably saturated soils.
Consequently, some researchers have considered pore networks as bundles of triangular tubes, which could incorporate the
contribution of water in pore corners to the water content (Helland and Skjæveland, 2007). A new pore geometry model 25
comprising a polygon-shaped central pore connected to slit-shaped spaces was proposed by Tuller et al. (1999) to provide a
more realistic representation of natural pore spaces (Tuller et al., 1999;Or and Tuller, 1999;Tuller and Or, 2001). This model
could represent a foundation for accurately describing the water status in natural soils, particularly in arid environments.
The objectives of this study were therefore to evaluate the leading factors that lead to the underestimation of the water
content in the dry range of the SWC using traditional methods and to furthermore propose a method for accurately 30
estimating the water content using a pore space geometry containing slit-shaped spaces to improve the prediction of the
SWC.
Hydrol. Earth Syst. Sci. Discuss., https://doi.org/10.5194/hess-2017-668Manuscript under review for journal Hydrol. Earth Syst. Sci.Discussion started: 5 December 2017c© Author(s) 2017. CC BY 4.0 License.
3
2 Basic descriptions
The relationship between the PSD and the PoSD is a fundamental element when predicting the SWC from the PSD. Hwang
and Powers (2003) found that the nonlinear relationship between the PSD and the PoSD would be more appropriate than the
linear relationship applied in the AP model and therefore described both the PSD and the PoSD as lognormal distributions.
However, since the PSD and PoSD of soils do not strongly follow a lognormal distribution, this model performed very 5
poorly for moderately fine-textured soils (Hwang and Choi, 2006). Obtaining an accurate PoSD from the PSD of a soil is
highly difficult, and the errors that arise from this approach could cause inevitable errors in the SWC. However, the
underestimation of the water content in the dry range of an SWC has not been comprehensively evaluated from this
perspective.
In this study, the measured PoSDs of 48 soil samples were compared with the PoSDs calculated using a traditional model 10
(They were actually corresponding PSDs) to identify the origins of the errors and their effects on the accuracy of the SWC.
The provided 48 soil samples exhibited a wide range of physical properties (Table 1), and they were selected from the
UNSODA unsaturated soil hydraulic property database, which contains 790 soil samples with general unsaturated soil
hydraulic properties and basic soil properties (e.g., water retention, hydraulic conductivity, soil water diffusivity, PSD, bulk
density, and organic matter content) (Nemes et al., 2001). 15
(1) Calculating the PoSD using a traditional model
Traditional models commonly assume that the pore volume fraction of each size fraction can be set equal to the relative solid
fraction(Arya and Paris, 1981). Thus, the cumulative pore volume fraction can take the following form:
niij
j
i
ij
j
i ,,3,2,1;11
(1)
where ωi is the solid fraction of the ith particle fraction, νi is the pore volume fraction associated with the ith fraction, and n 20
is the total number of size fractions in the PSD.
The routine procedures employed among the several traditional models to translate a particle diameter into a pore diameter
are different. The equivalent pore diameter can be derived from physical properties, including the bulk density and the
particle density, or from the proportionate relationship between the pore size and associated particle diameter. Although the
former can logically characterize a pore, a complicated pattern can slightly reduce the model performance. Meanwhile, the 25
latter approach is easy to use, and its rationality has been demonstrated by some researchers (Hamamoto et al., 2011;Sakaki
et al., 2014). Here, the latter technique was applied, and it can be expressed as
0.3i id D (2)
where Di is the mean particle diameter of the ith fraction (μm), di is the corresponding equivalent pore diameter (μm).
Inputting the PSD data, then calculated pore diameters are sequentially paired with corresponding pore volume fractions to 30
obtain a Calculated PoSD.
(2) Measuring the PoSD
Hydrol. Earth Syst. Sci. Discuss., https://doi.org/10.5194/hess-2017-668Manuscript under review for journal Hydrol. Earth Syst. Sci.Discussion started: 5 December 2017c© Author(s) 2017. CC BY 4.0 License.
4
It is generally difficult to measure the PoSD of a soil; however, the PoSD can be indirectly obtained using the measured
water content and suction head (Jayakody et al., 2014). The cumulative pore volume fraction of the ith fraction is equal to
the ratio of the measured water content to the saturated water content (Eq. (3)):
niij
j
isi ,,3,2,1;1
(3)
where θs is the saturated water content (cm3
cm-3
), and θi is the measured water content (cm3 cm
-3). Meanwhile, the 5
corresponding pore diameters are derived on the basis of capillary theory and Eq. (4).
3000i
id (4)
where ψi is suction head (cmH2O). The PoSD obtained in this way is considered the measured PoSD.
The calculated and measured PoSD data were fitted using a modified logistic growth model (Eq. (5)) (Liu et al., 2003):
c
i
ibda
w
exp1
1 (5) 10
where wi is the cumulative pore volume fraction with diameters smaller than di (%), and a, b, and c are the fitting parameters
(dimensionless). This model produced a good fit for the PoSD data employed in this study with a coefficient of
determination (r2) that ranged from 0.972 to 0.999.
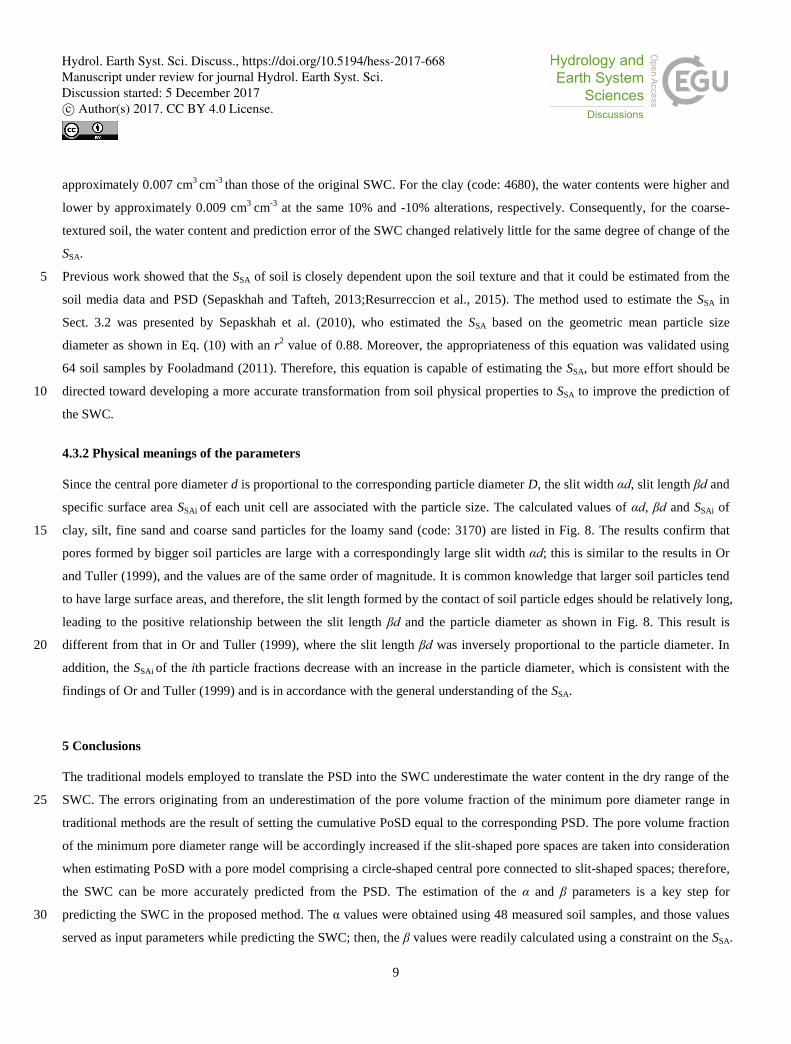
The measured pore volume fraction curves for the typical samples, namely, sand (code: 3172) and clay (code: 2360), and
their calculated curves using the traditional model are presented in Fig. 1. The small maps embedded in Fig. 1 exhibit the 15
measured and calculated PoSD curves. Figure 1 show that the calculated PoSD curves approximately coincide with the
measured curves in the larger pore diameter range, while the calculated values in the smaller range, which correspond to the
higher suction range on the SWC curve, are obviously smaller than the measured values. The underestimation of the PoSD in
the smaller pore diameter range can consequently lead to an underestimation of the water content at a higher suction range.
In particular, the calculated pore volume fraction associated with the smallest pore diameter (d≤0.6 μm) was far less than the 20
measured pore fraction. These results illustrate that the underestimation of the pore volume fraction with respect to the
smallest pore diameter (d≤0.6 μm) was a key factor with regard to the underestimation of the water content in the dry range
of the SWC. Besides, the underestimation of pore volume fraction is associated with an oversimplified pore space geometry,
which traditional models have generally characterized as a bundle of cylindrical capillaries. The measured and calculated
pore curves of the other 46 soil samples behaved in the same fashion, and those curves are provided in the supporting 25
information (Fig. S1).
Hydrol. Earth Syst. Sci. Discuss., https://doi.org/10.5194/hess-2017-668Manuscript under review for journal Hydrol. Earth Syst. Sci.Discussion started: 5 December 2017c© Author(s) 2017. CC BY 4.0 License.
5
3 Improved method
3.1 Estimating the pore volume fraction
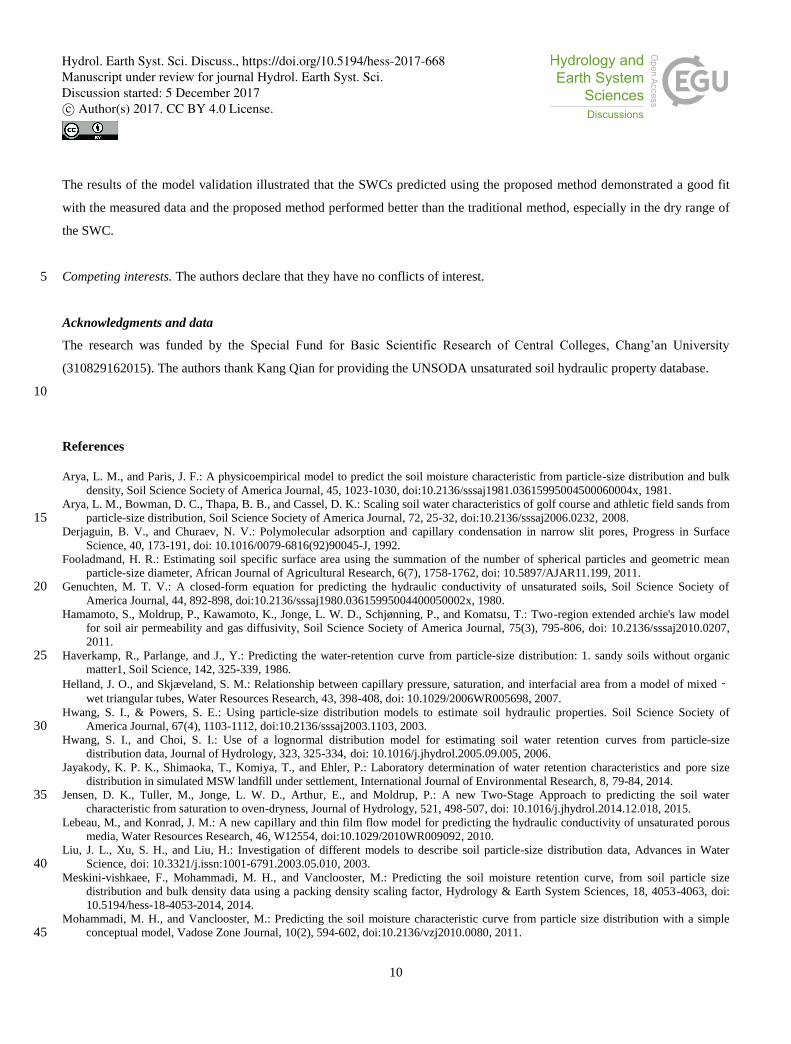
In this study, the soil pore structure is conceptualized within a pore model in which the elementary unit cell is composed of a
relatively larger circle-shaped central pore connected to two slit-shaped spaces (see Fig. 2). Relative to the polygonal central
pore connected to slit-shaped spaces as described by Or and Tuller (1999), both the slit width and the slit length are 5
proportional to the diameter of the associated central pore d and are therefore expressed as αd and βd, respectively.
When estimating the pore volume fraction using the pore model described above, the volume fractions of the central pore
and slit-shaped space are distinguished. The slit-shaped pore spaces are accordingly classified into the smallest central pore
size since the sizes of the slit-shaped pore spaces are smaller than the minimum central pore diameter. The particle sizes of
our samples range from 2 to 2000 μm, and the corresponding pore sizes are between 0.6 and 600 μm; meanwhile, the largest 10
slit width calculated from the parameters in Table 2 is 0.24 μm. In addition, when the drainage potential is given as μ=-
2σ/(ραd) based on the capillary theory (Derjaguin and Churaev, 1992), the critical potential for slit snap-off of the widest slit
is 6202 cm, which is smaller than the critical potential of 5000 cm calculated using Eq. (4) for the minimum central pore.
This also demonstrates that the equivalent pore diameter of a slit space is smaller than the minimum central pore diameter.
Therefore, the pore volume fractions of the soil samples were simplified into those of central pores, but the volume fraction 15
of the minimum central pore contained the volume fraction of all slit-shaped spaces. Coupled with the traditional assumption
that the volume fraction of each unit cell (i.e., the central pore and two slit spaces) is equal to the relative particle mass
fraction and the geometric relationship described in Fig. 2, the volume fractions of central pores and slit-shaped space can be
separated, then the pore volume fractions with respect to different sizes can be readily obtained.
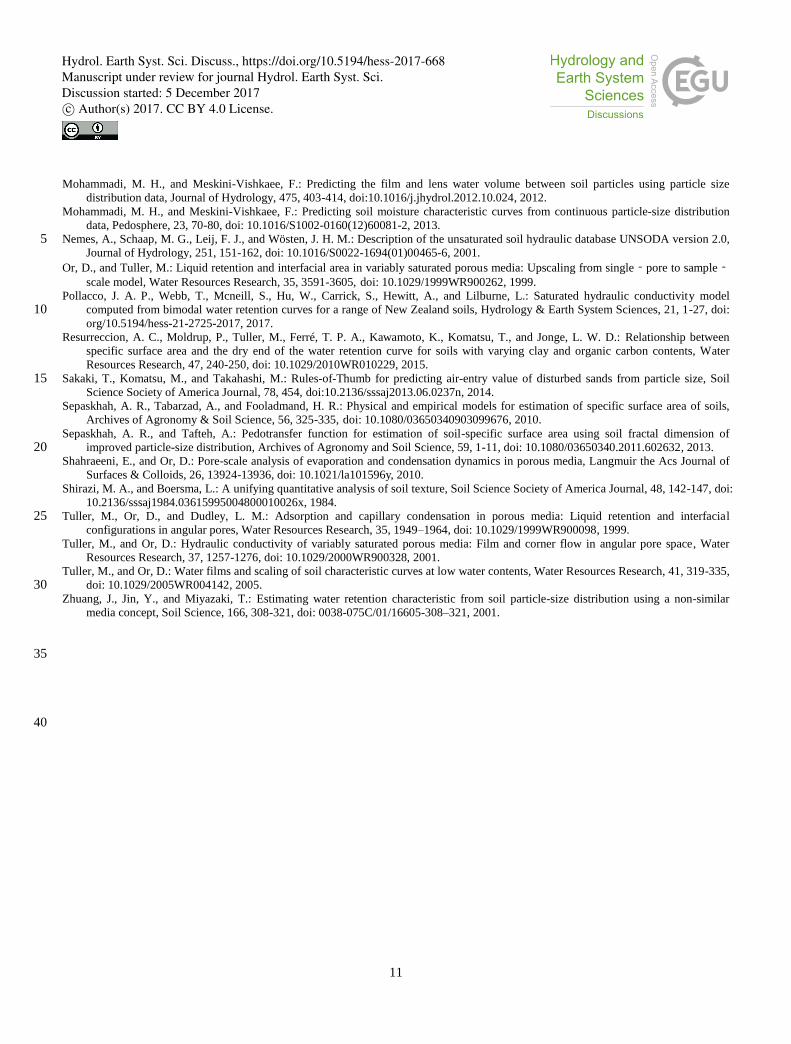
The procedure utilized to calculate the pore volume fraction is shown in Fig. 3. Assuming that the soil pores are composed of 20
numerous unit cells with various sizes, the fraction of the ith unit cell is equal to the relative particle mass fraction ωi. The
sum of the slit pore volume fractions of various sizes (ζ2+ζ3+……+ζi) and the volume fraction of the smallest unit cell (ω1)
form the volume fraction of the smallest pore (ν1). Successively accumulating that volume fraction with the other central
pore volume fractions (i.e., ν2, ν3, ν4…) provides the PoSD of a sample. The slit pore volume fraction, ζi, the volume fraction
of the smallest pore ν1 and the volume fractions of the other pores νi were calculated using Eq. (6), Eq. (7) and Eq. (8), 25
respectively:
2
2 2
2
24
ii i
i i
d
d d
(6)
n
i
2
11 (7)
Hydrol. Earth Syst. Sci. Discuss., https://doi.org/10.5194/hess-2017-668Manuscript under review for journal Hydrol. Earth Syst. Sci.Discussion started: 5 December 2017c© Author(s) 2017. CC BY 4.0 License.
6
iii (8)
where ζi is the slit pore volume fraction, νi is the volume fraction of the ith pore fraction, and α and β are the scaling
parameters of the slit width and the slit length, respectively.
3.2 Values of α and β
To obtain the values of α and β, an expression containing both of these parameters with respect to the specific surface area 5
(SSA) was applied here. The SSA of the pore as shown in Fig. 2 can be described using a geometrical relationship as follows:
ni
dd
ddS
ii
ii
ji
j
i
b
SA ,2,1;
42
4
1000 221
(9)
where SSA is the specific surface area (m2
g-1
), di is the pore diameter (m), ρb is the bulk density (kg m-3
) and Φ is the
measured porosity. Therefore, an important requirement for the calculation of the α and β values is an estimate of the 10
sample-scale value of SSA. Here, a power equation was applied as follows (Sepaskhah et al., 2010):
905.089.3 gSA dS (10)
where SSA is the estimated specific surface area (m2
g-1
), and dg is the geometric mean particle size diameter (mm) obtained
using Eq. (11) (Shirazi and Boersma, 1984):
sasasisiccg MfMfMfd lnlnlnexp (11) 15
where fc, fsi and fsa are the clay, silt and sand fractions (%) of the soil sample, respectively, Mc, Msi and Msa are the mean
diameters of clay, silt and sand that are empirically taken as 0.001 mm, 0.026 mm and 1.025 mm, respectively.
Consequently, the quantitative relationship between the parameters α and β can be obtained using Eq. (9). Associated with
the additional constraint of Eq. (10), the values of α and β can be theoretically solved if the measured slit volume fraction or
the measured SWC is known. However, an analytical solution is difficult to derive due to the high nonlinearity of both 20
equations. Here, a trial and error approach was adopted that was much easier than the analytical method. Conveniently,
UNSODA database provided a great deal of soil information, including measured SWCs and diverse physical properties.
The routine procedure for handling a soil sample involved the following steps. First, given the initial value of α, the value of
β was calculated using Eqs. (9)-(11), after which the PoSD was predicted using Eqs. (6)-(8). Subsequently, the SWC was
estimated using the method described in Sect. 3.3. Finally, the value of α was changed repeatedly until the newer predicted 25
SWC was in good agreement with the measured SWC and the water content corresponding to a suction head of 5000 cmH2O
was within 90% of the measured data (see Fig.S2 in the supporting information). The results for the 48 soil samples
indicated that the β values exhibited a broad range of variation for all samples, while the α values showed regular changes
Hydrol. Earth Syst. Sci. Discuss., https://doi.org/10.5194/hess-2017-668Manuscript under review for journal Hydrol. Earth Syst. Sci.Discussion started: 5 December 2017c© Author(s) 2017. CC BY 4.0 License.
7
with the soil texture. The relationship between the sand contents and α values for the 48 samples is shown in Fig. 4, which
clearly demonstrates that the values of α are similar for samples with specific sand contents.
Therefore, the approach was simplified by setting α as a constant for similar soil textures. The corresponding detailed
descriptions are summarized in Table 2. The values of α were in the range from 3.34E-05 to 2.12E-02, which were estimated
by Or and Tuller (1999) using a pore-scale geometry model comprising a polygon-shaped central pore connected to slit-5
shaped spaces. According to the sand contents, Table 2 is a reference for determining the α values for sample that serve as
input parameters in predicting the SWC from the PSD hereinafter.
3.3 Estimating the SWC
The values of α and β for the various soil samples facilitated the acquisition of the volume fractions of the slit pores using Eq.
(6) and the PoSD using Eqs. (7) and (8). The water contents associated with different pore filling stages could be estimated 10
by substituting the PoSD into Eq. (3), and the pore sizes and the corresponding suction heads could be calculated using Eqs.
(2) and (4). The SWC could be ultimately obtained using the calculated suction heads and water contents.
4 Model validation
4.1 Data sources
Twenty-two soil samples with a wide range of physical properties were also selected from UNSODA database to validate the 15
model; the codes and contents of the samples are summarized in Table 3 and Fig. 5. For the soil samples that were not
provided with a saturated water content θs, the first data point of the measured SWC corresponding to the lowest suction
head was regarded as θs.
To generate a detailed PSD, a modified logistic growth model (Eq. (5)) was used to fit the measured PSD data. Here, the
detailed PSD was generated at diameter classes of 2, 5, 10, 15, 20, 30, 40, 50, 60, 70, 80, 90, 100, 200, 500, 1000 and 2000 20
μm. The values of α were obtained according to the sand contents of samples, the details of which are included in Table 2.
The values of β were obtained by substituting the SSA values predicted using Eq. (10) into Eq. (9). Then, the PoSD was
predicted using Eqs. (6)-(8). Finally, the SWC was estimated using the methods described in Sect. 3.3.
The SWC was also predicted using the traditional method presented in Sect. 2. In the traditional method, the predicted PoSD
was equivalent to the PSD in Eq. (1) and was substituted into Eq. (3) to obtain the water content. The corresponding suction 25
heads were predicted using Eqs. (2) and (4).
The van Genuchten equation (Eq. (12)) was used to fit the SWC data calculated via the traditional method and the improved
method (Genuchten, 1980):
Hydrol. Earth Syst. Sci. Discuss., https://doi.org/10.5194/hess-2017-668Manuscript under review for journal Hydrol. Earth Syst. Sci.Discussion started: 5 December 2017c© Author(s) 2017. CC BY 4.0 License.
8
m
n
rs
r
a
1
1 (12)
where θ is the water content (cm3 cm
-3), θr is the residual water content (cm
3 cm
-3), and a, n, m, and θr are fitting parameters.
The 22 samples exhibited good fits with an average r2 value of greater than 0.999.
For each set of predictions, the agreement between the predicted water content θp and the measured moisture content θm was
expressed in terms of the root mean square error (ERMS), which is given by 5
N
i
mpRMSN
E1
21 (13)
where N is the number of measured data points.
4.2 Results
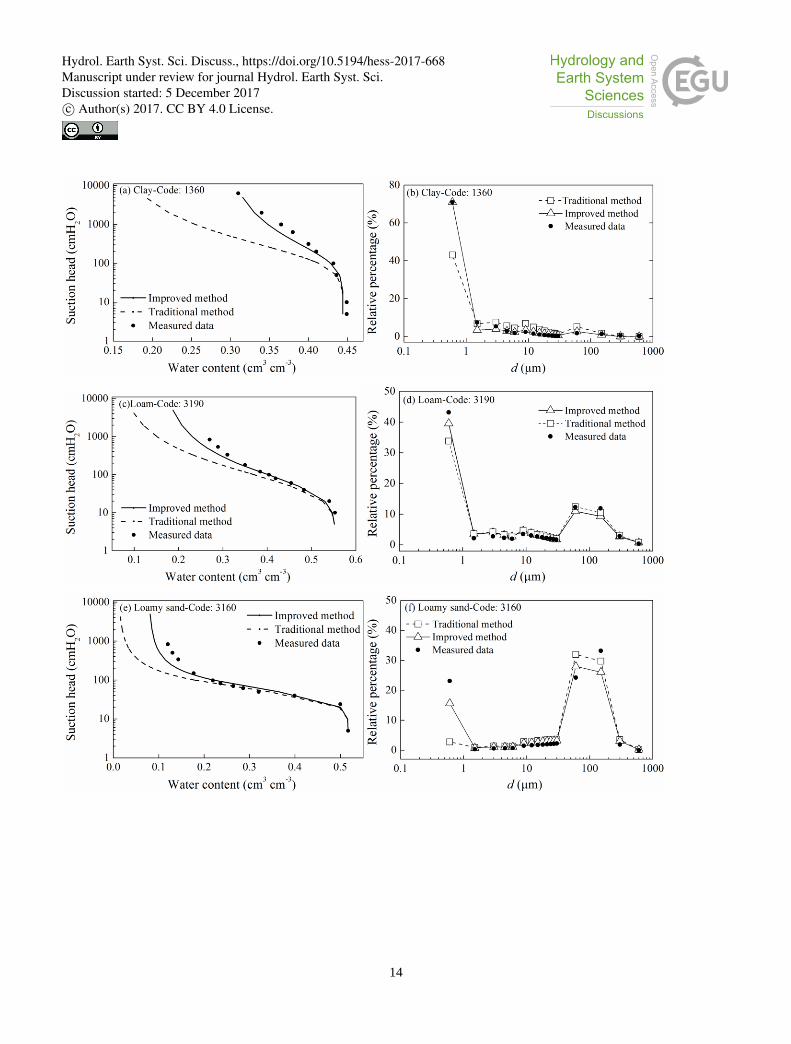
The predicted and measured SWCs in Fig. 6 show that the improved method exhibited good fits with the measured data in
the entire range of the SWC; moreover, the proposed method is clearly better than the traditional method, especially at the 10
dry range (the other 18 samples are listed in Fig.S3 in the supporting information). The ERMS values range from 0.017 to
0.054 for the improved method (with an average of 0.027) and from 0.040 to 0.106 for the traditional method (with an
average of 0.057), thereby demonstrating that the improved method performed better than the traditional method (Table 4).
The accuracy of an SWC predicted using the improved method depends on the accuracy of the corresponding predicted pore
volume fraction. The calculated and measured pore volume fraction curves in Fig. 6 indicate that the predicted pore volume 15
fraction curves using the improved method are more similar to the measured data than those predicted using the traditional
method, thereby showing that the proposed method performed better. The errors in the predicted pore fraction using the
traditional method mainly occur at the minimum pore size (d≤0.6 μm), while the proposed method greatly improves the
volume fraction at the minimum pore size and consequently improves the water content in the high suction range. These
improvements are mainly attributed to the pore model containing slit-shaped spaces, demonstrating that this pore model is 20
better for predicting the SWC from the PSD than the concept of a bundle of cylindrical tubes.
4.3 Discussions
4.3.1 The effects of estimated SSA values
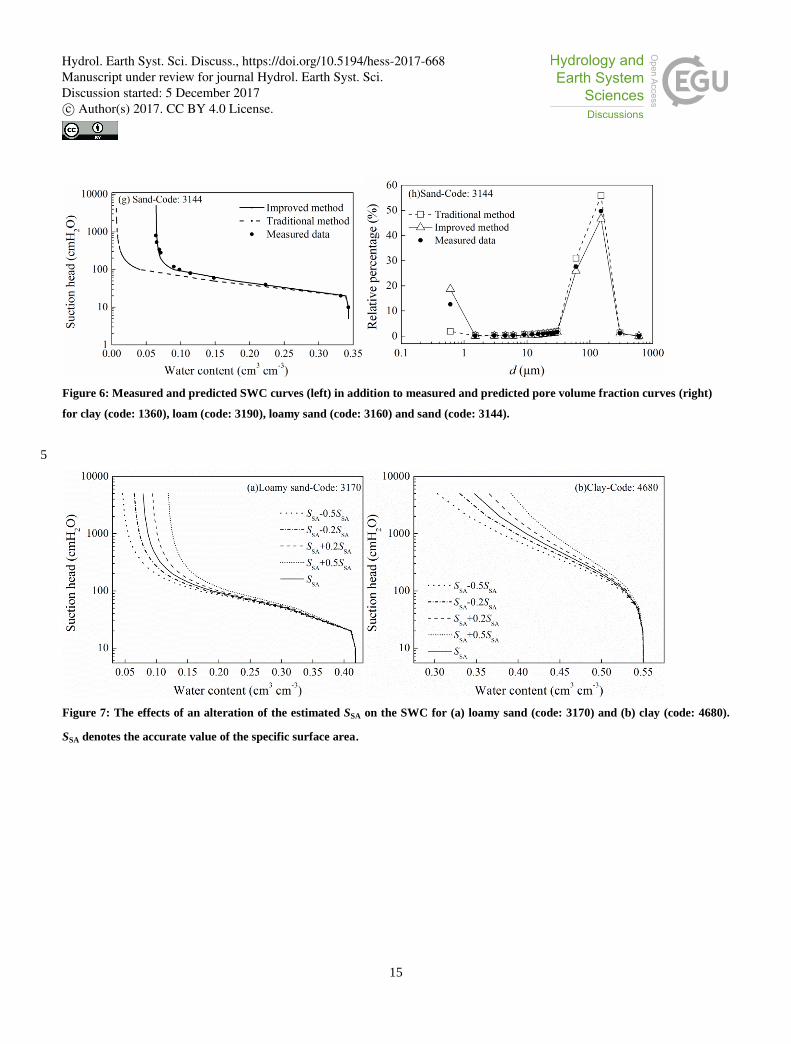
The SSA values estimated using Eq. (10) could affect the accuracy of the predicted SWC. Fig. 7 shows that an overestimation
of the SSA would prompt the dry range of the SWC curve to move in the direction of a larger water content, and vice versa. 25
When the estimated error in the SSA was ±20% of its accurate value, a relatively small error appeared between the calculated
and measured SWCs. When the estimated SSA value was altered by 10% and -10% of its accurate value for the loamy sand
(code: 3170), the water contents with respect to the highest suction head were higher and lower, respectively, by
Hydrol. Earth Syst. Sci. Discuss., https://doi.org/10.5194/hess-2017-668Manuscript under review for journal Hydrol. Earth Syst. Sci.Discussion started: 5 December 2017c© Author(s) 2017. CC BY 4.0 License.
9
approximately 0.007 cm3 cm
-3 than those of the original SWC. For the clay (code: 4680), the water contents were higher and
lower by approximately 0.009 cm3
cm-3
at the same 10% and -10% alterations, respectively. Consequently, for the coarse-
textured soil, the water content and prediction error of the SWC changed relatively little for the same degree of change of the
SSA.
Previous work showed that the SSA of soil is closely dependent upon the soil texture and that it could be estimated from the 5
soil media data and PSD (Sepaskhah and Tafteh, 2013;Resurreccion et al., 2015). The method used to estimate the SSA in
Sect. 3.2 was presented by Sepaskhah et al. (2010), who estimated the SSA based on the geometric mean particle size
diameter as shown in Eq. (10) with an r2 value of 0.88. Moreover, the appropriateness of this equation was validated using
64 soil samples by Fooladmand (2011). Therefore, this equation is capable of estimating the SSA, but more effort should be
directed toward developing a more accurate transformation from soil physical properties to SSA to improve the prediction of 10
the SWC.
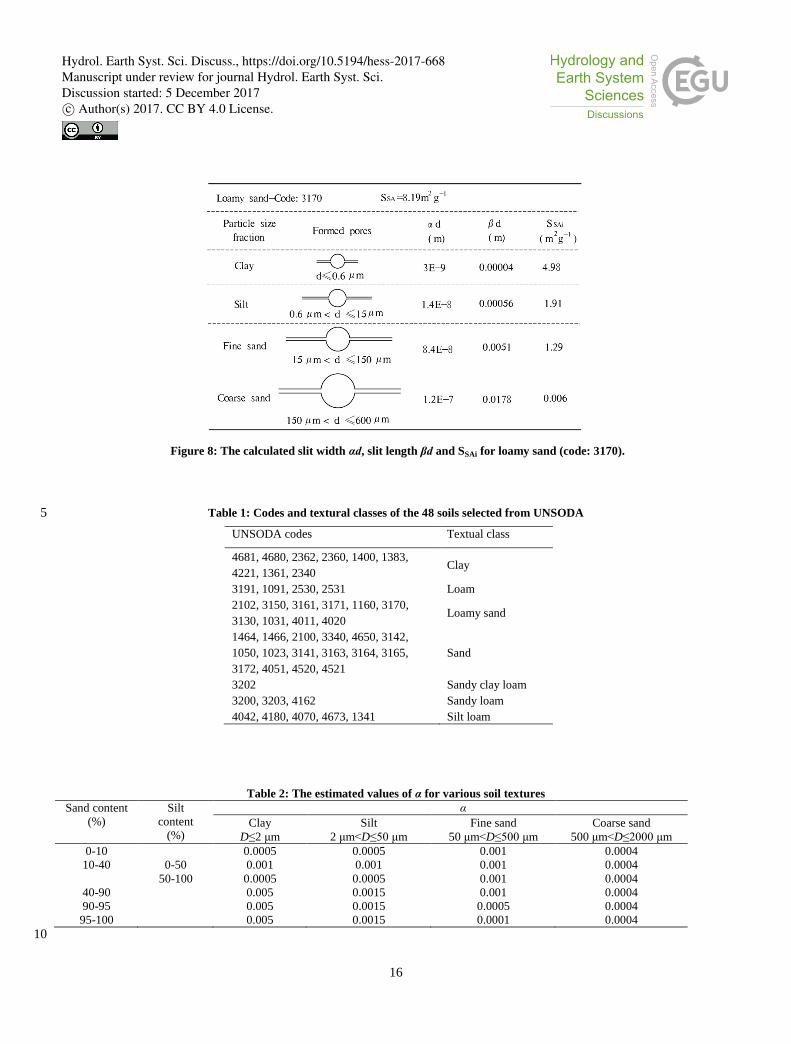
4.3.2 Physical meanings of the parameters
Since the central pore diameter d is proportional to the corresponding particle diameter D, the slit width αd, slit length βd and
specific surface area SSAi of each unit cell are associated with the particle size. The calculated values of αd, βd and SSAi of
clay, silt, fine sand and coarse sand particles for the loamy sand (code: 3170) are listed in Fig. 8. The results confirm that 15
pores formed by bigger soil particles are large with a correspondingly large slit width αd; this is similar to the results in Or
and Tuller (1999), and the values are of the same order of magnitude. It is common knowledge that larger soil particles tend
to have large surface areas, and therefore, the slit length formed by the contact of soil particle edges should be relatively long,
leading to the positive relationship between the slit length βd and the particle diameter as shown in Fig. 8. This result is
different from that in Or and Tuller (1999), where the slit length βd was inversely proportional to the particle diameter. In 20
addition, the SSAi of the ith particle fractions decrease with an increase in the particle diameter, which is consistent with the
findings of Or and Tuller (1999) and is in accordance with the general understanding of the SSA.
5 Conclusions
The traditional models employed to translate the PSD into the SWC underestimate the water content in the dry range of the
SWC. The errors originating from an underestimation of the pore volume fraction of the minimum pore diameter range in 25
traditional methods are the result of setting the cumulative PoSD equal to the corresponding PSD. The pore volume fraction
of the minimum pore diameter range will be accordingly increased if the slit-shaped pore spaces are taken into consideration
when estimating PoSD with a pore model comprising a circle-shaped central pore connected to slit-shaped spaces; therefore,
the SWC can be more accurately predicted from the PSD. The estimation of the α and β parameters is a key step for
predicting the SWC in the proposed method. The α values were obtained using 48 measured soil samples, and those values 30
served as input parameters while predicting the SWC; then, the β values were readily calculated using a constraint on the SSA.
Hydrol. Earth Syst. Sci. Discuss., https://doi.org/10.5194/hess-2017-668Manuscript under review for journal Hydrol. Earth Syst. Sci.Discussion started: 5 December 2017c© Author(s) 2017. CC BY 4.0 License.
10
The results of the model validation illustrated that the SWCs predicted using the proposed method demonstrated a good fit
with the measured data and the proposed method performed better than the traditional method, especially in the dry range of
the SWC.
Competing interests. The authors declare that they have no conflicts of interest. 5
Acknowledgments and data
The research was funded by the Special Fund for Basic Scientific Research of Central Colleges, Chang’an University
(310829162015). The authors thank Kang Qian for providing the UNSODA unsaturated soil hydraulic property database.
10
References
Arya, L. M., and Paris, J. F.: A physicoempirical model to predict the soil moisture characteristic from particle-size distribution and bulk
density, Soil Science Society of America Journal, 45, 1023-1030, doi:10.2136/sssaj1981.03615995004500060004x, 1981.
Arya, L. M., Bowman, D. C., Thapa, B. B., and Cassel, D. K.: Scaling soil water characteristics of golf course and athletic field sands from
particle-size distribution, Soil Science Society of America Journal, 72, 25-32, doi:10.2136/sssaj2006.0232, 2008. 15 Derjaguin, B. V., and Churaev, N. V.: Polymolecular adsorption and capillary condensation in narrow slit pores, Progress in Surface
Science, 40, 173-191, doi: 10.1016/0079-6816(92)90045-J, 1992.
Fooladmand, H. R.: Estimating soil specific surface area using the summation of the number of spherical particles and geometric mean
particle-size diameter, African Journal of Agricultural Research, 6(7), 1758-1762, doi: 10.5897/AJAR11.199, 2011.
Genuchten, M. T. V.: A closed-form equation for predicting the hydraulic conductivity of unsaturated soils, Soil Science Society of 20 America Journal, 44, 892-898, doi:10.2136/sssaj1980.03615995004400050002x, 1980.
Hamamoto, S., Moldrup, P., Kawamoto, K., Jonge, L. W. D., Schjønning, P., and Komatsu, T.: Two-region extended archie's law model
for soil air permeability and gas diffusivity, Soil Science Society of America Journal, 75(3), 795-806, doi: 10.2136/sssaj2010.0207,
2011.
Haverkamp, R., Parlange, and J., Y.: Predicting the water-retention curve from particle-size distribution: 1. sandy soils without organic 25 matter1, Soil Science, 142, 325-339, 1986.
Helland, J. O., and Skjæveland, S. M.: Relationship between capillary pressure, saturation, and interfacial area from a model of mixed‐wet triangular tubes, Water Resources Research, 43, 398-408, doi: 10.1029/2006WR005698, 2007.
Hwang, S. I., & Powers, S. E.: Using particle-size distribution models to estimate soil hydraulic properties. Soil Science Society of
America Journal, 67(4), 1103-1112, doi:10.2136/sssaj2003.1103, 2003. 30 Hwang, S. I., and Choi, S. I.: Use of a lognormal distribution model for estimating soil water retention curves from particle-size
distribution data, Journal of Hydrology, 323, 325-334, doi: 10.1016/j.jhydrol.2005.09.005, 2006.
Jayakody, K. P. K., Shimaoka, T., Komiya, T., and Ehler, P.: Laboratory determination of water retention characteristics and pore size
distribution in simulated MSW landfill under settlement, International Journal of Environmental Research, 8, 79-84, 2014.
Jensen, D. K., Tuller, M., Jonge, L. W. D., Arthur, E., and Moldrup, P.: A new Two-Stage Approach to predicting the soil water 35 characteristic from saturation to oven-dryness, Journal of Hydrology, 521, 498-507, doi: 10.1016/j.jhydrol.2014.12.018, 2015.
Lebeau, M., and Konrad, J. M.: A new capillary and thin film flow model for predicting the hydraulic conductivity of unsaturated porous
media, Water Resources Research, 46, W12554, doi:10.1029/2010WR009092, 2010.
Liu, J. L., Xu, S. H., and Liu, H.: Investigation of different models to describe soil particle-size distribution data, Advances in Water
Science, doi: 10.3321/j.issn:1001-6791.2003.05.010, 2003. 40 Meskini-vishkaee, F., Mohammadi, M. H., and Vanclooster, M.: Predicting the soil moisture retention curve, from soil particle size
distribution and bulk density data using a packing density scaling factor, Hydrology & Earth System Sciences, 18, 4053-4063, doi:
10.5194/hess-18-4053-2014, 2014.
Mohammadi, M. H., and Vanclooster, M.: Predicting the soil moisture characteristic curve from particle size distribution with a simple
conceptual model, Vadose Zone Journal, 10(2), 594-602, doi:10.2136/vzj2010.0080, 2011. 45
Hydrol. Earth Syst. Sci. Discuss., https://doi.org/10.5194/hess-2017-668Manuscript under review for journal Hydrol. Earth Syst. Sci.Discussion started: 5 December 2017c© Author(s) 2017. CC BY 4.0 License.
11
Mohammadi, M. H., and Meskini-Vishkaee, F.: Predicting the film and lens water volume between soil particles using particle size
distribution data, Journal of Hydrology, 475, 403-414, doi:10.1016/j.jhydrol.2012.10.024, 2012.
Mohammadi, M. H., and Meskini-Vishkaee, F.: Predicting soil moisture characteristic curves from continuous particle-size distribution
data, Pedosphere, 23, 70-80, doi: 10.1016/S1002-0160(12)60081-2, 2013.
Nemes, A., Schaap, M. G., Leij, F. J., and Wösten, J. H. M.: Description of the unsaturated soil hydraulic database UNSODA version 2.0, 5 Journal of Hydrology, 251, 151-162, doi: 10.1016/S0022-1694(01)00465-6, 2001.
Or, D., and Tuller, M.: Liquid retention and interfacial area in variably saturated porous media: Upscaling from single‐pore to sample‐scale model, Water Resources Research, 35, 3591-3605, doi: 10.1029/1999WR900262, 1999.
Pollacco, J. A. P., Webb, T., Mcneill, S., Hu, W., Carrick, S., Hewitt, A., and Lilburne, L.: Saturated hydraulic conductivity model
computed from bimodal water retention curves for a range of New Zealand soils, Hydrology & Earth System Sciences, 21, 1-27, doi: 10 org/10.5194/hess-21-2725-2017, 2017.
Resurreccion, A. C., Moldrup, P., Tuller, M., Ferré, T. P. A., Kawamoto, K., Komatsu, T., and Jonge, L. W. D.: Relationship between
specific surface area and the dry end of the water retention curve for soils with varying clay and organic carbon contents, Water
Resources Research, 47, 240-250, doi: 10.1029/2010WR010229, 2015.
Sakaki, T., Komatsu, M., and Takahashi, M.: Rules-of-Thumb for predicting air-entry value of disturbed sands from particle size, Soil 15 Science Society of America Journal, 78, 454, doi:10.2136/sssaj2013.06.0237n, 2014.
Sepaskhah, A. R., Tabarzad, A., and Fooladmand, H. R.: Physical and empirical models for estimation of specific surface area of soils,
Archives of Agronomy & Soil Science, 56, 325-335, doi: 10.1080/03650340903099676, 2010.
Sepaskhah, A. R., and Tafteh, A.: Pedotransfer function for estimation of soil-specific surface area using soil fractal dimension of
improved particle-size distribution, Archives of Agronomy and Soil Science, 59, 1-11, doi: 10.1080/03650340.2011.602632, 2013. 20 Shahraeeni, E., and Or, D.: Pore-scale analysis of evaporation and condensation dynamics in porous media, Langmuir the Acs Journal of
Surfaces & Colloids, 26, 13924-13936, doi: 10.1021/la101596y, 2010.
Shirazi, M. A., and Boersma, L.: A unifying quantitative analysis of soil texture, Soil Science Society of America Journal, 48, 142-147, doi:
10.2136/sssaj1984.03615995004800010026x, 1984.
Tuller, M., Or, D., and Dudley, L. M.: Adsorption and capillary condensation in porous media: Liquid retention and interfacial 25 configurations in angular pores, Water Resources Research, 35, 1949–1964, doi: 10.1029/1999WR900098, 1999.
Tuller, M., and Or, D.: Hydraulic conductivity of variably saturated porous media: Film and corner flow in angular pore space, Water
Resources Research, 37, 1257-1276, doi: 10.1029/2000WR900328, 2001.
Tuller, M., and Or, D.: Water films and scaling of soil characteristic curves at low water contents, Water Resources Research, 41, 319-335,
doi: 10.1029/2005WR004142, 2005. 30 Zhuang, J., Jin, Y., and Miyazaki, T.: Estimating water retention characteristic from soil particle-size distribution using a non-similar
media concept, Soil Science, 166, 308-321, doi: 0038-075C/01/16605-308–321, 2001.
35
40
Hydrol. Earth Syst. Sci. Discuss., https://doi.org/10.5194/hess-2017-668Manuscript under review for journal Hydrol. Earth Syst. Sci.Discussion started: 5 December 2017c© Author(s) 2017. CC BY 4.0 License.
12
Figure 1: Measured vs. calculated pore volume fraction curves for (a) sand (code: 3172) and (b) clay (code: 2360). The measured
and calculated PoSDs are embedded in the tops of the figures.
5
Figure 2: Pore space geometry model containing two slit-shaped spaces (d denotes the diameter of the central pore, and αd and βd
denote the widths and lengths of the slit-shaped spaces, respectively).
Hydrol. Earth Syst. Sci. Discuss., https://doi.org/10.5194/hess-2017-668Manuscript under review for journal Hydrol. Earth Syst. Sci.Discussion started: 5 December 2017c© Author(s) 2017. CC BY 4.0 License.
13
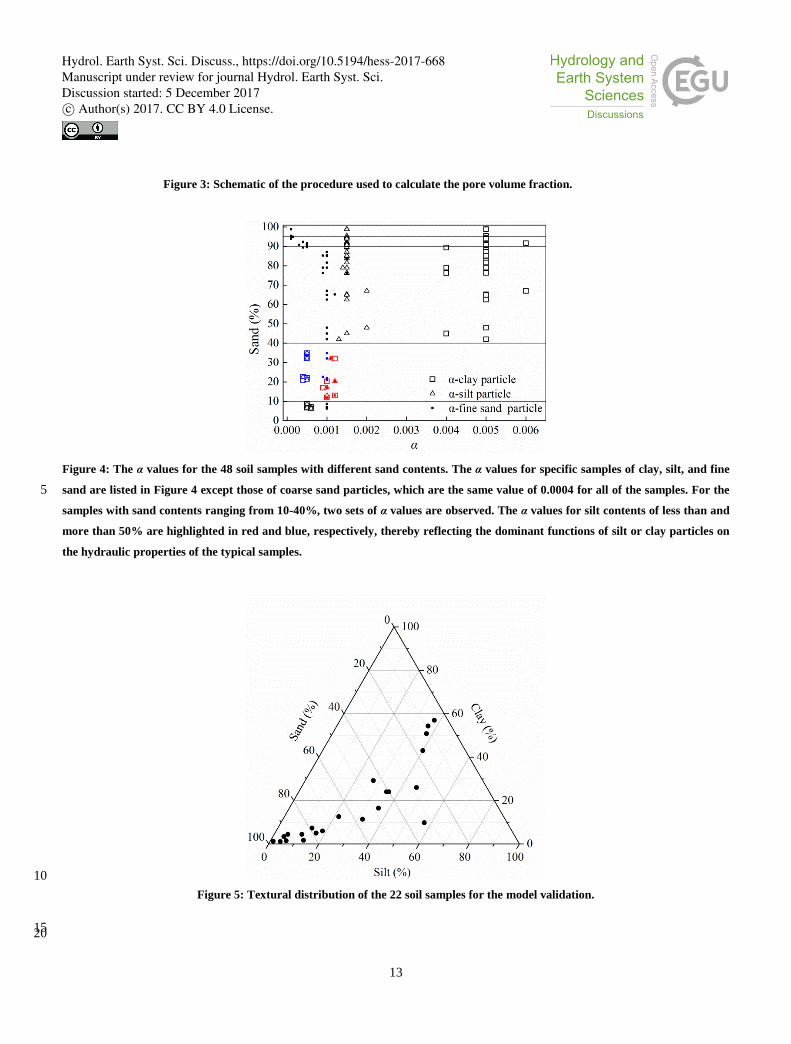
Figure 3: Schematic of the procedure used to calculate the pore volume fraction.
Figure 4: The α values for the 48 soil samples with different sand contents. The α values for specific samples of clay, silt, and fine
sand are listed in Figure 4 except those of coarse sand particles, which are the same value of 0.0004 for all of the samples. For the 5
samples with sand contents ranging from 10-40%, two sets of α values are observed. The α values for silt contents of less than and
more than 50% are highlighted in red and blue, respectively, thereby reflecting the dominant functions of silt or clay particles on
the hydraulic properties of the typical samples.
10
Figure 5: Textural distribution of the 22 soil samples for the model validation.
15
20
Hydrol. Earth Syst. Sci. Discuss., https://doi.org/10.5194/hess-2017-668Manuscript under review for journal Hydrol. Earth Syst. Sci.Discussion started: 5 December 2017c© Author(s) 2017. CC BY 4.0 License.
14
Hydrol. Earth Syst. Sci. Discuss., https://doi.org/10.5194/hess-2017-668Manuscript under review for journal Hydrol. Earth Syst. Sci.Discussion started: 5 December 2017c© Author(s) 2017. CC BY 4.0 License.
15
Figure 6: Measured and predicted SWC curves (left) in addition to measured and predicted pore volume fraction curves (right)
for clay (code: 1360), loam (code: 3190), loamy sand (code: 3160) and sand (code: 3144).
5
Figure 7: The effects of an alteration of the estimated SSA on the SWC for (a) loamy sand (code: 3170) and (b) clay (code: 4680).
SSA denotes the accurate value of the specific surface area.
Hydrol. Earth Syst. Sci. Discuss., https://doi.org/10.5194/hess-2017-668Manuscript under review for journal Hydrol. Earth Syst. Sci.Discussion started: 5 December 2017c© Author(s) 2017. CC BY 4.0 License.
16
Figure 8: The calculated slit width αd, slit length βd and SSAi for loamy sand (code: 3170).
Table 1: Codes and textural classes of the 48 soils selected from UNSODA 5
UNSODA codes Textual class
4681, 4680, 2362, 2360, 1400, 1383,
4221, 1361, 2340 Clay
3191, 1091, 2530, 2531 Loam
2102, 3150, 3161, 3171, 1160, 3170,
3130, 1031, 4011, 4020 Loamy sand
1464, 1466, 2100, 3340, 4650, 3142,
1050, 1023, 3141, 3163, 3164, 3165,
3172, 4051, 4520, 4521
Sand
3202 Sandy clay loam
3200, 3203, 4162 Sandy loam
4042, 4180, 4070, 4673, 1341 Silt loam
Table 2: The estimated values of α for various soil textures
Sand content
(%)
Silt
content
(%)
α
Clay
D≤2 μm
Silt
2 μm<D≤50 μm
Fine sand
50 μm<D≤500 μm
Coarse sand
500 μm<D≤2000 μm
0-10 0.0005 0.0005 0.001 0.0004
10-40 0-50 0.001 0.001 0.001 0.0004
50-100 0.0005 0.0005 0.001 0.0004
40-90 0.005 0.0015 0.001 0.0004
90-95 0.005 0.0015 0.0005 0.0004
95-100 0.005 0.0015 0.0001 0.0004
10
Hydrol. Earth Syst. Sci. Discuss., https://doi.org/10.5194/hess-2017-668Manuscript under review for journal Hydrol. Earth Syst. Sci.Discussion started: 5 December 2017c© Author(s) 2017. CC BY 4.0 License.

17
Table 3: Codes of the 22 soil samples selected from UNSODA for the model validation
UNSODA codes Textual class
1360, 4120, 2361, 3282 Clay
3190, 1370 Loam
3160, 3152, 1030, 1090, 4010 Loamy sand
3155, 3144, 1463, 3132, 4000 Sand
4620, 4621 Sandy clay loam
3290, 3310 Sandy loam
4531, 4510 Silt loam
Table 4: The root mean square errors (ERMS) of the SWC predicted using both the improved method and the traditional method 5
Soil
texture
Number
of soil
sample
ERMS
Improved method Traditional method
Clay 4 0.025 0.044
Loam 2 0.054 0.106
Loamy sand 5 0.020 0.048
Sand 5 0.017 0.042
Sandy clay loam 2 0.034 0.086
Sandy loam 2 0.046 0.068
Silt loam 2 0.024 0.040
Hydrol. Earth Syst. Sci. Discuss., https://doi.org/10.5194/hess-2017-668Manuscript under review for journal Hydrol. Earth Syst. Sci.Discussion started: 5 December 2017c© Author(s) 2017. CC BY 4.0 License.