pine creek: watershed assessment protection and restoration plan · 2012-11-17 · pine creek...
TRANSCRIPT

Pine Creek: Watershed Assessment
Protection and Restoration Plan
March 2005
Prepared by the Pennsylvania Environmental Council with the North Area Environmental Council
and the communities and residents of the Pine Creek Watershed
Funded by the Pennsylvania Department of Environmental Protection

Pine Creek Watershed Assessment, Protection and Restoration Plan March 2005
Executive Summary 1
Executive Summary This Watershed Assessment, Protection and Restoration Plan is a useful resource for Pine Creek communities because it
• describes the current condition of water quality, quantity, land use, vegetation, and other environmental characteristics and
• provides a preliminary protection and restoration plan that addresses impacts or threats from non-point source pollution. This plan provides communities, organizations, and individuals with tangible and attainable recommendations for achieving improved water quality.
It is important to note that although this report focuses on improving water quality in the Pine Creek watershed, many of the recommendations also will address the problem of water quantity in this basin. Individuals interested in learning more about the relationship between water quality and quantity are encouraged to read the entire Pine Creek Assessment, Protection and Restoration Plan or the accompanying report, Understanding Stormwater.
Background The Pine Creek Watershed in Allegheny County is a 67.3 square mile (43,072 acre) watershed that covers parts of 14 municipalities. Land uses within the watershed range from industry and residential uses to commercial districts and farmland. Pine Creek is a significant tributary to the lower Allegheny River. Drastic modifications to the landscape of the Pine Creek drainage, beginning with the early industrial, commercial, and residential development of the lower reaches, continue to spread as commercial and residential development expands northward. Combined pressures on the carrying capacity of the stream result in flooding, as witnessed repeatedly especially in the communities of Shaler Township and the Borough of Etna over the past 15 years. Despite these challenges, Pine Creek supports a variety of wildlife and is a recreational resource for anglers, an aesthetic treasure to many residents, and a major attraction in the county’s North Park. The idea for a watershed assessment for Pine Creek emerged from a series of meetings facilitated by the Pennsylvania Environmental Council1 (PEC), a statewide non-profit education and advocacy organization, in the summer of 2001. PEC, with funding from the Pennsylvania Department of Environmental Protection’s (DEP) Growing Greener Program, began a series of projects across Pennsylvania that encouraged communities to collaborate on a watershed basis. The Pine Creek watershed was chosen as one of the project areas because of its varied land uses and the rapid development of its headwaters. After a series of meetings with watershed stakeholders, PEC submitted a grant to DEP to conduct a watershed assessment of Pine Creek. DEP awarded a Growing Greener grant to the
1 www.pecpa.org or www.pecwest.org

Pine Creek Watershed Assessment, Protection and Restoration Plan March 2005
Executive Summary 2
organization in 2002.2 PEC’s partner in the effort was the North Area Environmental Council (NAEC), a local environmental organization with more than 30 years experience in the North Hills area of Allegheny County. The partners developed the following goals for the assessment:
• Conduct a preliminary evaluation of the water quality and aquatic condition of Pine Creek;
• Inventory land use and land policies within the 14 municipalities; • Correlate the data between land use and water quality where possible; • Develop a preliminary restoration/protection plan for the watershed; • Make recommendations on the best management practices for the watershed; and • Propose a long-term mechanism to monitor the health of the watershed.
The assessment was directed by a diverse Steering Committee that included representatives from environmental organizations, municipalities, and sportsmen’s groups. Following are summaries of the water quality study and land use analysis. The Protection and Restoration Plan is found on pages 7 - 10. The Steering Committee encourages the implementation of these goals where appropriate. Contact information for project partners and for all of the municipalities is on page 11.
2 The views expressed herein are those of the authors and do not necessarily reflect the views of the Department of Environmental Protection.

Pine Creek Watershed Assessment, Protection and Restoration Plan March 2005
Executive Summary 3
Site Numbers and Common Descriptions 1173 Etna outflow at the junction of Rt. 8 and Rt. 28 next to Hudak Auto Sales 1108 Bryant Rd. about 3/10 of a mile north of Duncan Ave. at old rail road trestle 1109 Duncan Ave. behind fire hall 1129 Off McElheny Rd. adjacent to soccer field 1150 Near the North Park ice skating rink. Near Kummer Rd. 1151 Wildwood Rd. near Best Feeds store 1153 Pine Creek behind laundromat in Etna. Near intersection of Grant Ave. and Dewey St. 1154 Pine Creek by tennis courts in Devlin Park, Grubbs Rd., beside Municipal Bldg. 1155 Montour Run 25 yards upstream from bridge at intersection of Wildwood Rd. and Hardt Rd. 1172 East Branch of Little Pine Creek along Saxonburg Blvd. at Five Acres Dr. 1073 Opposite Glenshaw Valley Presbyterian Church, Butler Plank Rd. 1182 Off Wexford Run Road, south of the Grey Oaks development 1183 Near corner of intersection of Pine Creek Road and Brandt School Rd. (Private Property) 1190 Behind Etna ball field where West Little Pine enters Pine 1191 Downstream from bridge crossing Wickline Rd., near Depreciation Land Museum 1212 Bottom of Saxonburg Blvd. behind the law offices
Pine Creek Watershed Assessment, Protection and Restoration Plan March 2005
Executive Summary 4
Water Quality Water quality data was collected by volunteers from the Pennsylvania Senior Environmental Corps (PaSEC), an arm of the Environmental Alliance for Senior Involvement (EASI), a national non-profit organization. Volunteers were trained on various aspects of chemical and biological monitoring by DEP-certified trainers and divided into sampling teams. Sampling sites were selected at 16 stations throughout the watershed. Teams were responsible for two different sites. Chemical and physical sampling was done once per month and biological sampling was done twice per year. The physical and chemical parameters that were measured were: water temperature, pH, dissolved oxygen, conductivity, phosphate, sulfate, alkalinity, nitrate, and stream flow. Water monitoring data that was collected from February 2002 through August 2004 from the 16 sites in the Pine Creek Watershed was reviewed and compared with standard criteria for physical, chemical, and biological parameters. These criteria were obtained from the EPA, the Pennsylvania Code, the PaSEC Water Quality Training Manual, and the PA Lake Management Society. When the data did not meet the criteria (by being above or below the recommended levels), it indicated that the water quality was potentially compromised at this site and might affect the stream’s ability to provide quality habitat to support plant and animal life. Collective Efforts, LLC conducted the data analysis. Their findings are summarized below.
Temperature – Rates of biological and chemical processes depend upon temperature. The seasonal mean water temperature exceeded the recommended criteria at seven sites. All of these high readings were in the summer months (June, July, and August). There is no discernable geographic pattern of water temperature in the watershed however.
Dissolved Oxygen - Certain levels of dissolved oxygen are necessary to support aquatic
life. All of the stream samples in the Pine Creek Watershed had dissolved oxygen levels meeting the criteria for its designated use.
pH – Levels outside of the recommended range for pH can stress the physiological
systems of most organisms. Only four sites met the recommended criteria. Ten sites had high (alkaline) maximum or seasonal mean readings and two sites had low (acid) minimum or seasonal average readings.
Alkalinity – All alkalinity data met the criteria, indicating a good buffering capacity in
the streams in the Pine Creek Watershed.
Sulfate – Sulfates can decrease the levels of pH, thus making the water intolerable for certain species. The monitoring data consistently exceeded the sulfate criteria throughout the watershed.
Phosphate – In limited amounts, phosphates are essential nutrients. In excess, they can
cause an undesirable chain of events in a stream. While phosphate data was completed for only 14 sites and was done intermittently for some sites, phosphate levels consistently exceeded the criteria at almost all tested sites.

Pine Creek Watershed Assessment, Protection and Restoration Plan March 2005
Executive Summary 5
Conductivity – This measure of the ability of water to pass an electrical current is used as a general measure of stream water quality. Conductivity consistently exceeded the criteria at almost all the monitoring sites. Only two sites had total averages falling within prescribed ranges, with one of those still seeing seasonal exceedances.
Nitrates – Like phosphates, nitrates are essential nutrients in limited amounts, and can
cause damage to a stream system if in excess. Due to difficulties with interpreting and reporting nitrate monitoring results, the nitrate test results were not included in the final assessment for this study.
Stream Flow Volume - No criteria were found for stream flow volume.
Water Quality Score – Benthic macroinvertebrates (stream bottom insects) were surveyed to develop water quality scores. Surveys were conducted on 10 of the 16 monitoring sites. One site received a “good” score for water quality, one site received a “poor” score, and the other eight sites received a “fair” score.
Based on a comparison of the water monitoring data with the criteria selected by Collective Efforts for this initial analysis, it appears that temperature, dissolved oxygen, and alkalinity water quality results are within acceptable criteria ranges for the stream’s designated uses at the sites monitored in the Pine Creek Watershed. Additional water quality studies are recommended for pH, conductivity, phosphate, and sulfate because those chemical parameters exceeded recommended ranges. Additional studies should include a review of the local geology to determine the relative influence of the region’s soils and rocks on the conductivity and sulfate, versus the impact of human activities and land use. Nitrate levels should be determined for the streams in the watershed. Finally, a comparison of water monitoring data for selected sites both before and during wet weather events would also be of interest, potentially including sampling for E. coli, a pathogen found in sewage. Benthic macroinvertebrate studies by an expert would also be of interest, particularly for those sites reporting “poor” or “good” water quality scores.
Land Use The Pine Creek watershed spans multiple local jurisdictions with varied policies. Thirteen of the 14 municipalities in the watershed completed a land use survey that inventoried the land use practices and policies. Noteworthy results from the inventory responses appear below: Waterbodies are protected by all communities to some degree, with required buffers of 50 ft. or 80 ft. for watercourses and, in most cases, up to 100 ft. for ponds and wetlands. Some Pine Creek communities follow the Allegheny County Handbook3 model ordinance and prohibit any new construction in the 100 year floodplain; some allow construction with flood proofing; one or two allow filling and/or open storage. Most of the municipalities do include protection from
3 Improving Local Development Regulations: A Handbook for Municipal Officials (Allegheny County Handbook), prepared by the Allegheny County Department of Planning in May 1993. Although the publication was produced more than a decade ago, the first chapter contains model environmental protection and hazard control regulations that are still valid today.
Pine Creek Watershed Assessment, Protection and Restoration Plan March 2005
Executive Summary 6
piping and/or filling for even the smallest of watercourses and drainages. Recent studies have shown the major importance of headwater streams in controlling both water quality and quantity; therefore ordinances should protect these small watercourses as well as the larger streams. These headwater streams also need to have a minimum natural buffer required, or at least have protection for their natural banks. All riparian buffers should be replanted if bare or disturbed. It is important to downstream communities that the floodplain be kept clear of obstructions so that floodwaters can spread out, slow down, and infiltrate the soil. Debris that is carried to downstream culverts and bridges can cause blockages, or dams, resulting in massive flooding. The advantages of trees to a community cannot be overemphasized, and all of the municipalities have tree protection somewhere in their ordinances. Some protect trees in every development, a few protect trees only in Planned Residential Developments (PRDs). Some type of landscaping is required in most of the communities. The landscaping will add trees to provide shade and beauty to neighborhoods and commercial areas. Most of the parking lot requirements specify enough square feet in the planting islands for the trees to thrive and grow. Some use a 10 ft. wide minimum in the island design to allow for this. If uncurbed, these islands also allow rainwater to stay on site and be taken up by the trees, rather than ending up in the storm drains. Some municipalities seem to be relying on their tree and woodland protection regulations, which do allow some tree removal, to comply with the relatively new state requirement for a logging ordinance. All communities prohibit clear cutting, and cutting on steep slopes or landslide-prone slopes. However no municipality seems to require any buffer for a watercourse in their Logging sections. All of the municipalities have regulations for protecting steep slopes, particularly for the landslide-prone slopes that occur throughout much of this area. Most of these slopes abut a stream valley or watercourse, and keeping the slopes vegetated is crucial to preventing land slides, erosion, stream siltation, and costly damages in the future. The main difference between the local ordinances is in whether they consider “very steep” slopes to be 25% or 40%. It is both desirable and recommended that “slope averaging” only be allowed under certain conditions and percentages of disturbance of the total site. Open, undeveloped spaces are important for natural amenities, groundwater recharge areas, tree protection, wildlife habitat, and passive recreation. Most of the municipalities have provisions for these, at least in their PRD ordinances for open space, and as a requirement between zoning uses for bufferyards. Some require 50% of the open space to be suitable for active recreation. Some municipalities do not have their environmentally critical lands or their open space and/or recreation lands on their GIS (Geographical Information System), and a few communities do not have GIS available. GIS can be a very effective tool in the planning and regulatory process. Having environmentally important lands delineated and mapped and having the maps available at all board or council meetings when land development plans are to be discussed is very important in the decision making process. PA Act 167 and past stormwater ordinances have dealt only with reducing the rate of runoff, but not with the total amount of water released or the water quality. The new focus of regulations is

Pine Creek Watershed Assessment, Protection and Restoration Plan March 2005
Executive Summary 7
to reduce the amount of runoff, as well as its inherent pollution. Developers may utilize terraces, run-off spreaders, diversions, and grass or rock-lined swales and waterways, along with infiltration devices such as seepage or recharge basins and pits, seepage beds or ditches, Dutch drains, and pervious surfaces. Furthermore, municipalities can minimize the amount of land disturbed by promoting such things as cluster homes (or Conservation Subdivisions) and redeveloping older, already-developed sites. All of the municipalities use the Allegheny County Conservation District regulations for erosion and sediment controls. Only four municipalities have Environmental Advisory Councils (EACs). To help municipalities address environmental issues, such as land use, the Pennsylvania General Assembly in 1973 passed Act 148, which authorizes municipalities to establish Environmental Advisory Councils (EACs). An EAC can provide valuable guidance to a municipality’s council, commissions, or boards on matters regarding environmental ordinances in general and as they apply to specific development projects. EACs can also provide support in monitoring compliance, community outreach, and project support to enhance the natural resources of a community.
Watershed Protection and Restoration Plan The ultimate goal of a watershed assessment is to develop a protection and restoration plan that addresses impacts or threats from non-point source pollution. The recommended goals for the Pine Creek watershed appear in the following pages. The Steering Committee encourages the implementation of these goals where appropriate. The lists of potential partners and funding sources are based on past involvement of these organizations and agencies and should not be considered to be an exhaustive list. Their listing by no means requires them to implement the recommendations; they are listed as groups that would have the resources or the knowledge to undertake such a task. The Pine Creek Watershed Assessment provided an overview of water quality in the basin and developed a set of criteria for evaluating stream health. While several of the chemical and biological indicators pointed towards fair or acceptable water quality, more testing is needed to accurately assess the health of the waterway and to determine the sources of contamination. Based upon the information at hand, the Committee was able to develop a list of recommended goals for the watershed. Since these recommendations are strictly voluntary, it is important that a focused group of individuals work towards their implementation. The formation of a watershed association, or equivalent organization, would be the most effective way to continue this work, both in terms of managing projects and raising the necessary funds. Continued municipal participation is essential in completing the recommendations, and the formation of an organization should not prohibit this. Further, a watershed association will allow increased participation of the community in project implementation. The formation of a watershed association would take time. In the interim, it is recommended that the Pine Creek Watershed Steering Committee continue to meet and act as an advisory board for several of the recommendations.

Pine Creek Watershed Assessment, Protection and Restoration Plan March 2005
Executive Summary 8
Recommended Goals for the Pine Creek Watershed Recommendation Potential
Partners and Responsible Parties
Potential Funding Sources
Timeline (Project Initiation)
Cost Estimate
Governmental: Have environmentally important lands delineated and mapped and available at all municipal meetings when land use development plans are to be discussed.
Municipalities, Steering Committee
2005 <$10,000
Review existing ordinances for potential modifications regarding water quality. (See Chapter 5)
• Adopt a policy that discourages new fills or construction in the 100 year floodplain or in the floodway.
• Adopt policies protecting the natural banks and riparian buffers of all streams, including first order streams, particularly in logging ordinance.
• Adopt a policy that uses ‘slope averaging’ for development only under certain conditions and percentages of disturbance of the total site.
• Remove ‘No Harm’ analysis provision from ordinances unless immediately adjacent to the river.
• Develop a multi-municipal strategy for removing downed trees and/or potential obstructions and debris from streams.
• Adopt policies that promote cluster housing and redevelopment of developed areas, except for floodplains.
Municipalities, Steering Committee
2005 $1,500-$3,000 per party, per modification

Pine Creek Watershed Assessment, Protection and Restoration Plan March 2005
Executive Summary 9
Recommendation Potential Partners and Responsible Parties
Potential Funding Sources
Timeline (Project Initiation)
Cost Estimate
Participate in the development of the Allegheny County Comprehensive Plan’s model ordinances.
NAEC, Municipalities
NA 2005 <$10,000 each party
Participate in the Route 8 Corridor implementation to ensure protection of environmentally sensitive areas.
NAEC, Municipalities
NA 2005 < $10,000 each party
Offer technical assistance to Environmental Advisory Councils and all municipalities concerning Best Management Practices.
PEC, NAEC
DEP 2005 $10,000
Offer technical educational programs to municipal officials (e.g. stormwater workshops).
PEC DEP, private foundations
2005 $10,000
Monitoring: Expand / enhance the Quality Assurance and Quality Controls of volunteer monitoring.
EASI, DEP, Western PA Conservancy (WPC)
DEP 2005 <$5,000
Investigate new methods for measuring nitrates.
EASI, WPC 2005 <$500
Investigate sources of high conductivity and phosphate values.
EASI, DEP 2005 $10,000
Provide additional guidance and training to volunteers.
EASI, WPC 2005 $5,000
Develop a ready reference of monitoring criteria for monitoring groups.
DEP, WPC 2005 $1000
Studies / Tools: Develop DCNR River Conservation Plan.
NAEC DCNR, in- kind, Western PA Watershed Program
2005 $200,000
Develop Fluvial Geomorphology Study for Pine Creek and/or tributaries.
Steering Committee
Federal, state grants
2006 $250,000
Study the economic impact of natural stream channel design.
Steering Committee, Consultant
2006 $10,000
Create a watershed- wide green space map.
Municipalities, Consultant
2006 $10,000
Update the floodplain map to include smaller drainages and to reflect current flood cycles.
FEMA, USGS 2006 TBD

Pine Creek Watershed Assessment, Protection and Restoration Plan March 2005
Executive Summary 10
Recommendation Potential Partners and Responsible Parties
Potential Funding Sources
Timeline (Project Initiation)
Cost Estimate
Conduct a build-out analysis of watershed with projected calculations of impervious cover.
Municipalities, Steering Committee
DEP 2006 $15,000
Develop regional strategy for flood control.
Steering Committee, NAEC
Federal, state, private grants
2005 $250,000
Projects: Develop database of riparian buffer landowners.
Steering Committee, NAEC
2006 $5,000
Assess riparian buffers. Steering Committee, Volunteers
DEP 2005 $10,000
Target areas for buffer restoration. Steering Committee
NA 2005 $5,000-$20,000
Restore floodplains as possible. Municipalities 2005 $1,000,000 Outreach: Host presentations to municipalities and public about watershed assessment.
Steering Committee
DEP, in-kind
Spring 2005
$1,500
Host presentations to municipalities and public about watershed history and riparian buffers (WREN grant).
Outreach Committee
WREN Summer 2005
$5,000
Develop and distribute a new list of Watershed Walks.
Outreach Committee, NAEC
in-kind Summer 2005
$500
Create and distribute a watershed driving tour.
Outreach Committee, NAEC
in-kind, WREN
2006
$1,000
Create and distribute a newsletter for volunteers.
EASI, NAEC, WPC
2005 $1,000
Foster an adopt-a-stream program as part of an ongoing clean-up effort.
NAEC, Sportsmen’s Groups
DEP, local businesses, municipal-ities
2005 $15,000
Organizational:
Develop a watershed association, or equivalent organization, for Pine Creek.
NAEC, PEC, Sportsmen’s groups, Municipalities
DEP, Western PA Watershed Program
2006 TBD
Mentor watershed activities in Girty’s Run.
Steering Committee
NA 2005 TBD

Pine Creek Watershed Assessment, Protection and Restoration Plan March 2005
Executive Summary 11
North Area Environmental Council P.O. Box 71 Ingomar, PA 15127 (412) 364-7006
The entire Pine Creek Watershed Assessment, Protection andRestoration Plan is available in each municipal office and at www.pecwest.org.
Bradford Woods Borough www.bradfordwoodspa.org 4908 Wexford Run Road Bradford Woods, PA 15015 (724) 935-2990 Etna Borough www.etnaborough.org 437 Butler St. Pittsburgh, PA 15223 (412) 781-0569 Fox Chapel Borough www.fox-chapel.pa.us 401 Fox Chapel Road Pittsburgh, PA 15238 (412) 963-1100 Franklin Park www.borough.franklin-park.pa.us 2344 West Ingomar Road Pittsburgh, PA 15237 (412) 364-4115 Hampton Township www.hampton-pa.org 3101 McCulley Road Allison Park, PA 15101 (412) 486-0400
Indiana Township www.indianatownship.com 941 Route 910 Indianola, PA 15051 (412) 767-5333 McCandless, Town of 9955 Grubbs Road Wexford, PA 15090 (412) 364-0616 Marshall Township www.twp.marshall.pa.us Box 2094 Warrendale, PA 15086 (724) 935-3090 O’Hara Township www.ohara.pa.us 325 Fox Chapel Road Pittsburgh, PA 15238 (412) 782-1400 Pine Township www.twp.pine.pa.us 230 Pearce Mill Road Wexford, PA 15090-8511 724-625-1591
Richland Township http://richland.pa.us 4011 Dickey Road Gibsonia, PA 15044 (724) 443-5921 Ross Township www.ross.pa.us 1000 Ross Municipal Drive Pittsburgh, PA 15237 (412) 931-7055 Shaler Township www.shaler.org 300 Wetzel Road Glenshaw, PA 15116 (412) 486-9700 Sharpsburg Borough 1611 Main St. Pittsburgh, PA 15215-2609 (412) 781-0546 Allison Park Sportsmen’s Club Trout Unlimited, Penns Woods West Chapter www.pwwtu.org
Pennsylvania Environmental Council 22 Terminal Way Pittsburgh, PA 15219 (412) 481 – 9400 [email protected]

Chapter One
Project Background

Pine Creek Watershed Assessment, Protection and Restoration Plan March 2005
Chapter 1: Project Background 12
A. Purpose of a Watershed Assessment A watershed assessment is a useful resource as it describes the current condition of water quality, quantity, land use, vegetation, and other environmental characteristics in a watershed. Typically, it involves researching existing information and gathering new data. According to the Pennsylvania Department of Environmental Protection (DEP), the purpose of the assessment is to use that information to develop a restoration or protection plan that addresses impacts or threats from non-point source pollution. The plan provides communities, organizations, and individuals with tangible and attainable recommendations for achieving improved water quality. A watershed is an area of land that drains into a body of water, such as a stream, river, lake, or pond. It is a natural unit on the landscape that is defined by topography and based upon the principle that water flows from high points in the landscape to the lowest point. Watersheds often cross geographic boundaries – boundaries between local governments, states, or even nations. Herein lies the problem of managing our water resources: each governmental unit typically manages its section of the watershed independently from its neighbor. This fragmented approach to land use may lead to serious consequences in both water quality and quantity in our rivers and streams. B. Project Background The idea for a watershed assessment for Pine Creek, Allegheny County, Pennsylvania, emerged from a series of meetings facilitated by the Pennsylvania Environmental Council1 (PEC) in the summer of 2001. PEC, with funding from the DEP’s Growing Greener Program, began a series of projects across Pennsylvania that encouraged communities to collaborate on a watershed basis. The Pine Creek watershed in northern Allegheny County was chosen as one of the project areas because of its varied land uses and the rapid development of its headwaters. The facilitated meetings included representatives from local government (elected, appointed, and staff members), environmental organizations, sportsmen’s groups, and businesses. The group concluded that there was a love of the creek by local residents, a desire to improve its condition, and a wish to learn from and collaborate with each other. The first step in this collaborative effort was to better understand the resource: Pine Creek. In 2002, DEP awarded a Growing Greener Grant to PEC to conduct a watershed assessment of Pine Creek. PEC’s partner in the effort was the North Area Environmental Council (NAEC), a local environmental organization with more than 30 years experience in the North Hills area of Allegheny County. The partners developed the following goals for the assessment:
• Conduct a preliminary evaluation of the water quality and aquatic condition of Pine Creek;
1 www.pecpa.org or www.pecwest.org

Pine Creek Watershed Assessment, Protection and Restoration Plan March 2005
Chapter 1: Project Background 13
• Inventory land use and land policies within the 14 municipalities; • Correlate the data between land use and water quality where possible; • Develop a preliminary restoration/protection plan for the watershed; • Make recommendations on the best management practices for the watershed; and • Propose a long-term mechanism to monitor the health of the watershed.
The assessment was directed by a diverse Steering Committee. Each municipality and sportsmen’s group was invited to send a representative to the committee. Table 1-1 lists committee members.
Table 1-1: Steering Committee Members Organization Representative, Title*
Allison Park Sportsmen’s Club
Dan Wagner, President
Bradford Woods Ann Jenkins Etna Borough Dave Vinski, Councilman Franklin Park Becky Crellin, Environmental Advisory Council (EAC)
Member (2002-2003) Hampton Township
Marty Orban, Land Manager (2003-present) Ken Grove, Water Pollution Control Plant (2002)
Indiana Township
Jeffrey Curti, Code Enforcement Officer George Dull, Councilman
McCandless Township Harry Lyon, Councilman Marshall Township Bill Moul ** NAEC Sue Broughton (2002-2004), Board Member
Marian Crossman, Board Member Mary Wilson, Board Member
O’Hara Township Robert Robinson, P.E., Township Engineer PEC Janette Novak, Project Director Pine Township Scot Fodi, Code Enforcement Officer (2002-2004)
Richland Township Joyce Chalfant Ross Township Art Gazdik, P.E., Township Engineer Shaler Township
Kevin Creagh, P.E., Township Engineer Tom Montgomery, Planning Commission
Trout Unlimited Tom Walsh (2004-2005) * Unless otherwise noted, representatives served from 2002 – 2005 ** Committee Chair and NAEC President

Pine Creek Watershed Assessment, Protection and Restoration Plan March 2005
Chapter 1: Project Background 14
Additional resource persons and volunteers: Greg Holesh, Watershed Coordinator, PA DEP Rich Kowalski, Watershed Specialist, Allegheny County Conservation District Pat Hare, Hampton Township EAC Beth Dutton, Collective Efforts and NAEC Ken Soergel, Landscape Architect, K.P. Soergel Associates Matt Veltri, Trout Unlimited Diane Selvaggio, Duquesne University, Environmental Science and Management Program Joy Smallwood, Duquesne University, Environmental Science and Management Program Dave Larson, Duquesne University, Environmental Science and Management Program Mary Bates, GIS/Autocad Specialist Marilyn Crouch Kraitchman, Vintage Roger Loughrey, Certified Trainer, Vintage/PA Senior Environmental Corps Earl McCabe, Certified Trainer, Vintage/PA Senior Environmental Corps
Stream monitors:
Certified trainers Chemical
Marsha Albright Randy Minnich Tom Montgomery John Kearney (certification pending)
Biological Patty Himes (certification pending)
Team Leaders
Peggy Standish Pete Shiner Tom Montgomery Randy Minnich Lee Stauffer John Kearney Matt Yurkovich Kathy Chavara John Berckbickler
Team Members
Richard Margerum Robert Gebhardt Bill Unrath Bob Stiffler Joann Stiffler John Hess
Art Evans Bill Zanieski Linda Higbee Janice Meade Tom Byerly Bill Grubbs

Pine Creek Watershed Assessment, Protection and Restoration Plan March 2005
Chapter 1: Project Background 15
Dan Wagner Walt Gumbert Sam Bacco Vik Verma Bob Montgomery Ed Lavsa Dave Vinski Charlie Gray Mel Clouner
Joan Schoff Cliff Schoff Joyce Chalfant Nancy Kline Mary Bates Tom Bates Marsha Albright Peter TenEyck
Former Team Members Joy Smallwood Robert Silber
Bernadette MacDonald Ron Rosenberger
C. Funding This project was financed in part by a Growing Greener Grant provided by the Pennsylvania Department of Environmental Protection. The views expressed herein are those of the authors and do not necessarily reflect the views of the Department of Environmental Protection. Donated support and services for this project were provided by the volunteers and staff of the Pennsylvania Senior Environmental Corps, the staff of Collective Efforts, LLC, the members of the North Area Environmental Council, and the catering services of Mr. Bob Montgomery. Additional financial support was received from the Etna-Shaler Rotary, the International Angler, and the municipalities of McCandless, O’Hara, Ross, and Shaler. D. Outreach Efforts Although not a required component in watershed assessments, public outreach was considered to be an important factor in this project. Efforts undertaken by the outreach committee included:
• creating a series of ‘Watershed Walks’ that introduces the public to important natural areas in the watershed;
• organizing a stream signage program that identifies the main stem of Pine Creek and its major tributaries as part of the Pine Creek Watershed;
• hosting three programs from the Stroud Water Research Center designed to educate and inspire members of the general public, municipal officials, and teachers; and
• recognizing and publicizing the efforts of the volunteer water monitors. E. Assessment Format The assessment is organized as follows:
• Chapter 2: A Watershed Primer • Chapter 3: Study Area • Chapter 4: Water Quality • Chapter 5: Land Use

Pine Creek Watershed Assessment, Protection and Restoration Plan March 2005
Chapter 1: Project Background 16
• Chapter 6: Watershed Protection and Restoration Plan • Appendices
A. Understanding Stormwater B. Monthly Temperature and Precipitation Averages for Pittsburgh C. Landslide Prone Soils for Northern Allegheny County D. Watershed Walks E. Summary Table of Water Quality Criteria F. Land Use Inventory G. Land Use Inventory: Summary H. A Layman’s Guide to Best Management Practices for Non-point Source Pollution
in the Pine Creek Watershed
Chapter Two
A Watershed Primer

Pine Creek Watershed Assessment, Protection and Restoration Plan March 2005
Chapter 2: A Watershed Primer 17
A. The Water Cycle1 The movement of water through a watershed strongly depends upon the precipitation in the region and the conditions across the landscape. This relationship is best illustrated by reviewing the water cycle, Figure 2-1.
Figure 2-1: The Water Cycle
Precipitation is water that falls from the sky as rain or snow. The Pittsburgh area receives an average of 37 inches of precipitation per year. There are exceptions, however, such as the very wet years of 2003 and 2004 and the drought years of 2001 and 2002.
Table 2-1: Annual Precipitation for Pittsburgh Region
Year Total Precipitation (inches) Deviation from the Norm 2001 35.74 - 1.11 2002 32.33 - 5.52 2003 41.06 +3.21 2004 57.43 +19.58
Source: National Weather Service Preliminary Local Climate Data for Pittsburgh, www.erh.noaa.gov See Appendix B for monthly values.
1 See Appendix A, Understanding Stormwater, by Diane Selvaggio for more information.

Pine Creek Watershed Assessment, Protection and Restoration Plan March 2005
Chapter 2: A Watershed Primer 18
The amount, duration, and location of precipitation across the watershed strongly influence the movement of the water. While much of the precipitation evaporates directly back into the atmosphere, some of it either infiltrates the soil or runs over the earth’s surface as runoff. Infiltration refers to water flow from the land’s surface to the subsurface and possibly to the ground water below (see Figure 2-2). The amount and rate of infiltration depends upon vegetation, land cover, the texture and porosity of the soil, the steepness of the slopes, and the intensity and duration of a rainfall. Subsurface water is available for uptake by plants during a process called transpiration.
Figure 2-2: Infiltration Transpiration is a normal plant metabolic process that draws subsurface water up through roots, stems or trunks, and into leaves. Much of this water then evaporates from the leaves into the atmosphere (evapo-transpiration) where it cools the air as it becomes available for condensation and cloud formation. This amount is not insignificant. The average mature shade tree evaporates between 34 and 70 gallons of water each warm weather day. This capability to remove subsurface water is useful when planning for stormwater infiltration. An area planted with trees will be able to accommodate more stormwater volume than one without trees – efficiently putting the water back into the atmosphere. Groundwater fills the porous rock layers beneath the earth’s surface. The upper boundary of this zone is known as the water table. Water that moves downward through the soil past the water table (a process called percolation) can recharge the groundwater supply. The geology of an area determines the volume of the groundwater that is stored. This stored water supplies wells, seeps, springs, streams, and rivers. Some streams receive water from the ground water supply when the water table is high – a process called recharging. If the water table is low, these streams will lose water to the water table in a process called discharging. Surface runoff refers to water that flows over the surface of the ground because it cannot infiltrate the soil due to severely compacted or already saturated soils or an impervious barrier
from NavGuide, USGS

Pine Creek Watershed Assessment, Protection and Restoration Plan March 2005
Chapter 2: A Watershed Primer 19
(e.g. parking lot, building, etc.). In the normal water cycle, heavily vegetated land with a thick layer of topsoil allows more rainwater or snowmelt to percolate into the water table than does land that has been stripped, recontoured, paved over, or recovered with a thin layer of topsoil and lawn grasses. Paved surfaces, roofs, and other impervious materials shed all precipitation along with any contaminants. This lack of any infiltration results in significant volumes of stormwater runoff after precipitation. Erosion, defined as the wearing away of soils and other surface materials, is one impact of runoff. Once these particles are picked up and carried away by the water, they increase the erosive force of the medium. Rain drops that are intercepted by vegetation are less likely to dislodge soil particles, therefore, erosion potential is reduced. Rain striking unprotected soils can easily dislodge particles, as can large volumes of runoff, resulting in increased erosion and raised sediment loads and contamination. Particles suspended in the water column of a stream increase the scouring effect on stream or river banks and on the tissues of living organisms. They block sunlight penetration and hold heat, increasing water temperatures. Deposited material smothers life in streambeds and lakebeds. Deposited sediments displace water volume in waterways, increasing the likelihood of future flooding and the expensive damage it causes. More information about pollutants in waterways can be found in Chapter 4. As mentioned, the amount of infiltration in a watershed greatly impacts the quantity of water in the stream and the quality of that water. Measures that intercept runoff and allow for infiltration and slower releases to streams offer opportunities to reduce overall stormwater volume and contaminant loads. Measures that encourage preservation of natural lands and streamside vegetation offer ways to increase infiltration while reducing the need for expensive infrastructure to remove runoff. B. Important Natural Areas Affecting Water Quality Floodplains and floodways are natural areas that provide protection to streams. Floodplains are the strips of relatively flat land on either side of a stream or river that mark the boundaries of floodwaters, see Figure 2-3. The soils of floodplains, which are deposited as floodwaters recede, can absorb large amounts of water, thus mitigating the flooding effects of small storms. Additionally, there can be terraces delineating successive floodplains. The floodway is the portion of the floodplain defined as most likely to carry floodwaters, and the floodway fringe is the margin of the regulatory floodway. The fringe would be the area most likely to be flooded by a 100 year flood (i.e. a flood that has 1/100 (one percent) chance of occurring in any given year). While the floodway is the section that is frequently protected by municipal ordinance or state law, the edges of the floodplain are not. As flooding occurs and the watercourse overflows its banks in an undeveloped system, the wider channel of the flood plain allows the water to spread and lose velocity, which reduces erosion. Thus, the protection of floodplains reduces flooding potential and erosion while improving water quality and protecting valuable habitat. Construction and other encroachments of the floodplain not only renders their normal advantages ineffective, but can create virtual dams, increasing the likelihood of upstream flooding and the damage associated with it.

Pine Creek Watershed Assessment, Protection and Restoration Plan March 2005
Chapter 2: A Watershed Primer 20
Figure 2-3: Floodplains and Floodways
Riparian forests refer to forest vegetation occurring alongside streams and rivers. Riparian forests may occur on the high side of a floodplain, or right up to, and leaning over a stream bed. Either way, riparian forests offer the last opportunity for runoff waters to have a lively exchange with vegetation and soils before entering streams and rivers. Riparian forests are considered to be the single most effective means of controlling nonpoint source pollution. The buffers clean water coming off the land and maintain healthy aquatic habitats. Riparian forests function as
• Filters: Runoff from rain or snow is intercepted by riparian vegetation, where it slows down and drops out sediments.
• Transformers: Plants take up excessive nutrients from fertilizers and reduce or transform them to safer compounds.
• Sinks: Nutrients and contaminants carried by runoff drop down into soil substrates where they are processed and broken down by plants and soils.
• Sources: Overhanging vegetation offers shade for fish, maintains cool stream temperatures, provides habitat to insects, and contributes leaf detritus for the downstream aquatic food chain—critical components for aquatic ecosystems.
• Stabilizers: Interwoven root systems of streamside vegetation stabilize streambanks and prevent erosion during high water events. In western Pennsylvania, undisturbed riparian vegetation is usually made up of mature, native forest trees like red maples, sycamores, and willows, with a range of native shrubs and grasses, which tolerate wetter soils.2
In Pennsylvania, many streams are typically bordered by forests, which tend to provide the highest benefit to water quality and habitat. However, any type of vegetated buffer is better than no vegetative buffer. Table 2-2 ranks vegetation types with their benefits. 2 www.watershedatlas.org
From www.dcr.virginia.gov

Pine Creek Watershed Assessment, Protection and Restoration Plan March 2005
Chapter 2: A Watershed Primer 21
Table 2-2: Relative Effectiveness of Different Vegetation Types for Specific Benefits
Benefit Grass Buffer Shrub Buffer Tree Buffer Stabilize bank erosion low-medium high high Filter sediments high low high Filter nutrients, pesticides, microbes
• sediment bound • soluble
high medium
low low
high medium
Aquatic Habitat low medium high Wildlife Habitat
• range/pasture • forest wildlife
high low
medium medium
low high
Economic products medium low high Visual diversity low medium high Flood protection low medium high Source: Agroforestry Notes, Jan. 1997, USDA Forest Service/NRCS
The ideal width of a riparian buffer varies because it is dependent upon soil, slope, adjacent land use, and the management objectives of the landowner, but the most commonly recommended range for buffers is 35 to 100 feet. The Alliance for the Chesapeake Bay, in cooperation with the DEP, has produced a Forest Buffer Toolkit to help individuals plan for, design, establish, and maintain streamside forest buffers. This Toolkit is a valuable resource and is available online at www.dep.state.pa.us, subject: Stream ReLeaf. When there are insufficient natural areas to protect streams, artificial methods can be created. Artificial ways of slowing runoff and increasing infiltration include the use of retention and/or detention ponds. Detention ponds detain stormwater volume for 24 to 48 hours while retention ponds retain the water for longer periods, allowing some to infiltrate and slowly releasing the rest to a local stream. This latter process mimics the structure and function of natural floodplains, reducing the incidence of erosion, sedimentation, and flooding. The slower release also allows toxins to be processed by normal bacterial, vegetative, and chemical processes. C. Stream Networks3 Each major stream is comprised of a network of smaller streams that feed into it. A numbering system, called stream order, is used to describe the network. First order streams are the first upland channels to exhibit a defined bed and banks and have no tributaries or branches. Two first order streams join to make a second order stream, and so on. The headwater (first and second order) streams are small and narrow and may be only one to two feet wide. However, they represent the majority of the drainage network (both in number and length) and are very 3 Do-It-Yourself Watershed Planning Kit, Center for Watershed Protection, www.cwp.org

Pine Creek Watershed Assessment, Protection and Restoration Plan March 2005
Chapter 2: A Watershed Primer 22
vulnerable to watershed development. It is estimated that 75% of the total stream and river mileage in the United States are headwater streams. It is on these small streams where riparian buffers have the greatest influence. D. Natural Stream Channel Design Development occasionally alters the natural flow of a stream, creating an unhealthy aquatic environment and an unstable system, which can cause damage to surrounding properties during flooding. In the past, engineering options, like culverts, were used to ‘control’ the stream and to force it to behave a certain way. In recent years, scientists have proposed allowing streams to behave more naturally in a concept called “natural stream channel design.” Natural stream channel design incorporates natural materials and habitat creation so that the stream will function and have the appearance of a natural stream. Techniques used in natural stream channel design include reshaping meanders, adding structures like wood and stone to streams, and adding riparian buffers. This method of design requires understanding of the local hydrology, vegetation, flood plain development, soils, and fluvial geomorphology (the study of how rivers are formed, with particular attention to the stream banks).

Chapter Three
Study Area

Pine Creek Watershed Assessment, Protection and Restoration Plan March 2005
Chapter 3: Study Area 23
A. Project Location
Pine Creek is a 22.8 mile long stream in northern Allegheny County, that begins in Pine Township and ends at the Allegheny River in the Borough of Etna. Its watershed is 67.3 square miles (43,072 acres) and covers parts of 14 municipalities, see Table 3-1 and Map 3-1. There are 128 stream miles in the watershed.
Table 3-1: Pine Creek Municipalities
Municipality Total Area (sq. mi)
Watershed Area (sq. mi)
Watershed Area as % of Municipality
Watershed Area as % of Watershed
Bradford Woods 0.93 0.54 58.49 0.81
Etna 0.81 0.67 82.59 1.00 Fox Chapel 8.50 0.30 3.58 0.45 Franklin Park 13.55 3.86 28.46 5.74 Hampton 16.05 14.99 93.38 22.29 Indiana 17.00 3.25 19.11 4.83 Marshall 14.79 0.96 6.48 1.43 McCandless 16.40 12.99 79.18 19.32 O’Hara 7.01 1.40 19.93 2.08 Pine 17.12 12.30 71.85 18.30 Richland 14.68 6.66 45.33 9.90 Ross 14.50 1.44 9.94 2.14 Shaler 10.74 7.87 73.24 11.70 Sharpsburg 0.75 0.02 2.13 0.02
B. Physical Description The watershed is comprised of hilly terrain. It has moderate to low relief and a dendritic stream pattern -- that is, the stream pattern is treelike, with trunk and branches at acute angles. Soils in the watershed vary in thickness, composition, and porosity. Generally, most of the soil is well drained on the uplands and underlain by shale. However, the floodplains are typically poorly drained. Specific information about soils can be found in the Soil Survey of Allegheny County, Pennsylvania, published in 1981 by the U.S. Department of Agriculture Soil Conservation Service and in the 1972 publication Our Land: A Study of the Pine Creek Watershed, published by the North Area Environmental Council. This area is highly susceptible to landslides. A combination of a humid temperate climate, locally steep and rugged topography, weak rock strata, springs, and a great diversity in the

Pine Creek Watershed Assessment, Protection and Restoration Plan March 2005
Chapter 3: Study Area 24
weathering and erosion characteristics of near surface sedimentary rocks makes this area one of the most slide-prone areas in the state. In addition, landslides can be triggered by:
• Addition of fill, which increases the stress on underlying materials, • Changes in quantity or the direction of water flow, • Surface and subsurface excavations (including coal removal), and • ‘Red Beds’- bedrock in hillsides composed of claystones and shales that are 40-60 feet
deep. This bedrock weathers easily, especially when wet, and causes unstable slopes. Stabilization and repair can cost thousands to millions of dollars.
Because steep slopes are more susceptible to landslides, they are often not developed; therefore, they are generally better suited for woodland and wildlife habitats. A list of northern Allegheny County’s landslide prone soils appears in Appendix C. C. Land Cover 1. Development The communities near the mid to lower section of Pine Creek as well as those near the West Branch of Little Pine Creek are the most developed in the watershed. While the headwaters section of the basin is the least developed, there is a significant transformation underway from rural communities and farmlands to suburban communities and commercial districts. This is illustrated in Tables 3-2 and 3-3.
Table 3-2: Change in Municipal Population Municipality 1990 Population 2000 Population % Change Bradford Woods 1,329 1,149 -16 Etna 4,200 3,924 -0.1 Fox Chapel 5,319 5,436 2 Franklin Park 10,109 11,364 11 Hampton 15,568 17,526 11 Indiana 6,024 6,809 11 Marshall 4,010 5,996 33 McCandless 28,781 29,022 0.8 O’Hara 9,096 8,856 -3 Pine 4,048 7,683 47 Richland 8,600 9,231 7 Ross 33,482 32,551 -3 Shaler 30,533 29,757 -3 Sharpsburg 3,781 3,594 -5 Source: PA State Data Center, Penn State Harrisburg. http://pasdc.hbg.psu.edu

Pine Creek Watershed Assessment, Protection and Restoration Plan March 2005
Chapter 3: Study Area 25
Table 3.3 illustrates development through housing units (single or multiple units, mobile homes, etc.).
Table 3-3: Change in Municipal Housing Units
Municipality 1990 Units 2000 Units % Change Bradford Woods 476 478 0.4 Etna 1,867 1,934 3 Fox Chapel 1,887 1,942 3 Franklin Park 3,420 3,973 14 Hampton 5,526 6,627 17 Indiana 2,208 2,457 10 Marshall 1,382 2,018 31 McCandless 10,933 11,697 6 O’Hara 3,377 3,381 0.1 Pine 1,514 2,500 39 Richland 3,201 3,508 9 Ross 14,124 14,422 2 Shaler 11,830 12,334 4 Sharpsburg 1,864 1,911 2 Source: PA State Data Center, Penn State Harrisburg. http://pasdc.hbg.psu.edu
While six of the 14 communities saw declines in their population during a ten-year period, municipal housing units increased in all municipalities. Most of the commercial development in the watershed has been along the McKnight Road and Perry Highway (U.S. Route 19) corridor where enclosed malls and strip malls are common. More recent commercial development has and continues to occur near the Wexford interchange of Interstate 79. Future development is expected to occur along State Route 8, which currently has only pockets of development, primarily in Etna, Shaler, and part of Hampton. However, the recently developed Route 8 Economic Development Plan1 seeks to strengthen the regional marketplace of the Rt. 8 Corridor to attract and diversify development. This is particularly significant to the lower portion of Pine Creek, which is adjacent to Rt. 8. Also along the lower part of Pine Creek is the CSX Railroad, which is currently leased to the Allegheny Valley Railroad until 2023. This line was heavily damaged due to flooding in 2004 and is in need of repair. There are significant undeveloped or green areas (identified as forests, grasslands, crops) throughout the watershed. Some of this can be explained by steep forested slopes, which are unable to be developed, as well as managed recreation areas, such as North Park. 1 Route 8 Economic Development Plan, July 2002, The Route 8 Partnership.

Pine Creek Watershed Assessment, Protection and Restoration Plan March 2005
Chapter 3: Study Area 26
2. Important Areas The Allegheny County Natural Heritage Inventory, published by the Western Pennsylvania Conservancy in 1994, listed several Pine Creek sites as significant natural heritage areas for the county. These sites either provide habitat for species of special concern or serve as an educational and scientific area with the potential for natural areas management. Sites listed are:
• Allegheny River • Crouse Run • Hemlock Grove, North Park • Willow Run Slopes, North Park • North Park • Beechwood Farms Nature Reserve • Cold Valley
North Park, at 3,010 acres, is the largest of the County Parks. It is mostly used for recreation and very little remains in its natural state. The U.S. Army Corps of Engineers is working on an aquatic ecosystem restoration project of North Park Lake, which has lost some of its depth due to growing silt deposits. Sediment from the Lake will be dredged and removed to an offsite location. Additional important sites are identified in the “Watershed Walks” developed by members of NAEC. These walks can be found in Appendix D.

Pine Creek Watershed Assessment, Protection and Restoration Plan March 2005
Chapter 3: Study Area 27

Chapter Four
Water Quality

Pine Creek Watershed Assessment, Protection and Restoration Plan March 2005
Chapter 4: Water Quality 28
A. Water Quality1 1. Clean Water Act The Federal Clean Water Act (CWA), which is carried out by the PA Department of Environmental Protection (DEP) under the Clean Streams Law, provides regulations that strive to “restore and maintain the chemical, physical, and biological integrity of the nation’s waters.”2 Regulations dealing with water quality standards are found in The Pennsylvania Code Title 25, Chapter 93. All surface waters in Pennsylvania have been assigned statewide water uses. All surface waters should be able to support these uses: aquatic life, water supply, and recreation. In addition to meeting the standards for each of these statewide uses, some water bodies meet standards that make them eligible for other uses, or designations. Pine Creek is designated as a cold water fishery (CWF) from the source to North Park Lake Dam and a Trout Stocked Fishery (TSF) from North Park Lake Dam to its mouth. 2. Sources and Types of Water Pollution Pollution entering our waterways is typically assigned to one of two categories: point or non-point source pollution. Point source pollution comes from a defined point, such as a pipe, along a waterway. Permitted point source discharges from industrial, commercial, and municipal facilities are described below. Conversely, non-point source pollution comes from non-specific areas such as agricultural runoff and parking lots and is therefore more difficult to control and regulate. The following sections describe both pollution sources in more depth.
Point Sources In order to control and regulate the amount and types of pollution entering our waterways, and to help achieve designated uses and prevent water quality degradation, point sources of pollution must have proper permits to discharge wastes into the nation’s waters. The National Pollutant Discharge Elimination System (NPDES) is a permitting system that targets point source dischargers, such as industrial facilities and wastewater treatment plants. Permitted facilities must meet stringent effluent limits and are responsible for monitoring (water quality testing) and reporting to the DEP. These permits are referred to as “individual” permits. For other point dischargers, such as stormwater pollution or construction site runoff, a general permit is issued. General permits usually apply to smaller operations and are less stringent in the monitoring and reporting requirements. The DEP eFACTS (Environment, Facility, Application, Compliance Tracking System) database provides information on all NPDES-permitted facilities in the state and allows the public to search for facilities by name, county, or municipality (www.dep.state.pa.us/efacts/). Some types of facilities and activities with NPDES permits under the DEP Bureau of Water Pollution Control include:
• Discharge of stormwater associated with industrial activities 1 Adapted from the Three Rivers Conservation Plan, published by the Pennsylvania Environmental Council, 2004. 2 Section 101 (a)(2) Clean Water Act

Pine Creek Watershed Assessment, Protection and Restoration Plan March 2005
Chapter 4: Water Quality 29
• Discharge from gasoline-contaminated ground water remediation systems • Discharge from industry • Single residence sewage treatment plant • Stormwater runoff from construction (greater than one acre disturbance) • Publicly owned sewage treatment works • Active mining operations • Discharge of stormwater from Municipal Separate Storm Sewer Systems (MS4s) (see
section on stormwater below) Examples of facilities that do not have permits, but that affect water quality are: sanitary sewer overflows and illegal sanitary sewer tie-ins to storm drains.
Non-Point Sources Although non-point source pollution is much more difficult to control than point source pollution, there are still efforts throughout the Commonwealth and the nation to prevent and control it. The DEP Water Quality Bureau has set up a "Non-Point Source (NPS) Management Program," which consists of action plans that address this type of pollution across the state. Some of the common sources of NPS pollution in Pennsylvania are:
• Abandoned mine drainage (AMD) (Drainage from, or caused by deep mining, surface mining, or coal refuse piles. It may be acidic or alkaline with elevated levels of dissolved metals.)
• Agriculture (runoff of soil that contains fertilizers and excess nutrients) • Silviculture (soil erosion and sediment loading from forestry operations) • Construction (runoff of soil into the water which increases chance of flooding) • Land disposal (landfills, illegal dumpsites) • Urban runoff (pesticides, lawn fertilizers, oil, and other chemicals and debris deposited or
littered in urban areas).
Stormwater Stormwater can be characterized as both point and non-point source pollution. Natural stormwater runoff from the land or from small construction sites under one acre are considered to be non-point source pollution because there is no discreet conveyance of the water – it runs over the land and into streams and rivers without controls. Conversely, stormwater from construction sites larger than one acre or from Municipal Separate Storm Sewer Systems (MS4s)3 are considered to be point source pollution, which must be managed and permitted. Pennsylvania’s Stormwater Management Program developed from the Stormwater Management Act (Act 167) of 1978. Under the Program, counties develop stormwater management plans for watersheds within the county boundaries. Municipalities then develop ordinances that meet the
3 Normally, sewer systems are separated into a sanitary system (sewage from homes and businesses) and a storm system (drainage from rain or snow). Water from a storm sewer system is not treated and empties into rivers. Municipalities are now required to have permits for these storm sewer discharges.
Pine Creek Watershed Assessment, Protection and Restoration Plan March 2005
Chapter 4: Water Quality 30
specifications of the county plans. When construction or other land disturbances take place, the developers must follow the guidelines set forth for stormwater management. Plans must be reviewed every five years and include an inventory of both existing and potential characteristics and problems of the area, such as run-off characteristics, soil impacts, and significant obstructions. The Clean Water Act established two Phases of the federal Stormwater Program: Phase I (1992) requires NPDES permits for construction activities that disturb five or more acres of land. Permitees must use best management practices (BMPs) and erosion and sediment control plans to control stormwater runoff from sites. Phase II (adopted in 2002) requires NPDES permits for construction activities that disturb one to five acres of land. This permit also requires the use of BMPs and erosion and sediment control plans. In addition to the construction permits, Phase II also requires NPDES permits for MS4s in urban areas. As part of the permit requirements, the MS4 operators must develop and implement BMPs to manage stormwater and must conduct public outreach. Operators within municipalities that have adopted an Act 167 Plan may already meet some of the requirements of the MS4 NPDES permit if their Act 167 Plan sufficiently addresses water quality issues. Other operators must develop their own stormwater management program or develop an Act 167 Plan to meet permit requirements. These permit requirements must be completed during the five-year permit period (the five year period ends March, 2008). An Act 167 plan for Pine Creek is currently being developed and will be completed by 2007. For more details, visit www.dep.state.pa.us, keyword: stormwater.
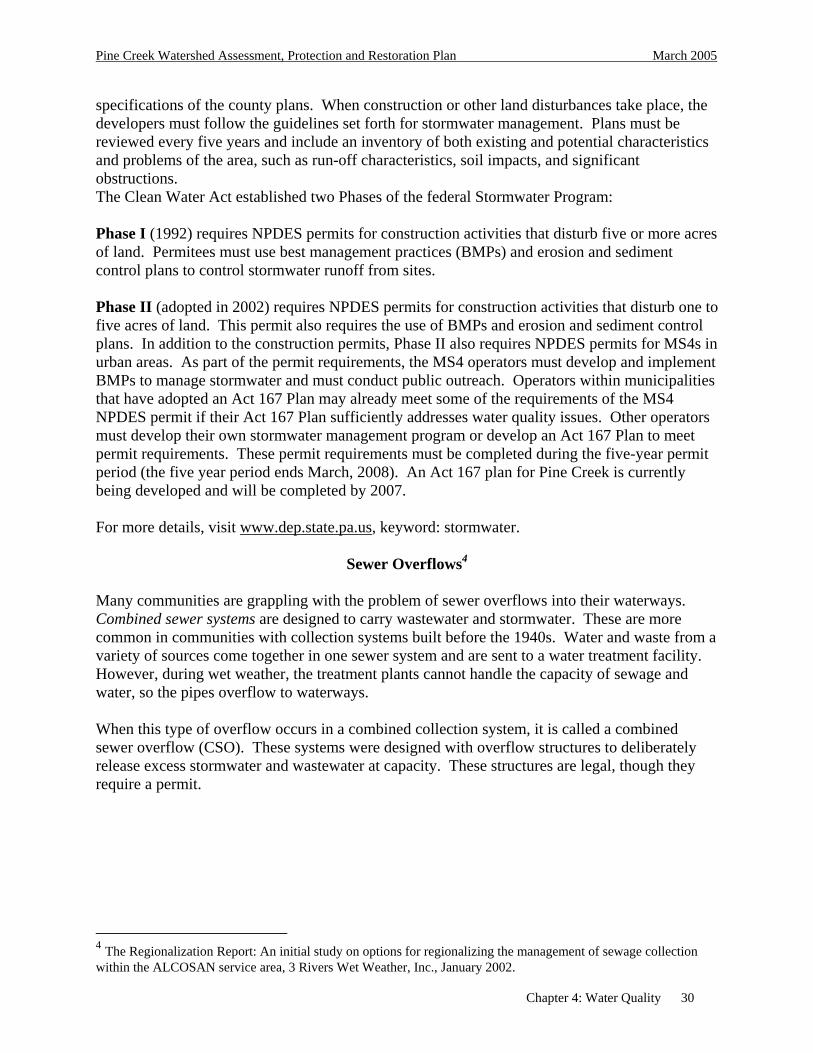
Sewer Overflows4 Many communities are grappling with the problem of sewer overflows into their waterways. Combined sewer systems are designed to carry wastewater and stormwater. These are more common in communities with collection systems built before the 1940s. Water and waste from a variety of sources come together in one sewer system and are sent to a water treatment facility. However, during wet weather, the treatment plants cannot handle the capacity of sewage and water, so the pipes overflow to waterways.
When this type of overflow occurs in a combined collection system, it is called a combined sewer overflow (CSO). These systems were designed with overflow structures to deliberately release excess stormwater and wastewater at capacity. These structures are legal, though they require a permit.
4 The Regionalization Report: An initial study on options for regionalizing the management of sewage collection within the ALCOSAN service area, 3 Rivers Wet Weather, Inc., January 2002.

Pine Creek Watershed Assessment, Protection and Restoration Plan March 2005
Chapter 4: Water Quality 31
Dry Weather Wet Weather
Copyright © 2002 by the Louisville/Jefferson County Metropolitan Sewer District (MSD) Louisville, Kentucky http://www.msdlouky.org/programs/sso.htm Separate sanitary sewer systems are designed to carry only wastewater. Stormwater is managed through a different collection system. These systems were required for any new system built after the 1940s. Sewer pipes are rarely full when wastewater is flowing from homes to the sewage treatment plant. Therefore, groundwater or stormwater can leak into cracked or broken pipes, taking up space that should be used to carry only wastewater. In some instances, stormwater is illegally piped into separate sanitary systems to control the runoff through storm drains in streets, parking lots, and gutters. During dry weather, the sewage systems generally operate effectively. During wet weather, the additional flow exceeds the capacity of the sewers causing the sewage to overflow into creeks, streams, or rivers, creating a large-scale problem. When this type of overflow occurs in a separate sanitary system, it is called a sanitary sewer overflow (SSO) and may occur in an overflow structure, a structure that is intentionally designed to discharge flow into nearby streams. Occasionally, the overflow can occur in a street from a manhole or in the basements of homes. The overflow structures and unintentional overflows are illegal according to the Clean Water Act. The types of overflows that occur in streets or basements also are illegal. The 3 Rivers Wet Weather Demonstration Program (www.3riverswetweather.org) was created to help communities in the Allegheny County Sanitary Authority (Alcosan) address this situation by offering education, financial grants, and outreach efforts. Pine Creek municipalities in the Alcosan Service area include: Etna, Fox Chapel, Franklin Park, Indiana, McCandless, O’Hara, Ross, Shaler, and Sharpsburg. 3. Impaired Streams and Rivers While NPDES permits target point source pollution, another approach to targeting all pollution sources, especially non-point, is through the use of Total Maximum Daily Loads (TMDLs). The CWA calls for the development of TMDLs for all waterways that do not meet water quality standards. Assessed waterways that do not meet their designated use must be listed by the state every two years in accordance with Section 303(d) of the CWA, which is the list of impaired streams and rivers. Waterways listed within Section 303(d) are prioritized for TMDL development based on

Pine Creek Watershed Assessment, Protection and Restoration Plan March 2005
Chapter 4: Water Quality 32
the severity of impairment. The DEP is incorporating them on a watershed basis where local watershed groups actually implement the TMDL Plan and do testing with DEP's assistance. More specifically, according to the PA DEP: TMDLs set an upper limit on the pollutant loads that can enter a water body so that the water will meet water quality standards. The Clean Water Act requires states to list all waters that do not meet their water quality standards even after required pollution controls are put into place. For these, the state calculates how much of a substance can be put in the stream without violating the standard and then distribute that quantity among all sources of the pollution on that water body. A TMDL plan includes waste load allocations for point sources, load allocations for non-point sources, and a margin of safety. States must submit TMDLs to the Environmental Protection Agency (EPA). The Clean Water Act also requires a water quality assessment report (305(b)) on all impaired waters every two years along with the 303(d) list. "This report provides summaries of various water quality management programs including water quality standards, point source control, and non-point source control. It also includes descriptions of programs to protect lakes, wetlands, and groundwater quality."5 Furthermore, the 305(b) report describes the extent to which waterways are supporting their designated uses. For example, if in a particular waterway all designated uses are achieved, the waterway is listed as “fully supporting.” For 2004, DEP has combined the 303(d) report and 305(b) report into one document, the 2004 Pennsylvania Integrated Water Quality Monitoring and Assessment Report.6 The 2004 report notes that segments of the following streams in the Pine Creek Watershed meet the standards for at least one use, but that the attainment status of remaining designations is unknown because of insufficient data:
• Gourdhead Run • Little Pine Creek (East and West branches, plus unnamed tributaries) • North Fork of Pine Creek • Pine Creek • Rinaman Run • Willow Run
Waters with stream segments that are impaired for one or more designated uses and that require a TMDL appear in Table 4.1.
5 PA DEP www.dep.state.pa.us 6 www.dep.state.pa.us, Water Quality Assessments and Standards

Pine Creek Watershed Assessment, Protection and Restoration Plan March 2005
Chapter 4: Water Quality 33
Table 4-1 Impaired Streams Requiring a TMDL
Stream 303(d) list date
TMDL target date
Total stream miles
impacted
Pollution Characterization
Crouse Run (plus unnamed tributaries) 2002 2015 7.7
Urban Runoff/Storm Sewers/Nutrients
Fish Run (plus unnamed tributaries)
2002 2017 4.8
Urban Runoff/Storm Sewers/Nutrients Land Development/Siltation
Gourdhead Run (plus unnamed tributaries) 2002 2015 2.1
Urban Runoff/Storm Sewers/Nutrients
West Little Pine Creek (plus unnamed tributaries) 2002 2015 1.1
Urban Runoff/Storm Sewers/Nutrients
McCaslin Run 2002 2015 2
Urban Runoff/Storm Sewers/Nutrients
Pine Creek (plus unnamed tributaries)
2002 2015 28.2
Land Development/Siltation Small residential runoff/Nutrients Wastewater/Organic Enrichment/Low Dissolved Oxygen Urban Runoff/Storm Sewers/Nutrients
Wexford Run (plus unnamed tributaries)
2002 2017 3.6
Urban Runoff/Storm Sewers/Nutrients Land Development/Siltation
B. Monitoring Pine Creek 1. Volunteer Monitoring The Environmental Alliance for Senior Involvement (EASI)7 is a national non-profit organization founded in 1991 to increase the opportunities for older adults to play an active, visible role in protecting and improving the environment in their community. In 1997, the Pennsylvania Departments of Aging and Environmental Protection supplied funding to establish the Pennsylvania Senior Environmental Corps (SEC) and bring EASI to Pennsylvania. The
7 www.easi.org

Pine Creek Watershed Assessment, Protection and Restoration Plan March 2005
Chapter 4: Water Quality 34
Allegheny and Butler County SEC is housed at Vintage, a comprehensive service establishment for older adults located in East Liberty.8 Volunteers, not all of whom are senior citizens, receive vigorous training in chemical and biological sampling from Vintage’s DEP certified trainers. These trainers continue to provide support in the field until procedures are fully established. Volunteers also are trained on Quality Control aspects of the program, such as field duplicates, blanks, and calibration standards. All volunteers are asked to commit to monthly monitoring of two stream sites for a period of two years. In late 2002, the steering committee for the Pine Creek Watershed Assessment issued a call for volunteer water monitors. The response exceeded expectations. In early 2003, 28 volunteers received their initial training. A second round of 13 volunteers was trained later in the year. Eight teams of three to five volunteers currently monitor the Creek. Volunteers are listed in Chapter 1. 2. Monitoring Parameters Sampling sites were selected at 16 stations throughout the watershed; see Map 4-1 at the end of this chapter. Teams were responsible for conducting chemical and physical sampling once per month and biological sampling twice per year at two different sites. When examining the data, it is important to note that all teams did not start monitoring concurrently, nor did they sample on the same day each month, and individual teams may not have sampled on the same day in subsequent months. Physical and chemical parameters that were measured include: water temperature, pH, dissolved oxygen, conductivity, phosphate, sulfate, alkalinity, nitrate, and stream flow. Unlike chemical samples, which reflect the stream’s condition at one moment in time, biological monitoring can illustrate the stream’s condition over a longer period of time. For this study, biological monitoring looked at the number and composition of macroinvertebrates living in the stream. Freshwater macroinvertebrates are small animals that lack a skeleton and can be seen with the unaided eye. These organisms are useful and easy indicators to gauge the health of their freshwater environments for two main reasons: they are easy to collect and observe and species vary in their tolerances to pollution, habitat modification, or other stresses. Macroinvertebrates were divided into the groups listed in Table 4-2:
Table 4-2 Biological Monitoring and Pollution Tolerances
Group Pollution Tolerance Examples
1 Sensitive Water penny, Dobsonfly larvae, mayfly nymph, stonefly nymph
2 Somewhat Sensitive Clams, beetle larvae, crayfish, sowbug
3 Tolerant aquatic worms, blackfly larvae, leech, midgefly larvae
8 In July 2005, the Volunteer Monitoring Program will be under the direction of the Western Pennsylvania Conservancy’s Watershed Assistance Center (WPC)

Pine Creek Watershed Assessment, Protection and Restoration Plan March 2005
Chapter 4: Water Quality 35
Teams surveyed macroinvertebrates twice per year: late March through April and late September through October. Sampling was dependent on the weather and stream flow. Volunteers were instructed to never sample in unsafe conditions. Sampling was suspended on several sites after the September 2004 flood due to sewage contamination. C. Analysis of Pine Creek Water Quality Data9 1. Development of Criteria for the Pine Creek Watershed Data Trend Analysis Water monitoring data that was collected from February 2002 through August 2004 from 16 sites in the Pine Creek Watershed were reviewed and compared with standard criteria for the physical and chemical parameters of water temperature, pH, dissolved oxygen, conductivity, phosphate, sulfate, alkalinity, water quality score (macroinvertebrate survey), and stream flow. These criteria were obtained from the EPA, the Pennsylvania Code, the PaSEC Water Quality Training Manual, and the PA Lake Management Society. When the data exceeded the criteria by being above or below the recommended values, this indicated that the water quality was potentially compromised at this site and may affect the stream’s ability to provide quality habitat to support plant and animal life. The Pennsylvania Department of Environmental Protection’s Bureau of Watershed Management provided the Pine Creek Watershed Assessment consultants with the PA Lake Management Society criteria for water quality parameters. Since the DEP endorsed the PA Lake Management Society criteria, this was the consultant’s primary reference for establishing criteria. However, upon review, the criteria from other sources were sometimes determined to be more appropriate. The following discussion provides an overview of the parameters studied and the rationale for the selection of the criteria. Table 4-3 summarizes the criteria used to evaluate the data. A comparison of criteria from all sources appears in Appendix E. Water Temperature – The rates of biological and chemical processes depend on temperature. The rate of photosynthesis by algae and other aquatic plants increases in warm waters and decreases in cooler waters. Temperature has a direct effect on the level of dissolved oxygen in the water. Colder water has higher dissolved oxygen levels. Aquatic microorganisms from microbes to fish are dependent on certain temperature ranges for their optimal health. Optimal temperatures for fish depend on the species: some fish survive best in colder water; others prefer warmer water. Benthic macroinvertebrates are also sensitive to temperature and will move in the stream to find their optimal temperature. If the temperatures are outside of this optimal range for a prolonged period of time, organisms become more sensitive to pollution, parasites, and disease. Causes of temperature change include weather, removal of shading streambank vegetation, impoundments (a body of water confined by a barrier, such as a dam), discharge of cooling water, urban stormwater runoff, and groundwater inflows into a stream. 9 Text and analysis provided by Collective Efforts, LLC. Mapping and tabular data summary provided by Mary Bates. Raw data can be viewed on EASI’s website: www.environmentaleducation.org

Pine Creek Watershed Assessment, Protection and Restoration Plan March 2005
Chapter 4: Water Quality 36
The PA Lake Management Society criteria provides values of up to 66 deg F for Cold Water Fisheries (CWF) and 87 deg F for Warm Water Fisheries (WWF). Since the Pine Creek Watershed data show temperatures consistently in the lower ranges, using these criteria simplifies the analysis for temperature. Criteria from the other sources were not used for the following reasons. PA Code criteria are based on "heated waste sources" in the watershed. EPA criteria are based on effects on specific fish species. The PaSEC guidelines provide a range of temperatures, but months are not indicated. pH – pH is a term used to indicate the alkalinity or acidity of a substance as ranked on a scale of 1.0 to 14.0, with 7 being neutral. Acidity increases as the pH gets lower. pH affects many chemical and biological processes in the water. Different organisms flourish within different ranges of pH, but the largest variety of aquatic animals prefer a range of 6.5 to 8.0. pH outside this range reduces the diversity in the stream because it stresses the physiological systems of most organisms and can reduce reproduction. Low pH also can allow toxic elements and compounds to become mobile and “available” for uptake by aquatic plants and animals. This can produce conditions that are toxic to aquatic life, particularly to sensitive species like rainbow trout. Changes in acidity can be caused by atmospheric deposition (acid rain), surrounding rock, mine drainage, and certain wastewater discharges. The four criteria sources provided pH values that were in roughly the same range. The PA Lake Management Society criteria pH values of 6.5 to 8.2 were used for comparison to the Pine Creek Watershed data. Dissolved Oxygen – The stream system both produces and consumes oxygen. It gains oxygen from the atmosphere and from plants as a result of photosynthesis. Running water, because of its churning and aeration, dissolves more oxygen than still water. Respiration by aquatic animals, decomposition, and various chemical reactions consume oxygen. Dissolved oxygen (DO) levels generally fluctuate over a 24-hour period and also vary with water temperature. Cold water holds more oxygen than warm water. Aquatic animals are most vulnerable to lowered DO levels in the early morning on hot summer days when stream flows are low, water temperatures are high, and aquatic plants have not been producing oxygen since sunset. DO levels in small, shallow streams change horizontally, where DO levels in lakes vary vertically in the water column. A healthy stream generally has DO higher than the minimum level required by aquatic life to buffer against possible fluctuations caused by drought, temperature, or pollutants. Wastewater from sewage treatment plants often contains organic materials that are decomposed by microorganisms, which use oxygen in the process. Other sources of oxygen-consuming waste include stormwater runoff from farmland or urban areas, feedlots, and failing septic systems (see phosphorus and nitrate below). The amount of oxygen consumed by bacteria in breaking down these materials is known as the biochemical oxygen demand, or BOD. If more oxygen is consumed than is produced, dissolved oxygen levels decline and some sensitive animals may move away, weaken, or die.

Pine Creek Watershed Assessment, Protection and Restoration Plan March 2005
Chapter 4: Water Quality 37
For the Pine Creek Watershed Assessment, a DO value of below 4 mg/L was determined to be stressful to aquatic life. This level was from the PA Lake Management Society criteria. Conductivity - Conductivity, a measure of the ability of water to pass an electrical current, is useful as a general measure of stream water quality. Conductivity in streams is affected primarily by the geology of the area. For example, granite bedrock tends to lower the conductivity of streams, because granite is composed of more inert materials that do not ionize (dissolve into ionic components) when washed into the river. Streams that run through areas with clay soils tend to have higher conductivity because of the presence of the materials that ionize when washed into the water. Inorganic dissolved solids include anions (ions that carry a negative charge) such as chloride, nitrate, sulfate, and phosphate, or cations (ions that carry a positive charge) such as sodium, magnesium, calcium, iron, and aluminum. Organic compounds like oil, phenol, and alcohol do not conduct electrical current very well and therefore lower conductivity when in water. Conductivity also is affected by temperature. Each stream tends to have a relatively constant range of conductivity that, once established, can be used as a baseline for comparison with regular conductivity measurements. Significant changes in conductivity could then be an indicator that a discharge or some other source of pollution has entered the stream. Discharges to streams can change the conductivity depending on their make-up. Salts spread on the road after a snowstorm would raise the conductivity due to the presence of ionized materials washing into the nearest waterway. A failing sewage system would raise the conductivity due to the presence of chloride, phosphate, and nitrate, but an oil spill would lower the conductivity. However, while a small amount of ionic material such as road salt will raise conductivity noticeably, it would take a considerable amount of oil or solvent to lower the conductivity. The criteria from the “PaSEC Water Quality Training Manual” and the EPA "Volunteer Stream Monitoring: A Methods Manual" quoted studies of inland fresh waters, which found that streams supporting good mixed fisheries have a range between 150 and 500 µmhos/cm (µS/cm). It was determined that this would be the criteria used for conductivity for the Pine Creek Watershed Assessment. The PA Lake Management Society criteria provided the range of conductance for rivers in the US of 50 to 1500 µmhos/cm. This criteria was higher and may have included some US rivers with compromised water quality; thus it was not used for the Pine Creek Watershed Assesment. Phosphate and Nitrate – Phosphate and nitrogen are essential nutrients for aquatic plants and animals. Even small increases of these nutrients, under the right conditions, can set off a chain of undesirable events in a stream including accelerated plankton and aquatic plant growth, the death and decomposition of algae and aquatic plants by oxygen-consuming bacteria, which results in low dissolved oxygen, and causes the death of fish, invertebrates, and other aquatic animals. This process of excessive plant growth is called eutrophication, and high levels of phosphate and nitrates added to the water by human activity greatly speeds up this process. There are many sources of phosphate and nitrate, both natural and human. These include soil and rocks (phosphate), the air (nitrate), wastewater treatment plants, runoff from fertilized lawns and cropland, failing septic systems, and runoff from animal manure storage areas.
Pine Creek Watershed Assessment, Protection and Restoration Plan March 2005
Chapter 4: Water Quality 38
Nitrates from land sources end up in streams more quickly than other nutrients like phosphorus. This is because they dissolve more readily than phosphates, which have an attraction to soil particles. As a result, nitrates serve as a better indicator of the possibility of a source of sewage or manure pollution during dry weather. The criteria from the “PaSEC Water Quality Training Manual” of nitrate levels below 4.4 ppm should be used to evaluate the nitrate + nitrite data in the Pine Creek Watershed. The PA Code criteria for nitrate were for potable water supplies, and were not deemed appropriate. The PA Lake Management and EPA criteria were not as specific as those from the PaSEC. However, the nitrate data from the Pine Creek Watershed water monitoring was determined to be unusable during the data review process. Inconsistencies were found in the nitrate data reporting due to difficulties that the monitors had in interpreting and reporting nitrate monitoring results. Of the two criteria sources, the PaSEC Manual provides the more conservative criteria for phosphate of 0.03 ppm (mg/L). However, much of the data was found to exceed even the PA Lake Management Society criteria, which was for total phosphorus levels usually being < 0.1 mg/L in non-polluted waters. Therefore, the PA Lake Management Society criterion was adequate. Sulfate – Sulfates are the second most common anions (compounds with a negative charge) in natural waters, derived largely from sedimentary rocks. Sulfates enter the water in three ways:
• Breakdown of detritus (debris) – when detritus breaks down hydrogen sulfide is released by the oxygen-lacking sediments, which is the common rotten egg smell of decaying vegetation.
• Acid Rain – When sulfur dioxide emissions are released from automobiles and factories,
they are converted to sulfuric acid in the atmosphere. These acids combine with moisture in the air, and then fall to the earth as rain or snow.
• Acid Mine Drainage – Sulfate in water may also be the result of weathering of sulfate-
bearing minerals such as pyrite (iron sulfide), often found in coal. When pyrite reacts with oxygen in the water it forms sulfurous and sulfuric acid, which is extremely acidic. Since pyrite is the principal cause of acid mine drainage, sulfate is an excellent indicator that streams may be impacted by a mine discharge. Acid mine drainage is very common in the coal regions of Pennsylvania.
As sulfates in the form of sulfuric acid enter streams and rivers they can decrease the pH of the body of water, making it intolerable for certain species of aquatic life. Acid mine drainage alone can potentially cause the pH of the water to fall into a range of 1 to 5, which is very acidic. A sulfate level of 250 ppm or higher in water is considered to be unsafe to drink. The PA Lake Management criteria of 5-50 mg/L in natural waters was used to evaluate the data, since the PA Code criteria for drinking water was not deemed appropriate to evaluate stream health.

Pine Creek Watershed Assessment, Protection and Restoration Plan March 2005
Chapter 4: Water Quality 39
Alkalinity – Alkalinity measures water’s ability to buffer, or neutralize, acids. Without this acid-neutralizing capacity, any acid added to a stream would cause an immediate change in the pH. Measuring alkalinity is important in determining a stream’s ability to neutralize (buffer) acidic pollution from rainfall, wastewater, or other industrial effluents. It is one of the best measures of the sensitivity of the stream to acid inputs. Without a high buffering capacity, the water’s pH could be affected by acidic effluents that could kill the organisms within the stream. Alkalinity in streams is influenced by rocks and soils, salts, certain plant activities, and certain industrial wastewater discharges that bring alkaline compounds into the stream such as bicarbonates, carbonates, and hydroxides. These compounds remove H+ (positively charged) ions and decrease the acidity of the water. For example, limestone (calcium carbonate) is a very water-soluble material. A stream in a geographic area containing limestone will have a high alkalinity and a good buffering capacity. Pollutants such as acid rainfall, which would tend to decrease the pH of the water, would be buffered by the presence of the limestone, helping to prevent the pH from becoming too acidic. The Pennsylvania Code and the PA Lake Management Society provided the criteria for alkalinity, which requires a minimum of 20 mg/L. Water Quality Score – The water quality scores are based on the benthic surveys performed by the monitoring teams. Macroinvertebrates are collected, identified and counted, and the survey results are translated into a water quality score using a calculation where species are weighted based on their tolerance to pollution. The score is then compared to a set of water quality criteria from the Pennsylvania Volunteer Water Quality Monitoring Field Manual to determine the water quality of the stream at that location. The Pennsylvania Volunteer Water Quality Monitoring Field Manual provided the basis for the determination and evaluation of the water quality scores. Streams with good water quality have a score of 40 or greater; fair quality streams of 20-40; and poor quality streams, less than 20. Stream Flow Volume (or Discharge) – Stream flow volume was calculated at 15 of the 16 monitoring sites by stream monitors using the following formula:
w x d x v x k = Stream Flow Volume, where
w = average width of the stream (meters) d = average depth of the stream (meters) v = average velocity of the stream (in meters per second, as calculated by timing how long it takes a bobber to travel 10 meters downstream) k = stream bottom constant (0.8 for rubble/gravel, 0.9 for sand, mud, silt, or bedrock – as recorded by stream monitors) Stream Flow Volume = (cubic meters per second) No criteria were found for stream flow volume; however, this information provides a relative measure of the stream flow at the monitoring sites.
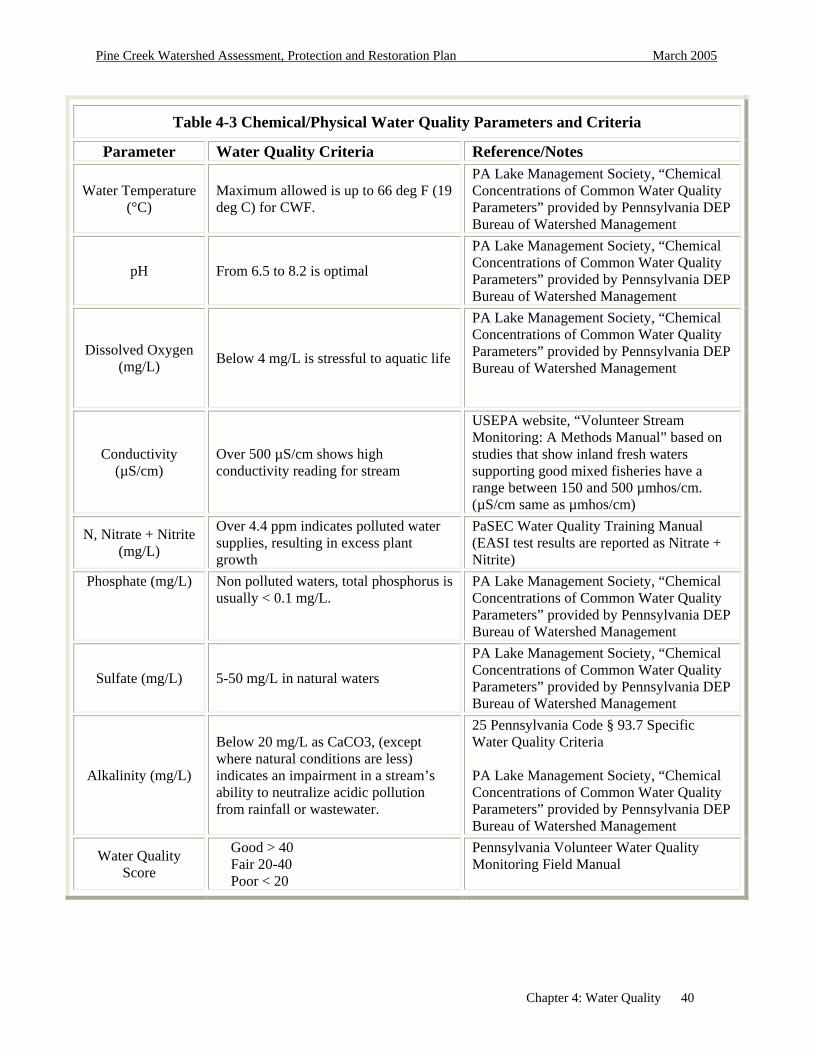
Pine Creek Watershed Assessment, Protection and Restoration Plan March 2005
Chapter 4: Water Quality 40
Table 4-3 Chemical/Physical Water Quality Parameters and Criteria
Parameter Water Quality Criteria Reference/Notes
Water Temperature (°C)
Maximum allowed is up to 66 deg F (19 deg C) for CWF.
PA Lake Management Society, “Chemical Concentrations of Common Water Quality Parameters” provided by Pennsylvania DEP Bureau of Watershed Management
pH From 6.5 to 8.2 is optimal
PA Lake Management Society, “Chemical Concentrations of Common Water Quality Parameters” provided by Pennsylvania DEP Bureau of Watershed Management
Dissolved Oxygen (mg/L) Below 4 mg/L is stressful to aquatic life
PA Lake Management Society, “Chemical Concentrations of Common Water Quality Parameters” provided by Pennsylvania DEP Bureau of Watershed Management
Conductivity (µS/cm)
Over 500 µS/cm shows high conductivity reading for stream
USEPA website, “Volunteer Stream Monitoring: A Methods Manual” based on studies that show inland fresh waters supporting good mixed fisheries have a range between 150 and 500 µmhos/cm. (µS/cm same as µmhos/cm)
N, Nitrate + Nitrite (mg/L)
Over 4.4 ppm indicates polluted water supplies, resulting in excess plant growth
PaSEC Water Quality Training Manual (EASI test results are reported as Nitrate + Nitrite)
Phosphate (mg/L) Non polluted waters, total phosphorus is usually < 0.1 mg/L.
PA Lake Management Society, “Chemical Concentrations of Common Water Quality Parameters” provided by Pennsylvania DEP Bureau of Watershed Management
Sulfate (mg/L) 5-50 mg/L in natural waters
PA Lake Management Society, “Chemical Concentrations of Common Water Quality Parameters” provided by Pennsylvania DEP Bureau of Watershed Management
Alkalinity (mg/L)
Below 20 mg/L as CaCO3, (except where natural conditions are less) indicates an impairment in a stream’s ability to neutralize acidic pollution from rainfall or wastewater.
25 Pennsylvania Code § 93.7 Specific Water Quality Criteria PA Lake Management Society, “Chemical Concentrations of Common Water Quality Parameters” provided by Pennsylvania DEP Bureau of Watershed Management
Water Quality Score
Good > 40 Fair 20-40 Poor < 20
Pennsylvania Volunteer Water Quality Monitoring Field Manual

Pine Creek Watershed Assessment, Protection and Restoration Plan March 2005
Chapter 4: Water Quality 41
2. Results Members of the Pine Creek Watershed Assessment Steering Committee conducted an initial quality review of water monitoring data from February 2002 through August 2004 for the 16 stream sampling sites. These data were provided to study consultant Collective Efforts for analysis. Some data for temperature and phosphate were determined to be inaccurate due to problems with field data collection. None of the nitrate data that was collected in the field was used in the data analysis due to field test method problems. More detail is provided below on these data quality issues. Monitoring data for nine parameters – pH, conductivity, phosphate, sulfate, alkalinity, water quality, dissolved oxygen, water temperature, and stream flow were summarized for each site in Table 4-4: Mean, minimum, and maximum values of water quality and habitat parameters for each monitoring site by season. The data were separated for each site by season, with winter being December, January, and February; spring being March, April, and May; summer being June, July, and August; and fall being September, October, and November. For each season, a mean was calculated, and the highest and lowest value for that season was also presented in the table (the maximum and minimum, respectively). Therefore, Table 4-5 provides a summary of the average readings for each site, as well as extremes that were observed for the data. In addition, an overall site mean for each parameter was provided for each site, as well as a standard deviation. In the following discussion of the data in Table 4-4, the seasonal site mean will be distinguished from the overall site mean. The mean, minimum, and maximum values for each parameter were compared to a standard value or the “criteria” value for that parameter. Refer to Table 4-4 for these values. Data that did not fall within the recommended criteria are indicated by a bolded value in Table 4-4. The standard deviation provides a measure of the variability of the data for each site. The monitoring sites had a range of three to 17 samples that were included in the data analysis. The mean (average) number of samples was 11.9; the median (50% of the data were above or below this value) was 13.5; and the mode (the value occurring the most often) was 16 samples. Due to the limited amount of data at some sites, an in-depth statistical analysis was not deemed appropriate at this point.

Pine Creek Watershed Assessment, Protection and Restoration Plan March 2005
Chapter 4: Water Quality 42
Table 4-4 Mean, minimum, and maximum values of water quality and habitat parameters for each monitoring site by season. (Bolded values did not meet the standard. See Table 4-3 for criteria standards.)
Site
107
3 16
Sam
ples
pH
Con
duct
ivity
(µ
S/cm
)
Phos
phat
e (m
g/L)
Sulfa
te
(mg/
L)
Alk
alin
ity
(mg/
L)
Wat
er Q
ualit
y Sc
ore
(Ben
thic
Sur
vey)
Dis
solv
ed O
xyge
n (m
g/L)
Wat
er T
emp
(deg
C)
Stre
am F
low
Vol
ume
(cm
s)
WIMean 7.2 1290 1.00 90 90 12 6 3.03WIMin 7.1 1290 1.00 80 60 11 5 3.03
Winter D,J,F
WIMax 7.3 1290 1.00 100 120 13 7 3.03SPMean 7.3 896 0.40 92 92 11 13 3.97SPMin 6.9 502 0.30 80 60 9 9 0.12
Spring M,A,M
SPMax 8.0 1041 0.50 100 120 14 16 10.27SUMean 7.6 854 1.03 78 102 9 20 1.78SUMin 7.2 616 0.10 68 80 8 14 0.80
Summer J,J,A
SUMax 8.1 1068 2.00 85 140 11 23 2.82FAMean 7.1 917 118 120 10 11 0.39FAMin 7.1 851 80 120 9 7 0.30Fall
S,O,N FAMax 7.1 996 150 160 11 15 0.49
Mean 7.4 933 0.82 91 101 10 14 2.27Standard Deviation 0.3 206 0.69 21 24 2 6 2.78

Pine Creek Watershed Assessment, Protection and Restoration Plan March 2005
Chapter 4: Water Quality 43
Site
110
8 16
Sam
ples
pH
Con
duct
ivity
(µ
S/cm
)
Phos
phat
e (m
g/L)
Sulfa
te
(mg/
L)
Alk
alin
ity
(mg/
L)
Wat
er Q
ualit
y Sc
ore
(Ben
thic
Sur
vey)
D
isso
lved
O
xyge
n (m
g/L)
Wat
er T
emp
(deg
C)
Stre
am F
low
Vo
lum
e (c
ms)
WIMean 8.0 1344 0.85 130 100 10 1 2.20WIMin 7.8 945 0.70 90 80 7 -1 2.09
Winter D,J,F
WIMax 8.2 1936 1.00 176 120 12 2 2.32SPMean 8.0 871 0.79 91 125 10 14 1.24SPMin 7.7 680 0.60 80 100 8 8 0.56
Spring M,A,M
SPMax 8.3 1097 1.10 100 140 12 18 2.04SUMean 7.7 795 0.79 95 132 30.6 8 19 1.00SUMin 7.3 615 0.60 80 120 8 17 0.46
Summer J,J,A
SUMax 8.4 1020 1.04 125 140 9 21 1.88FAMean 8.2 770 0.94 91 140 11 16 1.75FAMin 7.9 690 0.60 85 140 8 10 0.48Fall
S,O,N FAMax 8.4 850 1.40 98 140 13 21 3.35
Mean 7.9 922 0.85 100 126 30.6 10 14 1.42Standard Deviation 0.3 315 0.25 25 19 2 7 0.86
Site
110
9 16
Sam
ples
pH
Con
duct
ivity
(µ
S/cm
)
Phos
phat
e (m
g/L)
Sulfa
te
(mg/
L)
Alk
alin
ity
(mg/
L)
Wat
er Q
ualit
y Sc
ore
(Ben
thic
Sur
vey)
D
isso
lved
O
xyge
n (m
g/L)
Wat
er T
emp
(deg
C)
Stre
am F
low
Vo
lum
e (c
ms)
WIMean 7.9 1553 0.69 100 107 12 1 1.84WIMin 7.8 945 0.37 85 100 10 -1 1.38
Winter D,J,F
WIMax 8.0 1990 1.00 125 120 16 3 2.30SPMean 8.1 889 1.53 88 125 10 13 1.77SPMin 7.8 690 0.60 85 100 8 7 0.81
Spring M,A,M
SPMax 8.7 1075 2.00 90 140 12 17 2.73SUMean 7.9 747 0.83 100 124 30.4 8 20 2.04SUMin 7.3 611 0.70 80 120 6 18 1.08
Summer J,J,A
SUMax 8.6 942 1.02 125 140 9 22 2.82FAMean 8.1 793 0.77 85 130 9 14 1.44FAMin 7.3 712 0.58 80 100 7 10 0.85Fall
S,O,N FAMax 8.5 917 1.00 88 140 11 20 2.10
Mean 8.0 945 0.98 93 123 30.4 9 13 1.80Standard Deviation 0.4 381 0.54 16 16 2 7 0.70

Pine Creek Watershed Assessment, Protection and Restoration Plan March 2005
Chapter 4: Water Quality 44
Si
te 1
129
10 S
ampl
es
pH
Con
duct
ivity
(µ
S/cm
)
Phos
phat
e (m
g/L)
Sulfa
te
(mg/
L)
Alk
alin
ity
(mg/
L)
Wat
er Q
ualit
y Sc
ore
(Ben
thic
Sur
vey)
Dis
solv
ed
Oxy
gen
(mg/
L)
Wat
er T
emp
(deg
C)
Stre
am F
low
Vo
lum
e (c
ms)
WIMean 7.5 1802 0.23 100 110 14 1 0.31WIMin 7.1 1802 0.20 100 100 13 0 0.33
Winter D,J,F
WIMax 7.9 1802 0.26 100 120 14 1 0.39SPMean 8.7 1252 0.59 88 120 19.3 12 15 0.24SPMin 8.0 1142 0.28 80 100 9 14 0.12
Spring M,A,M
SPMax 9.7 1404 0.90 90 140 13 15 0.35SUMean 7.9 1081 0.52 113 130 9 19 0.54SUMin 7.7 997 0.52 100 100 7 18 0.23
Summer J,J,A
SUMax 8.1 1165 0.52 125 160 10 20 0.84FAMean 7.9 1032 1.40 100 120 16 12 11 0.16FAMin 7.3 1003 1.40 100 120 11 10 0.13Fall
S,O,N FAMax 8.4 1060 1.40 100 120 13 11 0.19
Mean 8.1 1226 0.59 98 120 17.65 11 12 0.31Standard Deviation 0.8 252 0.47 12 19 2 7 0.21
Site
115
0 15
Sam
ples
pH
Con
duct
ivity
(µ
S/cm
)
Phos
phat
e (m
g/L)
Sulfa
te
(mg/
L)
Alk
alin
ity
(mg/
L)
Wat
er Q
ualit
y Sc
ore
(Ben
thic
Sur
vey)
Dis
solv
ed
Oxy
gen
(mg/
L)
Wat
er T
emp
(deg
C)
Stre
am F
low
Vo
lum
e (c
ms)
WIMean 7.1 800 0.16 73 67 12 4 0.20WIMin 6.8 445 0.10 70 60 10 2 0.16
Winter D,J,F
WIMax 7.3 1080 0.20 75 80 13 7 0.24SPMean 7.6 592 0.29 67 60 12 11 0.55SPMin 7.4 468 0.26 60 60 45.2 10 9 0.26
Spring M,A,M
SPMax 7.8 792 0.36 75 60 13 14 0.85SUMean 7.6 592 0.34 67 80 9 18 0.61SUMin 7.3 430 0.20 60 20 8 16 0.09
Summer J,J,A
SUMax 8.1 693 0.50 75 120 10 22 2.16FAMean 7.6 609 67 90 30.3 11 11 0.15FAMin 7.4 596 63 80 10 6 0.14Fall
S,O,N FAMax 7.7 621 70 100 11 16 0.15
Mean 7.5 639 0.27 68 73 37.75 11 12 0.43Standard Deviation 0.3 184 0.12 6 25 2 6 0.52

Pine Creek Watershed Assessment, Protection and Restoration Plan March 2005
Chapter 4: Water Quality 45
Si
te 1
151
15 s
ampl
es
pH
Con
duct
ivity
(µ
S/cm
)
Phos
phat
e (m
g/L)
Sulfa
te
(mg/
L)
Alk
alin
ity
(mg/
L)
Wat
er Q
ualit
y Sc
ore
(Ben
thic
Sur
vey)
Dis
solv
ed
Oxy
gen
(mg/
L)
Wat
er T
emp
(deg
C)
Stre
am F
low
Vo
lum
e (c
ms)
WIMean 7.5 887 0.19 78 67 10 2 0.64WIMin 7.3 615 0.06 75 60 6 -2 0.37
Winter D,J,F
WIMax 7.7 1300 0.30 80 80 12 7 0.92SPMean 7.9 740 0.34 72 80 47.9 10 13 1.52SPMin 7.6 611 0.30 65 80 9 5 0.96
Spring M,A,M
SPMax 8.0 946 0.36 80 80 12 19 2.76SUMean 7.4 630 0.28 71 87 8 20 0.87SUMin 6.0 450 0.18 65 20 7 18 0.26
Summer J,J,A
SUMax 7.8 822 0.56 78 120 9 23 1.38FAMean 7.8 677 0.20 75 100 38.9 11 13 0.37FAMin 7.7 668 0.20 75 100 10 8 0.36Fall
S,O,N FAMax 7.8 686 0.20 75 100 11 17 0.38
Mean 7.6 715 0.27 73 83 43.4 9 14 0.96Standard Deviation 0.5 212 0.14 6 25 2 8 0.67
Site
115
3 11
sam
ples
pH
Con
duct
ivity
(µ
S/cm
)
Phos
phat
e (m
g/L)
Sulfa
te
(mg/
L)
Alk
alin
ity
(mg/
L)
Wat
er Q
ualit
y Sc
ore
(Ben
thic
Sur
vey)
Dis
solv
ed
Oxy
gen
(mg/
L)
Wat
er T
emp
(deg
C)
Stre
am F
low
Vo
lum
e (c
ms)
WIMean 7.3 1127 88 100 15 0 2.26WIMin 7.1 1127 80 100 15 0 1.72
Winter D,J,F
WIMax 7.4 1127 95 100 15 0 2.80SPMean 8.0 899 0.53 85 113 32.2 10 13 1.56SPMin 7.7 760 0.14 70 100 6 4 1.01
Spring M,A,M
SPMax 8.1 1041 0.46 100 120 14 17 2.03SUMean 7.7 846 0.20 83 110 9 20 2.21SUMin 7.2 811 0.20 81 100 8 18 1.56
Summer J,J,A
SUMax 8.1 880 0.20 85 120 8 21 2.86FAMean 7.6 848 0.95 85 113 11 13 1.54FAMin 7.5 824 0.90 80 100 10 9 0.92Fall
S,O,N FAMax 7.6 872 1.00 90 140 13 19 2.00
Mean 7.7 901 0.47 85 110 32.2 11 12 1.80Standard Deviation 0.4 115 0.43 9 14 3 8 0.62

Pine Creek Watershed Assessment, Protection and Restoration Plan March 2005
Chapter 4: Water Quality 46
Si
te 1
154
14 s
ampl
es
pH
Con
duct
ivity
(µ
S/cm
)
Phos
phat
e (m
g/L)
Sulfa
te
(mg/
L)
Alk
alin
ity
(mg/
L)
Wat
er Q
ualit
y Sc
ore
(Ben
thic
Sur
vey)
Dis
solv
ed
Oxy
gen
(mg/
L)
Wat
er T
emp
(deg
C)
Stre
am F
low
Vo
lum
e (c
ms)
WIMean 7.5 1470 0.04 65 78 14 1 2.80WIMin 7.3 1268 0.02 65 75 13 0 2.80
Winter D,J,F
WIMax 7.6 1672 0.06 65 80 14 1 2.80SPMean 7.1 924 0.04 74 68 11 13 8.60SPMin 6.9 783 0.04 71 50 11 4 4.00
Spring M,A,M
SPMax 7.3 1084 0.04 80 90 12 18 13.20SUMean 7.6 875 0.12 70 96 44.1 10 15 3.48SUMin 7.1 712 0.10 66 90 9 14 2.20
Summer J,J,A
SUMax 8.1 1086 0.16 80 115 11 20 5.83FAMean 7.6 835 0.12 79 95 26.5 11 10 2.86FAMin 7.1 749 0.08 75 85 10 5 2.30Fall
S,O,N FAMax 8.0 988 0.16 81 110 12 15 3.17
Mean 7.5 968 0.09 72 87 35.3 11 12 4.51Standard Deviation 0.4 275 0.05 6 17 1 7 2.88
Si
te 1
155
16 s
ampl
es
pH
Con
duct
ivity
(µ
S/cm
)
Phos
phat
e (m
g/L)
Sulfa
te
(mg/
L)
Alk
alin
ity
(mg/
L)
Wat
er Q
ualit
y Sc
ore
(Ben
thic
Sur
vey)
Dis
solv
ed
Oxy
gen
(mg/
L)
Wat
er T
emp
(deg
C)
Stre
am F
low
Vo
lum
e (c
ms)
WIMean 7.0 783 0.06 53 60 15 0 2.70WIMin 6.7 719 0.06 50 60 14 0 2.70
Winter D,J,F
WIMax 7.3 847 0.06 55 60 15 0 2.70SPMean 6.6 525 0.04 54 58 11 10 4.27SPMin 6.1 438 0.04 53 40 9 3 1.80
Spring M,A,M
SPMax 6.3 567 0.04 55 80 13 17 8.21SUMean 7.3 588 0.09 54 84 40.9 9 17 2.54SUMin 6.8 506 0.08 50 75 9 14 0.85
Summer J,J,A
SUMax 7.9 702 0.12 65 95 11 19 5.18FAMean 7.3 538 0.13 53 75 24.3 11 11 2.05FAMin 6.8 441 0.06 50 60 9 4 0.89Fall
S,O,N FAMax 7.7 631 0.24 55 90 12 14 3.00
Mean 7.1 584 0.10 54 72 32.6 11 12 2.88Standard Deviation 0.5 119 0.06 4 16 2 6 2.00

Pine Creek Watershed Assessment, Protection and Restoration Plan March 2005
Chapter 4: Water Quality 47
Si
te 1
172
13 S
ampl
es
pH
Con
duct
ivity
(µ
S/cm
)
Phos
phat
e (m
g/L)
Sulfa
te
(mg/
L)
Alk
alin
ity
(mg/
L)
Wat
er Q
ualit
y Sc
ore
(Ben
thic
Sur
vey)
Dis
solv
ed
Oxy
gen
(mg/
L)
Wat
er T
emp
(deg
C)
Stre
am F
low
Vo
lum
e (c
ms)
WIMean 7.7 453 73 100 14 2 0.33WIMin 7.4 380 70 80 12 1 0.17
Winter D,J,F
WIMax 8.1 515 80 120 16 3 0.77SPMean 7.8 394 67 100 10 15 0.09SPMin 7.4 230 65 80 9 10 0.05
Spring M,A,M
SPMax 8.1 515 70 140 12 19 0.13SUMean 8.3 554 73 153 27.3 10 20 0.06SUMin 7.4 230 65 120 8 17 0.02
Summer J,J,A
SUMax 8.4 640 75 180 10 23 0.09FAMean 8.1 582 68 180 11 11 0.03FAMin 7.8 500 65 140 10 7 0.01Fall
S,O,N FAMax 8.3 644 70 200 12 14 0.06
Mean 7.9 475 70 132 27.3 11 12 0.13Standard Deviation 0.4 132 5 43 2 7 0.22
Site
117
3 13
Sam
ples
pH
Con
duct
ivity
(µ
S/cm
)
Phos
phat
e (m
g/L)
Sulfa
te
(mg/
L)
Alk
alin
ity
(mg/
L)
Wat
er Q
ualit
y Sc
ore
(Ben
thic
Sur
vey)
Dis
solv
ed
Oxy
gen
(mg/
L)
Wat
er T
emp
(deg
C)
Stre
am F
low
Vo
lum
e (c
ms)
WIMean 7.3 908 78 80 13 3 WIMin 7.1 686 75 80 12 2
Winter D,J,F
WIMax 7.4 1130 80 80 13 4 SPMean 7.7 741 85 87 12 10 SPMin 7.6 390 75 80 10 2
Spring M,A,M
SPMax 7.8 990 100 100 14 18 SUMean 8.2 704 80 110 9 21 SUMin 7.8 310 65 100 7 19
Summer J,J,A
SUMax 8.8 836 100 120 11 23 FAMean 8.7 902 85 113 9 15 FAMin 8.6 837 75 100 6 7 Fall
S,O,N FAMax 8.8 977 100 120 12 22
Mean 8.0 790 82 100 10 14 Standard Deviation 0.5 225 11 17 2 8
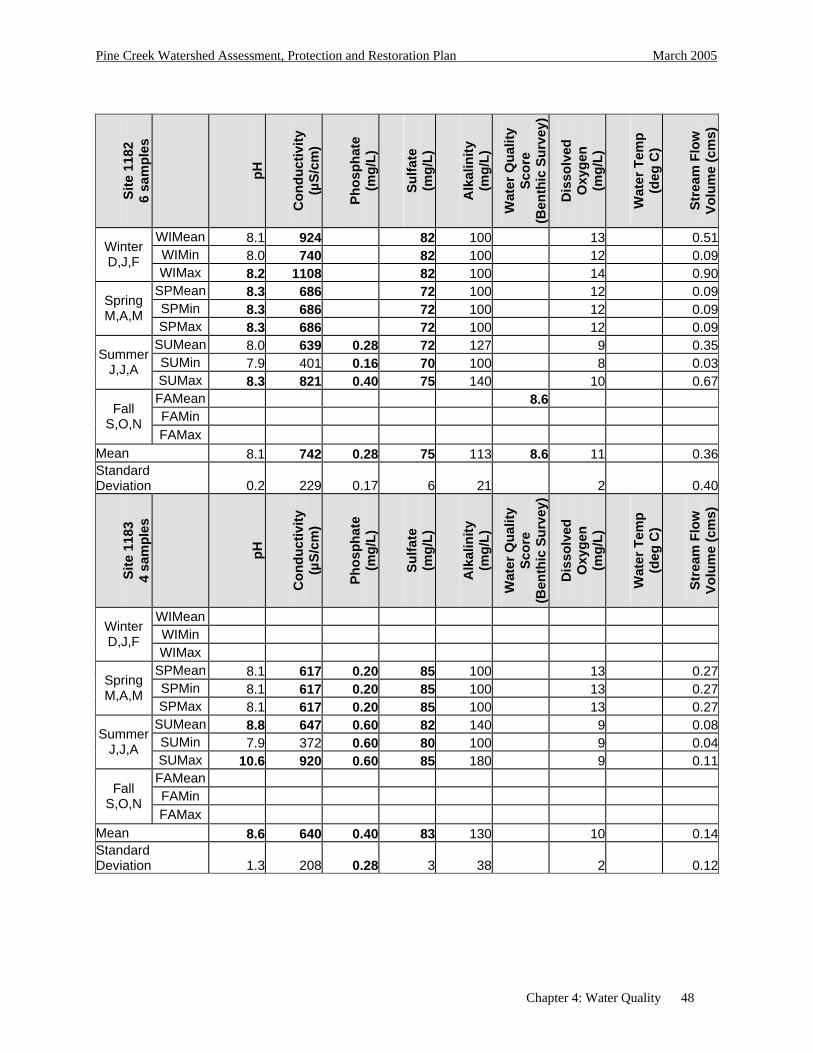
Pine Creek Watershed Assessment, Protection and Restoration Plan March 2005
Chapter 4: Water Quality 48
Si
te 1
182
6 sa
mpl
es
pH
Con
duct
ivity
(µ
S/cm
)
Phos
phat
e (m
g/L)
Sulfa
te
(mg/
L)
Alk
alin
ity
(mg/
L)
Wat
er Q
ualit
y Sc
ore
(Ben
thic
Sur
vey)
Dis
solv
ed
Oxy
gen
(mg/
L)
Wat
er T
emp
(deg
C)
Stre
am F
low
Vo
lum
e (c
ms)
WIMean 8.1 924 82 100 13 0.51WIMin 8.0 740 82 100 12 0.09
Winter D,J,F
WIMax 8.2 1108 82 100 14 0.90SPMean 8.3 686 72 100 12 0.09SPMin 8.3 686 72 100 12 0.09
Spring M,A,M
SPMax 8.3 686 72 100 12 0.09SUMean 8.0 639 0.28 72 127 9 0.35SUMin 7.9 401 0.16 70 100 8 0.03
Summer J,J,A
SUMax 8.3 821 0.40 75 140 10 0.67FAMean 8.6 FAMin Fall
S,O,N FAMax
Mean 8.1 742 0.28 75 113 8.6 11 0.36Standard Deviation 0.2 229 0.17 6 21 2 0.40
Site
118
3 4
sam
ples
pH
Con
duct
ivity
(µ
S/cm
)
Phos
phat
e (m
g/L)
Sulfa
te
(mg/
L)
Alk
alin
ity
(mg/
L)
Wat
er Q
ualit
y Sc
ore
(Ben
thic
Sur
vey)
Dis
solv
ed
Oxy
gen
(mg/
L)
Wat
er T
emp
(deg
C)
Stre
am F
low
Vo
lum
e (c
ms)
WIMean WIMin
Winter D,J,F
WIMax SPMean 8.1 617 0.20 85 100 13 0.27SPMin 8.1 617 0.20 85 100 13 0.27
Spring M,A,M
SPMax 8.1 617 0.20 85 100 13 0.27SUMean 8.8 647 0.60 82 140 9 0.08SUMin 7.9 372 0.60 80 100 9 0.04
Summer J,J,A
SUMax 10.6 920 0.60 85 180 9 0.11FAMean FAMin Fall
S,O,N FAMax
Mean 8.6 640 0.40 83 130 10 0.14Standard Deviation 1.3 208 0.28 3 38 2 0.12

Pine Creek Watershed Assessment, Protection and Restoration Plan March 2005
Chapter 4: Water Quality 49
Si
te 1
190
3 sa
mpl
es
pH
Con
duct
ivity
(µ
S/cm
)
Phos
phat
e (m
g/L)
Sulfa
te
(mg/
L)
Alk
alin
ity
(mg/
L)
Wat
er Q
ualit
y Sc
ore
(Ben
thic
Sur
vey)
Dis
solv
ed
Oxy
gen
(mg/
L)
Wat
er T
emp
(deg
C)
Stre
am F
low
Vo
lum
e (c
ms)
WIMean WIMin
Winter D,J,F
WIMax SPMean 8.6 380 0.65 78 25 12 20 0.08SPMin 8.3 344 0.30 75 25 11 20 0.08
Spring M,A,M
SPMax 8.8 416 1.00 80 25 13 20 0.08SUMean 8.4 420 0.10 75 120 9 20 0.08SUMin 8.4 420 0.10 75 120 9 20 0.08
Summer J,J,A
SUMax 8.4 420 0.10 75 120 9 20 0.08FAMean FAMin Fall
S,O,N FAMax
Mean 8.5 393 0.47 77 57 11 20 0.08Standard Deviation 0.3 43 0.47 3 55 2 0 0.00
Site
119
1 5
sam
ples
pH
Con
duct
ivity
(µ
S/cm
)
Phos
phat
e (m
g/L)
Sulfa
te
(mg/
L)
Alk
alin
ity
(mg/
L)
Wat
er Q
ualit
y Sc
ore
(Ben
thic
Sur
vey)
Dis
solv
ed
Oxy
gen
(mg/
L)
Wat
er T
emp
(deg
C)
Stre
am F
low
Vo
lum
e (c
ms)
WIMean WIMin
Winter D,J,F
WIMax SPMean 8.5 729 0.32 92 88 12 19 0.22SPMin 8.3 665 0.14 86 35 10 18 0.05
Spring M,A,M
SPMax 8.7 792 0.50 97 140 13 20 0.38SUMean 8.5 637 0.45 117 112 11 19 0.24SUMin 8.2 506 0.25 97 35 10 18 0.08
Summer J,J,A
SUMax 8.7 740 0.60 157 160 12 20 0.54FAMean FAMin Fall
S,O,N FAMax
Mean 8.5 674 0.40 107 102 11 19 0.23Standard Deviation 0.2 108 0.19 28 62 1 1 0.22

Pine Creek Watershed Assessment, Protection and Restoration Plan March 2005
Chapter 4: Water Quality 50
Si
te 1
212
17 s
ampl
es
pH
Con
duct
ivity
(µ
S/cm
)
Phos
phat
e (m
g/L)
Sulfa
te
(mg/
L)
Alk
alin
ity
(mg/
L)
Wat
er Q
ualit
y Sc
ore
(Ben
thic
Sur
vey)
Dis
solv
ed
Oxy
gen
(mg/
L)
Wat
er T
emp
(deg
C)
Stre
am F
low
Vo
lum
e (c
ms)
WIMean 8.0 680 90 100 12 3 0.12WIMin 8.0 680 90 100 12 3 0.12
Winter D,J,F
WIMax 8.0 680 90 100 12 3 0.12SPMean 7.9 671 0.10 76 106 13 11 0.18SPMin 6.7 550 0.10 65 80 9 9 0.08
Spring M,A,M
SPMax 9.2 810 0.10 80 160 17 14 0.34SUMean 7.6 624 76 136 9 22 0.15SUMin 7.2 540 70 120 7 19 0.03
Summer J,J,A
SUMax 8.1 697 80 160 10 24 0.28FAMean 7.2 713 87 140 9 15 0.10FAMin 7.1 710 74 100 8 10 0.00Fall
S,O,N FAMax 7.3 720 120 160 10 18 0.23
Mean 7.7 667 0.10 80 122 11 15 0.15Standard Deviation 0.8 90 12 29 3 6 0.10 3. Discussion of Results Temperature and Dissolved Oxygen – Since temperature and dissolved oxygen are inversely related, the data trends for both of these parameters will be discussed together. Temperature The PA Lake Management Society criteria table provides values of up to 19 deg C (66 deg F) for Cold Water Fisheries (CWF) and 30.5 deg C (87 deg F) for Warm Water Fisheries (WWF). These criteria simplify the analysis for temperature since the Pine Creek Watershed data show temperatures in the lower ranges. The seasonal mean water temperature exceeded the criteria of 19 deg C at seven sites: 1212, 1073, 1109, 1151, 1153, 1172, and 1173. All of these readings were in the summer months (June, July, and August). The highest seasonal mean exceedance, 22 deg C, was at site 1212. This site also had the highest overall maximum temperature of 24 deg C. During the data review process, the water temperature data appeared to be questionable for Sites 1182, 1183, 1190, and 1191, so they were not included. The inaccurate readings were due to broken thermometers. The 25 Pennsylvania Code §93.9 Drainage List U for the Ohio River Basin in Pennsylvania lists the following protected water uses for the Pine Creek Basin (Watershed):
• from the source (headwaters) to the North Park Lake Dam, classified as a Cold Water Fishery (CWF)

Pine Creek Watershed Assessment, Protection and Restoration Plan March 2005
Chapter 4: Water Quality 51
• from the North Park Lake Dam to the Mouth (Allegheny River), classified as a Trout Stocked Fishery (TSF).
These classifications result in special criteria for dissolved oxygen and water temperature for these areas of the watershed to maintain the health of aquatic organisms. The Pennsylvania Code provides monthly temperature criteria for CWF and TSF, and a more detailed comparison could be performed using these criteria. For example, the Pennsylvania Code criteria for the months of June through August designates a temperature range from 15 to 19 deg C (60 to 66 deg F) for CWF, and 21 to 30.5 deg C (70 to 87 deg F) for TSF. The data review did not take into account these protected water uses for the Pine Creek Watershed. The Pine Creek Watershed Assessment Committee may wish to contact State regulatory agencies to discuss in detail these water uses and how they impact the criteria for water quality for specific areas to maintain and improve habitat for these special uses. However, use of the Pennsylvania Code criteria may not be necessary since exceedances in water temperature did not appear to be unreasonably high or frequent, perhaps due to cooler than average summers during the monitoring period. See Appendix B. Map-2, Pine Creek Watershed Sampling Locations – Mean Water Temperature, 2002-2004 shows no discernable pattern of water temperatures in the watershed. However, future studies of land use in the Pine Creek Watershed may provide additional information on the potential relationships between land use and water temperature, particularly relevant for those areas showing exceedances of the criteria. It should be noted that temperature data were available only for spring and summer seasons for Site 1191 – thus the high temperature values on this figure for this site. Dissolved Oxygen None of the samples from the Pine Creek Watershed Assessment showed low levels of dissolved oxygen (below 4 mg/L, as specified by the criteria). According to the PA Lake Management criteria, levels of 8 ppm (mg/L) of dissolved oxygen is better. Seasonal minimum readings below 8 ppm were found at sites 1212, 1173, 1151, 1153, 1109, 1129, and 1108. These readings were from all seasons, and ranged from 6 to 7 mg/L. Seasonal dissolved oxygen levels at monitoring sites did not appear to be unreasonably low, perhaps due to cooler than average summers during the monitoring period. Dissolved oxygen levels that did not fall within the standards (by site and season) corresponded with temperature exceedances at five sites: 1212, 1173, 1151, 1109, and 1129. Lower dissolved oxygen (overall site means of 9 mg/L) at Sites 1109 and 1151 are apparent in Map 4-3, Pine Creek Watershed Sampling Locations – Mean Dissolved Oxygen, 2002-2004. The Pennsylvania Code provides dissolved oxygen criteria that range from a minimum of 4.0 mg/L to 6.0 mg/L, depending on the special use (CWF or TSF) and time of the year. All of the stream samples in the Pine Creek Watershed had dissolved oxygen levels of 6.0 mg/L and above, thereby meeting these criteria. pH – Only four sites met the recommended criteria. Two sites showed readings on the low end of the pH scale (acid) – they were Sites 1155 (which had a minimum reading of 6.1) and Site

Pine Creek Watershed Assessment, Protection and Restoration Plan March 2005
Chapter 4: Water Quality 52
1151 (which had a minimum reading of 6.0). Neither site shows consistently low pH, however, as the overall site means were neutral (pH 7.1 at Site 1155) or slightly alkaline (pH 7.6 at Site 1151). The following sites had high (alkaline) maximum and/or seasonal mean readings: 1212, 1191, 1182, 1183, 1190, 1172, 1173, 1109, 1129, and 1108. The highest seasonal mean reading, 10.6, was at Site 1183, which also had the highest overall site mean pH of 8.6. High pH can stress the physiological systems of most organisms and reduce reproduction. These changes in acidity can be caused by surrounding rock or certain wastewater discharges. For example, a stream in a geographic area containing limestone will have a high alkalinity. Additional studies should be performed at the following sites to determine the reasons for high pH: Site 1191 (overall site mean pH 8.5), Site 1183 (overall site mean pH 8.6), and Site 1190 (overall site mean pH 8.5). Alkalinity – All alkalinity data met the criteria, indicating a good buffering capacity in the streams in the Pine Creek Watershed. The alkalinity data (all readings were 20 mg/L and above) were consistent with the high pH readings documented at most of the monitoring sites. Sulfate – The monitoring data showed consistent exceedances of the sulfate criteria throughout the watershed (readings greater than 50 mg/L). Site 1191 had notably high levels of sulfate: it had an overall site mean sulfate level of 107 mg/L and a seasonal maximum reading of 157 mg/L. As sulfates in the form of sulfuric acid enter streams they can decrease the pH of the body of water. Therefore, it would be expected that these high sulfate levels would be associated with low pH at these sites. However, as discussed above, stream samples throughout the watershed were generally found to be alkaline. In fact, the site with the highest sulfate reading, Site 1191, had fairly alkaline water, with an overall site mean pH of 8.5. Streams can conceivably have a non-acidic sulfate source, which may be the case in Pine Creek. Additional studies would be of interest on the effects (if any) of these levels of sulfate on aquatic organisms, as well as the source(s) of the sulfate in the Pine Creek watershed. Phosphate – While phosphate data was completed for only 14 sites and was done intermittently for some sites, phosphate levels were consistently high at almost all tested sites. Only Sites 1154, 1155, and 1212 did not have overall site means that exceeded the phosphate criteria of 0.1 mg/L. Refer to Map 4-4, Pine Creek Watershed Sampling Locations - Mean Total Phosphorus Levels, 2002-2004. The site with the highest mean phosphate level was Site 1109, with an overall site mean of 0.98 mg/L. The phosphate and conductivity data were plotted by month for this site for comparison (Figure 4-1), since values for both parameters at this site were high. Phosphorus levels appeared to peak in March and May at this site, with levels of 2.0 mg/L. Two samples were obtained in September 2003. The sample on 9/3/03 had a phosphate reading of 0.58 mg/L, and the sample on 9/28/03 has a reading of 1.0 mg/L. During the data review process, some phosphate data appeared to be questionable for Sites 1073, 1109, 1139, 1153, 1172, 1187, and 1172 so they were not included. The inaccurate readings

Pine Creek Watershed Assessment, Protection and Restoration Plan March 2005
Chapter 4: Water Quality 53
(which were determined to be any reading above 2.0 mg/L) were probably due to the phosphate levels not being divided by 50 as the final step in field recording of the phosphate levels, as specified in the sampling procedure. However, even with these data eliminated, there is a clear trend of high phosphate levels in the Pine Creek Watershed. Map 4-4 clearly shows high phosphate levels at sites 1108, 1109, and 1073 on Pine Creek. No data were available for Site 1173; phosphate data for this site should be obtained to determine if levels of phosphate continue to increase downstream in the watershed. Since even small increases in phosphate can accelerate eutrophication and cause a decrease in dissolved oxygen, further investigation should be performed to determine the source of phosphate in the watershed. Note that comparatively low dissolved oxygen at Site 1109 is immediately apparent in Map 4-3 Pine Creek Watershed Sampling Locations – Mean Dissolved Oxygen, 2002-2004. Sources of phosphate may include soil and rocks, wastewater treatment plants, runoff from fertilized lawns and cropland, failing septic systems, and runoff from animal manure storage areas. Many of the potential sources of phosphate can also contribute nitrate to streams. However, the nitrate data from the Pine Creek Watershed water monitoring was determined to be unusable during the data review process. Inconsistencies were found in the nitrate data reporting due to difficulties that the monitors had in interpreting and reporting nitrate monitoring results (which are based on a colormetric scale). Information on nitrate levels in the watershed would be extremely useful, and it is recommended that they be determined in future stream monitoring. Conductivity - Conductivity was consistently high at almost all the monitoring sites. For the overall site means, only Sites 1172 and 1190 did not exceed the conductivity criteria of 500 µS/cm. Refer to Map 4-5, Pine Creek Sampling Locations - Mean Conductivity, 2002 -2004. The Site with the highest mean conductivity was Site 1129, with an overall site mean level of 1226 µS/cm. Conductivity of most sites was considerably higher in winter months, which may correlate to road salt applications. Further testing is necessary to examine this relationship. The conductivity data (in comparison with phosphate data) were plotted by month for Site 1109 (Figure 4-1). Conductivity appeared to peak in January at this site, with levels of 1990 µS/cm. During the data review process, some of the phosphate data obtained at this site were determined to be questionable, and were not used (refer to the section on “Phosphate,” above.). Therefore, a complete visual graphical representation comparing phosphate levels and conductivity for each monitoring session at Site 1109 could not be made. With additional conductivity and phosphate/nitrate data, this relationship could be investigated further. Map 4-5 Pine Creek Watershed Sampling Locations – Mean Water Conductivity, 2002-2004 shows no discernable pattern of conductivity levels in the watershed. However, future studies of land use in the Pine Creek Watershed may provide additional information on the potential relationships between land use and conductivity. Salts spread on icy roads could raise conductivity in stream samples due to the presence of ionized materials washing into the nearest waterway. A failing sewage system could also raise conductivity due to the presence of chloride, phosphate, and nitrate. Phosphates and nitrates are also components of commercial fertilizers. Streams that run through areas with clay soils tend to

Pine Creek Watershed Assessment, Protection and Restoration Plan March 2005
Chapter 4: Water Quality 54
have higher conductivity because of the presence of the materials that ionize when washed into the water. Therefore, additional studies that explore the relationship between conductivity and streams with high nitrate and/or phosphate levels, versus conductivity and streams with high clay content would be of interest. Stream Flow Volume - No criteria were found for stream flow volume; however, this information provides a relative measure of the stream flow at the monitoring sites. Stream flow volumes at each site can be compared between monitoring sessions for that site to see the degree of variability and peaks of flow. Since this value is an estimate, it is most effective at showing large variations in flow, such as at Site 1073, where the stream flow volume ranged from a minimum of 0.12 cms to 10.27 cms, and Site 1155, where the stream flow volume ranged from a minimum of 0.85 cms to a maximum of 8.21 cms. Large variations in flow may indicate areas receiving large volumes of stormwater runoff, during/following specific storm events. A comparison of the variation in stream flow volume with recorded rainfall data may be useful in understanding storm runoff and the impact to floodways and stream encroachments. The maximum reading at Site 1155 occurred in April 2004, and the only parameters that exceeded the criteria during that monitoring session was pH, with a reading of 6.1 and sulfate at 55 mg/L. Site 1073’s maximum reading stream flow volume was in April 2004; and the other criteria exceeded during this monitoring session was for conductivity, at 1041 µS/cm, and sulfate at 100 mg/L.
Water Quality Score – Benthic surveys and the resultant water quality scores were available for 10 of the 16 monitoring sites. Site 1151 received a “good” score for water quality, while Site 1182 received a “poor” score. The other eight sites were determined to have “fair” water quality. The overall site mean chemical and physical water quality parameters for the site rated “good” were compared with those from the site rated “poor,” and they were found to be similar for most parameters (see Table 4-5). The mean pH was higher at Site 1182 which received a “poor” score for water quality (8.1 vs. 7.6 at Site 1151). In addition, the mean stream flow was lower at Site 1182 (0.36 cms vs. 0.96 cms at Site 1151). Since the benthic survey is more subjective than the tests for chemical and physical water quality parameters, and results may vary based on the individuals conducting the test, it is not possible to conclude definitively that Site 1182 has poor water quality, and/or that higher pH and lower stream flow is the causative factors.
4. Summary and Conclusion of Data Analysis Based on a comparison of the water monitoring data with the criteria selected by Collective Efforts for this initial analysis, it appears that the following physical and chemical water quality results are within acceptable criteria ranges at the sites monitored in the Pine Creek Watershed: temperature, dissolved oxygen, and alkalinity. Additional water quality studies are recommended for those chemical parameters that did not meet their respective criteria. These parameters included pH, conductivity, phosphate, and sulfate. Additional studies should include a review of the local geology to determine the relative influence of the region’s soils and rocks on the conductivity and sulfate, versus the impact of human activities and land use. Nitrate levels should be determined for the streams in the watershed. It is recommended that water monitors obtain duplicate water samples from sites having high phosphate, nitrate, and conductivity results. These duplicate water samples should then be sent to an environmental laboratory for analysis. This would provide more information on which chemical constituents are contributing to the high conductivity. In addition, the lab

Pine Creek Watershed Assessment, Protection and Restoration Plan March 2005
Chapter 4: Water Quality 55
results should be compared to the field results to provide a confirmation of the field results. Laboratory analysis of water samples (which were collected according to the appropriate protocols) provide a higher level of confidence in the results due to a more controlled environment for analysis and standardized procedures. Finally, a comparison of water monitoring data for selected sites both before and during wet weather events would also be of interest, potentially including sampling for E. coli, a pathogen found in sewage. Benthic macroinvertebrate studies by an expert would also be of interest, particularly for those sites reporting “poor” or “good” water quality scores.
The development of the criteria table was based on an evaluation of available criteria for stream water quality. Since the criteria values sometimes differed from source to source for the same parameter, criteria for the Pine Creek Watershed Assessment had to be determined based on professional judgment. Review and refinement of the criteria should be an on-going process as new information becomes available from water quality studies. It is important to note that environmental and geological conditions will vary by region, and require consideration when establishing the criteria. In addition, not only the individual chemical and physical parameters, but also the interaction of these parameters will affect the habitat of the aquatic organisms. These interactions are extremely complex and will impact the adaptations that aquatic organisms will make to select and/or survive in a particular habitat. Additional research would be of interest to determine which parameter(s) has (have) the most influence on the health of streams, and how the different chemical and physical properties interact to affect aquatic organisms. The data evaluation process completed for this analysis noted inconsistencies in the water monitoring procedures/data reporting for some of the parameters. Nitrate was the most notable case, as none of the field data could be used in the data trend analysis. The colors for the field test results were difficult for the monitors to read and resulted in questionable recorded data. In the phosphate test, the final step in calculating and reporting test results may have been inadvertently omitted by field monitors, resulting in reported data which greatly exceeded expected test results. Finally, some of the temperature data had to be omitted due to broken thermometers used at the stream sites, which was noted and removed by data reviewers when they noted water temperatures that did not vary by season as expected, or temperatures reported that were below freezing. With these monitoring issues resolved and the collection of additional data for each site, the next set of data and the analysis should provide a more comprehensive picture of the water quality and aquatic health in the Pine Creek Watershed. Land use has a major impact on the chemical and physical characteristics of a stream, and hence the stream quality. The water quality monitoring teams provided an estimate by percentage of the predominant surrounding land use (wetlands, forest, cropland, pasture, residential, commercial, industrial, unused/abandoned, overgrown – shrubs/small trees, and other) for each monitoring site. Since the land use data were estimates and could not take into account important land uses that were out of visual range at the monitoring site, these data were not used in the data trend analysis. It would be of interest to develop a standardized determination of land uses immediately upstream of each monitoring site (perhaps using LANDSAT satellite imaging or other current regional data) to determine how land use may be related to the chemical and physical characteristics of the stream, and hence the water quality.

Pine Creek Watershed Assessment, Protection and Restoration Plan March 2005
Chapter 4: Water Quality 56
D. Other Resources An addition to the data collected for this Watershed Assessment, other sources for stream conditions or water quality include the following: Creek Connections is a project of Allegheny College that works with regional K-12 schools to emphasize a hands-on inquiry-based investigation of local waterways. Classes from North Hills High School and Letsche High School monitor three sites along Pine Creek. Visit http://creekconnections.allegheny.edu/ for more information. ALLARM or Alliance for Aquatic Resource Monitoring is a project of the Environmental Studies Department at Dickinson College that works with local groups to develop watershed-based water quality monitoring programs. There is one active site and several inactive sites from Pine Creek. Visit http://www.dickinson.edu/allarm/ for more information. The U.S. Geological Survey maintains a real time flow gauge on Little Pine Creek. Visit http://waterdata.usgs.gov/pa/nwis to view data for the past month. The 3 Rivers Wet Weather Demonstration Project maintains an online rainfall database for the region. Visit http://www.3riverswetweather.org for details Three Rivers 2nd Nature (3r2n), a project of the Carnegie Mellon University’s College of Fine Arts, addresses water quality issues within the three rivers and 53 streams in Allegheny County. Their reports are available on their website http://3r2n.cfa.cmu.edu. Information from these sources was not included in the analysis.

Pine Creek Watershed Assessment, Protection and Restoration Plan March 2005
Chapter 4: Water Quality 57
Site Numbers and Common Descriptions 1173 Etna outflow at the junction of Rt. 8 and Rt. 28 next to Hudak Auto Sales 1108 Bryant Rd. about 3/10 of a mile north of Duncan Ave. at old rail road trestle 1109 Duncan Ave. behind fire hall 1129 Off McElheny Rd. adjacent to soccer field 1150 Near the North Park ice skating rink. Near Kummer Rd. 1151 Wildwood Rd. near Best Feeds store 1153 Pine Creek behind laundromat in Etna. Near intersection of Grant Ave. and Dewey St. 1154 Pine Creek by tennis courts in Devlin Park, Grubbs Rd., beside Municipal Bldg. 1155 Montour Run 25 yards upstream from bridge at intersection of Wildwood Rd. and Hardt Rd. 1172 East Branch of Little Pine Creek along Saxonburg Blvd. at Five Acres Dr. 1073 Opposite Glenshaw Valley Presbyterian Church, Butler Plank Rd. 1182 Off Wexford Run Road, south of the Grey Oaks development 1183 Near corner of intersection of Pine Creek Road and Brandt School Rd. (Private Property) 1190 Behind Etna ball field where West Little Pine enters Pine 1191 Downstream from bridge crossing Wickline Rd., near Depreciation Land Museum 1212 Bottom of Saxonburg Blvd. behind the law offices

Pine Creek Watershed Assessment, Protection and Restoration Plan March 2005
Chapter 4: Water Quality 58

Pine Creek Watershed Assessment, Protection and Restoration Plan March 2005
Chapter 4: Water Quality 59

Pine Creek Watershed Assessment, Protection and Restoration Plan March 2005
Chapter 4: Water Quality 60
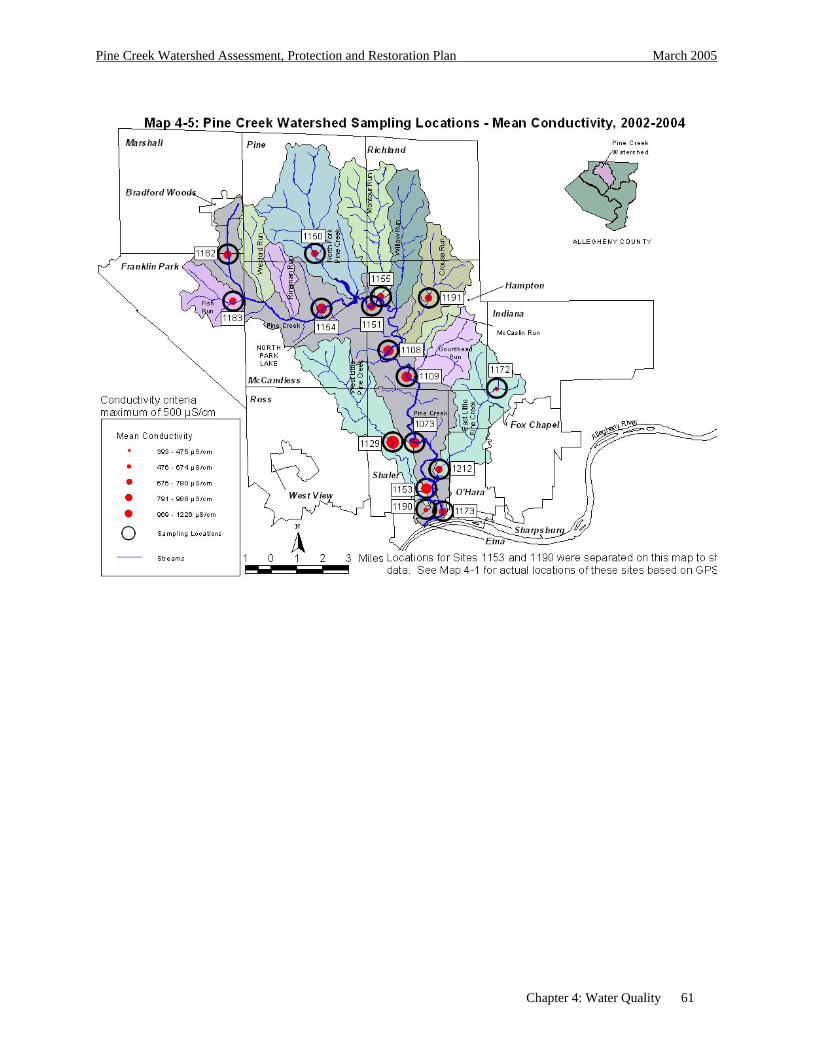
Pine Creek Watershed Assessment, Protection and Restoration Plan March 2005
Chapter 4: Water Quality 61

Pine Creek Watershed Assessment, Protection and Restoration Plan March 2005
Chapter 4: Water Quality 62
Figure 4-1
Comparison of Conductivity and Total Phosphorus Pine Creek Watershed Assessment Monitoring Site 1109
0100200300400500600700800900
100011001200130014001500160017001800190020002100
May
-03
Jun-
03
Jul-0
3
Aug-
03
Sep-
03
Oct
-03
Nov
-03
Dec
-03
Jan-
04
Feb-
04
Mar
-04
Apr
-04
May
-04
Jun-
04
Jul-0
4
Aug-
04Months
Mea
n C
ondu
ctiv
ity (u
S/cm
)
0
0.5
1
1.5
2
2.5
Mea
n To
tal P
hosp
horu
s (m
g/L)
ConductivityPhosphorous

Chapter Five
Land Use

Pine Creek Watershed Assessment, Protection and Restoration Plan March 2005
Chapter 5: Land Use 63
A. Land Use 1. A Land Use Inventory Chapter 2 described the close relationship between land use and water quality and quantity. Land use is typically controlled by local land use policy. However, the Pine Creek watershed spans multiple local jurisdictions with varied policies. To inventory the land use practices and policies within the Pine Creek watershed, a Land Use Subcommittee mailed a survey to each municipality. The survey was modeled after the Watershed Protection Audit, developed by the Center for Watershed Protection.1 The Land Use Subcommittee modified the Center’s Audit to create the Watershed Assessment Inventory, a survey that appears in Appendix F. All municipalities received the survey by mail, and 13 of the 14 municipalities within the watershed returned the surveys along with supplemental information. The Committee received a wealth of information from the communities. The information was tabulated and entered into a Geographic Information System (GIS) that was returned to all of the municipalities. Tabulated results appear in Appendix G.2 Both the Audit and the Inventory are designed to gather information related to the Eight Tools of Watershed Protection:
Table 5.1 Tools of Watershed Protection3
1. Watershed Planning The application of regulatory measures and/or planning techniques that are designed to maintain or limit future impervious cover, redirect development where appropriate, and protect sensitive areas.
2. Land Conservation Programs or efforts to conserve undeveloped, sensitive areas or areas of particular historic or cultural value.
3. Aquatic Buffers The protection, restoration, creation, or reforestation of stream, wetland, and urban lake buffers.
4. Better Site Design Local ordinances and codes incorporate techniques to reduce impervious cover and/or redirect runoff onto pervious surfaces in the design of new development and redevelopment projects.
5. Erosion and Sediment Control The use of erosion control, sediment control, and dewatering practices at all new development and redevelopment sites.
6. Stormwater BMPs The incorporation of structural practices into new development, redevelopment, or the existing landscape to help mitigate the impacts of
1 The Center for Watershed Protection (Center) is a non-profit watershed organization located in Ellicott City, Maryland. The mission of the Center is to provide local governments, activists, and watershed organizations with technical tools for protecting streams, lakes, and rivers. www.cwp.org 2 Results are accurate as of May 2004. 3 Do-It-Yourself Watershed Planning Kit, Center for Watershed Protection, www.cwp.org

Pine Creek Watershed Assessment, Protection and Restoration Plan March 2005
Chapter 5: Land Use 64
urbanization and stormwater runoff on receiving waters.
7. Non-stormwater discharges Locating, quantifying, and controlling non-stormwater pollutant sources in the watershed. Operation and maintenance practices that prevent or reduce pollutants entering the municipal or natural drainage system.
8. Watershed Stewardship Programs Stormwater and watershed education or outreach programs targeted towards fostering human behavior that prevents or reduces pollution over a range of land uses and activities.
2. Land Use Inventory Report4 The Land Use Subcommittee reviewed the survey responses and supplemental information to look for noteworthy examples of policies that supported watershed protection. The Subcommittee decided that the most important protection controls to water quality and quantity are stormwater controls and the protection of floodplains, steep slopes, and vegetation, particularly riparian vegetation; therefore, particular attention was paid to questions related to these topics. Committee observations appear in the following paragraphs.
Handbook for Municipal Officials An excellent tool for municipalities is the publication Improving Local Development Regulations: A Handbook for Municipal Officials (Allegheny County Handbook), prepared by the Allegheny County Department of Planning in May 1993. Although the publication was produced more than a decade ago, the first chapter contains model environmental protection and hazard control regulations that are still valid today. However, recent studies have shown the major importance of headwater streams in controlling both water quality and quantity; therefore ordinances should protect these small watercourses as well as the perennial streams. See Chapter 2 for more information about headwater streams.
Geographic Information Systems (GIS) GIS can be a very effective tool in the planning and regulatory process. Having environmentally important lands delineated and mapped and having the maps available at all board or council meetings when land development plans are to be discussed is very important in the decision making process. However, some municipalities do not have their environmentally critical lands or their open space and/or recreation lands on their GIS, and a few communities do not have GIS available. Fox Chapel and Ross seem to have the most complete environmental information available on their GIS. 4 Inventory and ordinance review and analysis completed by Pat Hare and Diane Selvaggio

Pine Creek Watershed Assessment, Protection and Restoration Plan March 2005
Chapter 5: Land Use 65
Environmental Advisory Councils (EACs) To help municipalities address environmental issues, like land use, the Pennsylvania General Assembly in 1973 passed Act 148, which authorizes municipalities to establish Environmental Advisory Councils (EACs). EACs “can advise a municipality’s governing body, commissions, and boards on matters concerning the protection, conservation, management, and use of the municipalities’ natural resources.”5 Knowledgeable EACs are a valuable tool in the site planning process and in helping to ‘watchdog’ environmental problems. Hampton, Fox Chapel, Franklin Park, and Pine have active EACs.
Floodplain Protection Some Pine Creek communities follow the Allegheny County Handbook model and prohibit any new construction in the 100 year floodplain; some allow construction with flood proofing; one or two allow filling and/or open storage. It is important to downstream communities that the floodplain be kept clear of obstructions so that floodwaters can spread out, slow down, and infiltrate the soil. Debris that is carried to downstream culverts and bridges can cause blockages, or dams, resulting in massive flooding. In 1995, Etna and Shaler updated their flood-plain study, which resulted in the 100 year floodplain being wider than it had been previously, due to more impervious development upstream. Since impervious development has increased throughout the watershed, all communities should prevent any new fills or construction in either the 100 year floodplain or in the floodway (by DEP definition, 50 ft. from the top of any stream bank, unless shown otherwise by Federal Emergency Management Agency [FEMA] maps).
Stormwater Management PA Act 167 and past stormwater ordinances have dealt only with reducing the rate of runoff, but not with the total amount of water released or the water quality. The new focus of regulations is to reduce the amount of runoff, as well as its inherent pollution. Developers may utilize terraces, run-off spreaders, diversions, and grass or rock-lined swales and waterways, along with infiltration devices such as seepage or recharge basins and pits, seepage beds or ditches, Dutch drains, and pervious surfaces. Municipalities can minimize the amount of land disturbed by promoting such things as cluster homes (or Conservation Subdivisions) and redeveloping older, already-developed sites.
• McCandless lists 8 choices for stormwater management (including the usual detention ponds) and does not limit their list to these alone. (Zoning Ord. Appendix B #1-c, d, e page 110).
• O’Hara and Shaler encourage the use of grass swales and pervious surfaces, and Shaler disconnects roof leaders, letting the water spill to the ground. (Shaler Sect. 308 A-D pages 18-19).
• The new Shaler stormwater ordinance does not include a “No-harm” option6. In Sect. 305 (page 14 & 15) it includes water quality requirements. They allow stormwater credits for natural area conservation (A-1) and for vegetated stream buffers (A-4). If a detention pond is proposed, it must “provide for a 24-hour extended detention of the 1-
5 The EAC Handbook: A Guide for Pennsylvania’s Municipal Environmental Advisory Councils. 1996. The Pennsylvania Environmental Council. 6 No harm evaluation is an engineering analysis that demonstrates that no stormwater controls are necessary on a site. It is applicable to downstream communities on sites that are adjacent to the river.

Pine Creek Watershed Assessment, Protection and Restoration Plan March 2005
Chapter 5: Land Use 66
year, 24-hour storm event” (i.e., the stormwater runoff will be released over a minimum 24 hours for the 1- year, 24-hour storm event. Sect. 305 B - last paragraph in section). Requiring that stormwater be “detained” as long as possible allows for more pollution to settle out and for more infiltration of the total amount of water from the storm.
• McCandless has a new Stormwater Management Ordinance, which includes the newer guidelines for infiltration and water quality.
Erosion & Sediment Controls
All of the municipalities use the Allegheny County Conservation District regulations for this. It was noted, however, that:
• Richland has an especially good listing of Performance Principles (Sect. 512-2, A-H pages 327, 328), and
• Ross has indicated that they have required almost all of the control practices listed in question 6.03 of the survey.
Steep Slope Protection
ALL of the municipalities have regulations for protecting steep slopes, particularly for the landslide-prone slopes that occur throughout much of this area. Most of these slopes abut a stream valley or watercourse, and keeping the slopes vegetated is crucial to preventing land slides, erosion, stream siltation, and costly damages in the future. The main difference between the local ordinances is in whether they consider “very steep” slopes to be 25% (most favored by the Land Use Subcommittee and used by most of the municipalities) or 40%. It is both desirable and recommended that “slope averaging” only be allowed under certain conditions and percentages of disturbance of the total site.7
• See Fox Chapel Health & Safety Ordinances Sect. 120 (e)(iv) - page 155 for “average percent slope used only where...”
• Bradford Woods combines slope and tree protection by limiting the amount of defoliation allowed, based on a combination of the zoning district and the percent of slope from 0% to over 25%. (Art. 3, Sect. 302 and Table of District Regulations on page 3-1).
Tree and Woodland Protection
The advantages of trees to a community cannot be overemphasized. As mentioned in Chapter 2, trees prevent erosion by holding soil in place with their root systems and protect water quality by trapping the sediment in runoff. Trees aid infiltration and groundwater recharge, thus reducing the expenses of stormwater management facilities. Further, trees remove pollutants from the air and aid in cooling the air temperature, possibly reducing the need for expensive air conditioning. Finally, trees provide wildlife habitat and aesthetic areas for passive human recreation ALL of the municipalities have tree protection somewhere in their ordinances. Most, if not all, already prohibit clear-cutting. Some protect trees in every development, a few protect only in Planned Residential Developments (PRDs). Indiana, Hampton, and Shaler also require tree replacements in certain instances. 7 Slope averaging is the average slope of the area of environmental disturbance, determined by dividing the difference in elevation at the extremes of the environmental disturbance by the horizontal distance between the limits of the environmental disturbance as determined by an actual field topographic survey of the elevation within the area of environmental disturbance.

Pine Creek Watershed Assessment, Protection and Restoration Plan March 2005
Chapter 5: Land Use 67
• Indiana Subdiv. Ord. Sect. 1268.08 - If 25% or more of the trees at least 4” diameter at breast height (dbh) are cut down, the excess over 25% must be replaced by 3” dbh trees.
• Hampton Zon. Ord. 627 Sect. 9.445 for PRDs, Sect. 10.403 and 10.406. Sect. 10.406b requires replacing 12”-24” dbh trees on a one-to-one basis, and 24” or greater dbh trees with six trees (or an equivalent) for each one cut down.
• Shaler PRD Sect. 225-132(2)(b) - page 22591 and Logging Sect. 151-4 - page 15102. • Pine has excellent regulations for both protection and mitigation, requiring that
replacements match the type and species of the trees that were removed. (Pine Code Sect. 78-31 P-T, pages 7908-7919).
• McCandless has very detailed woodlands protection and woodlands mitigation on site, taken from the County’s Handbook model ordinance. (McCandless Planning & Zoning Code Part 13, Sect. 1314.03 (page 16E), particularly (d)(1-3) and the chart on page 16H.).
• Fox Chapel has some of the most protective tree regulations of all of the communities, and they have an active tree commission. (Fox Chapel Health & Safety Ord. Sect. 120(g & h) - page 156).
• Marshall has an excellent introduction for the importance of trees in their ordinance. This is highly recommended to all communities. (Marshall Code Art. XXX, Sect. 208-215, page 21111).
Logging/Timbering/Forestry
Some municipalities seem to be relying on their tree and woodland protection regulations, which do allow some tree removal, to comply with the relatively new state requirement for a logging ordinance. All communities prohibit clear cutting, and cutting on steep slopes or landslide-prone slopes. However no municipality seems to require any buffer for a watercourse in their Logging sections.
• Franklin Park and Marshall require a Performance Bond for restoration of the site. (Franklin Park Codebook Sect. 128.6 (page 4 & 5) and good attachment of approved seeding mixes on page 8 & 9 and Marshall Art. XXV, Sect. 208-203 (page 210.86)).
• Shaler and Marshall only allow logging of certain size trees and require replanting with trees of a similar nature at least 2.5ft. tall and also preserving unique tree stands. (Shaler Sect. 151-4(D) - page 15102 and Marshall Sect. 208-202 - page 21085).
• Indiana requires a 10 ft. wide natural treed buffer to be left all around the perimeter of the site (Indiana Logging Ord. 231(k)(2) and (6)).
• O’Hara requires a 50 ft. buffer along all streets and adjacent properties, allows only 50% of the site to be logged in any one operation, requires Township inspection both during and after logging, and makes logging a “Conditional Use” only. (O’Hara Zon. Ord. Sect. 72-13.102 on page 149).
• Franklin Park allows logging only at a time of the year when there would be the least amount of environmental damage (F. Park Codebook Sect. 128-4.J.), and O’Hara reserves the right to suspend operations during a drought (Sect. 72-13.102, subsection 6.a. (8) on page 151).

Pine Creek Watershed Assessment, Protection and Restoration Plan March 2005
Chapter 5: Land Use 68
Watercourses, Ponds, and Wetlands Protections Waterbodies are protected by all communities to some degree, with required buffers of 50 ft. or 80 ft. for watercourses and, in most cases, up to 100 ft. for ponds and wetlands.
• Indiana (Zon. Ord. 217 Sect. 17(J)) and Hampton (Zon. Ord.Sect.10.401 (pages 10-15)) also prohibit vegetation removal, thus preserving riparian buffers.
Most of the municipalities do include protection from piping and/or filling for even the smallest of watercourses and drainages. These “First Order ”streams also need to have a minimum natural buffer required, or at least have protection for their natural banks. All riparian buffers should be replanted if bare or disturbed.
• In Pine, the 50 ft. buffer is for wetlands and perennial streams only (Pine Code Sect. 78-31V(5 & 6) - page 7923), and in Hampton it is only for a watercourse with a 100 acre “tributary area”(Zon. Ord 627, Sect. 10.401). There is no mention of any buffers for First Order streams.
• Richland requires a drainage easement for any natural watercourse. • Pine limits drainage ways to 50% maximum clearance and any development in the
drainage way is limited to recreation or open space (Pine Code page 7917). • O’Hara has an additional Riverfront Development Article which provides flexibility,
requires a minimum of 20% open space, and requires public access throughout the riverfront on the Allegheny River (Art. XII on page 110).
• Richland is the only community (as far as the Land Use Committee could tell) that has a requirement to notify both up and down-stream municipalities of a site proposed for development in their watershed at the time of Preliminary Application. (Sect. 514 (7) on page 339).
Open Space and Bufferyards Protections
Open, undeveloped spaces are important for natural amenities, groundwater recharge areas, tree protection, wildlife habitat, and passive recreation. Most of the municipalities have provisions for these, at least in their PRD Ordinances for open space, and as a requirement between zoning uses for bufferyards. Some require 50% of the open space to be suitable for active recreation.
• Shaler requires that at least 75% of the open space for a development be outside any steep slope or floodplain area, and also recommends inter-connectedness with other open space whenever possible. (Shaler Sect. 225-132 (4) on page 22598).
• Both Indiana (Subdiv. Ord. #215, Sect.1271.06 - page 40) and Richland (Sect. 1001 (7)(J) and Ord. 278,Sect. 511 #1-3 on page 326) require open space/recreation fees-in-lieu of their development regulations.
• Bufferyard graphics are provided by both Hampton (Sect. 10.220) and McCandless (Sect. 1314.04 on page 160-16w).
• Marshall has good tables for bufferyards (Art. XXV Sect. 208-13 on page 21100), and most of them require a performance guarantee equal to 110% of the estimated installation (page 21102). Marshall also has a bufferyard requirement from major roads in many cases (Sect. 208-13H). They also provide an “Ownership of Bufferyards” regulation (Sect. 208-13G), which insures their permanence.
• McCandless uses a Site Capacity Analysis for developments, which factors in their resource protection lands and recreation land requirements for determining allowed

Pine Creek Watershed Assessment, Protection and Restoration Plan March 2005
Chapter 5: Land Use 69
residential unit density, and uses impervious surfaces to calculate permitted floor area in non-residential development. (Sect. 1314.03 (j) to (l) - page 16J-16K).
• Hampton and Marshall use the Conservation Subdivision, which works in the same way, as a more flexible, open-space alternative to standard residential subdivisions. (Hampton Subdiv. Ord. #583, Sect. 205 and Marshall Art. XVIII on page 21025).
• Marshall also uses Site Capacity Analysis for all residential developments. (Art. XVII Sect. 208-159 on page 21004).
Landscaping, Street Trees, and Parking Lot Trees and Shrubs
Some type of landscaping is required in most of the communities. The landscaping will add trees to provide shade and beauty to neighborhoods and commercial areas. Most of the parking lot requirements specify enough square feet in the planting islands for the trees to thrive and grow. Some use a 10 ft. wide minimum in the island design to allow for this. If uncurbed, these islands also allow rainwater to stay on site and be taken up by the trees, rather than ending up in the storm drains.
• To make things easier in the approval process, Pine has an excellent Appendix for parking lot landscaping designs, Appendix 78-4, including a list of shade and ornamental trees for both streets and parking lots.
• McCandless also provides good graphics (Sect. 1314.05 (c) on page 16V-16X) and requires maintenance forever (Sect. 1314.05 (e)). They allow only 10% mortality without replacement and require a 10% maintenance bond to be posted at the time the occupancy permit is granted.
• In Marshall, trees are even allowed to displace parking spaces in certain instances (Sect. 208-216 D, page 21113).
• Street trees are required in Indiana (Subdiv. Ord. 1268.08) and Fox Chapel (Subdiv. Sect. 406 on page 308.18).
In addition to the aforementioned resources provided by the municipalities, Appendix H contains a summary of some best management practices for handling stormwater runoff and non-point source pollution.

Chapter Six
Watershed Protection and Restoration Plan

Pine Creek Watershed Assessment, Protection and Restoration Plan March 2005
Chapter 6: Watershed Protection and Restoration Plan 70
A. Recommendations The ultimate goal of a watershed assessment is to develop a restoration or protection plan that addresses impacts or threats from non-point source pollution. The recommended goals for the Pine Creek watershed appear in the following pages. The Steering Committee encourages the implementation of these goals where appropriate. The lists of potential partners and funding sources are based on past involvement of these organizations and agencies and should not be considered to be an exhaustive list. Their listing by no means requires them to implement the recommendations; they are listed as groups that would have the resources or the knowledge to undertake such a task. B. Conclusion The Pine Creek Watershed Assessment provided an overview of water quality in the basin and developed a set of criteria for evaluating stream health. While several of the chemical and biological indicators pointed towards fair or acceptable water quality, more testing is needed to accurately assess the health of the waterway and to determine the sources of contamination (see Chapter 4). More specifically, further testing should focus on pH, conductivity, phosphate, and sulfate. Based upon the information at hand, the Committee was able to develop a list of recommended goals for the watershed. Since these recommendations are strictly voluntary, it is important that a focused group of individuals work towards their implementation. The formation of a watershed association, or equivalent organization, would be the most effective way to continue this work, both in terms of managing projects and raising the necessary funds. Continued municipal participation is essential in completing the recommendations, and the formation of an organization should not prohibit this. Further, a watershed association will allow increased participation of the community in project implementation. The formation of a watershed association will take time. In the interim, it is recommended that the Pine Creek Watershed Steering Committee continue to meet and act as an advisory board for several of the recommendations listed below.

Pine Creek Watershed Assessment, Protection and Restoration Plan March 2005
Chapter 6: Watershed Protection and Restoration Plan 71
Table 6 – 1: Recommended Goals for the Pine Creek Watershed Recommendation Potential
Partners and Responsible Parties
Potential Funding Sources
Timeline (Project Initiation)
Cost Estimate
Governmental: Have environmentally important lands delineated and mapped and available at all municipal meetings when land use development plans are to be discussed.
Municipalities, Steering Committee
2005 <$10,000
Review existing ordinances for potential modifications regarding water quality. (See Chapter 5)
• Adopt a policy that discourages new fills or construction in the 100 year floodplain or in the floodway.
• Adopt policies protecting the natural banks and riparian buffers of all streams, including first order streams, particularly in logging ordinance.
• Adopt a policy that uses ‘slope averaging’ for development only under certain conditions and percentages of disturbance of the total site.
• Remove ‘No Harm’ analysis provision from ordinances unless immediately adjacent to the river.
• Develop a multi-municipal strategy for removing downed trees and/or potential obstructions and debris from streams.
• Adopt policies that promote cluster housing and redevelopment of developed areas, except for floodplains.
Municipalities, Steering Committee
2005 $1,500-$3,000 per party, per modification

Pine Creek Watershed Assessment, Protection and Restoration Plan March 2005
Chapter 6: Watershed Protection and Restoration Plan 72
Recommendation Potential Partners and Responsible Parties
Potential Funding Sources
Timeline (Project Initiation)
Cost Estimate
Participate in the development of the Allegheny County Comprehensive Plan’s model ordinances.
NAEC, Municipalities
NA 2005 <$10,000 each party
Participate in the Route 8 Corridor implementation to ensure protection of environmentally sensitive areas.
NAEC, Municipalities
NA 2005 < $10,000 each party
Offer technical assistance to Environmental Advisory Councils and all municipalities concerning Best Management Practices.
PEC, NAEC
DEP 2005 $10,000
Offer technical educational programs to municipal officials (e.g. stormwater workshops).
PEC DEP, private foundations
2005 $10,000
Monitoring: Expand / enhance the Quality Assurance and Quality Controls of volunteer monitoring.
EASI, DEP, WPC DEP 2005 <$5,000
Investigate new methods for measuring nitrates.
EASI, WPC 2005 <$500
Investigate sources of high conductivity and phosphate values.
EASI, DEP 2005 $10,000
Provide additional guidance and training to volunteers.
EASI, WPC 2005 $5,000
Develop a ready reference of monitoring criteria for monitoring groups.
DEP, WPC 2005 $1000
Studies / Tools: Develop DCNR River Conservation Plan.
NAEC DCNR, in- kind, Western PA Watershed Program
2005 $200,000
Develop Fluvial Geomorphology Study for Pine Creek and/or tributaries.
Steering Committee
Federal, state grants
2006 $250,000
Study the economic impact of natural stream channel design.
Steering Committee, consultant
2006 $10,000
Create a watershed- wide green space map.
Municipality, County, consultant
2006 $10,000
Update the floodplain map to include smaller drainages and to reflect current flood cycles.
FEMA, USGS 2006 TBD

Pine Creek Watershed Assessment, Protection and Restoration Plan March 2005
Chapter 6: Watershed Protection and Restoration Plan 73
Recommendation Potential Partners and Responsible Parties
Potential Funding Sources
Timeline (Project Initiation)
Cost Estimate
Conduct a build-out analysis of watershed with projected calculations of impervious cover.
Municipalities, Steering Committee
DEP 2006 $15,000
Develop regional strategy for flood control.
Steering Committee, NAEC
Federal, state, private grants
2005 $250,000
Projects: Develop database of riparian buffer landowners.
Steering Committee, NAEC
2006 $5,000
Assess riparian buffers. Steering Committee, Volunteers
DEP 2005 $10,000
Target areas for buffer restoration. Steering Committee
NA 2005 $5,000-$20,000
Restore floodplains as possible. Municipalities 2005 $1,000,000 Outreach: Host presentations to municipalities and public about watershed assessment.
Steering Committee
DEP, in-kind
Spring 2005
$1,500
Host presentations to municipalities and public about watershed history and riparian buffers.
Outreach Committee
Water Resource Education Network (WREN)
Summer 2005
$5,000
Develop and distribute a new list of Watershed Walks.
Outreach Committee, NAEC
in-kind Summer 2005
$500
Create and distribute a watershed driving tour.
Outreach Committee, NAEC
in-kind, WREN
2006
$1,000
Create and distribute a newsletter for volunteers.
2005 $1,000
Foster an adopt-a-stream program as part of an ongoing clean-up effort.
DEP, local businesses, municipal-ities
2005 $15,000
Organizational:
Develop a watershed association, or equivalent organization, for Pine Creek.
NAEC, PEC, Sportsmen’s groups, municipalities
DEP, Western PA Watershed Program
2006 TBD
Mentor watershed activities in Girty’s Run.
Steering Committee
NA 2005 TBD
Appendix A
Understanding Stormwater
Prepared by Diane Selvaggio
Duquesne University, Environmental Science and Management Turtle Creek Watershed Association

74
A. The Bottom Line Dollars.
Southwestern Pennsylvania equals valleys and streams, equals natural beauty, equals increased quality of life, equals increased property values, equals dollars into the economy.
Unchecked stormwater into the valleys and streams equals increased flood damage and water pollution, equals increased repair and maintenance, equals increased tax dollar expenditures.
Loss of fresh water resources equals reduced safe ground water supplies equals increased water-related costs as well as habitat decline.
Imprudent development of open space, valleys, and streambanks equals increased stormwater runoff, erosion, flooding, and sedimentation equals increased public and private costs.
Conventional development of open space, valleys, and streams also equals increased upfront infrastructure costs for developers, equals increased long term municipal maintenance costs.
Standard type development also equals reduced natural beauty and function, equals reduced quality of life, equals reduced property values.
Fresh water is a valuable resource with tangible economic and health benefits, yet too often we treat it as a waste product to be discarded in ways that are expensive for individuals and municipalities. B. The Overview The NPDES Phase II regulations, with their MS4 requirements, have at times been characterized as an unfunded federal mandate to comply with the Clean Water Act. As such, they are often perceived as a burden on municipalities, particularly those dealing with reducing local revenues. However, because Southwest Pennsylvania’s terrain is comprised of ridges and stream valleys, because our weather brings us a good amount of precipitation, and because our underlying geology makes us the second most landslide prone area of the country, municipalities face a choice. They can maintain compliance with the letter of the law, or they can take advantage of the opportunity to address significant issues that have been brewing for years – issues that have been very costly for municipalities to deal with on a piecemeal basis. The costs associated with maintaining the status quo, which continue as much as compensate for these problems, are growing rapidly.

75
On a related track, competition for business and industry, the jobs they bring, and the employees and families who become part of communities, is fierce all across the country. Our region is lagging behind for several reasons, not all of them able to be addressed on a local level. But some can be and are being successfully addressed in other places. Again and again it has been shown that one of the most important considerations in determining a place to live, or to locate a business where people want to live, is the overall quality of life. Part of this broad category includes stable property values and dependable municipal services. In no small measure this category also includes ready access to natural areas, the active recreation options they offer, and the ambiance of their beauty.
If we wish to be competitive, and if we wish to reduce long-term costs, then we should incorporate these quality of life factors as part of our strategies for addressing our new water quality and quantity responsibilities. The ultimate goal would be to comprehensively design a watershed-wide approach to stormwater management that includes:
• reduced runoff & increased infiltration • reduced flood related damage & increased property values • reduced erosion and sedimentation & increased water quality • reduced infrastructure (and maintenance) costs & increased preservation of open space, valleys,
riparian areas, and streams • reduced management of stormwater as a waste product & increased treatment as a valuable
resource C. The Nuts and Bolts (Unless otherwise noted, all figures are from the US EPA or Pa DEP) One of the most sensible ways to address the stormwater runoff problems of mechanical infrastructure, maintenance, flooding, erosion, sedimentation, water quality, and regulation compliance is to infiltrate the water where the precipitation falls. Back in the sixth grade, we all learned about the water cycle, then promptly forgot about it. As it turns out, those principles are valid and we can put them to work for us.

76
Surface Runoff: overland flow of precipitation. In the normal water cycle, heavily vegetated land with a thick layer of topsoil allows more rainwater or snowmelt to percolate down to the ground water table than does land that has been stripped, recontoured, then recovered with a thin layer of topsoil and lawn grasses.
Paved surfaces, roofs, and other impervious materials shed all precipitation along with any contaminants. This lack of any infiltration results in significant volumes of stormwater runoff after a precipitation event. Measures that intercept this runoff and allow for infiltration and/or slower release to streams offer opportunities to reduce overall stormwater volume and contaminant loads. Measures that encourage preservation of tracts natural land and natural riparian areas also offer ways to increase infiltration and reduce runoff and contaminants.
Reading a Stream Hydrograph
A hydrograph presents a picture of what is happening to the volume of water in a stream during and after a rainfall event. It is a combination of continuous flow data that is electronically monitored at specific sites on a stream and rainfall data from the same site or one upstream. The amount of rainfall is shown in the upper left hand corner (upside down). Normal stream base flow is shown as the broken purple line. Units of time are shown on the x-axis. Units of water volume passing one point on the stream are shown on the y-axis. The effect of the rainfall runoff upon the steam volume is shown as the solid red line. The rising limb represents the increase in stormwater runoff volume. The crest represents the maximum runoff volume. The falling limb represents the decrease in runoff until base flow is achieved once more.
Physical Geography.net If the rising limb climbs quickly, that means stormwater runoff is rapidly entering the stream. Very little infiltration is occurring, so this represents land covered by impervious surfaces. In that case, the falling limb is likely to decline sharply also, but in proportion to the length of the rain event. However, when there is also detention and infiltration occurring, the decline will be more gradual, reflecting the longer amount of time until that water reaches the stream.

77
If the rising limb climbs gradually, that shows a greater amount of stormwater detention and/or infiltration is taking place. This pattern typically reflects land in its natural state.
Changes in Runoff Patterns (Here, the rainfall is depicted as the far left line.)
This series of hydrographs show the changes in flow patterns before and after urbanization occurred. Normal stormwater infiltration into undisturbed land creates a rising limb and falling limb that are similar in slope. The crest occurs well after the storm.
The increase in impervious and semi-pervious surface area results in greater runoff occurring shortly after the storm. This shows as a steeper slope on both limbs, but more so on the rise, suggesting some detention.
When stormwater runoff is minimized, the amount of damage it can do is also minimized. Sensible development practices can not only minimize runoff, but reduce the amount of roads and other infrastructure needed. This reduces both initial costs for developers and long term maintenance costs for municipalities. Appropriate municipal codes and policies will encourage these advantages.
As depicted below, low impact development can accomplish these infiltration and infrastructure goals.
Greater amounts of natural land will enhance infiltration performance of a development. Stormwater runoff volume is decreased.
Land that has been stripped, regraded, compacted, then covered with a modest amount of topsoil and lawn grasses has a significantly reduced infiltration capability.
Stormwater runoff volume is increased.

78
Ground Water: the upper level of the water saturated zone beneath the earth’s surface. Geology determines the depth and boundaries, and infiltration determines the volume. This stored water supplies wells, seeps, springs, streams, and rivers. When the water table is high, and a stream is receiving water from the ground water supply, it is being charged. When the water table is low, and water from the stream is infiltrating into the ground water, the stream is discharging. The volume of the ground water supply becomes especially critical during periods of drought. Here in southwestern Pennsylvania, we have had a mixture of very wet and very dry years over the past few decades. Learning from this and from the experiences of other parts of the country with prolonged dry weather, maximizing our infiltration options, taking full advantage of the resources we have, leads to substantial economic and quality of life benefits.
USGS NavGuide Infiltration: water flow from land surface to the subsurface and possibly to the ground water below. Subsurface water is available for deep-rooted plants, and the water table supplies streams, springs, and wells. Increasing infiltration into soils that can absorb water reduces the need for infrastructure to remove runoff, reduces flooding, reduces erosion, reduces contamination of water bodies, and increases the ability to comply with water quality and quantity regulations.

79
University of California at Santa Barbara
In areas with stable geology and soils, natural trenches and swales such as these are a low tech method of increasing infiltration and reducing stormwater velocity, in turn reducing erosion potential.
Sullivan County, PA
Another method of reducing surface runoff and increasing infiltration in developed areas with stable soils is the installation of rain barrels or rain gardens that take advantage of excess water from downspouts or even limited street runoff. Rain gardens can also be used in parking lots.

80
Three Versions of Rain Barrels
Clean Air Gardening.com
Concept for a Simple Rain Garden
Able to capture either limited street runoff or roof runoff, a rain garden such as this can be retro-fitted or be part of new construction. A swale running under the driveway and walkway allows for excess water to drain. The swales are planted with vegetation adapted to damp conditions.
Similar gardens can be used in residential settings or in parking lots. A list of plants suited for southwestern Pennsylvania is at the end of this section.

81
Rain Garden Schematic Diagram for Residential Applications
A neighborhood system of infiltration swales and rain gardens eliminates the need for curbs and excess infrastructure.

82
Rain Garden Plant List for Pennsylvania
Trees and Shrubs:
• Amelanchier laevis Shadbush • Asimina triloba Pawpaw • Betula nigra River birch • Cephalanthus occidentalis Buttonbush • Clethra alnifolia Sweet pepperbush • Cornus amomum Silky dogwood • Fothergilla gardenii Dwarf fothergilla • Hamamelis virginiana Witch hazel • Ilex verticillata Winterberry holly • Lindera benzoin Spicebush • Liquidambar styraciflua Sweet gum • Sambucus canadensis American elderberry • Viburnum dentatum Arrowwood
Wildflowers:
• Asclepias incarnata Swamp milkweed • Aquilegia canadensis Wild columbine • Aquilegia vulgaris Common columbine • Aster lateriflorus Side flowering aster • Aster novai-angilae New England aster • Baptisa australis Wild false indigo • Caltha palustrus Marsh marigold (toxic in large quantity) • Chelone glabra White turtlehead • Echinacea augustafolia Purple coneflower • Eupatorium purpureum Joe-pye weed • Eupatorium perfoliatum Boneset • Gentiana clausa Closed gentian • Gentiana saponica Soapwort gentian • Iris versicolor Wild iris or blue flag • Liatris pychnostachya Prairie blazing star • Lobelia cardinalis Cardinal flower • Lobelia syphilitica Blue lobelia • Monarda didyma Bee balm or bergamot • Monarda fistulosa Wild bee balm or bergamot • Penstemon digitalis Smooth beardtongue • Polymonium reptans Jacob’s ladder • Rudbeckia subtomentosa Brown-eyed susan • Sagittaria latifolia Arrowhead • Stylophorum diphyllum Celandine poppy • Talictrum polygonum Tall meadow rue • Typha augustofolia Narrow-leafed cattail • Typha latifolia Common cattail • Veronicastrum virginianicum Culver’s root • Vernonia noveboracensis Common ironweed

83
Ferns:
• Athyrium filix-femina Lady fern • Equisetum hyemale Horsetail • Onoclea sensibilis Sensitive fern • Osmunda regalis Royal fern • Osmunda cinnamomea Cinnamon fern
Grasses:
• Briza media Quaking grass • Chasmanthium latifolium Northern sea oats • Elymus villosis Silky wild rye • Panicum vergatum Lowland switchgrass • Phalaris arundinacea Ribbon grass • Polypogon monspeliensis Rabbitfoot grass • Schizachyruim scoparium Little bluestem
Sedges:
• Carex pendula Drooping sedge • Carex bromoides Brome hummock sedge • Carex pennsylvanica Pennsylvania sedge • Carex stipata Tussock sedge

84
Transpiration: normal plant metabolic processes draw subsurface water up through roots, stems or trunks, and into the leaves. Much of this water then evaporates from the leaves into the atmosphere (evapo-transpiration) where it cools the air as it becomes available for condensation and cloud formation. The average mature shade tree evaporates between 34 and 70 gallons of water each warm weather day. This capability to remove subsurface water is useful when planning for increased stormwater infiltration. An area planted with trees will be able to accommodate more stormwater volume than one without trees – efficiently putting the water back into the atmosphere.

85
Erosion: the wearing away of soils and other surface materials by the action of wind or water. Once soil particles are picked up and carried by air or water, they serve to increase the erosive force of the medium. Rain drops that are intercepted by vegetation are less likely to dislodge soil particles, therefore, erosion potential is reduced. Rain striking unprotected soils can easily dislodge particles, as can large volumes of sheet runoff, resulting in increased erosion, increased sediment loads in streams, and increased contaminant loads.
University of Nevada
Wet Pond BMP to Reduce Erosion
Significant Erosion due to Excess Runoff
BF Environmental Consultants

86
Harris & Dines 1988

87
Sedimentation: soils and other materials once suspended in a stream, river, or lake that have been deposited on the bottom of a water body or on the flood plain. When suspended in the water column, these particles increase the scouring effect on stream or river banks and on tissues of living organisms. They block sunlight penetration and hold heat, increasing water temperatures. Deposited material smothers life in streambeds and lakebeds. These combined effects stress the normal ecosystems and reduce any economic benefits of recreational fishing. Pennsylvania receives over $1 billion annually directly related to fishing with the average tackle angler spending $26 per day, and the average fly fisherman spending $40. These sediments also become problematic for any streams where TMDLs (total maximum daily loads) are in effect. Deposited sediments displace water volume in waterways, increasing the likelihood of future flooding and the expensive damage it causes.
University of Colorado
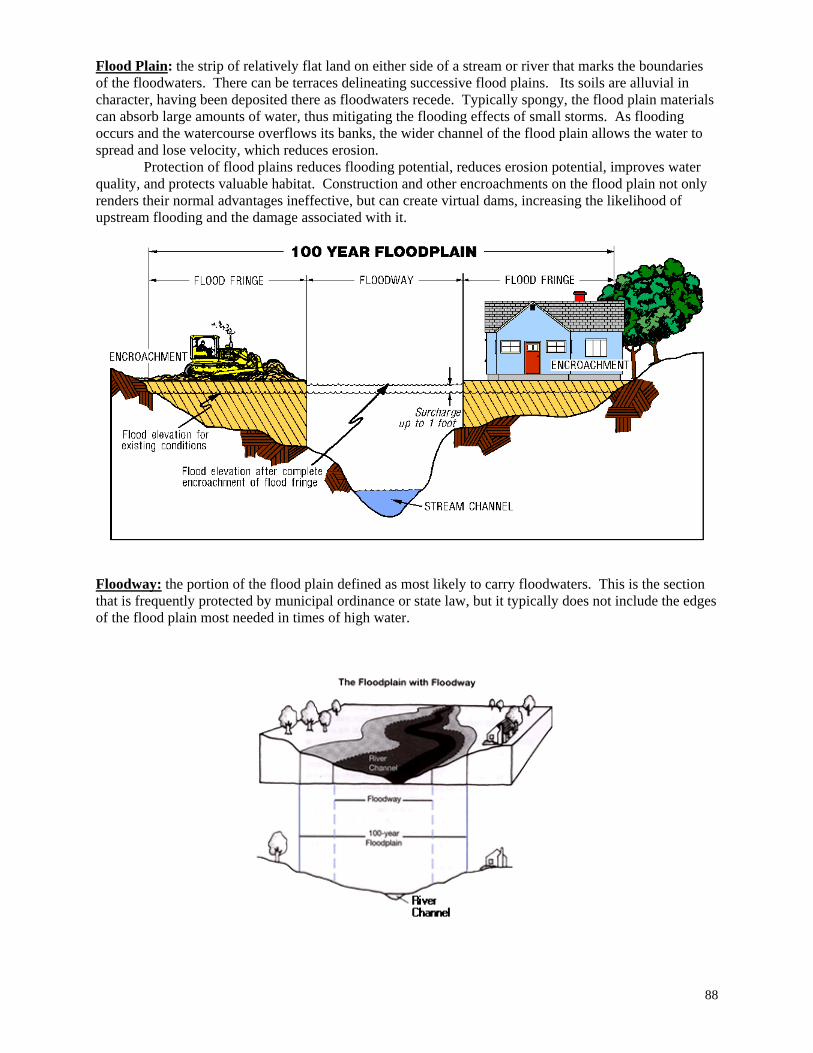
88
Flood Plain: the strip of relatively flat land on either side of a stream or river that marks the boundaries of the floodwaters. There can be terraces delineating successive flood plains. Its soils are alluvial in character, having been deposited there as floodwaters recede. Typically spongy, the flood plain materials can absorb large amounts of water, thus mitigating the flooding effects of small storms. As flooding occurs and the watercourse overflows its banks, the wider channel of the flood plain allows the water to spread and lose velocity, which reduces erosion. Protection of flood plains reduces flooding potential, reduces erosion potential, improves water quality, and protects valuable habitat. Construction and other encroachments on the flood plain not only renders their normal advantages ineffective, but can create virtual dams, increasing the likelihood of upstream flooding and the damage associated with it.
Floodway: the portion of the flood plain defined as most likely to carry floodwaters. This is the section that is frequently protected by municipal ordinance or state law, but it typically does not include the edges of the flood plain most needed in times of high water.

89
Riparian Area: land adjacent to running water and including the flood plain. While the ideal width of these strips of land may vary, the functions they perform assist communities in managing stormwater and complying with new water quantity and quality regulations. When naturally vegetated, this land functions as a filter to trap sediments and contaminants. Soil bacteria can break down many contaminants before they pollute streams. Vegetation slows runoff velocity, increases infiltration capability, and reduces runoff volume and related flooding and erosion potential. Roots of mature vegetation help hold streambanks in place, further reducing erosion. Streamside plant communities provide water temperature regulation, critical habitat, and are an important nutrient and energy source for stream organisms. Larger riparian areas offer a variety of recreational options. When restoring riparian areas, it is important to choose native species of trees, shrubs, forbs, and grasses with strong root systems. Allowing these plants to become established and not mowing to the edge of steambanks will afford maximum value.
Benefits to Preserving Stream Channels
• Natural creek channels provide habitat for fish, wildlife and vegetation; • Natural creek channels are more physically attractive than engineered solutions; • The water in natural creek channels is filtered by the root systems of aquatic plants; and • Deeper sections in natural creek channels form pools that slow water flow and reduce the impact of
heavy flows during rainstorms.

90
Riparian Plant Benefits
• Roots prevent erosion and undercutting of banks. • Branches, stems, and leaves absorb the impact of raindrops. • Ground cover (decaying leaves and low-growing vegetation) slows runoff, increasing absorption.
Table 1 Summary of Research Results of Pollutant Reduction from Vegetated Riparian Buffers (Dosskey, 2000)
Function Pollutant Type % Reduction in Amount
Sediment range 40 to 100
Sediment-bound range 27-96
Dissolved range 10 to 100
Filter surface runoff
Microbes range 43 to 91
Filter ground water runoff
Nitrate range 32 to 99
Villanova University

91
Retention and Detention Ponds: Although over the last few decades there have been conflicting and somewhat confusing definitions for these structures, present literature seems to be in general agreement that detention ponds detain stormwater volume for only 24 to 48 hours while retention ponds retain the water for longer periods, allowing some to infiltrate to the water table and slowly releasing the rest into the local stream. This latter process mimics the structure and function of natural flood plains, reducing the incidence of erosion, sedimentation, and flooding. This slower release of water also allows toxins to be processed by normal bacterial, vegetative, and chemical processes undertaken by plants and soils.
Creating their own habitats, the materials chosen to construct the pond will be dictated by the ultimate functional goals. Vegetation will be chosen for its adaptability to the substrate and to attract certain types of animal communities resulting in a predator/prey balance and reduced potential for future problems. Attention to function and esthetics will insure that practical stormwater management tools are also neighborhood and community assets.
Aesthetics aren’t emphasized on many traditional storage ponds.
A well-designed pond integrates into its surroundings. Photos courtesy of Triad Associates Seattle Daily Journal, July 2002
Detention facilities are dry ponds which become completely dry within 24 hours of a storm event. These facilities provide the least amount of water quality benefits. Therefore, use of detention facilities as a BMP in some states is discouraged.
Harford County, MD
Websites of Interest

92
Flood Plain, Floodways:
http://www.fairfaxcounty.gov/dpwes/navbar/faqs/floodplains.htm Fairfax County, VA: Floodplain FAQ http://www.fema.gov/news/newsrelease.fema?id=3866 FEMA: Do You Live in a Floodplain? http://www.extension.umn.edu/distribution/resourcesandtourism/components/6445d.html University of Minnesota: Recreation and the Floodplain http://www.dcr.virginia.gov/sw/fpregs.htm Virginia DCR: Floodplain Management
Low Impact Development
http://www.epa.gov/owow/nps/lid/ EPA: Low Impact Development Information Sites http://www.lid-stormwater.net/ Low Impact Development: Urban Design Tools
Rain Gardens:
http://www.cmhc-schl.gc.ca/en/burema/gesein/abhose/abhose_075.cfm CMCH - Rain Gardens: Improve Stormwater Management in Your Yard http://www.edcmag.com/CDA/ArticleInformation/features/BNP__Features__Item/0,4120,18769,00.html Environmental Design and Construction: Green Roofs http://www.nwf.org/backyardwildlifehabitat/marsh.cfm National Wildlife Federation: Backyard Stormwater Marsh http://clean-water.uwex.edu/pubs/raingarden/rgmanual.pdf Rain Gardens: A How-To Manual for Homeowners http://www.mninter.net/~stack/rain/ Rain Gardens: Gardening with Water Quality in Mind
Rain Barrels:
http://www.3riverswetweather.org/d%5Fweather/d%5Fstorm2.stm 3 Rivers Wet Weather Demonstration Program: Rain Barrels http://www.gardengatemagazine.com/tips/40tip11.html Garden Gate: Make a Rain Barrel http://www.rainbarrelguide.com/ Rain Barrel Guide http://www.composters.com/docs/rainbarrels.html Rain Barrels
Retention/Detention Ponds
http://p2library.nfesc.navy.mil/P2_Opportunity_Handbook/10-4.html U.S. Navy: Wet Detention Ponds http://h2o.enr.state.nc.us/su/PDF_Files/Land_of_Sky_factsheets/FactSheet_7.pd North Carolina: Maintaining Wet Detention Ponds http://www.fpl.fs.fed.us/documnts/pdf1999/han99b.pdf U.S. Forest Service: Wood-based Detention Ponds Filters

93
Riparian Areas:
http://dnr.metrokc.gov/wlr/pi/ripveg.htm King County: The Value of Riparian Vegetation http://www.riparianbuffers.umd.edu/ Maryland Cooperative Extension: Riparian Buffer Systems http://www.na.fs.fed.us/spfo/pubs/n_resource/buffer/cover.htm US Forest Service: Riparian Forest Buffers http://www.na.fs.fed.us/spfo/pubs/n_resource/buffer/part7.htm US Forest Service: Streamside Buffer Diagram http://www.stormwatercenter.net/Model%20Ordinances/buffer_model_ordinance.htm Montgomery County Planning Commission, Riparian Corridor Conservation District
Streambank Erosion:
http://www.nrm.qld.gov.au/factsheets/pdf/river/R02.pdf NRM Facts: What Causes Bank Erosion?
http://washtenawcd.org/you/streameroscontrol.php Washtenaw County: Streambank Erosion Stabilization Measures
Streambank Stabilization:
http://www.charmeck.org/Departments/LUESA/Water+and+Land+Resources/Programs/Storm+Water/Techniques.htm Charlotte/Mecklenburg County: Stabilization Techniques http://creativehabitatcorp.com/stream.html Creative Habitat: Streambank Stabilization http://mdc.mo.gov/fish/streams/revetmen/ Streams for the Future: Tree Revetments for Streambank Stabilization http://www.nrcs.usda.gov/technical/stream_restoration/newtofc.htm USDA: Stream Corridor Restoration (table of contents)
Stormwater Management:
http://stormwaterfinance.urbancenter.iupui.edu/bibliography.htm Center for Urban Policy and Environment - Stormwater Financing http://www.stormwatercenter.net/ Center for Watershed Protection: Stormwater Management http://www.stormwatercenter.net/Slideshows/smps%20for%20smrc/sld011.htm Center for Watershed Protection: Stormwater Management BMP Slide Show http://www.lid-stormwater.net/ Low Impact Development: Urban Design Tools http://www.mde.state.md.us/Programs/WaterPrograms/SedimentandStormwater/stormwater_design/index.asp Maryland Department of the Environment: Stormwater Design Manual http://www.nrdc.org/water/pollution/storm/stoinx.asp
NRDC - Stormwater Strategies: Community Responses to Runoff Pollution http://ohioline.osu.edu/aex-fact/0442.html

94
Ohio State University: Stormwater Fact Sheet http://www.dep.state.pa.us/dep/deputate/watermgt/wc/subjects/stormwatermanagement/default.htm Pa DEP: Stormwater Management Home Page http://www.stormwatercoalition.org/ Stormwater Coalition: Technical Information (very basic and easy to understand) http://www.forester.net/sw_glossary.html Stormwater Glossary http://www.epa.gov/OST/stormwater/ US EPA: Urban Stormwater Best Management Practices
Water Cycle and Groundwater:
http://www.epa.gov/OGWDW/kids/cycle.html EPA: The Water Cycle at Work http://www.mmsd.com/stormwaterweb/Volume1B.htm Milwaukee Metropolitan Sewerage District: Stormwater Management Primer http://mbgnet.mobot.org/fresh/cycle/index.htm Missouri Botanical Garden: The Water Cycle http://ga.water.usgs.gov/edu/navguide.html USGS: NavGuide for Schools http://ga.water.usgs.gov/edu/watercycle.html USGS: Water Science Basics

Appendix B
Monthly Temperature and Precipitation Averages for Pittsburgh

95
Pittsburgh Weather Temperature (F) Precipitation (inches)
deviation deviation greatest 24 hr yr precip yr dev year month min max avg from norm total from norm amount when from norm
2001 1 7 49 28.5 M 1.35 -1.19 0.13 19-19 2001 2 13 71 35.1 6.4 1.09 -1.30 0.53 14-15 2001 3 13 59 35.3 -4.4 3.28 -0.13 M M 2001 4 27 84 54.3 4.4 3.75 0.60 1.32 6- 7 2001 5 35 85 60.0 0.5 2.11 -1.48 0.54 21-22 2001 6 45 89 68.3 0.1 3.43 -0.28 1.03 31- 1 2001 7 47 90 70.2 -2.0 3.15 -0.60 1.34 30- 1 2001 8 53 92 73.1 2.6 7.12 3.91 1.87 28-28 2001 9 43 86 62.1 -1.8 2.23 -0.74 1.39 31- 1 2001 10 27 81 54.1 1.8 2.33 -0.03 1.32 23-24 2001 11 24 72 48.2 5.9 3.47 0.62 0.76 25-25 2001 12 10 73 37.4 6.0 2.43 -0.49 1.65 17-18 35.74 -1.11 2002 1 9 72 35.4 7.9 1.76 -0.94 0.64 29-30 note: normal precip appears 2002 2 11 65 35.0 4.5 1.17 -1.20 0.48 4- 4 to have changed in 2002 2002 3 12 72 40.9 1.1 3.67 0.50 2.20 21-21 2002 4 22 86 52.7 2.8 3.05 0.04 0.51 28-28 2002 5 31 83 56.7 -3.3 4.70 0.90 0.98 17-18 2002 6 48 90 70.6 2.2 2.63 -1.49 1.62 5- 6 2002 7 52 93 76.0 3.4 1.66 -2.30 0.77 25-25 2002 8 50 95 74.1 3.1 2.89 -0.49 1.31 23-24 2002 9 43 91 67.4 3.4 3.24 0.03 1.57 27-27 2002 10 30 84 51.0 -1.5 2.99 0.74 0.73 16-16 2002 11 18 68 40.3 -2.0 2.00 -1.02 0.37 10-10 2002 12 7 61 30.7 -1.8 2.57 -0.29 0.39 14-14 32.33 -5.52 2003 1 -4 48 21.4 -6.1 2.18 -0.52 1.22 1- 1 2003 2 8 50 26.5 -4.0 2.86 0.49 0.64 22-23 2003 3 4 76 41.0 1.2 1.55 -1.62 0.41 6- 6 2003 4 28 82 53.4 3.5 2.45 -0.56 0.56 4- 4 2003 5 39 82 59.1 -0.9 6.14 2.34 1.04 23-23 2003 6 39 88 65.8 -2.6 3.88 -0.24 0.97 8- 8

96
2003 7 53 87 71.3 -1.3 6.01 2.05 1.18 21-21 2003 8 52 88 72.6 1.6 3.18 -0.20 1.80 30-30 2003 10 29 75 50.5 -2.0 2.57 0.32 0.86 14-14 2003 11 20 79 46.0 3.7 3.42 0.40 1.70 18-19 2003 12 13 61 32.6 0.1 3.34 0.48 0.79 14-14 41.06 3.21
Temperature (F) Precipitation (inches)
deviation deviation greatest 24 hr yr precip yr dev year month min max avg from norm total from norm amount when from norm
2004 1 -1 60 22.2 -5.3 4.78 2.08 1.99 4- 5 2004 2 -1 61 31.7 1.2 2.44 0.07 1.18 5- 6 2004 3 18 78 42.7 2.9 3.60 0.43 0.69 16-16 2004 4 24 83 51.2 1.3 4.49 1.48 1.55 12-13 2004 5 31 86 65.5 5.5 6.09 2.29 1.70 17-18 2004 6 45 87 67.6 -0.8 5.01 0.89 1.04 14-14 2004 7 56 86 71.3 -1.3 5.67 1.71 2.17 26-26 2004 8 49 86 68.7 -2.3 6.13 2.75 2.81 20-21 2004 9 45 83 65.8 1.8 10.06 6.85 5.85 16-17 2004 10 31 75 53.2 1.1 3.36 1.11 1.15 18-19 2004 11 25 77 46.0 3.7 3.19 0.17 0.60 19-20 2004 12 0 67 33.3 0.8 2.61 -0.25 0.80 30-1 57.43 19.58
Source: National Weather Service Preliminary Local Climate Data for Pittsburgh (WS Form F-6) http://www.erh.noaa.gov/er/pbz/climate.htm#Hourly

97
Pittsburgh, PA - Temperature: Average
0.0
10.0
20.0
30.0
40.0
50.0
60.0
70.0
80.0
1 2 3 4 5 6 7 8 9 10 11 12
Month
Deg
rees
Fah
renh
eit
2001200220032004
Pittsburgh, PA - Precipitation: Average
0.00
2.00
4.00
6.00
8.00
10.00
12.00
1 2 3 4 5 6 7 8 9 10 11 12
Month
Inch
es
2001200220032004

98
Pittsburgh, PA - Precipitation: Deviation From Normal
-4.00
-2.00
0.00
2.00
4.00
6.00
8.00
1 2 3 4 5 6 7 8 9 10 11 12
Month
Year Long Deviation2001: -1.11 2002: -5.52 2003: +3.21 2004:
Inch
es 2001200220032004
Pittsburgh, PA - Precipitation: Max 24 Hour
0.00
1.00
2.00
3.00
4.00
5.00
6.00
7.00
1 2 3 4 5 6 7 8 9 10 11 12
Month
Inch
es 2001200220032004

Appendix C
Landslide Prone Soils for Northern Allegheny County

99
Landslide prone soils in northern Allegheny County as listed in the Hampton Township Grading Ordinance: Soil Association* Landslide Risk Potential GrE – Gilpin-Vandergrift Silt Loams, Slumped High GQF – Gilpin Upshur Complex High UaB – Upshur Silty Clay Loam, 3 to 8% slopes Moderate UaC – Upshur Silty Clay Loam, 8 to 15% slopes High GpB – Gilpin Upshur Complex, 3 to 8% slopes Moderate GpC - Gilpin Upshur Complex, 8 to 15% slopes High GpD - Gilpin Upshur Complex, 15 to 25% slopes High GvB – Gilpin Upshur Complex, 3 to 8% slopes Moderate GvC - Gilpin Upshur Complex, 8 to 15% slopes High GvD - Gilpin Upshur Complex, 15 to 25% slopes High EvB – Ernest-Vandergrift Silt Loams, 3 to 8% slopes High EvC- Ernest-Vandergrift Silt Loams, 8 to 15% slopes High EvD - Ernest-Vandergrift Silt Loams, 15 to 25% slopes High * Full descriptions of soil associations can be found in the Soil Survey of Allegheny County, Pennsylvania, published by the USDA Soil Conservation Service.

Appendix D
Watershed Walks
Prepared by members of the North Area Environmental Council and Pine Creek Watershed Assessment Outreach Committee
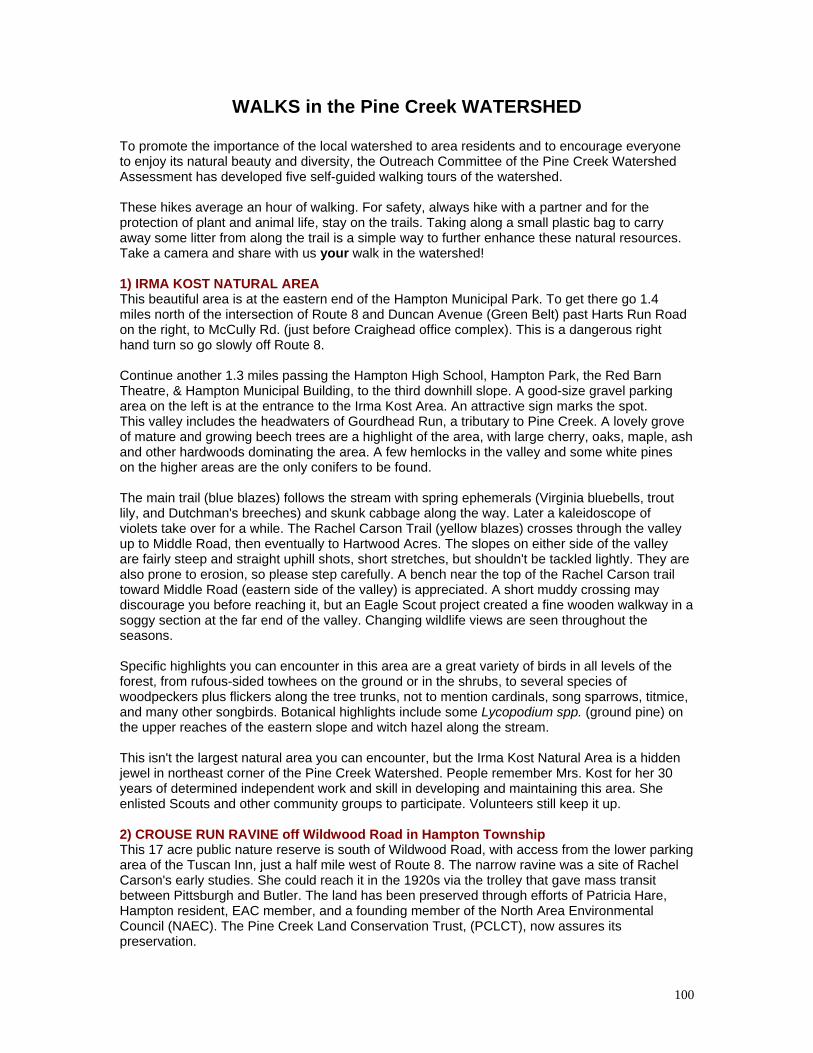
100
WALKS in the Pine Creek WATERSHED
To promote the importance of the local watershed to area residents and to encourage everyone to enjoy its natural beauty and diversity, the Outreach Committee of the Pine Creek Watershed Assessment has developed five self-guided walking tours of the watershed. These hikes average an hour of walking. For safety, always hike with a partner and for the protection of plant and animal life, stay on the trails. Taking along a small plastic bag to carry away some litter from along the trail is a simple way to further enhance these natural resources. Take a camera and share with us your walk in the watershed! 1) IRMA KOST NATURAL AREA This beautiful area is at the eastern end of the Hampton Municipal Park. To get there go 1.4 miles north of the intersection of Route 8 and Duncan Avenue (Green Belt) past Harts Run Road on the right, to McCully Rd. (just before Craighead office complex). This is a dangerous right hand turn so go slowly off Route 8. Continue another 1.3 miles passing the Hampton High School, Hampton Park, the Red Barn Theatre, & Hampton Municipal Building, to the third downhill slope. A good-size gravel parking area on the left is at the entrance to the Irma Kost Area. An attractive sign marks the spot. This valley includes the headwaters of Gourdhead Run, a tributary to Pine Creek. A lovely grove of mature and growing beech trees are a highlight of the area, with large cherry, oaks, maple, ash and other hardwoods dominating the area. A few hemlocks in the valley and some white pines on the higher areas are the only conifers to be found. The main trail (blue blazes) follows the stream with spring ephemerals (Virginia bluebells, trout lily, and Dutchman's breeches) and skunk cabbage along the way. Later a kaleidoscope of violets take over for a while. The Rachel Carson Trail (yellow blazes) crosses through the valley up to Middle Road, then eventually to Hartwood Acres. The slopes on either side of the valley are fairly steep and straight uphill shots, short stretches, but shouldn't be tackled lightly. They are also prone to erosion, so please step carefully. A bench near the top of the Rachel Carson trail toward Middle Road (eastern side of the valley) is appreciated. A short muddy crossing may discourage you before reaching it, but an Eagle Scout project created a fine wooden walkway in a soggy section at the far end of the valley. Changing wildlife views are seen throughout the seasons. Specific highlights you can encounter in this area are a great variety of birds in all levels of the forest, from rufous-sided towhees on the ground or in the shrubs, to several species of woodpeckers plus flickers along the tree trunks, not to mention cardinals, song sparrows, titmice, and many other songbirds. Botanical highlights include some Lycopodium spp. (ground pine) on the upper reaches of the eastern slope and witch hazel along the stream. This isn't the largest natural area you can encounter, but the Irma Kost Natural Area is a hidden jewel in northeast corner of the Pine Creek Watershed. People remember Mrs. Kost for her 30 years of determined independent work and skill in developing and maintaining this area. She enlisted Scouts and other community groups to participate. Volunteers still keep it up. 2) CROUSE RUN RAVINE off Wildwood Road in Hampton Township This 17 acre public nature reserve is south of Wildwood Road, with access from the lower parking area of the Tuscan Inn, just a half mile west of Route 8. The narrow ravine was a site of Rachel Carson's early studies. She could reach it in the 1920s via the trolley that gave mass transit between Pittsburgh and Butler. The land has been preserved through efforts of Patricia Hare, Hampton resident, EAC member, and a founding member of the North Area Environmental Council (NAEC). The Pine Creek Land Conservation Trust, (PCLCT), now assures its preservation.

101
Take the grassy path down from a PCLCT granite marker and cross the stream on the shale rocks below. It is typically just ankle deep to wade. Be careful after heavy rains. Vertical limestone cliffs line the stream on the east. Another crossing, with stepping stones, leads up to an open grassy area once the site of an old hotel. The trail continues to another PCLCT marker, beyond the bench placed by friends in memory of Joe Grom, a respected teacher-naturalist who led many to the area. Access without any wading is available from the Trillium Ridge plan of homes, a left turn off Wildwood Road just up from the Tuscan Inn. This access is a rock-edged trail on the left at the utility posts between the third and fourth homes after entering the plan. (Park along the road.) The trail follows down a long-used route into deep old woods. Plants and birds can differ from those in the valley floor. Another bench there is a good resting place when you climb back up. At one point a rigid cable has been fixed as a hand hold at a steep side connection. Whichever access you choose, you will be enchanted by the terrain which transports you immediately into Rachel Carson's world of exposed limestone, hemlocks & ferns. Bring your wildflower guide, as on the Spring Day we ventured out the floor of this ravine was covered with the spring ephemerals: Bloodroot, Spring Beauty, Trout Lily, emerging May Apple, Violets of many kinds, Skunk Cabbage and the nodding heads of Trillium blossoms. Please note: Though the valley trail has been in use for countless generations all the way to Sample Road, the current landowner south of the second PCLCT marker does not wish any visitors there. PCLCT placed signs to restrict plaguing motorized users, who cause noise & real problems, erosion and damage to plants. Phone Hampton police at 412-486-3201 to report any misuse you observe. 3) ROCKY DELL, near North Park in the area east of the Swimming Pool Rocky Dell is a lovely wild valley that runs between Hemlock Drive II and the railroad crossing on Sample Road. It is part of the Rachel Carson trail which is marked with yellow blazes. They appear newly painted in April 2003. There are several ways to plan a hike in Rocky Dell: From Sample Road in the valley, park next to the bridge over the stream coming down from Rocky Dell. This small pull-off area east of the road is used by fisherman. A white trash bin bears the name Allison Park Sportsmans Club. There is a yellow blaze on the telephone pole on the opposite side of the road. Walk to the railroad tracks and cross the road where there is a double blaze on the telephone pole. Follow the railroad tracks and blazes to another double blaze on a phone pole. (These always mean to watch for a turning on a trail.) Be careful; trains DO run on that track! Turn left up the valley following the trail and blazes. At a point where a gas line crosses, marked by a white pole, the trail becomes narrow with little room between t he stream and the cliff, and a bit further on it ascends along the hillside on a path that is eroding in places, making it rather difficult. The terrain on the other side of the stream is largely flat and looks much more inviting. , our trail researchers walked along the stream and found traces of what looked like an older trail. The stream valley is indeed passable, but it is necessary to cross the stream several times. The marked trail descends to the stream level after awhile, and just around a bend in the stream there is a picnic table. A few feet further is an old abandoned shelter. From there one can climb, largely on an old set of stone steps, to the trail crossing at Hemlock Drive II. At a leisurely pace this hike took us 45 minutes each way. For all or part of this hike in the other direction, drive in onto Hemlock Drive II, past the trail crossing at the stone bridge, and park by the road at Allegheny Grove, across from the Hemlocks II residential complex. Walk back down the road to the trail crossing, follow the stone steps to the old shelter, turn left and hike downstream. One can make a longer hike by starting at Lone Pine Field. This is at the end of the road that cuts across the 1.5-mile South Ridge Road, the one-way loop that begins at Pie Traynor Field. See the large yellow blaze on a concrete block marking this section of the Rachel Carson trail. Cross a red-blazed trail and follow the yellow blazes downhill on an old road to a level spot where

102
the road turns left (about 10 minutes). Continue straight on yellow-blazed trail to Hemlock Drive II, jog left at the double blaze, then right at the next double blaze and down stone steps to the old shelter, etc. One could spot a car at Sample Road for a one-way hike. If you are retracing your steps, you could turn right at the level spot where the old road turned left and you went straight on the trail coming down. You would leave the Rachel Carson Trail and follow the old road back up to South Ridge Road at the Round Top Shelter, then walk across the grass to the Lone Pine Field. Or leave the car at Round Top & walk across to Lone Pine first. 4) SANDY CLIFFS of North Park Total Walking Time: 45 minutes Easy to moderate. Half of the walk is along a paved road in the park, the rest is wooded trail, sometimes rocky & uneven. Hidden among the trees of North Park is a delightful and often-missed surprise. The destination is incongruous, yet striking - sandy orange cliffs, reminding one of a scene from the southwestern U. S. The beginning of the trail is approached from Hemlock Drive, a left turn 0.5 mile south of the traffic light intersection at Ingomar/Wildwood Rd. & Babcock Blvd. in the eastern side of North Park. At the top of Hemlock Drive turn left, pass the swimming pool area, continue up the hill to South Ridge Dr. Turn right at the top T-junction and go about 0.1 mile, to parking area on the right, adjacent to Pie Traynor Baseball Field. Having parked the car, and with the ball field behind you, turn right and walk along the one-way road The road curves to the left. You'll pass the "Black Rock," "Perry," and "Woods" picnic shelters on the right, & "Ellwood" picnic shelter on the left in this half mile. At the road T-junction, bear right and see the walking trail marked by a 2 ft. high concrete block. Take the trail forking left, immediately bear left onto a trail marked with red blazes on the trees. As you walk down the hill, the trail will fork again. Take the trail on your right and continue down the hill. This trail features mixed hardwoods and a rocky path (watch your step!), with yellow blazes marking the stones along the path now and then. Follow the trail down until you reach a large clearing. The sandy cliffs will be on your left as you emerge from the woods and enter this clearing. The cliffs are a beautiful backdrop for photographs, with their striking orange color and striated rock pattern. From here, you may return via the route you came, or continue to follow the trail to the right of the cliffs, passing the sandy cliffs on your left, and under utility lines. This arrives at a T-junction where it joins a gravel road. Follow it to the left. Occasional breaks in the trees on the right side afford lovely views of the hills and fields of Hampton Township below. Soon you will reach the paved road again. Follow it to the right for the entire loop winding back to your parking area. You'll pass 5 more shelters. At the last one there is a green wooden trail head sign that provides a map of other excellent hiking trails in North Park. 5) FALL RUN PARK, Shaler Twp. contains a stream tributary that joins Pine Creek The entrance to Fall Run Park, Shaler Township's largest park at 93.65 acres, is just east of William Penn Hwy (Rte 8) on the left side of Fall Run Rd. Turn in at the light on Route 8, across from Spirit Harley Davidson store (bright orange and black). The Park is marked by an entrance sign and contains a picnic shelter, children's play area, soccer field, portajohn, and a basketball half-court. A large sign marks the entrance, "Judge D. M. Miller Nature Reserve." Another indicates "Community Conservation Partnership Initiative" with funding provided by the Keystone Recreation, Park & Conservation Fund. The nature trail is at least 1 mile. It is a well-maintained trail featuring 7 wooden bridges which allow a visitor to zigzag over the babbling stream without getting wet unless you really want to. The path and bridges eventually lead you to the highlight of the trail, a waterfall. You can view the falls from below, or on a recently built staircase. Total of 34 steps takes you atop the falls. This is definitely one area not to miss in the Pine Creek Watershed!!!

Appendix E
Summary Table of Water Quality Criteria
Prepared by Collective Efforts, LLC

103
Summary Table of Water Quality Criteria
Parameter 25 Pennsylvania Code § 93.7 Specific Water Quality Criteria'
EPA “Volunteer Stream Monitoring: A Methods Manual”
PaSEC Water Quality Training Manual
PA Lake Management Society "Chemical Concentrations of Common Water Quality Parameters - Flowing Water"
Water Temperature (°C)
Varies by month. Maximum temp. in receiving water body resulting from heated waste source. Max temp. depends on critcal use (Cold Water Fishery, Warm Water Fishery, Trout Stocked Fishery). See text regarding critical uses.
Max temp varies by species and life stage
Below 55 deg F there are many healthy aquatic organisms, including trout, damselfly nymph, and dragonfly nymph. Between 55 deg F and 68 deg F there is some plant life, some fish disease, and many aquatic organisms, including damselfly nymph & diving beetle. From 68 deg F to 86 deg F there is abundant plant life, but with temperature increases, many fish may become more susceptible to parasites and disease. Bass and carp are adapted to survive in this higher temp. range.
Up to 66 deg F for CWF 87 deg F for WWF Maximum allowed varies by season.
pH From 6.0 to 9.0 inclusive The largest variety of aquatic animals prefer a range of 6.5 to 8.0
Most aquatic organisms have adapted to survive in water that has a pH range between 6 and 9
6.5 to 8.2 optimal
Parameter 25 Pennsylvania Code § 93.7 Specific Water Quality Criteria'
EPA “Volunteer Stream Monitoring: A Methods Manual”
PaSEC Water Quality Training Manual
PA Lake Management Society "Chemical Concentrations of Common Water Quality Parameters - Flowing Water"

104
Parameter 25 Pennsylvania Code § 93.7 Specific Water Quality Criteria'
EPA “Volunteer Stream Monitoring: A Methods Manual”
PaSEC Water Quality Training Manual
PA Lake Management Society "Chemical Concentrations of Common Water Quality Parameters - Flowing Water"
Dissolved Oxygen (mg/L)
Depends on critical use (Cold Water Fishery, Warm Water Fishery, Trout Stocked Fishery) and time of the year. Minimums range from 4.0 mg/L to 6.0 mg/L.
No criteria provided No criteria provided. 3 to 4 mg/L is stressful to aquatic life. 6 ppm (or mg/L) is OK. 8 ppm is better.
Conductivity (µS/cm)
No criteria provided The conductivity of rivers in the US generally ranges from 50 to 1500 µmhos/cm. Studies of inland fresh waters indicate streams supporting good mixed fisheries have a range between 150 and 500 µmhos/cm.
The conductivity of rivers in the US generally ranges from 50 to 1500 µmhos/cm. Studies of inland fresh waters indicate streams supporting good mixed fisheries have a range between 150 and 500 µmhos/cm.
Usually between 50-1500 µmhos
N, Nitrate + Nitrite (mg/L)
Maximum 10 mg/L for potable water supplies
The natural level of ammonia or nitrate in surface water is typically low (less than 1 mg/L)
Unpolluted waters have nitrate levels below 4.4 ppm.
Rarely exceeds 10 mg/L. Frequently < 1 mg/L during high primary production
Phosphate (mg/L)
No criteria provided No criteria provided. Maximum 0.03 ppm (mg/L) in healthy streams
Non-polluted waters total phosphorus usually < 0.1 mg/L.
Sulfate (mg/L)
Maximum 250 mg/L for potable water supplies
No criteria provided. No criteria provided. 5-50 mg/L in natural waters
Alkalinity (mg/L)
Minimum 20 mg/L as CaCO3, except where natural conditions are less.
No criteria provided. No criteria provided Expected total alkalinities usually range from 20 to 200 mg/L. PA standards require at least 20.

105
Parameter 25 Pennsylvania Code § 93.7 Specific Water Quality Criteria'
EPA “Volunteer Stream Monitoring: A Methods Manual”
PaSEC Water Quality Training Manual
PA Lake Management Society "Chemical Concentrations of Common Water Quality Parameters - Flowing Water"
Water Quality Score (Benthic Survey)
No criteria provided No criteria provided. Good > 40 Fair 20-40 Poor < 20 (Pennsylvania Volunteer Water Quality Monitoring Field Manual)
No criteria provided.

Appendix F
Watershed Protection Inventory
Prepared by the Pine Creek Watershed Assessment Land Use Subcommittee
Adapted from the Watershed Protection Audit
by the Center for Watershed Protection

106
Watershed Protection Inventory
Pine Creek Watershed Background Information Name(s): Department(s): Municipality: Address: Phone: ___________________________________ Fax: Email: ____________________________________ Municipal Population: ____________________________________________________________ Municipal Area (square miles): _____________________________________________________ This inventory was customized for Pine Creek watershed communities from a sample version found in The Do-It-Yourself Watershed Planning Kit, produced by The Center for Watershed Protection based in Ellicot City, Maryland. The most complete answers for some items may come directly from local codes or ordinances. When providing these, please note the specific numbers of the relevant questions. Thank you very much. Questions regarding the inventory may be directed to:
Diane Selvaggio 412/829-2817 (work) [email protected]

107
Pine Creek Watershed Protection Inventory Section 1. Watershed Planning Importance: Regulatory measures and/or planning techniques that are both innovative and
appropriate can be designed to maintain or limit future impervious cover, redirect development where beneficial, and protect sensitive areas.
Local Authority: ______________________________________________________________________ 1.01 Does your community have a comprehensive plan?
Yes Latest update No Don't know
1. 02 Is the comprehensive plan based on political jurisdictions or watersheds?
Political jurisdictions Watersheds Other, please explain__________________ _______________________ Don't know Not applicable
1.03 Does your community participate in multi-municipal planning for:
Water Wastewater treatment Sewer line maintenance Road corridors Transfer of development rights Other
1.04 Does your community have zoning?
Yes No Don't know
1.05 Is your zoning tied to the comprehensive plan?
Yes No Don't know Not applicable

108
Pine Creek Watershed Protection Inventory
Section 1. Watershed Planning 1.06 How often do you typically update your comprehensive plan?
Every 5 years Every 10 years We don't Other, please explain ___________________________________________________ Not applicable
1.07 Does your plan evaluate and take into account impacts of future land use on water resources?
Yes No Don't know Not applicable
1.08 Does your plan identify and address the most important water resource goals for your
community?
Yes No Don't know Not applicable
Section Comments:

109
Pine Creek Watershed Protection Inventory
Section 2. Open Space Conservation Importance: The preservation of open space provides the opportunity to insure rainwater and
snowmelt infiltration, thus minimizing flood potential and maximizing the recharge of the water table. With proper management, riparian areas can function beneficially. Open space also preserves natural habitat niches and presents numerous recreational and educational opportunities.
2.01 Does your community permit or encourage conservation easements (voluntary agreement to
legal transfer of development and land use rights to a piece of property to a conservation trust; easements may be temporary or permanent)?
Yes No 2.02 Does your community permit or encourage land acquisition programs? Yes
If so, please attach a copy of your regulations along with supporting guidance, etc. and highlight key components.
No 2.03 Does your community permit or encourage transfer of development rights (TDRs) (transfer of
potential development from a designated "sending area" to a designated "receiving area”)? Yes
If so, please attach a copy of your regulations along with supporting guidance, etc. and highlight key components.
No 2.04 Does your community permit or encourage limiting infrastructure extension (a conscious
decision is made to limit or deny extending infrastructure, such as public sewer, water, or roads, to designated areas to avoid increased development in these areas)
Yes
If so, please attach a copy of your regulations along with supporting guidance, etc. and highlight key components.
No 2.05 Does your community permit or encourage infill / community redevelopment (encourage new
development and redevelopment within existing developed areas)? Yes
If so, please attach a copy of your regulations along with supporting guidance, etc. and highlight key components.
No

110
Pine Creek Watershed Protection Inventory
Section 2. Open Space Conservation 2.06 Does your community permit or encourage zoning overlay to promote community
redevelopment? Yes
If so, please attach a copy of your regulations along with supporting guidance, etc. and highlight key components.
No 2.07 Does your community permit or encourage zoning variances for existing buildings that may not
fully comply with existing codes or other types of flexibility to promote community redevelopment?
Yes
If so, please attach a copy of your regulations along with supporting guidance, etc. and highlight key components.
No 2.08 Does your community require or encourage developers to identify key environmental features
before any engineering is done or site plans are designed? (In other words: a site review with the intent to review options)
Yes
If so, please attach a copy of your regulations along with supporting guidance, etc. and highlight key components.
No Section Comments:

111
Pine Creek Watershed Protection Inventory Section 3. Land Conservation Importance: The ways in which land is used have a direct relationship to the quality and quantity of
surface water and ground water. Therefore, the focus of municipal planning and ordinances can improve or impair the watershed. Programs or efforts to conserve undeveloped, sensitive areas, or areas of particular historical or cultural value are some methods that can offer improvement.
Local Authority: _________________________________________________________________________ 3.01 Does your community participate in the National Flood Insurance Program (NFIP)?
Yes No Don't know
3.02 If yes, what type of floodplain regulations do you have?
NFIP minimum standards Other, please describe key components and attach a copy of your regulations Don't know Not applicable
3.03 Are your floodplains mapped?
Yes No Don't know
3.04 Other than what is required by state and federal laws, is the preservation of cultural or historical
areas (e.g., historic or archaeological sites, scenic views, and recreational areas):
Required Encouraged Neither Don't know Other, please describe:
If cultural or historical preservation is required or encouraged, please attach a copy of your regulations along with supporting guidance, etc. and highlight key components.

112
Pine Creek Watershed Protection Inventory Section 3. Land Conservation
3.05 Is the preservation of agricultural areas:
Required Encouraged Neither Don't know Other, please describe:
If agriculture preservation is required or encouraged, please attach a copy of your regulations along with supporting guidance, etc. and highlight key components.
3.06 Are you aware of any critical habitat areas for plant and animal species in your community?
Yes No Don't know Not applicable
3.07 Other than what is required by state and federal laws, is the preservation of critical habitat areas
for plant and animal species:
Required Encouraged Neither Don't know Other, please describe:
If critical habitat preservation is required or encouraged, please attach a copy of your methods along with supporting guidance, regulations, etc. and highlight key components.
3.08 Does your community have regulations or requirements, other than what is required by state and
federal laws, governing the preservation of wetlands during development?
Yes No Don't know Other, please describe ______________________________________________________ _
If wetland preservation is required or encouraged, please attach any relevant information regarding key components of your methods along with supporting guidance, regulations, etc.
3.09 What regulations does your community have regarding planned residential developments (PRD) for single family, multi-unit, etc. dwellings? Please attach any relevant information.
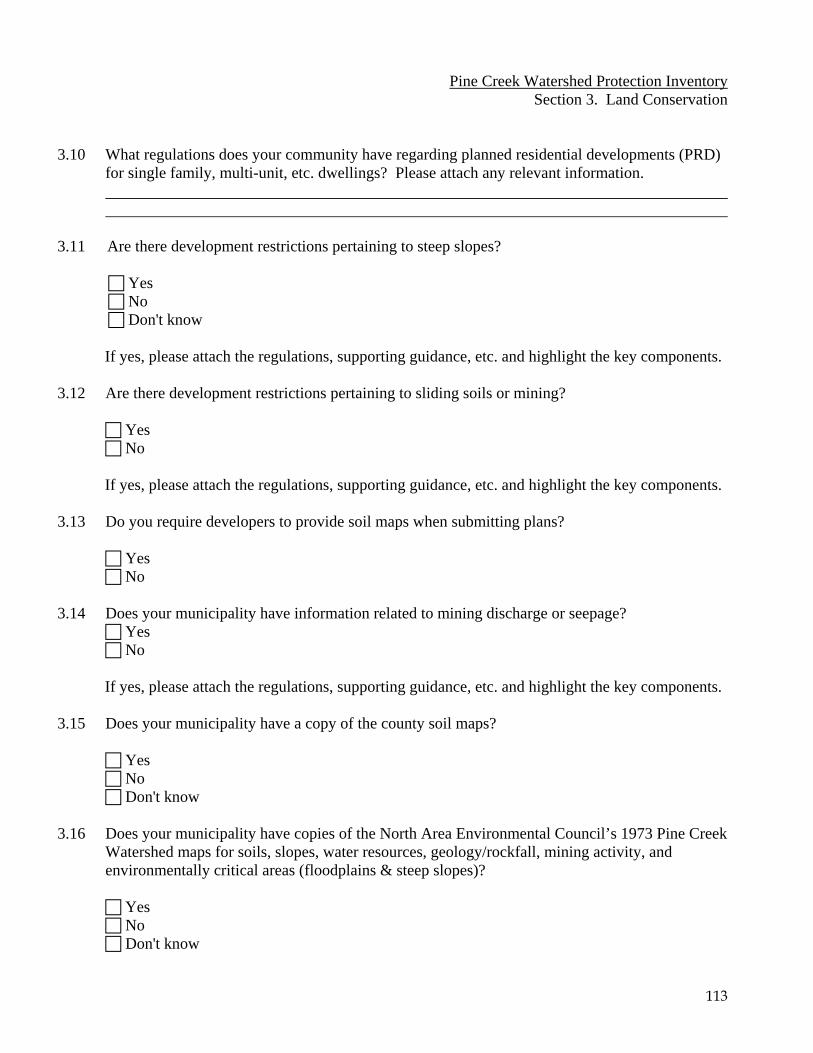
113
Pine Creek Watershed Protection Inventory Section 3. Land Conservation
3.10 What regulations does your community have regarding planned residential developments (PRD)
for single family, multi-unit, etc. dwellings? Please attach any relevant information. 3.11 Are there development restrictions pertaining to steep slopes?
Yes No Don't know
If yes, please attach the regulations, supporting guidance, etc. and highlight the key components.
3.12 Are there development restrictions pertaining to sliding soils or mining? Yes No
If yes, please attach the regulations, supporting guidance, etc. and highlight the key components.
3.13 Do you require developers to provide soil maps when submitting plans? Yes No 3.14 Does your municipality have information related to mining discharge or seepage? Yes No
If yes, please attach the regulations, supporting guidance, etc. and highlight the key components.
3.15 Does your municipality have a copy of the county soil maps?
Yes No Don't know 3.16 Does your municipality have copies of the North Area Environmental Council’s 1973 Pine Creek
Watershed maps for soils, slopes, water resources, geology/rockfall, mining activity, and environmentally critical areas (floodplains & steep slopes)?
Yes No Don't know

114
Pine Creek Watershed Protection Inventory Section 3. Land Conservation
3.17 Is the conservation of forested areas:
Required Encouraged Neither Don't know Other, please describe:
3.18 Does your municipality have an ordinance on:
Timbering? Clear cutting? Preservation of specimen trees?
Yes Yes Yes No No No Don't know Don't know Don't know
If forest area conservation is required or encouraged, and if timbering ordinances protect vegetated steep slopes, please attach the regulations, supporting guidance, etc. and highlight the key components.
3.19 Are there development restrictions pertaining to stream channel modification?
Yes No Don't know
If yes, please attach the regulations, supporting guidance, etc. and highlight the key components.
3.20 What information does your municipality have in a Geographic Information System (GIS)?
Steep slopes All soils Sliding soils
Mining activity Mine discharge or seepage Vegetation types Natural amenities
Environmentally sensitive areas Don't have GIS 3.21 If you have GIS information, are your maps available to elected officials at public meetings?
Yes No

115
Pine Creek Watershed Protection Inventory Section 3. Land Conservation
3.22 If you have GIS information, are your maps available to members of the planning commissions,
zoning hearing boards, Environmental Advisory Council’s, etc. at public meetings?
Yes No Don't know
3.23 Is staff required to attend regional or state workshops to expand their skills or knowledge of
relevant subjects? Elected officials &/or board members?
Yes Yes No No
3.24 Is staff attendance at regional or state workshops to expand their skills or knowledge of relevant
subjects facilitated by your municipality? Elected officials &/or board members?
Yes Yes No No
3.25 Does your municipality have specific expectations or requirements for its elected officials or
members of its boards, which are outlined in writing, regarding:
Prior education in specific areas Mandatory ongoing training in specific areas Optional ongoing training in specific areas Time spent in preparation for meetings Limits of authority or ability to recommend
3.26 Aside from what is required, does your municipality work with:
The Southwest Planning Commission (SPC) Local Department of Environmental Protection (DEP) personnel Conservation District personnel Other
Section 3 Comments:

116
Pine Creek Watershed Protection Inventory Section 4. Aquatic Buffers Importance: In natural settings, the land and vegetation adjacent to bodies of water function to slow
the velocity of surface runoff, reduce erosion, filter pollutants, and absorb excess water. Consequently, the protection, restoration, creation, or reforestation of stream, wetland, and urban lake buffers offers significant improvement to problems of water quality or quantity.
Local Authority: ________________________________________________________________________ 4.01 Are stream buffers required in your community?
Yes No Don't know
If yes, please attach the regulations, supporting guidance, etc. and highlight the key components.
4.02 What are your stream buffer width requirements? _____________________________________________________________________________ 4.03 Are wetland buffers required in your community?
Yes No Don't know
4.04 What are your wetland buffer width requirements? _____________________________________________________________________________ 4.05 Are there reforestation, restoration, or riparian cover requirements or programs for buffers?
Yes No Don't know Not applicable
If yes, please attach the regulations, supporting guidance, etc. and highlight the key components.
4.06 Are native plant species encouraged for reforestation, restoration, or riparian cover requirements
or programs for buffers?
Yes No Don't know Not applicable
If yes, please attach the regulations, supporting guidance, etc. and highlight the key components.

117
Pine Creek Watershed Protection Inventory
Section 4. Aquatic Buffers
Section 4 Comments:

118
Pine Creek Watershed Protection Inventory Section 5. Better Site Design Importance: Maximizing open space, natural terrain, and natural features preserves the ability of the
land to function normally, thus assisting in flood prevention and increasing ground water supply. Local ordinances and codes that incorporate techniques to reduce impervious cover and/or redirect runoff onto pervious surfaces in the design of new development and redevelopment projects encourage this strategy.
Local Authority: _______________________________________________________________ Street Width 5.01 What is the minimum pavement width allowed for streets in low-density residential
developments that have less than 500 average daily trips (ADT)?
18 - 22 feet 23 - 26 feet Greater than 26 feet
5.02 In higher density development are parking lanes allowed to also serve as traffic lanes (i.e.,
queuing streets)?
Yes No
Right-of-Way (ROW) Width 5.03 What is the minimum right-of-way (ROW) width for a residential street?
Less than 45 feet Greater than 45 feet
5.04 Does the code allow utilities to be placed under the paved section of the ROW?
Yes No Not specified in codes
Cul-de-Sacs 5.05 What is the minimum radius allowed for cul-de-sacs on public roads?
Less than 35 feet 36 feet to 45 feet Greater than 45 feet

119
Pine Creek Watershed Protection Audi Section 5. Better Site Design
5.06 What is the minimum radius allowed for cul-de-sacs on private roads?
Less than 35 feet 36 feet to 45 feet Greater than 45 feet
5.07 Can a landscaped island be created within the cul-de-sac?
Yes No Not specified in codes
5.08 Are alternative turn-arounds such as "hammerheads" allowed on short streets in low-density
residential developments?
Yes No Not specified in codes
Vegetated Open Channels 5.09 Does your municipality allow vegetated open channels or bioswales?
Yes No Not specified in codes
5.10 Are curb and gutters required for most residential street sections?
Yes No
Parking Ratios 5.11 What is the minimum parking ratio for a professional office building (per 1000 ft2 of gross floor
area)? Less than or equal to 3.0 spaces per 1,000 ft2 of gross floor area 3.1 to 5.0 spaces per 1,000 ft2 of gross floor area
Greater than 5.0 spaces per 1,000 ft2 of gross floor area 5.12 What is the minimum required parking ratio for shopping centers (per 1, 000 ft2 gross floor area)?
Less than or equal to 4.0 spaces per 1,000 ft2 of gross floor area 4.1 to 5.05 spaces per 1,000 ft2 of gross floor area Greater than 5.05 spaces per 1,000 ft2 of gross floor area
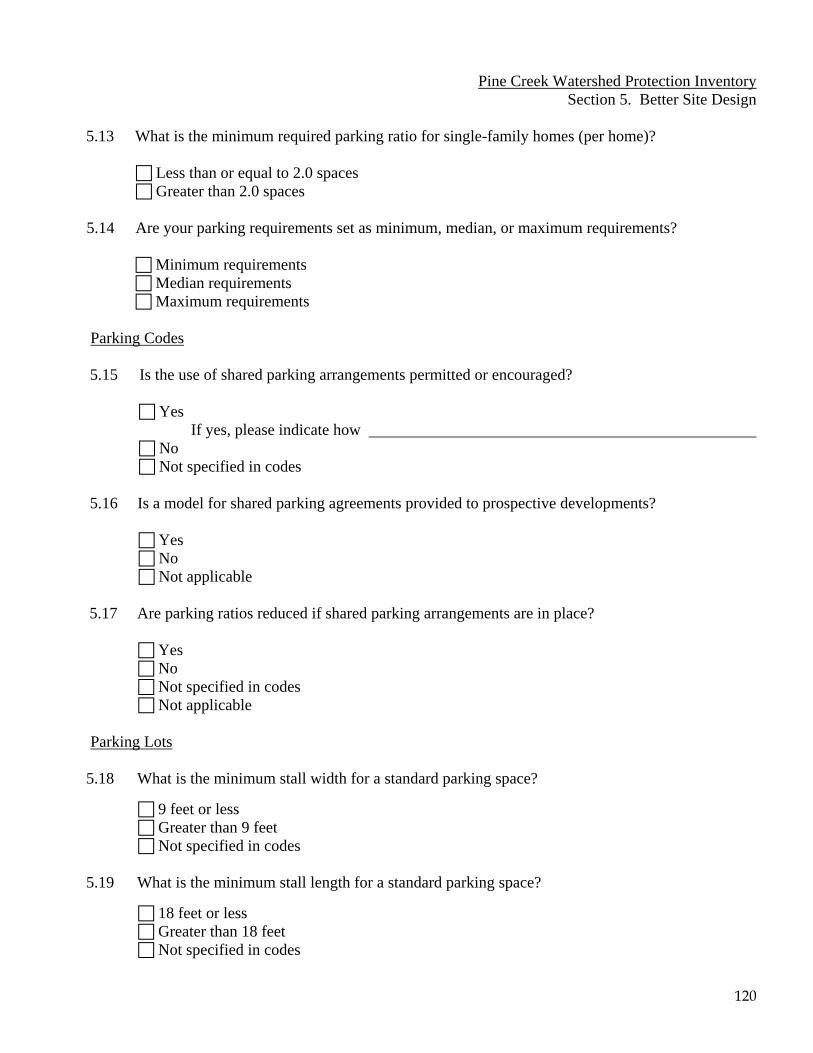
120
Pine Creek Watershed Protection Inventory Section 5. Better Site Design
5.13 What is the minimum required parking ratio for single-family homes (per home)?
Less than or equal to 2.0 spaces Greater than 2.0 spaces
5.14 Are your parking requirements set as minimum, median, or maximum requirements?
Minimum requirements Median requirements Maximum requirements
Parking Codes
5.15 Is the use of shared parking arrangements permitted or encouraged?
Yes If yes, please indicate how
No Not specified in codes
5.16 Is a model for shared parking agreements provided to prospective developments?
Yes No Not applicable
5.17 Are parking ratios reduced if shared parking arrangements are in place?
Yes No Not specified in codes Not applicable
Parking Lots
5.18 What is the minimum stall width for a standard parking space?
9 feet or less Greater than 9 feet Not specified in codes
5.19 What is the minimum stall length for a standard parking space?
18 feet or less Greater than 18 feet Not specified in codes
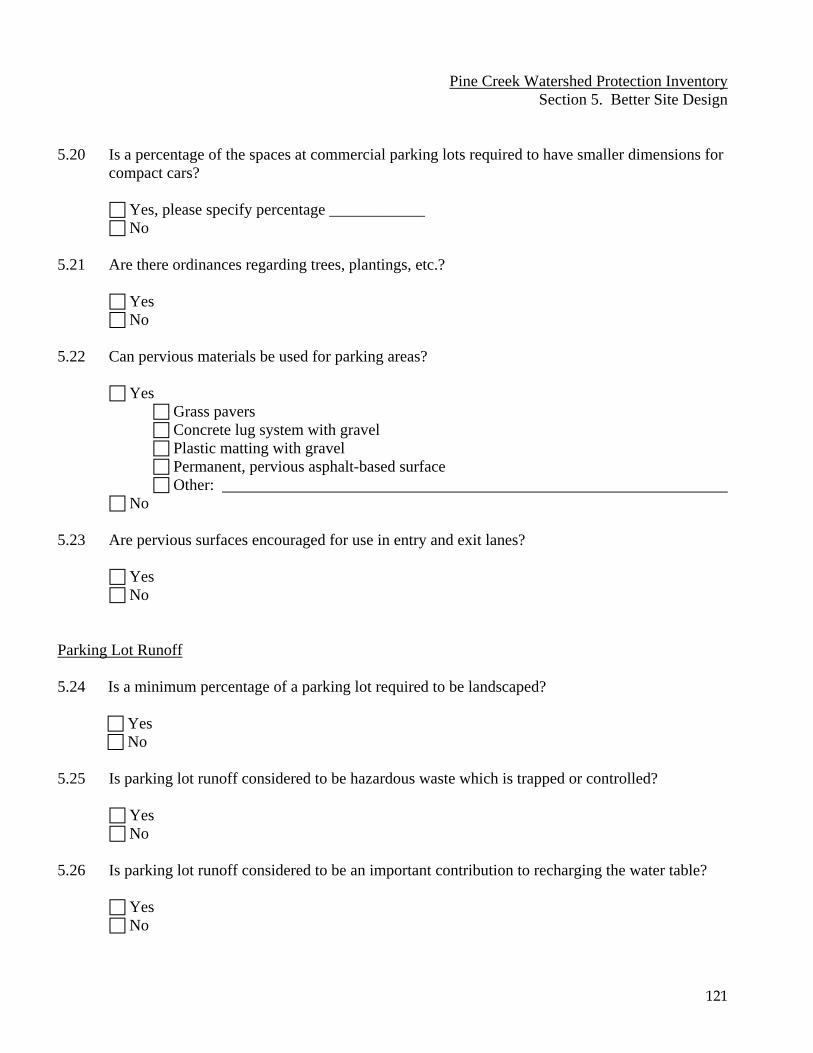
121
Pine Creek Watershed Protection Inventory Section 5. Better Site Design
5.20 Is a percentage of the spaces at commercial parking lots required to have smaller dimensions for
compact cars?
Yes, please specify percentage ____________ No
5.21 Are there ordinances regarding trees, plantings, etc.?
Yes No
5.22 Can pervious materials be used for parking areas?
Yes Grass pavers Concrete lug system with gravel Plastic matting with gravel Permanent, pervious asphalt-based surface Other:
No 5.23 Are pervious surfaces encouraged for use in entry and exit lanes?
Yes No
Parking Lot Runoff 5.24 Is a minimum percentage of a parking lot required to be landscaped?
Yes No
5.25 Is parking lot runoff considered to be hazardous waste which is trapped or controlled?
Yes No
5.26 Is parking lot runoff considered to be an important contribution to recharging the water table?
Yes No

122
Pine Creek Watershed Protection Inventory Section 5. Better Site Design
Open Space Design 5.27 Are open space or cluster development, for single family homes – aside from PRDs designs
allowed in the community?
Yes No Not specified in codes
5.28 Are conservation developments encouraged in the community?
Yes If yes, please indicate how
No Not specified in codes
5.29 Are developers encouraged to design for the existing conditions?
Yes If yes, please indicate how
No Not specified in codes
5.30 Are the submittal or review requirements for open space design greater than those for
conventional development?
Yes No Not applicable
5.31 Are flexible site design criteria available for developers that utilize open space or cluster design
options (e.g., setbacks, road widths, lot sizes)? Minimum lot size?
Yes No Not specified in codes Not applicable
Setbacks and Frontages 5.32 Are irregular lot shapes (e.g., pie-shaped, flag lots) allowed in the community?
Yes No Not specified in codes

123
Pine Creek Watershed Protection Inventory
Section 5. Better Site Design 5.33 What is the minimum requirement for front setbacks for the following residential lot sizes? 1/4 acre residential lot 1/2 acre residential lot 1 acre residential lot
20 feet or less 20 feet or less 20 feet or less 21 feet to 30 feet 21 feet to 30 feet 21 feet to 30 feet 31 to 40 feet 31 to 40 feet 31 to 40 feet Greater than 40 ft Greater than 40 ft Greater than 40 ft
5.34 What is the minimum requirement for rear setbacks for the following residential lot sizes? 1/4 acre residential lot 1/2 acre residential lot 1 acre residential lot
25 feet or less 25 feet or less 25 feet or less 26 feet to 40 feet 26 feet to 40 feet 26 feet to 40 feet Greater than 40 ft Greater than 40 ft Greater than 40 ft
5.35 What is the minimum requirement for side setbacks for the following residential lot sizes? 1/4 acre residential lot 1/2 acre residential lot 1 acre residential lot
8 feet or less 8 feet or less 8 feet or less Greater than 8 feet Greater than 8 feet Greater than 8 feet
5.36 What is the minimum frontage distance for the following residential lot sizes? 1/4 acre residential lot 1/2 acre residential lot 1 acre residential lot 80 feet or less 80 feet or less 80 feet or less Greater than 80 feet Greater than 80 feet Greater than 80 feet Zoning designations 5.37 Please list the zoning designations in your community – that fall within the watershed, their
definitions, and percentages of the total land use.

124
Pine Creek Watershed Protection Inventory Section 5. Better Site Design
Sidewalks 5.38 Are sidewalks prohibited? Yes (skip to #5.42) No 5.39 Are sidewalks required? Yes No 5.40 If so, are sidewalks always required on both sides of residential streets? Yes No 5.41 What is the minimum sidewalk width allowed in the community? 4 feet or less Greater than 4 feet Not specified in codes Not applicable 5.42 Can alternate pedestrian networks be substituted for sidewalks (e.g., trails through common
areas)? Yes No Not specified in codes Not applicable Driveways 5.43 What is the minimum one-lane driveway width specified in the community?
9 feet or less Greater than 9 feet Not specified in codes
5.44 Can pervious materials be used for single-family home driveways (e.g., grass, gravel, porous
pavers, etc)?
Yes No Not specified in codes

125
Pine Creek Watershed Protection Inventory Section 5. Better Site Design
5.45 Can a "two-track" design be used at single-family driveways (a driveway with two strips of
paving corresponding to wheel tracks with a vegetated area in between)?
Yes No Not specified in codes
5.46 Are shared driveways permitted in residential developments?
Yes No Not specified in codes
Open Space Management Skip to question 5.50 if open space, cluster, or conservation developments are not allowed in your community. If open space developments are allowed, please attach any pertinent information. 5.47 Are open space areas within subdivisions required to be consolidated into larger units?
Yes No Not specified in codes
5.48 Does a minimum percentage of open space in a residential subdivision have to be managed in a
natural condition?
Yes No Not specified in codes
5.49 Are allowable and unallowable uses for open space in residential developments defined?
Yes No
Rooftop Runoff 5.50 Can rooftop runoff be discharged to yard areas?
Yes No Not specified in codes

126
Pine Creek Watershed Protection Inventory Section 5. Better Site Design
Section 5 Comments:

127
Pine Creek Watershed Protection Inventory Section 6. Erosion and Sediment Control Importance: Topsoil is a valuable resource on land. In the water, soil, sand, clay, and other
materials can smother habitats and food supplies, reduce sunlight, and abrade sensitive tissues of fish and other organisms. It also contributes to the scour of streambanks, eroding them and causing the land above to fall. The use of erosion control, sediment control, and dewatering practices at all new development and redevelopment sites can reduce these problems.
Local Authority: ________________________________________________________ 6.01 During construction, is erosion and sediment control required for:
All sites Sites greater than 1 acre Sites greater than 2 acres Sites greater than 5 acres No sites Don't know
If erosion and sediment control is required, please provide a copy of your regulations and any additional guidance.
6.02 Does your community provide guidance or set forth requirements on the types of erosion and
sediment control practices that may be used?
Yes, we refer the development community to a state document Yes, we have developed our own guidance and/or requirements No Don't know Not applicable
If your community has developed guidance and/or requirements, please attach a copy.
6.03 Check all erosion and sediment control practices that your community has required to be
implemented in the past three years:
Silt fence Straw bales Permanent seeding/ mulching Construction phasing Construction sequencing Erosion blankets and Dust control geotextiles Preservation and non- Fiber rolls
disturbance of natural Temporary stream crossings vegetation Stabilized construction
Preservation and non- entrance disturbance of stream or Exit tire wash wetland buffers Energy dissipation at pipe outlets
Temporary seeding/ mulching Stair-step grading

128
Pine Creek Watershed Protection Inventory Section 6. Erosion & Sediment Control
Check dams in natural or Secondary filtration man-made channels (mechanical or sand filtration
Sand / gravel bag barrier devices to filter fine sediments Brush or rock filter from runoff) Storm drain inlet protection Dikes / berms as conveyance Catch basin inlet filters to ESC structures Sedimentation basins Pipe slope drains to bypass Sediment traps erodible soils Filtration of dewatering Stockpile stabilization
6.04 Is an erosion and sediment control plan required during the site plan review process?
Yes No Don't know Not applicable
6.05 Are construction sites inspected for compliance with erosion and sediment control requirements?
Yes No Don't know Not applicable
6.06 Who conducts inspections of construction sites for compliance with erosion and sediment
control requirements?
County / municipal inspector Third-party inspector (e.g. private engineer) Other, please describe ____________________________________________________ Not applicable
6.07 How frequently does an erosion and sediment control inspector visit a construction site?
Daily Weekly Monthly Annually Other, please describe_______________________________________________________ Not applicable

129
Pine Creek Watershed Protection Inventory Section 6. Erosion & Sediment Control
6.08 Please describe the training or background required for erosion and sediment control inspectors. ______________________________________________________________________________
__________________________________________________________________________________________________________________________________________________________________________________________________________________________________________
6.09 Does your community sponsor erosion and sediment control training for:
Developers Contractors Engineers Inspectors None of the above Not applicable
6.10 Are there erosion and sediment control enforcement mechanisms (e.g. fines, stop work orders,
etc.)?
Yes No Don't know Not applicable
If yes, please attach a copy of enforcement mechanisms.
6.11 Is mowing to the edge of streambanks on public lands prohibited?
Yes No
6.12 Is mowing to the edge of streambanks on private lands discouraged?
Yes No
6.13 Are native plants being used at the edges of streambanks on public lands?
Yes No
6.14 Is the use of native plants at the edges of streambanks encouraged on private lands?
Yes No

130
Pine Creek Watershed Protection Inventory
Section 6. Erosion & Sediment Control Section 6 Comments:
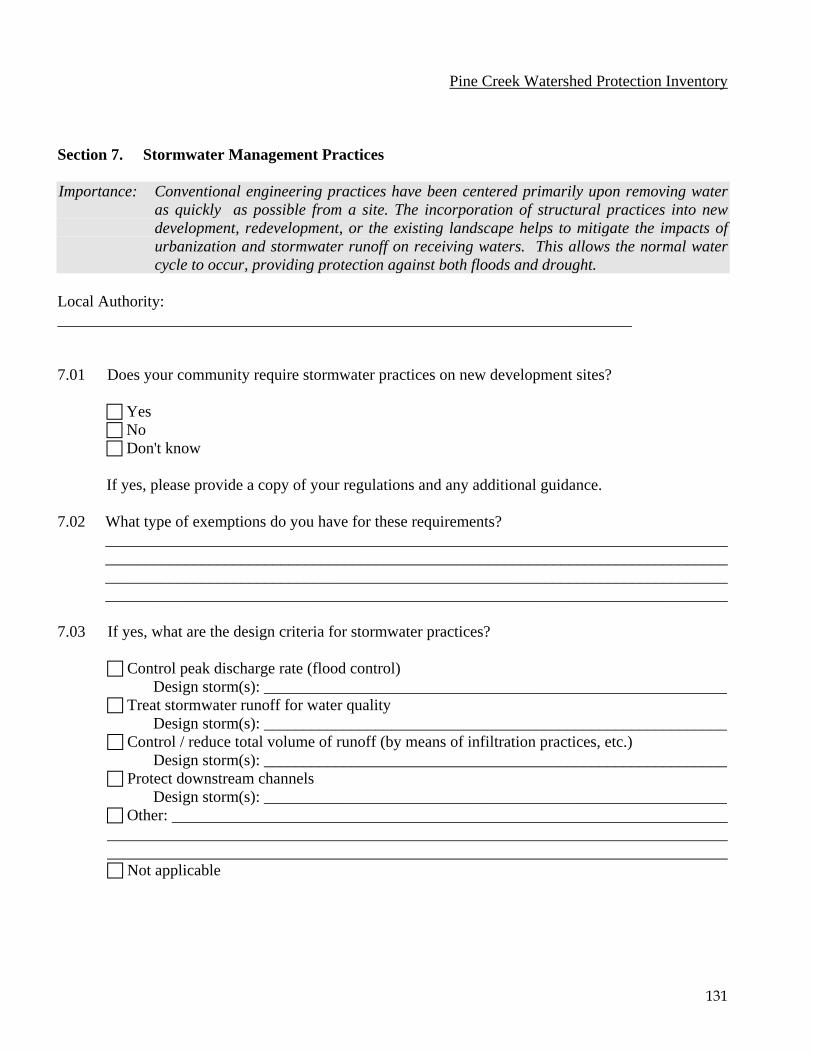
131
Pine Creek Watershed Protection Inventory Section 7. Stormwater Management Practices Importance: Conventional engineering practices have been centered primarily upon removing water
as quickly as possible from a site. The incorporation of structural practices into new development, redevelopment, or the existing landscape helps to mitigate the impacts of urbanization and stormwater runoff on receiving waters. This allows the normal water cycle to occur, providing protection against both floods and drought.
Local Authority: ________________________________________________________________________ 7.01 Does your community require stormwater practices on new development sites?
Yes No Don't know
If yes, please provide a copy of your regulations and any additional guidance.
7.02 What type of exemptions do you have for these requirements?
________________________________________________________________________________________________________________________________________________________________________________________________________________________________________________________________________________________________________________________
7.03 If yes, what are the design criteria for stormwater practices?
Control peak discharge rate (flood control) Design storm(s): __________________________________________________________
Treat stormwater runoff for water quality Design storm(s): __________________________________________________________
Control / reduce total volume of runoff (by means of infiltration practices, etc.) Design storm(s): __________________________________________________________
Protect downstream channels Design storm(s): __________________________________________________________
Other:
Not applicable

132
Pine Creek Watershed Protection Inventory Section 7. Stormwater Management Practices
7.04 Does your community provide guidance or set forth requirements on the types of
stormwater practices that may be constructed?
Yes, we refer the development community to a state document Yes, we have developed our own guidance and/or requirements No Don't know Not applicable
If your community has developed guidance and/or requirements, please attach a copy. 7.05 What are the top three stormwater practices typically installed in your community? _____________________________________________________________________________
____________________________________________________________________________________________________________________ _____________________________
7.06 Is a stormwater plan or other documentation required during the site plan review process?
Yes No Don't know Not applicable
7.07 Does your community inspect stormwater practices during construction?
Yes No Don't know Not applicable
7.08 Is an as-built or record drawing of the stormwater practice required after construction?
Yes No Don't know Not applicable
7.09 Who is typically responsible for maintenance of stormwater practices over the life of the
stormwater practice?
Private owner Builder Homeowner's association Permitting agency Other, please explain_________________________________________________________ Don't know Not applicable

133
Pine Creek Watershed Protection Inventory Section 7. Stormwater Management Practices
7.10 Is there a maintenance agreement or covenant between the permitting agency and the private
owner, builder, or homeowner's association in charge of maintenance?
Yes No Don't know Not applicable
7.11 Are privately maintained stormwater practices inspected by a public agency for maintenance
upkeep or structural integrity over the life of the facility?
Yes No Don't know Not applicable
7.12 How frequently are privately owned stormwater practices inspected?
More than once a year Once a year Every two years In response to complaints Never Other, please describe________________________________________________________ Don't know Not applicable
7.13 Are there penalties for not complying with the maintenance agreement or other applicable
regulations applying to maintenance?
Yes No Don't know Not applicable
If yes, please describe penalties. _____________________________________________________________________________
_____________________________________________________________________________
_____________________________________________________________________________
_____________________________________________________________________________
_____________________________________________________________________________

134
Pine Creek Watershed Protection Inventory Section 7. Stormwater Management Practices
7.14 Does your municipality encourage ground water recharge practices?
Grass swales Plantings in cul-de-sacs Pervious paved surfaces Retention ponds (as opposed to detention ponds) Other, please describe________________________________________________________
Section 7 Comments:

135
Pine Creek Watershed Protection Inventory Section 8. Non-Stormwater Discharges Importance: Industrial effluents, sanitary waste water, fertilizers, petroleum products and salt on road
surfaces, are just a few of the point and non-point sources of water pollution. Locating, quantifying, and controlling non-stormwater pollutant sources in the watershed is the first step towards water quality improvement. Identifying operation and maintenance practices that prevent or reduce pollutants entering the municipal or natural drainage system is the second.
Local Authority: ____________________________________________________________________ Sanitary and Stormwater Sewer System 8.01 The best description of my community's stormwater management system is: Storm sewers
Open channels Combination, please provide relative percentage of each Other, please describe______________________________________________________ Don't know
8.02 How does your community manage sanitary wastes (check all that apply)? Septic systems Aeration systems Package treatment plants Centralized wastewater treatment plants Other, please describe Don't know 8.03 Do the sanitary sewer trunk mains follow (check all that apply): Shortest distance Stream valley Other, please describe_____________________________________________________ Don't know Not applicable 8.04 Is there a program for illicit connection detection? Yes No Don't know Not applicable

136
Pine Creek Watershed Protection Inventory Section 8. Non-Stormwater Discharges
8.05 Does your illicit connection detection program include provisions for removal of illicit
discharges?
Yes No Don't know Not applicable
8.06 Within the Pine Creek watershed, does your community have any involvement responding to
septic system complaints (e.g. any investigation prior to contacting Allegheny County)?
Yes No Don't know Not applicable
If yes, please explain. ____________________________________________________________________________________________________________________________________________________________________________________________________________________________________________________________________________________________________________________
8.07 Does your community conduct inspections of privately owned septic systems?
Yes No Don't know Not applicable
Confined Animal Feeding Lots 8.08 Are there regulations regarding stormwater runoff from confined animal feeding lots?
Yes No Not applicable Don't know
If yes, please attach a copy of the regulations.
Spill Response, Prevention and Cleanup 8.09 Does your community have a spill response plan?
Yes No Don't know

137
Pine Creek Watershed Protection Inventory Section 8. Non-Stormwater Discharges
Snow Management 8.10 What deicing compounds are applied to asphalt public roads?
Sand Road salt (Sodium Chloride, NaCl) Calcium Chloride (CaC12) Magnesium Chloride (MgC12) Other, please describe
8.11 What deicing compounds are applied to cinder public roads?
Sand Road salt (Sodium Chloride, NaCl) Calcium Chloride (CaC12) Magnesium Chloride (MgC12) Other, please describe
8.12 How are the deicing compounds stored?
Within structure Covered, but not in structure Not covered Other, please explain
Household Hazardous Waste 8.13 Is there a local household hazardous waste collection program?
Yes Where? How often? Don't know
Section 8 Comments:

138
Pine Creek Watershed Protection Inventory Section 9. Watershed Stewardship Programs Importance: Education and the understanding of any problem promotes a change in attitude, which in
turn promotes a change in behavior. Stormwater and watershed education or outreach programs targeted towards modifying human behavior to prevent or reduce pollution over a range of land uses and activities will decrease the amount of municipal effort necessary to implement new regulations.
Local Authority: ____________________________________________________________________ 9.1 Does your community administer or support education or outreach programs targeted towards:
Residents Commercial sector Industrial sector Municipal employees Other, please describe None of the above
9.2 Are there any stream stewardship or volunteer monitoring programs within your community?
Yes (please identify) _____________________________________________________ No Don't know
9.3 Are there any stream restoration programs or projects within your community?
Yes No Don't know
If yes, please provide a copy of relevant information.
Pet Waste Management 9.4 Does your community have any restrictions on pet waste management?
Yes No Don't know
If yes, please describe regulations or restrictions or attach any pertinent information. _______________________________________________________________________________________________________________________________________________________________________________________________________________________________________

139
Pine Creek Watershed Protection Inventory Section 9. Watershed Stewardship Programs
Street Sweeping 9.05 Does your community sweep public streets? Yes No Don't know 9.06 What types of machines are used?
9.07 How often does street sweeping occur? Weekly Monthly Annually Other, please explain_________________________________________________________ Not applicable 9.08 Does street sweeping vary seasonally (e.g., streets are not swept in winter)? Yes, please explain__________________________________________________________ No Don't know Not applicable Lawn Care 9.09 Are fertilizers used on public lands? Yes No Don't know 9.10 Are pesticides (insecticides, herbicides) used on public lands? Yes No Don't know

140
Pine Creek Watershed Protection Inventory Section 9. Watershed Stewardship Programs
Section 9 Comments:

141
Inventory Notes:

Appendix G
Watershed Protection Inventory – Summary of Responses
Prepared by the Pine Creek Watershed Assessment Land Use Subcommittee

142
The Pine Creek Watershed Assessment Land Use Committee would like to express its appreciation to the municipal staff who completed the Land Use Inventory. The Inventory contained numerous, detailed questions that required valuable staff time to complete. The amount of information received from the municipalities was tremendous, and it was extremely helpful in completing the land use analysis. While all of the supporting comments and materials could not be included in this report, much of the information can be found on-line or at the municipal office. Contact information for each municipality is listed below along with the names of the individuals who completed the inventory.
Municipal Contacts Bradford Woods Borough www.bradfordwoodspa.org 4908 Wexford Run Road Bradford Woods, PA 15015 (724) 935-2990 Mary Ann Moretti, Secretary-Treasurer Etna Borough www.etnaborough.org 437 Butler St. Pittsburgh, PA 15223 (412) 781-0569 Mary Ellen Ramage, Manager Fox Chapel Borough www.fox-chapel.pa.us 401 Fox Chapel Road Pittsburgh, PA 15238 (412) 963-1100 William Gordon, P.E., Borough Manager Franklin Park www.borough.franklin-park.pa.us 2344 West Ingomar Road Pittsburgh, PA 15237 (412) 364-4115 Tim Phillips, Code Officer/Building Inpector Ambrose Rocca, Manager
Hampton Township www.hampton-pa.org 3101 McCulley Road Allison Park, PA 15101 (412) 486-0400 Larry Moore, Planning and Zoning Indiana Township www.indianatownship.com 941 Route 910 Indianola, PA 15051 (412) 767-5333 Jeff Curti, Code Enforcement Officer Dan Slagle, Engineer Bob Kipp, Planner McCandless, Town of 9955 Grubbs Road Wexford, PA 15090 (412) 364-0616 Tobias Cordek, Town Manager Bruce Betty, Planning and Zoning Administrator Marshall Township www.twp.marshall.pa.us Box 2094 Warrendale, PA 15086 (724) 935-3090 Michelle Mixell, Planning Director Scott Shoup, Township Engineer

143
O’Hara Township www.ohara.pa.us 325 Fox Chapel Road Pittsburgh, PA 15238 (412) 782-1400 Douglass Arndt, Township Manager Robert Robinson, P.E., Township Engineer Cindy Davis, Code Enforcement Officer Loren Kephart, Public Service Department Pine Township 230 Pearce Mill Road Wexford, PA 15090-8511 www.twp.pine.pa.us 724-625-1591 Department of Planning and Code Administration Richland Township 4011 Dickey Road Gibsonia, PA 15044 richland.pa.us (724) 443-5921 Dean Bastianini, Township Secretary Jeffery Walzer, Code Enforcement Officer
Ross Township 1000 Ross Municipal Drive Pittsburgh, PA 15237 www.ross.pa.us (412) 931-7055 Art Gazdik, Engineer David Buskirk, Building Engineer Shaler Township www.shaler.org 300 Wetzel Road Glenshaw, PA 15116 (412) 486-9700 Kevin Creagh, P.E., Township Engineer

144
Section 1. Watershed Planning Importance: Regulatory measures and/or planning techniques that are both innovative and
appropriate can be designed to maintain or limit future impervious cover, redirect development where beneficial, and protect sensitive areas.
Local Authority: ______________________________________________________________________ 1.01 Does your community have a comprehensive plan? Latest Update {see after each township}
12= Yes (Bradford Woods {1974}, Etna {1981 - original}, Fox Chapel {1992}, Franklin Park (1992), Hampton {1995+ currently being updated}, Indiana {2002}, O'Hara {1993}, Pine{2003}, Shaler {1991}, McCandless {1978 – currently being updated}, Ross (1996), Marshall {2004})
1= No (Richland - currently being prepared as a multi-municipal plan with Middlesex)
1.02 Is the comprehensive plan based on political jurisdictions or watersheds?
9= Political jurisdictions (Etna, Fox Chapel, Franklin Park, Hampton, O'Hara, Pine, Richland, Ross, McCandless, Marshall)
1= Watersheds (Indiana) 1=Other, please explain (Shaler-deals more with Zoning Districts, corridors, Indiana-
environmental layover) 1= Not applicable (Bradford Woods)
1.03 Does your community participate in multi-municipal planning for:
8= Water (Bradford Woods, Indiana, O'Hara, Marshall, Richland, Ross, Shaler, McCandless) 6= Wastewater treatment (Indiana, O'Hara, Marshall, Richland, Ross, McCandless) 5= Sewer line maintenance (Bradford Woods, Franklin Park, Ross, Shaler, McCandless) 4= Road corridors (Etna, Shaler, McCandless, Hampton) 0= Transfer of development rights 4= Other (Franklin Park {comprehensive plan}, Pine {pool feasibility study, sign regulations,
law enforcement}, Richland {emergency services, economic development}, McCandless {zoning ordinance, joint sign ordinance with Pine})
1.04 Does your community have zoning?
13= Yes (Bradford Woods, Etna, Fox Chapel, Franklin Park, Hampton, Indiana, O'Hara, Pine, Richland, Ross, Shaler, McCandless, Marshall)
0=No
1.05 Is your zoning tied to the comprehensive plan?
12= Yes (Bradford Woods, Marshall, Fox Chapel, Richland, Franklin Park, Hampton, Indiana, O’Hara, Pine, Ross, Shaler, McCandless)
1= No (Etna)

145
1.06 How often do you typically update your comprehensive plan?
0= Every 5 years 5= Every 10 years (Fox Chapel, Franklin Park, Hampton, O'Hara, Pine) 3= We don't (Bradford Woods, Etna, Shaler) 4= Other {please explain} (Indiana {last comp. Plan 20 years ago}, Richland {the current effort
is the first in more than forty years}, Ross {as needed}, McCandless {an updated plan is currently being developed but not yet adopted}, Marshall {10-15 years})
0= Not applicable *1.07 Does your plan evaluate and take into account impacts of future land use on water resources?
10=Yes (Bradford Woods, Fox Chapel, Franklin Park, Hampton, Indiana, Pine, Richland, Ross, McCandless, Marshall)
3= No (Etna, O'Hara, Shaler) * 1.08 Does your plan identify and address the most important water resource goals for your community?
9=Yes (Bradford Woods, Fox Chapel, Hampton, Indiana, Pine, Richland, Ross, McCandless, Marshall)
3=No (Etna, O'Hara, Shaler) 1= Not applicable (Franklin Park)

146
Section 2. Open Space Conservation Importance: The preservation of open space provides the opportunity to insure rainwater and
snowmelt infiltration, thus minimizing flood potential and maximizing the recharge of the water table. With proper management, riparian areas can function beneficially. Open space also preserves natural habitat niches and presents numerous recreational and educational opportunities.
2.01 Does your community permit or encourage conservation easements (voluntary agreement to
legal transfer of development and land use rights to a piece of property to a conservation trust; easements may be temporary or permanent)?
11= Yes (Bradford Woods, Fox Chapel, Hampton, Indiana, O'Hara, Pine, Richland, Ross,
Shaler, McCandless, Marshall) 2= No (Etna, Franklin Park)
2.02 Does your community permit or encourage land acquisition programs?
5=Yes (Bradford Woods, Fox Chapel, Indiana, Richland, McCandless) 7= No (Etna, Franklin Park, Hampton, O'Hara, Ross, Shaler, Marshall) 1= Not answered (Pine)
2.03 Does your community permit or encourage transfer of development rights (TDRs) (transfer of
potential development from a designated "sending area" to a designated "receiving area”)?
0= Yes 12= No (Bradford Woods, Etna, Fox Chapel, Franklin Park, Hampton, Indiana, O'Hara,
Richland, Ross, Shaler, McCandless, Marshall) 1= Not answered ( Pine)
2.04 Does your community permit or encourage limiting infrastructure extension (a conscious
decision is made to limit or deny extending infrastructure, such as public sewer, water, or roads, to designated areas to avoid increased development in these areas)
2= Yes (Indiana, McCandless) 11= No (Bradford Woods Borough, Etna, Fox Chapel, Franklin Park, Marshall, Hampton,
O’Hara, Pine, Richland, Ross, Shaler) 2.05 Does your community permit or encourage infill / community redevelopment (encourage new
development and redevelopment within existing developed areas)?
7= Yes (Etna, Indiana, O’Hara, Pine, Richland, McCandless, Marshall) 6= No (Bradford Woods, Fox Chapel, Franklin Park, Hampton, Ross, Shaler)

147
2.06 Does your community permit or encourage zoning overlay to promote community redevelopment?
4=Yes (O’Hara, Pine, Ross, Marshall) 9= No (Bradford Woods, Etna, Fox Chapel, Franklin Park, Hampton, Indiana, Richland, Shaler,
McCandless) 2.07 Does your community permit or encourage zoning variances for existing buildings that may not
fully comply with existing codes or other types of flexibility to promote community redevelopment?
4= Yes (Bradford Woods, Richland, Shaler, Marhsall) 8= No (Etna, Fox Chapel, Franklin Park, Hampton, Indiana, O’Hara, Richland, McCandless) 1= Not answered (Pine)
* 2.08 Does your community require or encourage developers to identify key environmental features
before any engineering is done or site plans are designed? (In other words: a site review with the intent to review options)
6= Yes (Bradford Woods, Fox Chapel, Pine, Shaler, McCandless, Marshall) 7= No (Etna, Franklin Park, Hampton, Indiana, O’Hara, Richland, Ross
Section 2 Comments:
Franklin Park: “The Borough zoning ordinance permits PRD developments which could provide for
some of the above activities. However, this may not have been the intend of the PRD specifications.
Development is not an issue for the Franklin Park or most other North Hills communities.”
Pine: “2.01: Conservation easement owned by Homeowner’s Associations-not for development;
2.04: require extension to develop areas lacking adequate sewer (septic) or water (well) supplies.”
McCandless: “Variances are governed by the Pennsylvania Municipalities Planning Code. As such the
governing body, by law, cannot permit or grant variances. The right to variance appeal is guaranteed
by Code. Redevelopment is encouraged simply because most property has been redeveloped and is
valuable enough that the market dictates redevelopment. In-fill is a two edged sword, developers are not
permitted to convert greenspace for in-fill as has been suggested by some developers.”

148
Section 3. Land Conservation Importance: The ways in which land is used have a direct relationship to the quality and quantity of
surface water and ground water. Therefore, the focus of municipal planning and ordinances can improve or impair the watershed. Programs or efforts to conserve undeveloped, sensitive areas, or areas of particular historical or cultural value are some methods that can offer improvement.
Local Authority: _________________________________________________________________________ 3.01 Does your community participate in the National Flood Insurance Program (NFIP)?
13= Yes (Bradford Woods, Etna, Fox Chapel, Franklin Park, Hampton, Indiana, O’Hara, Pine, Richland, Ross, Shaler, McCandless, Marshall)
0= No
3.02 If yes, what type of floodplain regulations do you have?
9= NFIP minimum standards (Etna, Fox Chapel, Franklin Park, Hampton, Indiana, O’Hara, Pine, Ross, Shaler)
3= Other, please describe key components and attach a copy of your regulations (Bradford Woods {in attachment}, Richland {FEMA maps-township ordinance that follows Allegheny County storm water plan}, McCandless {in attachment}) 1= Don’t know (Marshall)
* 3.03 Are your floodplains mapped?
12= Yes (Bradford Woods, Etna, Fox Chapel, Franklin Park, Hampton, Indiana, O’Hara, Richland, Ross, Shaler, McCandless, Marshall)
0= No 1= Unknown (Pine)
3.04 Other than what is required by state and federal laws, is the preservation of cultural or historical
areas (e.g., historic or archaeological sites, scenic views, and recreational areas):
2= Required (Fox Chapel, Hampton) 5= Encouraged (Bradford Woods, Indiana, O’Hara, Marshall, McCandless) 4= Neither (Franklin Park, Richland, Ross, Shaler) 2= Unknown (Etna, Pine)
0= Other 3.05 Is the preservation of agricultural areas:
1= Required (McCandless) 2= Encouraged (Hampton, Richland) 6= Neither (Bradford Woods, Fox Chapel, Franklin Park, Indiana, O’Hara, Ross) 1= Unknown (Pine) 1= Other, please describe: (Shaler-“S.T. has less than 20 acres (1 farm) of agricultural area in Township”)

149
2= N/A (Etna, Marshall) 3.06 Are you aware of any critical habitat areas for plant and animal species in your community?
6= Yes (Fox Chapel, Hampton, Indiana, O’Hara, McCandless, Shaler) 3=No (Bradford Woods, Franklin Park, Richland) 4=Unknown (Etna, Pine, Ross, Marshall)
3.07 Other than what is required by state and federal laws, is the preservation of critical habitat areas
for plant and animal species: 1= Required (Shaler) 5= Encouraged (Fox Chapel, Hampton, Indiana, O’Hara, McCandless) 6=Neither (Bradford Woods, Etna, Franklin Park, Richland, Ross, Marshall) 1= Unknown (Pine)
3.08 Does your community have regulations or requirements, other than what is required by state and federal laws, governing the preservation of wetlands during development?
4=Yes (Fox Chapel, Pine, McCandless, Marshall) 9= No (Bradford Woods, Etna, Franklin Park, Hampton, Indiana, O’Hara, Richland, Ross,
Shaler)
3.09 What regulations does your community have regarding planned residential developments (PRD) for single family, multi-unit, etc. dwellings? Please attach any relevant information.
See ordinances.
3.10 What regulations does your community have regarding planned residential developments (PRD)
for single family, multi-unit, etc. dwellings? Please attach any relevant information. See ordinances. * 3.11 Are there development restrictions pertaining to steep slopes?
13= Yes (Bradford Woods, Etna, Fox Chapel, Franklin Park, Hampton, Indiana, O’Hara, Pine, Richland, Ross, Shaler, McCandless, Marshall)
0= No * 3.12 Are there development restrictions pertaining to sliding soils or mining?
10= Yes (Etna, Fox Chapel, Hampton, Indiana, Shaler, O’Hara, Pine, Richland, Ross, McCandless)
3= No (Bradford Woods, Franklin Park, Marshall)
3.13 Do you require developers to provide soil maps when submitting plans?
10= Yes (Bradford Woods, Fox Chapel, Franklin Park, Hampton, O’Hara, Pine, Ross, Shaler, McCandless, Marshall)

150
3= No (Etna, Indiana, Richland) 3.14 Does your municipality have information related to mining discharge or seepage?
1= Yes (Hampton) 12= No (Bradford Woods, Etna, Fox Chapel, Franklin Park, Indiana, O’Hara, Pine, Richland,
Ross, Shaler, McCandless, Marshall)
3.15 Does your municipality have a copy of the county soil maps?
10= Yes (Fox Chapel, Marshall, Franklin Park, Hampton, Indiana, Pine, Richland, Ross, Shaler, McCandless)
3= No (Bradford Woods, Etna, O’Hara) 3.16 Does your municipality have copies of the North Area Environmental Council’s 1973 Pine Creek
Watershed maps for soils, slopes, water resources, geology/rockfall, mining activity, and environmentally critical areas (floodplains & steep slopes)?
3= Yes (Hampton, O’Hara, McCandless) 6= No (Bradford Woods, Etna, Fox Chapel, Franklin Park, Indiana, Richland) 4= Don't know (Pine, Ross, Shaler, Marshall)
3.17 Is the conservation of forested areas:
5= Required (Fox Chapel, Marshall, Franklin Park, Pine, McCandless) 4= Encouraged (Hampton, Indiana, O’Hara, Shaler) 3= Neither (Bradford Woods, Richland, Ross) 1= Don't know (Etna)
3.18 Does your municipality have an ordinance on:
Timbering? 12= Yes (Bradford Woods, Fox Chapel, Franklin Park, Hampton, Indiana, O’Hara, Pine, Richland, Ross, Shaler, McCandless, Marshall) 1= No (Etna) Clear cutting? 8= Yes (Bradford Woods, Fox Chapel, O’Hara, Shaler, Marshall, Pine, Richland, McCandless 4= No (Franklin Park, Hampton, Indiana, Ross) 1= Don't know (Etna) Preservation of specimen trees? 4= Yes (Bradford Woods, Fox Chapel, Hampton, Shaler, Pine) 8= No (Etna, Franklin Park, Indiana, O’Hara, Richland, Ross, McCandless 1=Don’t know (Marshall)
* 3.19 Are there development restrictions pertaining to stream channel modification?

151
7= Yes (Etna, Fox Chapel, Franklin Park, Hampton, Indiana, Ross, McCandless) 4= No (Bradford Woods, O’Hara, Richland, Shaler) 2= Don't know (Pine, Marshall)
3.20 What information does your municipality have in a Geographic Information System (GIS)?
7= Steep slopes (Marshall, Fox Chapel, O’Hara, Pine, Shaler, Ross, McCandless) 2= All soils (Fox Chapel, Ross) 1= Sliding soils (Fox Chapel)
1= Mining activity (Fox Chapel) 0= Mine discharge or seepage 1= Vegetation types (McCandless) 5 = Natural amenities (O’Hara, Shaler, Fox Chapel, Pine, Ross)
0= Environmentally sensitive areas 3= Don't have GIS (Franklin Park, Indiana, Bradford Woods)
3.21 If you have GIS information, are your maps available to elected officials at public meetings?
7= Yes (Fox Chapel, O’Hara, Marshall, Pine, Richland, Ross, McCandless 4= No (Hampton, Indiana)
3.22 If you have GIS information, are your maps available to members of the planning commissions, zoning hearing boards, Environmental Advisory Council’s, etc. at public meetings? 7= Yes (Etna, Fox Chapel, O’Hara, Pine, Richland, Ross, McCandless) 4= No (Marshall, Hampton, Indiana, Shaler) 2= Not answered (Bradford Woods, Franklin Park)
3.23 Is staff required to attend regional or state workshops to expand their skills or knowledge of relevant subjects? (a) Elected officials &/or (b) Board members?
a. 9= Yes (Etna, Franklin Park, Indiana, O’Hara, Pine, Richland, Ross, Shaler, McCandless 4= No (Bradford Woods, Fox Chapel, Hampton, Marshall) b. 4= Yes (Etna, Indiana, Richland, Ross) 8= No (Bradford Woods, Fox Chapel, Hampton, O’Hara, Pine, Marshall, Shaler, McCandless)
* 3.24 Is staff attendance at regional or state workshops to expand their skills or knowledge of relevant
subjects facilitated by your municipality? (a) Elected officials &/or (b) Board members?
a. 10= Yes (Etna, Fox Chapel, O’Hara, Marshall, Pine, Richland, Ross, Shaler, McCandless) 2= No (Bradford Woods, Hampton, Indiana) b. 8=Yes (Etna, Fox Chapel, Marshall, O’Hara, Pine, Richland, Ross, McCandless) 4= No (Bradford Woods, Hampton, Indiana, Shaler)

152
1= Not answered (Franklin Park)
3.25 Does your municipality have specific expectations or requirements for its elected officials or
members of its boards, which are outlined in writing, regarding:
0= Prior education in specific areas 0= Mandatory ongoing training in specific areas 2= Optional ongoing training in specific areas (Bradford Woods, O’Hara) 1= Time spent in preparation for meetings (Bradford Woods) 3= Limits of authority or ability to recommend (Indiana, Ross, McCandless)
* 3.26 Aside from what is required, does your municipality work with:
5= The Southwest Planning Commission (SPC) (Etna, Indiana, O’Hara, Ross, Marshall) 9= Local Department of Environmental Protection (DEP) personnel (Etna, Marshall, Hampton,
Indiana, O’Hara, Pine, Richland, Ross, McCandless) 9= Conservation District personnel (Bradford Woods, Marshall, Etna, Hampton, Indiana,
O’Hara, Pine, Richland, Ross, McCandless) 3= Other (Pine {County Planning Department}, Ross {ALCOSAN, 3 Rivers Wet Weather, PWSA, Main Office DEP}, Shaler {Close ties with 3 Rivers Wet Weather Demo. Project, Alcosan, Girty’s Run Joint Sewer Authority}, Fox Chapel {3 Rivers Wet Weather})
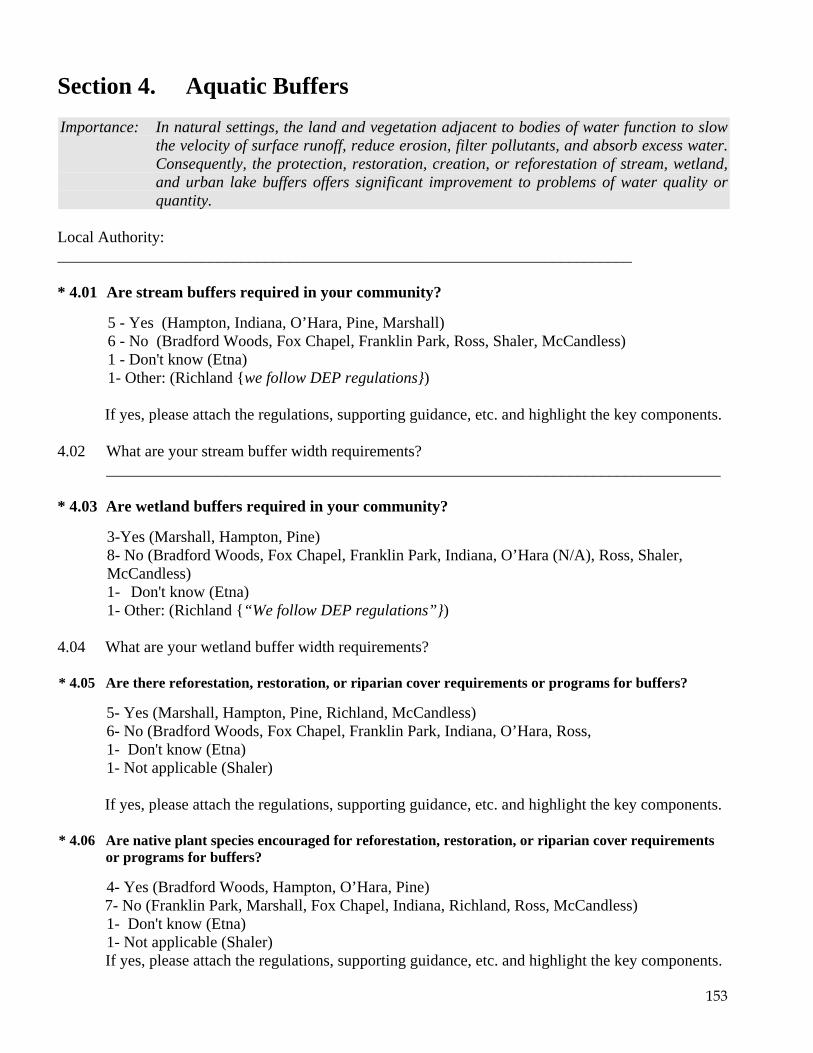
153
Section 4. Aquatic Buffers Importance: In natural settings, the land and vegetation adjacent to bodies of water function to slow
the velocity of surface runoff, reduce erosion, filter pollutants, and absorb excess water. Consequently, the protection, restoration, creation, or reforestation of stream, wetland, and urban lake buffers offers significant improvement to problems of water quality or quantity.
Local Authority: ________________________________________________________________________ * 4.01 Are stream buffers required in your community?
5 - Yes (Hampton, Indiana, O’Hara, Pine, Marshall) 6 - No (Bradford Woods, Fox Chapel, Franklin Park, Ross, Shaler, McCandless) 1 - Don't know (Etna) 1- Other: (Richland {we follow DEP regulations})
If yes, please attach the regulations, supporting guidance, etc. and highlight the key components.
4.02 What are your stream buffer width requirements? _____________________________________________________________________________ * 4.03 Are wetland buffers required in your community?
3-Yes (Marshall, Hampton, Pine) 8- No (Bradford Woods, Fox Chapel, Franklin Park, Indiana, O’Hara (N/A), Ross, Shaler, McCandless) 1- Don't know (Etna) 1- Other: (Richland {“We follow DEP regulations”})
4.04 What are your wetland buffer width requirements? * 4.05 Are there reforestation, restoration, or riparian cover requirements or programs for buffers?
5- Yes (Marshall, Hampton, Pine, Richland, McCandless) 6- No (Bradford Woods, Fox Chapel, Franklin Park, Indiana, O’Hara, Ross, 1- Don't know (Etna) 1- Not applicable (Shaler)
If yes, please attach the regulations, supporting guidance, etc. and highlight the key components.
* 4.06 Are native plant species encouraged for reforestation, restoration, or riparian cover requirements
or programs for buffers?
4- Yes (Bradford Woods, Hampton, O’Hara, Pine) 7- No (Franklin Park, Marshall, Fox Chapel, Indiana, Richland, Ross, McCandless) 1- Don't know (Etna) 1- Not applicable (Shaler) If yes, please attach the regulations, supporting guidance, etc. and highlight the key components.

154
Section 4 Comments:
Fox Chapel: “While no specific regulations exist setting forth required setbacks from streams and
wetlands, the NRO has provisions to protect such facilities. See, for example, NRO Sections 120 (a), 120
(c) and 121 (e)

155
Section 5. Better Site Design Importance: Maximizing open space, natural terrain, and natural features preserves the ability of the
land to function normally, thus assisting in flood prevention and increasing ground water supply. Local ordinances and codes that incorporate techniques to reduce impervious cover and/or redirect runoff onto pervious surfaces in the design of new development and redevelopment projects encourage this strategy.
Local Authority: _______________________________________________________________ Street Width 5.01 What is the minimum pavement width allowed for streets in low-density residential
developments that have less than 500 average daily trips (ADT)?
3= 18 - 22 feet (Bradford Woods, Fox Chapel, Hampton) 8= 23 - 26 feet (Franklin Park, Indiana, O’Hara, Marshall, Pine, Richland, Shaler, McCandless) 1= Greater than 26 feet (Ross) 1= Not applicable (Etna – regulated by Allegheny County Planning)
5.02 In higher density development are parking lanes allowed to also serve as traffic lanes (i.e.,
queuing streets)?
2= Yes (Indiana, Pine) 10= No (Bradford Woods, Marshall, Fox Chapel, Franklin Park, Hampton, O’Hara, Richland, Ross, Shaler, McCandless) 1= Not applicable (Etna – regulated by Allegheny County Planning)
Right-of-Way (ROW) Width 5.03 What is the minimum right-of-way (ROW) width for a residential street?
1= Less than 45 feet (Bradford Woods) 11= Greater than 45 feet (Marshall, Fox Chapel, Franklin Park, Hampton, Indiana, O’Hara, Pine, Richland, Ross, Shaler, McCandless) 1= Not Answered (Etna – regulated by Allegheny County Planning)
5.04 Does the code allow utilities to be placed under the paved section of the ROW?
3= Yes (Indiana, Ross, Shaler) 2= No (Richland, McCandless) 3= Not applicable (Etna, Franklin Park, O’Hara) 5 =Unknown or Not specified in codes (Mashall, Bradford Woods, Fox Chapel, Hampton Townshp, Pine)

156
Cul-de-Sacs 5.05 What is the minimum radius allowed for cul-de-sacs on public roads?
1= Less than or equal 35 feet (Fox Chapel) 4= 36 feet to 45 feet (Indiana, O’Hara, Shaler, Marshall) 7 =Greater than 45 feet (Bradford Woods, Franklin Park, Hampton, Pine, Richland, Ross, McCandless) 1- Not applicable (Etna)
5.06 What is the minimum radius allowed for cul-de-sacs on private roads?
1= Less than or equal to 35 feet (Fox Chapel) 3= 36 feet to 45 feet (Indiana, Marshall, O’Hara, Shaler) 3= Greater than 45 feet (Franklin Park, Pine, McCandless) 4= Not applicable (Bradford Woods, Etna, Hampton, Ross) 1= Not answered (Richland)
5.07 Can a landscaped island be created within the cul-de-sac?
7= Yes (Fox Chapel, Marshall, Franklin Park, Indiana, Pine, Shaler, McCandless) 3= No (O’Hara, Richland, Ross) 2= Unknown or Not specified in codes (Hampton, Bradford Woods)
5.08 Are alternative turn-arounds such as "hammerheads" allowed on short streets in low-density
residential developments?
4= Yes (Indiana, Pine, Marshall, McCandless) 4= No (O’Hara, Franklin Park, Fox Chaple, Richland) 4= Unknown or Not specified in codes (Bradford Woods, Ross, Shaler, Hampton)
Vegetated Open Channels 5.09 Does your municipality allow vegetated open channels or bio-swales?
4= Yes (Indiana, O’Hara, Richland, McCandless) 2= No (Ross, Hampton) 5= Unknown or Not specified in codes (Bradford Woods, Fox Chapel, Franklin Park, Pine,
Shaler) 1= Not applicable (Etna)
5.10 Are curb and gutters required for most residential street sections?
12= Yes (Etna, Fox Chapel, Marshall, Franklin Park, Hampton, Indiana, O’Hara, Pine, Richland, Ross, Shaler, McCandless)
1=No (Bradford Woods)

157
Parking Ratios 5.11 What is the minimum parking ratio for a professional office building (per 1000 ft2 of gross floor
area)? 2= Less than or equal to 3.0 spaces per 1,000 ft2 of gross floor area (Bradford Woods, Hampton) 8= 3.1 to 5.0 spaces per 1,000 ft2 of gross floor area (Franklin Park, Indiana, Marshall, O’Hara,
Pine, Richland, Shaler, McCandless) 0= Greater than 5.0 spaces per 1,000 ft2 of gross floor area 2= Not applicable (Etna, Fox Chapel)
5.12 What is the minimum required parking ratio for shopping centers (per 1, 000 ft2 gross floor area)?
3= Less than or equal to 4.0 spaces per 1,000 ft2 of gross floor area (Bradford Woods, Hampton, O’Hara)
4= 4.1 to 5.05 spaces per 1,000 ft2 of gross floor area (Franklin Park, Pine, Richland, Shaler) 4= Greater than 5.05 spaces per 1,000 ft2 of gross floor area (Marshall, Indiana, Ross,
McCandless)
5.13 What is the minimum required parking ratio for single-family homes (per home)?
11= Less than or equal to 2.0 spaces, (Marshall, Hampton, Indiana, O’Hara, Pine, Richland, Ross, Shaler, McCandless, Etna, Fox Chapel)
1= Greater than 2.0 spaces (Bradford Woods) 5.14 Are your parking requirements set as minimum, median, or maximum requirements?
12= Minimum requirements (Etna, Fox Chapel, Marshall, Franklin Park, Hampton, Indiana, O’Hara, Pine, Richland, Ross, Shaler, McCandless)
0= Median requirements 1= Maximum requirements (Bradford Woods)
Parking Codes
5.15 Is the use of shared parking arrangements permitted or encouraged?
8=Yes, {please indicate how} (Franklin Park {reciprocal agreements}, O’Hara {by shared parking agreements acceptable to the Planning Commission and Zoning Hearing Board}, Pine {Town Center Design Overlay Concepts}, Richland {planned use shopping}, Ross {not conflicting uses within 300’ of use}, McCandless {if parking studies indicate that the required parking for each use is not going to be utilized alternative parking schemes will be considered}, Shaler, Marshall {permitted but not encouraged})
2= No (Hampton, Indiana) 3=Unknown or Not specified in codes (Bradford Woods, Etna, Fox Chapel)
5.16 Is a model for shared parking agreements provided to prospective developments?
1= Yes (Pine) 8= No (Franklin Park, Marshall, Hampton, O’Hara, Richland, Ross, Shaler, McCandless)

158
4= Not applicable (Bradford Woods, Etna, Fox Chapel, Indiana) 5.17 Are parking ratios reduced if shared parking arrangements are in place?
4= Yes (O’Hara, Pine, Richland, McCandless) 4= No (Franklin Park, Marshall, Ross, Hampton) 1=Unknown or Not specified in codes (Shaler) 4= Not applicable (Bradford Woods, Etna, Fox Chapel, Indiana)
Parking Lots 5.18 What is the minimum stall width for a standard parking space?
7= Less or equal 9 feet (Fox Chapel, Marshall, Franklin Park, Hampton, O’Hara, Pine, Shaler) 5= Greater than 9 feet (Bradford Woods, Indiana, Richland, Ross, McCandless) 1=Not applicable (Etna)
5.19 What is the minimum stall length for a standard parking space?
2= Less or equal 18 feet (Fox Chapel, McCandless) 9= Greater than 18 feet (Franklin Park, Marshall, Hampton, Indiana, O’Hara, Pine, Richland,
Ross, Shaler) 1= Unknown or Not specified in codes (Bradford Woods)
5.20 Is a percentage of the spaces at commercial parking lots required to have smaller dimensions for
compact cars?
1=Yes, please specify percentage (Marshall – 15%) 11= No (Bradford Woods, Fox Chapel, Franklin Park, Hampton, Indiana, O’Hara, Pine, Richland, Ross, Shaler, McCandless) 1= Not applicable (Etna)
5.21 Are there ordinances regarding trees, plantings, etc.?
11= Yes (Bradford Woods, Marshall, Fox Chapel, Franklin Park, Hampton, Indiana, O’Hara, Pine, Richland, Ross, McCandless) 1= No (Shaler)
* 5.22 Can pervious materials be used for parking areas? 9= Yes Grass pavers (O’Hara) Concrete lug system with gravel Plastic matting with gravel (O’Hara) Permanent, pervious asphalt-based surface (Bradford Woods, Shaler) Other: Asphalt stone, brick concentrate (Bradford Woods), Limestone -- Residential only
(Etna), “Pervious can be used if shown to be practical for our area”=(McCandless), “Must be authorized by Council” = Hampton

159
3= No (Franklin Park, Marshall, Indiana, Pine) 5.23 Are pervious surfaces encouraged for use in entry and exit lanes?
1=Yes (Richland) 12= No (Bradford Woods, Marshall, Etna, Fox Chapel, Franklin Park, Hampton, Indiana,
O’Hara, Pine, Ross, Shaler, McCandless)
Parking Lot Runoff 5.24 Is a minimum percentage of a parking lot required to be landscaped?
10=Yes (Etna, Hampton, Fox Chapel, Marshall, Indiana, O’Hara, Pine, Richland, Ross, McCandless)
2= No (Bradford Woods, Franklin Park, Shaler) 5.25 Is parking lot runoff considered to be hazardous waste which is trapped or controlled?
2=Yes (Bradford Woods, Pine) 11= No (Etna, Fox Chapel, Marshall, Franklin Park, Hampton, Indiana, O’Hara, Richland, Ross,
Shaler, McCandless)
5.26 Is parking lot runoff considered to be an important contribution to recharging the water table?
6= Yes (Bradford Woods, O’Hara, Pine, Ross, Shaler, McCandless) 7= No (Etna, Fox Chapel, Marshall, Franklin Park, Hampton, Indiana, Richland)
Open Space Design 5.27 Are open space or cluster development, for single family homes – aside from PRDs designs
allowed in the community?
6= Yes (Fox Chapel, Marshall, Hampton, Pine, Richland {lot averaging plans}, McCandless {D-development Article 1314}) 4= No (Indiana, O’Hara, Ross, Franklin Park) 2= Unknown or Not specified in codes (Bradford Woods, Shaler) 1= Not applicable (Etna)
* 5.28 Are conservation developments encouraged in the community?
6= Yes, {please indicate how} (Bradford Woods {we have a 2.5 acres Reserve Park}, Fox Chapel {The Fox Chapel Land Conservation trust encourages residents to donate / ease land to the Trust for conservation purposes}, Richland {by word}, McCandless {D-development Article 1314}, Marshall {Resource Protection Analysis}, Hampton {by EAC}) 3=No (Indiana, Franklin, Park, Ross) 3= Unknown or Not specified in codes (O’Hara, Pine, Shaler) 1= Not applicable (Etna)

160
5.29 Are developers encouraged to design for the existing conditions?
8= Yes , please indicate how (Bradford Woods {Under ORD 353- article 3 –Protect natural Features and Environment}, Fox Chapel {NRO requires developers to demonstrate that they have minimized environmental disturbances}, Hampton {work with existing topos + vegetation}, Indiana {not indicated}, Pine {not indicated}, Richland {by word}, McCandless{D-development Article 1314}, Marshall {Resource Protection Analysis) 1= No (Ross) 3= Unknown or Not specified in codes (Franklin Park, O’Hara, Shaler)
5.30 Are the submittal or review requirements for open space design greater than those for
conventional development?
3= Yes (Fox Chapel, Hampton, O’Hara) 7= No (Indiana, Ross, Franklin Park, Marshall, Pine, Shaler, McCandless) 3= Not applicable (Bradford Woods, Etna, Richland)
5.31 Are flexible site design criteria available for developers that utilize open space or cluster design
options (e.g., setbacks, road widths, lot sizes)?
9= Yes,-Minimum lot size? (Marshall, Bradford Woods, Fox Chapel, Hampton, Indiana, O’Hara, Pine, Richland, McCandless) 1= No (Ross) 1= Unknown or Not specified in codes (Franklin Park) 2= Not applicable (Etna, Shaler)
Setbacks and Frontages 5.32 Are irregular lot shapes (e.g., pie-shaped, flag lots) allowed in the community?
9= Yes (Marshall, Hampton, Bradford Woods, Franklin Park, Indiana, Pine, Richland, Ross, McCandless) 4= No (O’Hara, Shaler, Fox Chapel, Etna) 0= Not applicable
* 5.33 What is the minimum requirement for front setbacks for the following residential lot sizes? 1/4 acre residential lot
4= 20 feet or less (Etna, Indiana, O’Hara) 4= 21 feet to 30 feet (Franklin Park, Richland, Ross, Shaler) 1= 31 to 40 feet (McCandless, Hampton) 1= Greater than 40 ft (Hampton) 1- Not applicable (Fox Chapel) 1/2 acre residential lot 1= 20 feet or less (Etna) 2= 21 feet to 30 feet (Pine, Ross) 4= 31 to 40 feet (Indiana, O’Hara, Hampton, McCandless)

161
2= Greater than 40 ft (Franklin Park, Richland) 2= Not applicable (Fox Chapel, Shaler) 1 acre residential lot 1= 20 feet or less (Etna) 1= 21 feet to 30 feet (Ross) 3= 31 to 40 feet (O’Hara, Pine, McCandless) 6=Greater than 40 ft (Bradford Woods, Fox Chapel, Franklin Park, Hampton, Indiana, Richland) 1= Not applicable (Shaler)
* 5.34 What is the minimum requirement for rear setbacks for the following residential lot sizes? 1/4 acre residential lot
5= 25 feet or less (Etna, Indiana, O’Hara, Richland, Shaler) 4= 26 feet to 40 feet (Franklin Park, Hampton, Ross, McCandless) 0= Greater than 40 ft 1= Not applicable (Fox Chapel)
1/2 acre residential lot
2= 25 feet or less (Etna, Indiana) 6= 26 feet to 40 feet (Franklin Park, Hampton, O’Hara, Pine, Ross, McCandless) 1= Greater than 40 ft (Richland) 2= Not applicable (Fox Chapel, Shaler) 1 acre residential lot 2= 25 feet or less (Etna, Fox Chapel) 5= 26 feet to 40 feet (Franklin Park, Indiana, O’Hara, Ross, McCandless) 4= Greater than 40 ft (Bradford Woods, Hampton, Pine, Richland) 1= Not applicable (Shaler)
* 5.35 What is the minimum requirement for side setbacks for the following residential lot sizes? 1/4 acre residential lot
1= 8 feet or less (Franklin Park) 6= Greater than 8 feet (Hampton, Indiana, O’Hara, Richland, Shaler, McCandless) 2= Not applicable (Fox Chapel, Ross) 1/2 acre residential lot 0= 8 feet or less 8= Greater than 8 feet (Franklin Park, Hampton, Indiana, O’Hara, Pine, Richland, Ross, McCandless) 2= Not applicable (Fox Chapel, Shaler) 1 acre residential lot 0= 8 feet or less 10=Greater than 8 feet (Bradford Woods, Fox Chapel, Franklin Park, Hampton, Indiana, O’Hara, Pine, Richland, Ross, McCandless) 1=Not applicable (Shaler)

162
5.36 What is the minimum frontage distance for the following residential lot sizes? 1/4 acre residential lot
8= 80 feet or less (Etna, Franklin Park, Hampton, Indiana, O’Hara, Richland, Ross, Shaler) 1= Greater than 80 feet (Town of McCandles) 1= Not applicable (Fox Chapel) 1/2 acre residential lot 3= 80 feet or less (Etna, Pine, Ross)
6= Greater than 80 feet (Franklin Park, Hampton, Indiana, O’Hara, Richland, McCandless) 1= Not applicable (Fox Chapel) 1 acre residential lot 3= 80 feet or less (Etna, Fox Chapel, Ross) 8= Greater than 80 feet (Bradford Woods, Franklin Park, Hampton, Indiana, O’Hara, Pine,
Richland, McCandless) 1=Not applicable (Shaler) Zoning designations 5.37 Please list the zoning designations in your community – that fall within the watershed, their
definitions, and percentages of the total land use. See ordinances Sidewalks 5.38 Are sidewalks prohibited?
0= Yes (skip to #5.42) 13= No (Bradford Woods, Marshall, Etna, Fox Chapel, Franklin Park, Hampton, Indiana, O’Hara, Pine, Richland, Ross, Shaler, McCandless)
5.39 Are sidewalks required?
6= Yes (Etna, Franklin Park, Pine, Marshall, Richland, McCandless) 7= No (Bradford Woods, Fox Chapel, Hampton, Indiana, O’Hara, Ross, Shaler) 5.40 If so, are sidewalks always required on both sides of residential streets? 5= Yes (Franklin Park, Pine, Etna, Marshall, Richland) 4= No (Hampton, Indiana, O’Hara, McCandless)
1=Not applicable (Shaler)

163
5.41 What is the minimum sidewalk width allowed in the community? 5= 4 feet or less (Franklin Park, O’Hara, Pine, Richland, McCandless) 4= Greater than 4 feet (Marshall, Etna, Indiana, Ross) 3=Unknown or Not specified in codes (Bradford Woods, Hampton, Shaler) 1=Not applicable (Fox Chapel) 5.42 Can alternate pedestrian networks be substituted for sidewalks (e.g., trails through common
areas)? 6= Yes (Hampton, Indiana, O’Hara, Pine, Richland, McCandless) 1= Franklin Park 5= Unknown or Not specified in codes (Marshall, Bradford Woods, Etna, Ross, Shaler) 1= Not applicable (Fox Chapel) Driveways 5.43 What is the minimum one-lane driveway width specified in the community?
1= 9 feet or less (Franklin Park) 6= Greater than 9 feet (O’Hara, Pine, Richland, Ross, McCandless) 7= Not specified in codes (Marshall, Bradford Woods, Etna, Fox Chapel, Hampton, Indiana, Shaler)
5.44 Can pervious materials be used for single-family home driveways (e.g., grass, gravel, porous
pavers, etc)?
11= Yes (Bradford Woods, Etna, Fox Chapel, Franklin Park, Hampton, O’Hara, Pine, Richland, Ross, Shaler, McCandless) 0= No 2= Not specified in codes (Marshall, Indiana)
5.45 Can a "two-track" design be used at single-family driveways (a driveway with two strips of
paving corresponding to wheel tracks with a vegetated area in between)?
4= Yes (O’Hara, Richland, Ross, McCandless) 0= No 9= Not specified in codes (Marshall, Bradford Woods, Etna, Fox Chapel, Franklin Park, Hampton, Indiana, Pine, Shaler)
5.46 Are shared driveways permitted in residential developments?
7= Yes (Franklin Park, Marshall, Indiana, O’Hara, Pine, Richland {private roads}, McCandless) 2= No (Etna, Hampton) 4= Unknown or Not specified in codes (Shaler, Fox Chapel, Bradford Woods, Ross)

164
Open Space Management Skip to question 5.50 if open space, cluster, or conservation developments are not allowed in your community. If open space developments are allowed, please attach any pertinent information. 5.47 Are open space areas within subdivisions required to be consolidated into larger units?
2= Yes (Marshall, McCandless) 2= No (Pine,Hampton) 4= Unknown or Not specified in codes (Bradford Woods, Fox Chapel, Franklin Park, Indiana) 2= Not applicable (Etna, Richland)
5.48 Does a minimum percentage of open space in a residential subdivision have to be managed in a
natural condition?
6= Yes (Marshall, Bradford Woods, Fox Chapel, Hampton, Pine, McCandless) 0= No 3= Unknown or Not specified in codes (Franklin Park, Indiana, Richland) 2= Not applicable (Etna)
5.49 Are allowable and unallowable uses for open space in residential developments defined?
4= Yes (Marshall, Hampton, Indiana, Pine) 5= No (Bradford Woods, Fox Chapel, Franklin Park, Richland, McCandless)
Rooftop Runoff * 5.50 Can rooftop runoff be discharged to yard areas?
7= Yes (Fox Chapel, Bradford Woods, Etna, Franklin Park, Indiana, Shaler, McCandless) 4= No (Hampton, O’Hara, Pine, Richland) 1= Not specified in codes (Marshall)
Section 5 Comments:
Bradford Woods: “ Runoff cannot be directed to streets”

165
Section 6. Erosion and Sediment Control Importance: Topsoil is a valuable resource on land. In the water, soil, sand, clay, and other
materials can smother habitats and food supplies, reduce sunlight, and abrade sensitive tissues of fish and other organisms. It also contributes to the scour of streambanks, eroding them and causing the land above to fall. The use of erosion control, sediment control, and dewatering practices at all new development and redevelopment sites can reduce these problems.
Local Authority: ________________________________________________________ 6.01 During construction, is erosion and sediment control required for:
12= All sites (Bradford Woods, Marshall, Etna, Fox Chapel, Franklin Park, Hampton, Indiana, O’Hara, Pine, Ross, Shaler, McCandless) 1= Sites greater than 1 acre (Richland {DEP required}) 0= Sites greater than 2 acres 0= Sites greater than 5 acres 0= No sites 0= Don't know If erosion and sediment control is required, please provide a copy of your regulations and any additional guidance.
6.02 Does your community provide guidance or set forth requirements on the types of erosion and
sediment control practices that may be used?
10= Yes, we refer the development community to a state document (Marshall, Bradford Woods, Etna, Franklin Park, Hampton, O’Hara, Pine, Ross, Shaler, McCandless) 2= Yes, we have developed our own guidance and/or requirements (Bradford Woods, Fox Chapel) 2= No (Indiana, Richland)
If your community has developed guidance and/or requirements, please attach a copy.
* 6.03 Check all erosion and sediment control practices that your community has required to be
implemented in the past three years:
(11) Silt fence (Etna, Fox Chapel, Franklin Park, Hampton, Indiana, O’Hara, Pine, Ross, Shaler, McCandless, Marshall)
(11) Permanent seeding/ mulching (Etna, Fox Chapel, Franklin Park, Hampton, Indiana, O’Hara, Pine, Ross, Shaler, McCandless, Marshall)
(10) Construction sequencing (Etna, Franklin Park, Hampton, Indiana, O’Hara, Pine, Ross, Shaler, McCandless, Marshall)
(9) Dust control (Etna, Marshall, Hampton, Indiana, O’Hara, Pine, Ross, Shaler, McCandless) (9) Preservation and non-disturbance of natural vegetation (Etna, Fox Chapel, Franklin Park,
Hampton, Indiana, O’Hara, Pine, Ross, McCandless) (8) Preservation and non-disturbance of stream or wetland buffers (Etna, Fox Chapel, Hampton,
Indiana, O’Hara, Pine, Ross, McCandless, Marshall)

166
(10) Temporary seeding/ mulching (Etna, Fox Chapel, Franklin Park, Hampton, Indiana, O’Hara, Pine, Marshall, Ross, McCandless)
(10) Straw bales (Etna, Franklin Park, Fox Chapel, Hampton, Indiana, O’Hara, Pine, Ross, Shaler, McCandless)
(5) Construction phasing (Etna, Indiana, Pine, Ross, McCandless, Marshall, O’Hara) (11) Erosion blankets and geotextiles (Fox Chapel, Etna, Franklin Park, O’Hara, Marshall, Indiana,
Pine, Ross, Shaler, McCandless) (5) Fiber rolls (O’Hara, Franklin Park, Pine, Ross, McCandless) (5) Temporary stream crossings (Fox Chapel, Marshall, O’Hara, Pine, Ross) (9) Stabilized construction entrance (Fox Chapel, Etna, Franklin Park, Indiana, Marshall, O’Hara,
Pine, Ross, Shaler, McCandless) (4) Exit tire wash (O’Hara, Pine, Ross, McCandless) (7) Energy dissipation at pipe outlets (Fox Chapel, Franklin Park, O’Hara, Pine, Ross, Shaler,
McCandless) (4) Stair-step grading (Franklin Park, O’Hara, Pine, Ross)
(3) Check dams in natural or man-made channels (O’Hara, Pine, McCandless) (3) Sand / gravel bag barrier (O’Hara, Pine, McCandless) (7) Brush or rock filter (Franklin Park, Indiana, O’Hara, Pine, Ross, McCandless, Marshall) (10) Storm drain inlet protection (Marshall, Fox Chapel, Franklin Park, Hampton, Indiana, O’Hara, Pine, Ross, Shaler, McCandless) (8) Catch basin inlet filters (Etna, Fox Chapel, Hampton, Indiana, O’Hara, Pine, Ross, McCandless, Marshall) (10) Sedimentation basins (Etna, Fox Chapel, Franklin Park, Hampton, Indiana, O’Hara, Pine, Ross, Shaler, McCandless, Marshall) (10) Sediment traps (Marshall, Etna, Fox Chapel, Franklin Park, Hampton, Indiana, O’Hara, Pine, Ross, McCandless) (6) Filtration of dewatering (Marshall, Etna, Indiana, O’Hara, Pine, Ross) (1) Secondary filtration (mechanical or sand filtration devices to filter fine sediments from runoff) (Pine) (4) Dikes / berms as conveyance to ESC structures (Marshall, Indiana, Pine, McCandless) (2) Pipe slope drains to bypass erodible soils (Marshall, Pine, McCandless) (8)Stockpile stabilization (Etna, Fox Chapel, Marshall, O’Hara, Pine, Ross, Shaler, McCandless) 6.04 Is an erosion and sediment control plan required during the site plan review process?
12= Yes (Bradford Woods, Marshall, Etna, Fox Chapel, Franklin Park, Hampton, Indiana, O’Hara, Pine, Ross, Shaler)
1=No (McCandless)
6.05 Are construction sites inspected for compliance with erosion and sediment control requirements?
13= Yes (Marshall, Bradford Woods, Etna, Fox Chapel, Franklin Park, Hampton, Indiana, O’Hara, Pine, Ross, Shaler, McCandless)
0= No 6.06 Who conducts inspections of construction sites for compliance with erosion and sediment
control requirements?

167
10= County / municipal inspector (Marshall, Bradford Woods, Fox Chapel, Franklin Park, Hampton, O’Hara, Pine, Ross, Shaler, McCandless)
4= Third-party inspector (e.g. private engineer) (Etna, Franklin Park, Marshall, Pine) 3= Other, please describe (Indiana {ACCD/ CEO/ TWP. Eng}, Richland {DEP}, Fox Chapel)
6.07 How frequently does an erosion and sediment control inspector visit a construction site?
4= Weekly (Marshall, Etna, Pine, Shaler) 1= Monthly (O’Hara) 7= Other, please describe (Bradford Woods {as needed}, Fox Chapel {no set schedule; usually in
conjunction with other building inspections}, Franklin Park {during required and requested inspections}, Hampton {as per county}, Indiana {TWP Eng-daily during Development}, Richland {DEP}, McCandless{depending on the situation-more complicated sites are daily and less complicated are weekly})
0= Not applicable
6.08 Please describe the training or background required for erosion and sediment control inspectors. Contact municipality * 6.09 Does your community sponsor erosion and sediment control training for:
0=Developers 0= Contractors 0= Engineers 2= Inspectors (Pine, McCandless) 6= None of the above (Etna, Fox Chapel, Marshall, Franklin Park, Richland, Shaler) 5= Not applicable (Bradford Woods, Indiana, O’Hara, Ross, Hampton)
6.10 Are there erosion and sediment control enforcement mechanisms (e.g. fines, stop work orders, etc.)?
9= Yes (Bradford Woods, Marshall, Etna, Fox Chapel, Franklin Park, O’Hara, Pine, Ross, McCandless) 3= No (Indiana, Richland, Shaler) 1= Not applicable (Hampton)
If yes, please attach a copy of enforcement mechanisms.
6.11 Is mowing to the edge of streambanks on public lands prohibited?
2= Yes (Pine, Ross) 10= No (Bradford Woods, Marshall, Fox Chapel, Franklin Park, Hampton, Indiana, O’Hara, Richland, Shaler, McCandless)
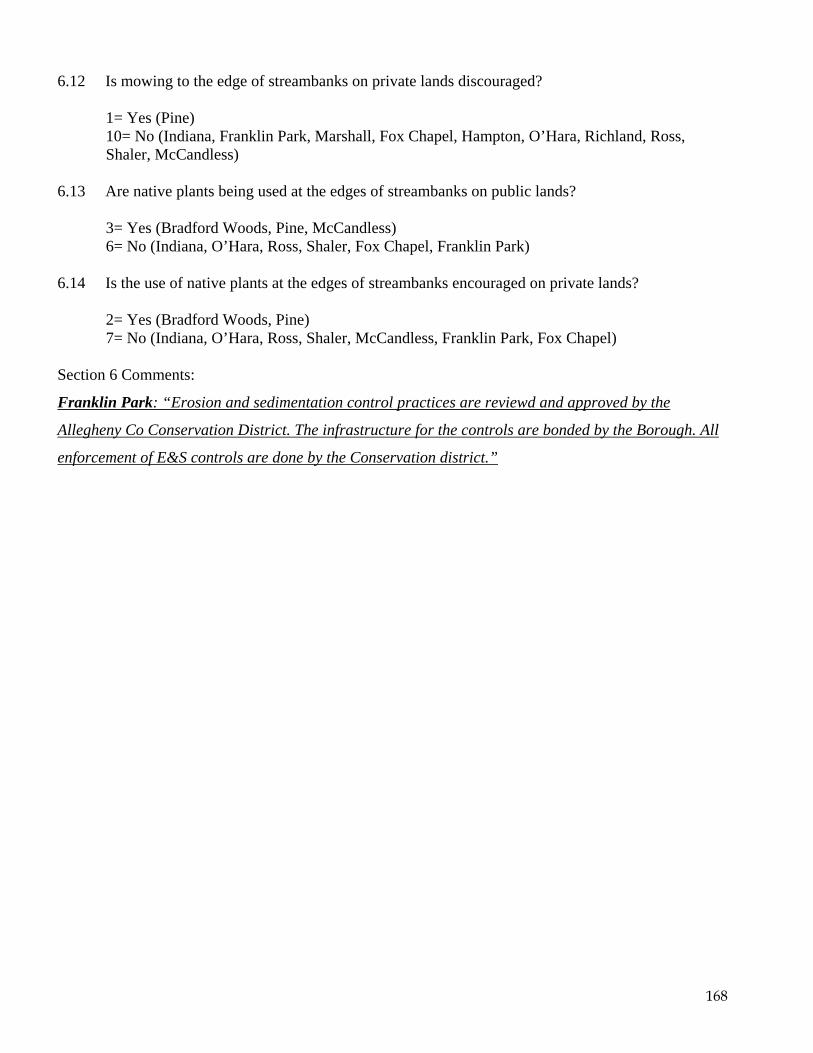
168
6.12 Is mowing to the edge of streambanks on private lands discouraged?
1= Yes (Pine) 10= No (Indiana, Franklin Park, Marshall, Fox Chapel, Hampton, O’Hara, Richland, Ross, Shaler, McCandless)
6.13 Are native plants being used at the edges of streambanks on public lands?
3= Yes (Bradford Woods, Pine, McCandless) 6= No (Indiana, O’Hara, Ross, Shaler, Fox Chapel, Franklin Park)
6.14 Is the use of native plants at the edges of streambanks encouraged on private lands?
2= Yes (Bradford Woods, Pine) 7= No (Indiana, O’Hara, Ross, Shaler, McCandless, Franklin Park, Fox Chapel)
Section 6 Comments:
Franklin Park: “Erosion and sedimentation control practices are reviewd and approved by the
Allegheny Co Conservation District. The infrastructure for the controls are bonded by the Borough. All
enforcement of E&S controls are done by the Conservation district.”

169
Section 7. Stormwater Management Practices Importance: Conventional engineering practices have been centered primarily upon removing water
as quickly as possible from a site. The incorporation of structural practices into new development, redevelopment, or the existing landscape helps to mitigate the impacts of urbanization and stormwater runoff on receiving waters. This allows the normal water cycle to occur, providing protection against both floods and drought.
Local Authority: 7.01 Does your community require stormwater practices on new development sites?
13=Yes (Bradford Woods, Etna, Fox Chapel, Franklin Park, Hampton, Indiana, O’Hara, Pine, Richland, Ross, Shaler, McCandless, Marshall) 0= No
If yes, please provide a copy of your regulations and any additional guidance.
7.02 What type of exemptions do you have for these requirements? See ordinances.
* 7.03 If yes, what are the design criteria for stormwater practices?
10= Control peak discharge rate (flood control) (Marshall, Etna, Fox Chapel, Indiana, Pine, Ross, McCandless)
2= Treat stormwater runoff for water quality (Bradford Woods) 6= Control / reduce total volume of runoff (by means of infiltration practices, etc.) (Bradford
Woods, Etna, Pine, Ross, McCandless) 5= Protect downstream channels (Etna, Pine, McCandless)
Design storm(s): 1= Other: (Hampton)
7.04 Does your community provide guidance or set forth requirements on the types of
stormwater practices that may be constructed?
6= Yes, we refer the development community to a state document (Bradford Woods, Fox Chapel, Indiana, O’Hara, Pine, McCandless) 8= Yes, we have developed our own guidance and/or requirements (Marshall, Bradford Woods, Fox Chapel, Etna, Hampton, Pine, Shaler, McCandless) 2= No (Richland, Ross) 1= Don’t know (Franklin Park) If your community has developed guidance and/or requirements, please attach a copy.
* 7.05 What are the top three stormwater practices typically installed in your community?
Bradford Woods-1.-No Roof Drainage onto streets; 2-No impervious surface; 3-Grading of land Fox Chapel – Sumps; Detention Ponds

170
Franklin Park- Detention Ponds, Sedimentation Traps, Silt Fence Hampton- Detention Ponds, Pits, underground tanks Indiana- Detention Facilities O’Hara- Detention Ponds, detention chambers, level spreaders area Pine – Detention Pond, Retention Pond, Underground tanks- release systems Richland- Ponds, Tanks Ross- SWM Ponds, underground Piped Storage, Sumps Shaler- Detention Basins, Swales, Grass filter Strips McCandless- Sump pits for small development, Open detention facilities, Underground detention facilities
7.06 Is a stormwater plan or other documentation required during the site plan review process?
13= Yes (Marshall, Bradford Woods, Etna, Fox Chapel, Franklin Park, Hampton, Indiana, O’Hara, Pine, Richland, Ross, Shaler, McCandless) 0= No
7.07 Does your community inspect stormwater practices during construction?
13= Yes (Marshall, Bradford Woods, Etna, Fox Chapel, Franklin Park, Hampton, Indiana, O’Hara, Pine, Richland, Ross, Shaler, McCandless) 0= No
7.08 Is an as-built or record drawing of the stormwater practice required after construction?
10= Yes (Etna, Marshall, Fox Chapel, Franklin Park, Hampton, Indiana, O’Hara, Pine, Shaler, McCandless) 3= No (Bradford Woods, Richland, Ross) 0= Don't know 0= Not applicable
7.09 Who is typically responsible for maintenance of stormwater practices over the life of the
stormwater practice?
8= Private owner (Marshall, Bradford Woods, Fox Chapel*, Etna, Pine, Richland, Ross, McCandless) 0= Builder 4= Homeowner's association (Fox Chapel*, Pine, Ross, McCandless) 5= Permitting agency (Fox Chapel*, Franklin Park, Indiana, O’Hara, McCandless) 3= Other, please explain (Pine – Municipality; Hampton- Township, Shaler-Shaler) 0= Not applicable
* Fox Chapel- all selected sections depends on type of facility/location, etc.
7.10 Is there a maintenance agreement or covenant between the permitting agency and the private
owner, builder, or homeowner's association in charge of maintenance?
10= Yes (Marshall, Fox Chapel, Etna, Fox Chapel, Indiana, O’Hara, Pine, Richland, Ross, Shaler) 3= No (Bradford Woods, Franklin Park, McCandless)

171
0= Don't know 1= Not applicable (Hampton)
7.11 Are privately maintained stormwater practices inspected by a public agency for maintenance
upkeep or structural integrity over the life of the facility?
8= Yes (Fox Chapel, Marshall, Hampton, Indiana, O’Hara, Pine, Ross {if required), Shaler {periodically}) 3= No (Bradford Woods, Richland, McCandless) 1= Don't know (Etna) 1= Not applicable (Franklin Park)
7.12 How frequently are privately owned stormwater practices inspected?
1= More than once a year (Fox Chapel) 0= Once a year 1= Every two years (Hampton) 6= In response to complaints (Etna, Marshall, O’Hara, Pine, Ross, McCandless) 2= Never (Bradford Woods, Richland) 2= Other, please describe (Indiana-After a significant rainfall event, Shaler-no set interval) 1= Don't know (Franklin Park) 0= Not applicable
7.13 Are there penalties for not complying with the maintenance agreement or other applicable
regulations applying to maintenance?
10= Yes (Etna, Marshall, Fox Chapel, Hampton, Indiana, O’Hara, Pine, Ross, Shaler, McCandless) 1= No (Bradford Woods) 1= Don't know (Franklin Park) 1= Not applicable (Richland)
If yes, please describe penalties. Fox Chapel : If homeowners’ association doesn’t maintain, municipality has right to do so and
charge homeowners cost +10% (See Subdivision Ordinance Section 404. II). Also see
Subdivision Ordinance Section 503.
Shaler: We have a “Penalty” section in our recently adopted (Apr.2003) Stormwater Ord.
* 7.14 Does your municipality encourage ground water recharge practices?
6= Grass swales (Etna, O’Hara, Pine, Richland, Shaler, McCandless) 1= Plantings in cul-de-sacs (Pine) 2= Pervious paved surfaces (Bradford Woods, Shaler) 3= Retention ponds (as opposed to detention ponds) (Marshall, Etna, Pine) 2= Other, please describe (Shaler –Disconnect roof leaders from storm sewer and letting spill onto yard, McCandless-Sump pits, Marshall – Underground sumps) 1= No (Franklin Park) 2= Not applicable (Hampton, Indiana)

172
Section 7 Comments:
O’Hara: “Question 7.09: The Township is responsible for stormwater facilities for development in
which the plan improvement are dedicated for public use. Other developments, such as PRD’s, the storm
water facilities are typically maintained by a homeowner association.”

173
Section 8. Non-Stormwater Discharges Importance: Industrial effluents, sanitary waste water, fertilizers, petroleum products and salt on road
surfaces, are just a few of the point and non-point sources of water pollution. Locating, quantifying, and controlling non-stormwater pollutant sources in the watershed is the first step towards water quality improvement. Identifying operation and maintenance practices that prevent or reduce pollutants entering the municipal or natural drainage system is the second.
Local Authority: Sanitary and Stormwater Sewer System 8.01 The best description of my community's stormwater management system is: 6= Storm sewers (Marshall, Bradford Woods, Fox Chapel, Hampton, O’Hara, Shaler)
2= Open channels (Marshall, Fox Chapel) 5= Combination, please provide relative percentage of each (Etna, Indiana-20% storm sewer
80% channel, Pine –uncertain, Richland, Ross-not available) 1= Other, please describe (McCandless-combination, we use performance standard rather than
prescriptive) 0= Don't know
8.02 How does your community manage sanitary wastes (check all that apply)? 10= Septic systems (Marshall, Bradford Woods, Franklin Park, Hampton, Indiana, O’Hara, Pine, Richland, Shaler, McCandless) 1= Aeration systems (Franklin Park) 2= Package treatment plants (Franklin Park, Marshall) 13= Centralized wastewater treatment plants (Marshall, Bradford Woods , Fox Chapel, Etna, Franklin Park, Hampton, Indiana, O’Hara, Pine, Richland, Ross, Shaler, McCandless)
1= Other, please describe (Fox Chapel – ALCOSAN) 0= Don't know 8.03 Do the sanitary sewer trunk mains follow (check all that apply): 2= Shortest distance (Pine, McCandless) 10= Stream valley (Fox Chapel, Marshall, Franklin Park, Indiana, O’Hara, Pine, Richland, Ross, Shaler, McCandless) 2= Other, please describe (Etna –Streets, McCandless) 2= Don't know (Bradford Woods, Hampton) 0= Not applicable 8.04 Is there a program for illicit connection detection?
11= Yes (Etna–Allegheny County Health Department, D.E.P., Fox Chapel, Franklin Park, Hampton, Indiana-by services authority, Pine, Richland, Marshall, Ross, Shaler, McCandless)
1= No (O’Hara) 2= Don't know (Bradford Woods, Hampton) 0= Not applicable

174
8.05 Does your illicit connection detection program include provisions for removal of illicit
discharges?
9= Yes (Etna, Marshall, Fox Chapel, Franklin Park, Pine, Richland, Ross, Shaler, McCandless) 1= No (O’Hara-but will with the new MS4 requirements) 3= Don't know (Bradford Woods, Hampton, Indiana) 0= Not applicable
8.06 Within the Pine Creek watershed, does your community have any involvement responding to
septic system complaints (e.g. any investigation prior to contacting Allegheny County)?
3= Yes (Marshall, Fox Chapel, Shaler) 8= No (Bradford Woods, Franklin Park, Hampton, Indiana, O’Hara, Pine, Richland, McCandless) 2= Not applicable (Etna, Ross)
If yes, please explain. Fox Chapel: We have just awarded a contract to construct public sewers to serve 8 properties where septic tanks/systems are reported to have failed over the years. Shaler: We will dye test a system and provide some basic maintenance (flushing)
8.07 Does your community conduct inspections of privately owned septic systems?
0= Yes 12= No (Bradford Woods, Marshall, Fox Chapel, Franklin Park, Hampton, Indiana, O’Hara, Pine, Richland, Ross, Shaler, McCandless) 1= Not applicable (Etna)
Confined Animal Feeding Lots 8.08 Are there regulations regarding stormwater runoff from confined animal feeding lots?
2= Yes (Ross, McCandless) 4= No (Franklin Park, Marshall, Hampton, Indiana, O’Hara) 5= Not applicable (Bradford Woods, Etna, Fox Chapel, Richland, Shaler) 1= Don't know (Pine)
If yes, please attach a copy of the regulations.
Spill Response, Prevention and Cleanup 8.09 Does your community have a spill response plan?
8= Yes (Bradford Woods, Etna, Franklin Park, Indiana, O’Hara, Pine, Richland, McCandless) 1= No (Fox Chapel) 2= Don't know (Hampton, Shaler)
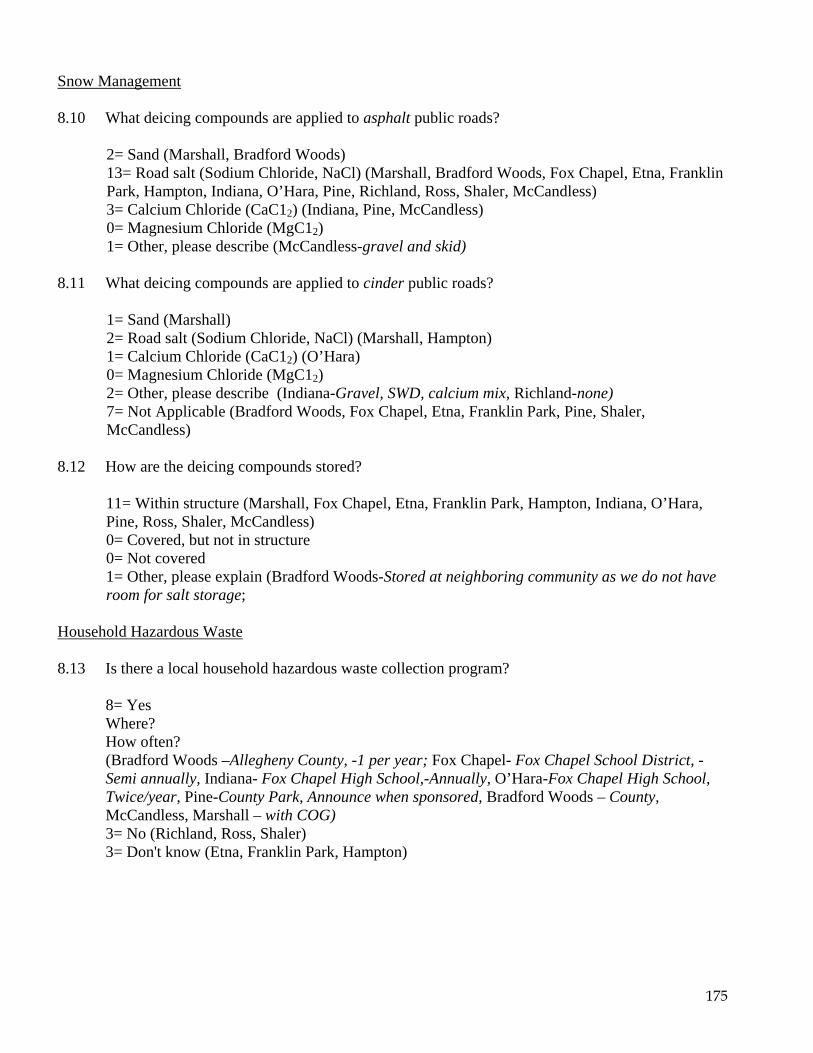
175
Snow Management 8.10 What deicing compounds are applied to asphalt public roads?
2= Sand (Marshall, Bradford Woods) 13= Road salt (Sodium Chloride, NaCl) (Marshall, Bradford Woods, Fox Chapel, Etna, Franklin Park, Hampton, Indiana, O’Hara, Pine, Richland, Ross, Shaler, McCandless) 3= Calcium Chloride (CaC12) (Indiana, Pine, McCandless) 0= Magnesium Chloride (MgC12) 1= Other, please describe (McCandless-gravel and skid)
8.11 What deicing compounds are applied to cinder public roads?
1= Sand (Marshall) 2= Road salt (Sodium Chloride, NaCl) (Marshall, Hampton) 1= Calcium Chloride (CaC12) (O’Hara) 0= Magnesium Chloride (MgC12) 2= Other, please describe (Indiana-Gravel, SWD, calcium mix, Richland-none) 7= Not Applicable (Bradford Woods, Fox Chapel, Etna, Franklin Park, Pine, Shaler, McCandless)
8.12 How are the deicing compounds stored?
11= Within structure (Marshall, Fox Chapel, Etna, Franklin Park, Hampton, Indiana, O’Hara, Pine, Ross, Shaler, McCandless) 0= Covered, but not in structure 0= Not covered 1= Other, please explain (Bradford Woods-Stored at neighboring community as we do not have room for salt storage;
Household Hazardous Waste 8.13 Is there a local household hazardous waste collection program?
8= Yes Where? How often? (Bradford Woods –Allegheny County, -1 per year; Fox Chapel- Fox Chapel School District, -Semi annually, Indiana- Fox Chapel High School,-Annually, O’Hara-Fox Chapel High School, Twice/year, Pine-County Park, Announce when sponsored, Bradford Woods – County, McCandless, Marshall – with COG) 3= No (Richland, Ross, Shaler) 3= Don't know (Etna, Franklin Park, Hampton)

176
Section 8 Comments:
Bradford Woods: “Neighboring Council of Government’s has offered this service. Allegheny County
has list of business that collect discarded items.”
O’Hara: “8.11: We do not have any cinder public roads.”
McCandless: Lobbying efforts by municipalities through the North Hills Council of Governments has
resulted (in part) in the attached.
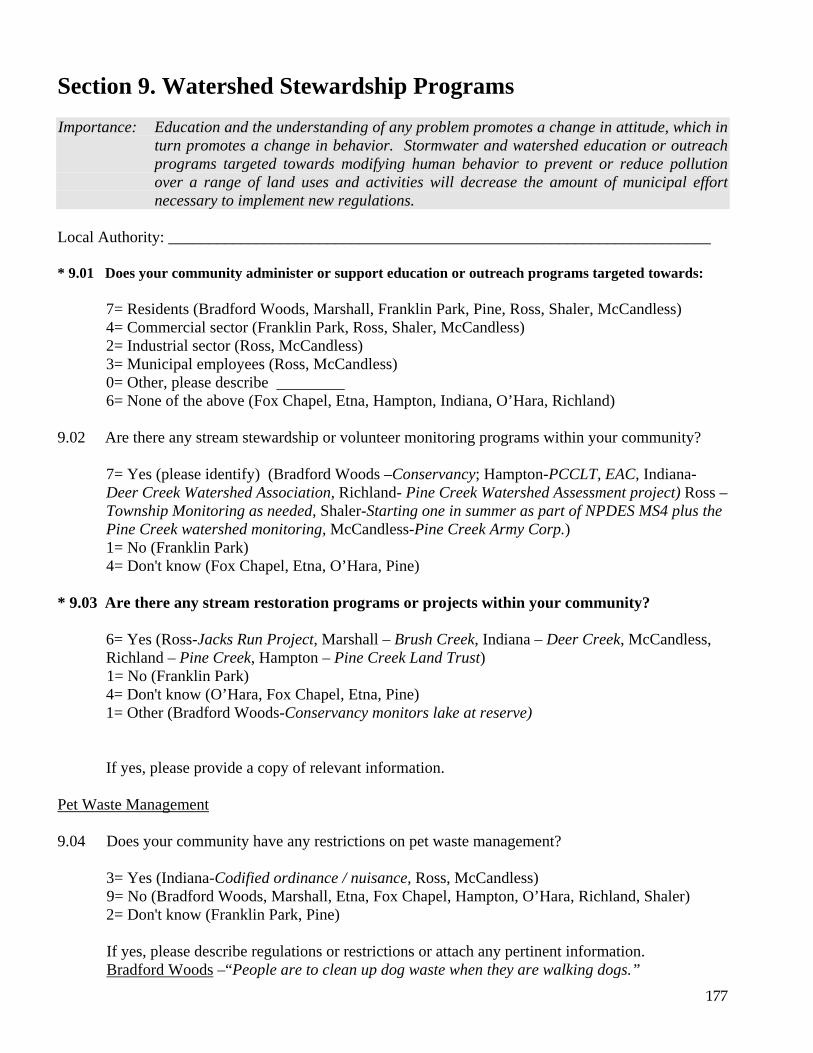
177
Section 9. Watershed Stewardship Programs Importance: Education and the understanding of any problem promotes a change in attitude, which in
turn promotes a change in behavior. Stormwater and watershed education or outreach programs targeted towards modifying human behavior to prevent or reduce pollution over a range of land uses and activities will decrease the amount of municipal effort necessary to implement new regulations.
Local Authority: ____________________________________________________________________ * 9.01 Does your community administer or support education or outreach programs targeted towards:
7= Residents (Bradford Woods, Marshall, Franklin Park, Pine, Ross, Shaler, McCandless) 4= Commercial sector (Franklin Park, Ross, Shaler, McCandless) 2= Industrial sector (Ross, McCandless) 3= Municipal employees (Ross, McCandless) 0= Other, please describe 6= None of the above (Fox Chapel, Etna, Hampton, Indiana, O’Hara, Richland)
9.02 Are there any stream stewardship or volunteer monitoring programs within your community?
7= Yes (please identify) (Bradford Woods –Conservancy; Hampton-PCCLT, EAC, Indiana-Deer Creek Watershed Association, Richland- Pine Creek Watershed Assessment project) Ross –Township Monitoring as needed, Shaler-Starting one in summer as part of NPDES MS4 plus the Pine Creek watershed monitoring, McCandless-Pine Creek Army Corp.) 1= No (Franklin Park) 4= Don't know (Fox Chapel, Etna, O’Hara, Pine)
* 9.03 Are there any stream restoration programs or projects within your community?
6= Yes (Ross-Jacks Run Project, Marshall – Brush Creek, Indiana – Deer Creek, McCandless, Richland – Pine Creek, Hampton – Pine Creek Land Trust) 1= No (Franklin Park) 4= Don't know (O’Hara, Fox Chapel, Etna, Pine) 1= Other (Bradford Woods-Conservancy monitors lake at reserve) If yes, please provide a copy of relevant information.
Pet Waste Management 9.04 Does your community have any restrictions on pet waste management?
3= Yes (Indiana-Codified ordinance / nuisance, Ross, McCandless) 9= No (Bradford Woods, Marshall, Etna, Fox Chapel, Hampton, O’Hara, Richland, Shaler) 2= Don't know (Franklin Park, Pine)
If yes, please describe regulations or restrictions or attach any pertinent information. Bradford Woods –“People are to clean up dog waste when they are walking dogs.”

178
Street Sweeping 9.05 Does your community sweep public streets?
11= Yes (Etna, Fox Chapel, Shaler, Marshall, Hampton, Indiana, O’Hara, Pine, Richland, Ross, McCandless)
2= No (Bradford Woods, Franklin Park) 0= Don't know 9.06 What types of machines are used?
Fox Chapel: Johnson J 3000 Mechanical Etna: Street Sweeper Indiana: O’Hara’s new street sweeper/ please refer to O’Hara’s survey section 9.06 O’Hara: Mechanical sweeper Pine: Vehicle sweeper Richland: Vacuum 8 Street Sweepers Ross : Street Sweeper McCandless: Street Sweeper, hi-lift
9.07 How often does street sweeping occur? 0= Weekly 1= Monthly (Ross) 6= Annually (Etna, Marshall, Hampton, Indiana, Pine, McCandless) 4= Other, please explain (Fox Chapel –Spring + After sealcoating roads, O’Hara –Biennial, Richland-after severe winters, Shaler – twice per year) 1= Not applicable (Bradford Woods) 9.08 Does street sweeping vary seasonally (e.g., streets are not swept in winter)? 5= Yes, please explain (Etna-as weather permits, Marshall – spring, O’Hara –do not sweep in winter, Richland-usually done in the Springs, Ross-Spring Summer and Fall Sweeping, McCandless) 1= No (Pine) 1= Don't know (Hampton) 2= Not applicable (Bradford Woods, Indiana) Lawn Care * 9.09 Are fertilizers used on public lands?
10= Yes (Fox Chapel, Marshall, Franklin Park, Hampton, Indiana, O’Hara, Richland, Ross, Shaler, McCandless)
2= No (Bradford Woods, Etna) 1= Don't know (Pine) * 9.10 Are pesticides (insecticides, herbicides) used on public lands?
7= Yes (Bradford Woods, Fox Chapel, Franklin Park, Hampton, O’Hara, Richland, Marshall – walking trails, Ross-in a limited way, roadway vegetation is not sprayed)

179
2= No (Etna, Indiana) 2= Don't know (Pine, Shaler)
Section 9 Comments:
Bradford Woods: “We are under contract with National Gypsy Moth Management that determine egg
masses for us on a yearly basis and submit recommendations for the control.”
Shaler: Shaler is exploring a twice-a-year street sweeping program (April and October), but nothing is
in place.

Appendix H
A Layman’s Guide to Best Management Practices for Non-point Source Pollution in the Pine Creek Watershed
Prepared by Dave Larson
Duquesne University, Environmental Science and Management

180
Selecting appropriate Best Management Practices (BMPs) is a challenge in any location or environment. The first step in determining which BMPs are best suited for an area is to gather information on land use. The Pine Creek Watershed in Allegheny County contains a modest amount of industry and farmland, but is largely commercial and residential. Given the rapid development of the watershed, and the associated land constraints, certain BMPs will be better suited than others.
The second step in BMP selection is to identify specific problems and decide
which BMP provides the best solution. BMPs vary significantly in cost and effectiveness, so it is important to consider the pros and cons of several options before proceeding. The following BMP recommendations were researched specifically for the Pine Creek Watershed. However, proper planning and discretion is advised before putting the BMPs to work. A flow chart describing the BMP selection process is depicted in Table 1.
Table 1
Key phases of a BMP selection process1 Base Analyses Selection Process
Scoping
• BMP type and characteristics
• Management goals and objectives
• Site characteristics
• Constituent type
• Source type
• Is the BMP suitable or does it have demonstrated success in addressing the targeted sources at similar conditions?
• Can the BMP completely or partially achieve program objectives?
List of potential candidate BMPs
(both structural and nonstructural)
Evaluation
• Site physical constraints
• BMP effectiveness data
• BMP maintenance options
• Can the structural BMP be implemented within the physical site constraints?
• Does the BMP have a superior effectiveness?
• What management alternative can be developed based on compatible BMP combinations to maximize control and minimize maintenance?
Feasible management alternatives
1 http://www.fhwa.dot.gov/environment/ultraurb/uubmp6p1.htm#s62

181
(a single BMP or combination or BMPs)
Final Selection
• BMP cost elements
• Public acceptance
• Additional benefits
• Is management alternative cost-effective? (compare alternatives based on cost)
• Does the alternative have additional environmental values? (aesthetics, recreation, public support)
• What are the risks associated with the alternative not meeting the objectives? (compare short- and long-term overall performance)
Selected management alternative
Two major areas of concern in the Pine Creek Watershed are storm water runoff and non-point source pollution. When selecting BMPs it is important to consider cost and longevity. See Table 2.
Table 2. Relative Rankings of Cost Elements and Effective Life of Structural BMP Options2
BMP Capital Costs O&M Costs Effective Lifea
Infiltration Trench Moderate to High Moderate 10 - 15 years Bioretention Moderate Low 5 - 20 yearsb Detention/Retention Basins Moderate Low 20 - 50 years Wetlands Moderate to High Moderate 20 - 50 years Green Rooftops Moderate to High Moderate to High N/A Vegetated Filter Strips Low Low 20 - 50 years Sorbent Materials Low to Moderate Low N/A Rain Collection Barrels Moderate Low N/A Porous Pavement Low Moderate 15 - 20 years a Assumes regular maintenance, occasional removal of accumulated materials, and removal of any clogged media. b As a relatively new BMP, the effective life is uncertain. It is reasonable to assume an effective life at least as long as a vegetated swale. NA = Not Applicable or Not Available
2 http://www.fhwa.dot.gov/environment/ultraurb/uubmp6p2.htm#s631

182
Detention/Retention Basins
Interpretations of what defines detention versus retention vary. To avoid confusion, detention basins will be referred to as ‘dry ponds’ (temporary storage) and retention basins as ‘wet ponds’ (permanent pools of water). Both wet and dry ponds are used to lessen the impacts of heavy storm water runoff and downstream sedimentation, and are typically constructed in naturally low-lying areas.
Dry ponds are constructed on permeable soils with water-resistant grasses, and are
effective at reducing the quantity of runoff, but provide minimal pollutant removal via settling and infiltration. Water is detained in the dry pond until drained by evaporation and infiltration; “a detention time of 48 hours should be employed to improve suspended solids removal.”3 “The grading of the pond side slopes should be terraced with an average slope of 3:1 or flatter…to prevent erosion of the bans during larger storms and make routine basin tasks, such as mowing, easier.”3
Wet ponds are constructed on soils with low permeability in order to maintain a
pool of standing water. While the main function of wet ponds may be to reduce the quantity of runoff, water quality improvements are attainable. Wet ponds take advantage of the natural vegetation for nutrient uptake, and allow suspended particles to settle out. The bigger the pond, the more effective it will be at pollution removal. In addition, the use of erosion control structures i.e. grass filter strips and natural vegetation help prevent sedimentation and reduce maintenance costs. It is recommended that wet ponds be inspected at least twice a year to ensure proper functioning.3
3 http://www.metrocouncil.org/environment/Watershed/bmp/manual.htm (December 2003)

183
Figure 1 Typical Detention/Retention Basin Design4
Despite the water quality differences, both wet and dry ponds are efficient BMPs to reduce flooding. Additionally, both wet and dry ponds can be designed to prevent direct discharges to surface waters and follow the natural contours of the land.
However, there are a few limitations with detention/retention basins. The ponds
are of a fixed size and capacity, while runoff is highly variable. Therefore, overflow areas must be considered prior to construction. Occasionally sediment removal will be necessary; thus monitoring is required. Furthermore, ponds should not be constructed near drinking wells. Underground Detention Systems In areas where land is not available for traditional wet or dry ponds, underground detention systems are an option. As a BMP underground detention systems function to mitigate storm water runoff by holding excess water for slow release. Underground detention systems vary greatly in size and complexity, and can be installed at almost any location. The greatest benefit of this type of BMP is that it is hidden from view, and does not require surface land. Construction of underground detention systems is usually linked to another construction project, such as building excavations or parking lots. See Table 3.
4 http://www.epa.gov/owm/mtb/wetdtnpn.pdf

184
Table 3 Comparison of Design Considerations for Construction Materials for Underground Storm Water Detention Systems5
Porous Pavement
One of the largest problems facing the Pine Creek Watershed is reduced infiltration rates due to development. Porous pavements are a great BMP to increase stormwater infiltration by reducing the amount of impervious cover. Porous pavements decrease runoff, recharge ground water and lessen the need for storm sewers. Typically porous materials are used in parking lots, exit/entry ways, or sidewalks. Porous pavements are not well suited for heavily traveled roads but may be used on shoulders.
Porous pavements include concrete, asphalt, paving stones, concrete lug and
gravel, plastic matting and gravel, two-track design, and grass pavers. All porous pavements require careful siting and installation for proper functioning. Sediment accumulation tends to reduce the infiltration capacity of porous pavements; however pressure washing seems to extent their life.
Additional benefits of porous pavements are achieved for municipalities dealing
with Phase II of the Municipal Separate Storm Sewer Systems legislation that requires National Pollutant Discharge Elimination System permits for stormwater discharges. Porous pavements provide “passive water treatment by absorption of runoff into adjacent soils, where bacteria and other microbes decompose non-point surface pollutants before they can reach groundwater or surface waters like streams, ponds, lakes, or estuaries.”6
5 http://www.epa.gov/owm/mtb/runoff.pdf 6 http://stoneycreekmaterials.com/

185
See Figure 2 below. Figure 2 Cross Section of Porous Pavement7
Infiltration Trench Infiltration trenches are designed to increase infiltration in urban settings, while providing some degree of pollution control. See Table 4. Table 4 Estimated Long-Term Pollutant Removal Rates (%) For Infiltration Basins8 Pollutant Sizing Rule Sizing Rule 0.5 in/impervious acre 2-yr runoff volume Sediment 75% 99% Total Phosphorous 50-55% 65-70% Total Nitrogen 45-55% 60-70% Trace Metals 75-80% 95-99% BOD 70% 90% Bacteria 75% 98%
7 http://www.epa.gov/owm/mtb/porouspa.pdf 8 http://www.metrocouncil.org/environment/Watershed/bmp/manual.htm

186
The trenches are relatively easy to install and do not require large areas of land. See Figure 3. Figure 3 Cross Section of an Infiltration Trench9
The biggest consideration before installing an infiltration trench is whether or not the soil is well suited. Different types of soil have different infiltration rates or capacities. The trench needs to be designed to drain rather than pool. See Table 5. Table 5 Infiltration Rates for Soil Groups10
Soil Class Infiltration Rate (inches/hour)
National Resource Conservation Service
Hydrologic Soil Group Sand 8.0 A
Loamy Sand 2.0 A Sandy Loam 1.0 B
Loam 0.5 B Silt Loam 0.3 C
Sandy Clay Loam 0.2 C
9 http://www.epa.gov/owm/mtb/infltrenc.pdf 10 http://www.deq.state.mi.us/documents/deq-lwm-nfip-SMGCh04.pdf

187
Bioretention “Bioretention areas manage storm water runoff by using a conditioned soil layer that contains a mixture of detritus, humus, and mineral and biological complexes in a shallow depressed area. The soil layer and the microbes living in the soil enhance filtration, and the vegetation aids constituent removal.”11 When first being constructed, the bioretention area will require frequent inspection to ensure proper functioning, and to be sure that the vegetation is surviving. Bioretention is a great BMP for urban areas that do not have enough space for a wetland, such as highway medians or parking lots. The temporary water storage and treatment provided in a bioretention significantly reduces peak storm water runoff, and improves overall water quality. See Figure 4 below.
Figure 4 Typical Bioretention Area12
11 http://www.metrocouncil.org/environment/Watershed/bmp/manual.htm 12 http://www.epa.gov/owm/mtb/biortn.pdf

188
Wetlands Perhaps the best and most effective BMP to improve a watershed is the construction/preservation of wetlands. Though not recommended for treatment of storm water runoff, wetlands are exceptionally good at removing pollutants from water. Simply having/creating additional wetlands within the watershed will drastically improve the water quality. See Table 6 below. Table 6 Performance of Storm Water Wetlands13
Designing a wetland takes considerable planning and resources; however it may just be worth it. Wetlands can be created to meet specific criteria and perform specific functions. See Figure 5.
13 http://www.metrocouncil.org/environment/Watershed/bmp/manual.htm

189
Figure 5 Comparative Profiles of Four Storm Water Wetland Designs14
Vegetated Filter Strips The Vegetated filter strip is a relatively cheap BMP with low maintenance costs. By planting grass, shrubs, saplings, or simply allowing vegetation to grow along roadsides, creek beds, or other areas, a filter strip can be established.
Vegetated filter strips capture and filter runoff, and allow time for infiltration and biological uptake of storm water constituents.15 See Figure 6. 14 http://www.epa.gov/npdes/pubs/wetlands.pdf 15 http://www.metrocouncil.org/environment/Watershed/bmp/manual.htm

190
Figure 6 Profile of Vegetated Filter Strip16
Green Rooftops Planting vegetation on rooftops is often overlooked when considering BMPs. However, green rooftops provide many advantages, some of which are:
• Reduced/delayed storm water runoff; • Improved air quality; and • Added building insulation.17
The main goal of this BMP is to reduce the amount of impervious cover in the watershed. See Figure 7. Figure 7 Green Rooftop Design18
16 http://www.metrocouncil.org/environment/Watershed/bmp/CH3_STFiltFilterStrips.pdf 17 http://www.epa.gov/npdes/pubs/ 18 http://www.metrocouncil.org/environment/Watershed/bmp/CH3_RPPImpGreenRoof.pdf

191
Rain Collection Barrels Rain collection barrels are another BMP designed to control storm water runoff. Installing barrels at the end of roof gutters or downspouts helps detain some of the runoff. Effectiveness depends upon community involvement; the more homes fitted with rain barrels, the greater the effect.
Rain collection barrels can be purchased in many designs with spigots for easy access. Rain collection programs have been successful in other areas in reducing stress on municipal water departments and lessening both flooding and erosion. Collected water can be stored for use on gardens, or simply held for a delayed release. If the water is to be released, a slow release over a pervious area will prevent erosion. Sorbent Materials “Sorbent materials (which include absorbents and adsorbents) have specific physical and/or chemical properties that allow them to attract specific types of liquids”.19 Sorbent materials are particularly useful at removing oil and grease from storm water. Therefore sorbent materials are a good BMP to utilize in catch basis or storm sewers. Since the largest quantities of oil and grease are from motor vehicles, the sorbents should be used along busy roads and parking areas. Many different types of sorbent materials exist, and most are quick to install and maintain. The only real downside is that periodic inspection is needed to ensure that the sorbent material has not been exhausted. A variety of sorbent materials and relevant capacities are shown in Table 7. Table 7 Comparison of Sorbent Materials20
19 http://www.metrocouncil.org/environment/Watershed/bmp/manual.htm 20 http://www.epa.gov/OW-OWM.html/mtb/sorbmat.pdf

192
Additional BMP Guidelines Aside from the large-scale, structural BMPs described above, there are many small steps the Pine Creek Watershed can take to create a healthier environment. Municipalities can:
• perform street sweeping at least once a year, as this dramatically reduces sedimentation;
• encourage pollution prevention; • educate the community about the watershed and individual BMPs;
o install rain collection barrels, o avoid use of fertilizers/pesticides, and o dispose of hazardous waste properly.
In addition municipalities can take advantage of “high-visibility, low-cost programs such as the Adopt-a-Road and Adopt-a-Stream programs”21 to increase awareness and community involvement. Remember everyone enjoys living in a clean watershed, so everyone must do his/her part to maintain it. See Figure 8. Figure 8 The Big Picture22
21 http://www.metrocouncil.org/environment/Watershed/bmp/manual.htm 22 http://www.fhwa.dot.gov/environment/ultraurb/index.htm

193
References
Metropolitan Council Environmental Services “Urban Small Sites Best Management Practice Manual” http://www.metrocouncil.org/environment/Watershed/bmp/manual.htm (December 2003) Michigan State Department of Environmental Quality “Storm Water Management Guidebook” http://www.deq.state.mi.us/documents/deq-lwm-nfip-SMGCh04.pdf (December 2003) Stoney Creek Materials, L.L.C. http://stoneycreekmaterials.com/ (December 2003) U.S. Department of Transportation Federal Highway Administration “Stormwater Best Management Practices in an Urban Setting: Selection and Monitoring” http://www.fhwa.dot.gov/environment/ultraurb/ (December2003) United States Environmental Protection Agency “Storm Water Technology Fact Sheet” http://www.epa.gov/npdes/pubs/ (December 2003)
Useful web links:
• http://epa.gov/waterscience/stormwater/monitor.htm “Urban Stormwater BMP Performance Monitoring”
• http://www.epa.gov/ost/stormwater/usw_c.pdf
“Description and Performance of Storm Water Best Management Practices”
• http://www.rougeriver.com/pdfs/education/DtnBnMnt.pdf “Detention Basin Maintenance”
• http://www.cfpub.epa.gov/npdes/storwater/menuofbmps/menu.cfm
“National Menu of Best Practices for Storm Water Phase II”
• http://www.nalms.org/bclss/forestry.html “Best Management Practices for Water Quality”
• http://www.state.nj.us/dep/watershedmgt/bmpmanual.htm “Best Management Practices for Control of Nonpoint Source Pollution from Stormwater”
• http://www.ctic.purdue.edu/CTIC/Catalog/WatershedManagement.html “Watershed Management”