pavement thickness design for local roads in...
TRANSCRIPT
PAVEMENT THICKNESS DESIGN FOR LOCAL ROADS IN IOWA
Final Report TR-586
February 2010
Sponsored by
Iowa Highway Research Board
Conducted by
Hosin “David” Lee
Yongjoo “Thomas” Kim
Jeremy Purvis
Public Policy Center
University of Iowa
Disclaimer Notice
The contents of this report reflect the views of the authors, who are responsible for the
facts and the accuracy of the information presented herein. The opinions, findings, and
conclusions expressed in this publication are those of the authors and not necessarily
those of the sponsors. The sponsors assume no liability for the contents or use of the
information contained in this document. This report does not constitute a standard,
specification, or regulation. The sponsors do not endorse products or manufacturers.
Trademarks or manufacturers' names appear in this report only because they are
considered essential to the objectives of the document.
Statement of Non-Discrimination
Federal and state laws prohibit employment and/or public accommodation discrimination
on the basis of age, color, creed, disability, gender identity, national origin, pregnancy,
race, religion, sex, sexual orientation or veteran’s status. If you believe you have been
discriminated against, please contact the Iowa Civil Rights Commission at 800-457-4416
or Iowa Department of Transportation's affirmative action officer. If you need
accommodations because of a disability to access the Iowa Department of
Transportation’s services, contact the agency's affirmative action officer at 800-262-0003.
1. REPORT NO.
IHRB Report TR-586
2. GOVERNMENT ACCESSION NO.
3. RECIPIENT'S CATALOG NO.
4. TITLE AND SUBTITLE
Pavement Thickness Design for Local Roads in Iowa
5. REPORT DATE
February 2010
6. PERFORMING ORGANIZATION CODE
7. AUTHOR(S)
Hosin “David” Lee, Yongjoo “Thomas” Kim and Jeremy Purvis
8. PERFORMING ORGANIZATION REPORT NO.
9. PERFORMING ORGANIZATION NAME AND ADDRESS
Public Policy Center University of Iowa 227 South Quadrangle Iowa City, IA 52242-1192
10. WORK UNIT NO.
11. CONTRACT OR GRANT NO
12. SPONSORING AGENCY NAME AND ADDRESS
Iowa Highway Research Board Iowa Department of Transportation 800 Lincoln Way, Ames, IA 50010
13. TYPE OF REPORT AND PERIOD COVERED
Final Report
14. SPONSORING AGENCY CODE
15. SUPPLEMENTARY NOTES
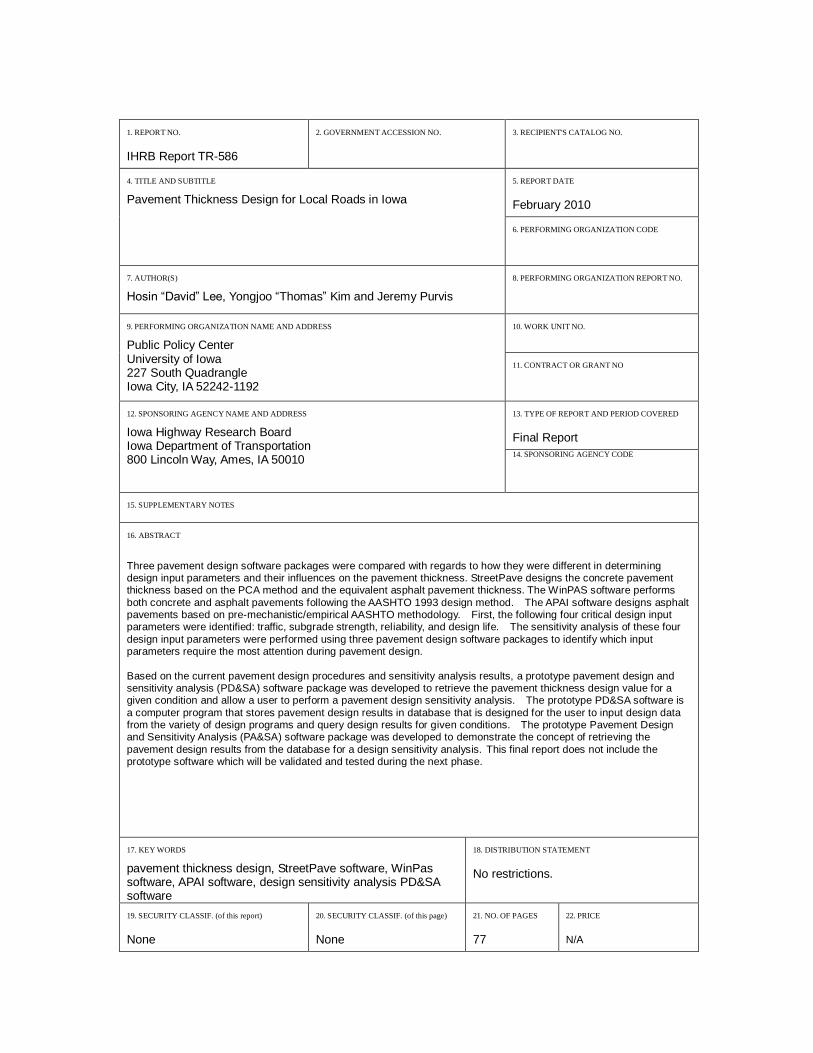
16. ABSTRACT
Three pavement design software packages were compared with regards to how they were different in determining design input parameters and their influences on the pavement thickness. StreetPave designs the concrete pavement thickness based on the PCA method and the equivalent asphalt pavement thickness. The WinPAS software performs
both concrete and asphalt pavements following the AASHTO 1993 design method. The APAI software designs asphalt pavements based on pre-mechanistic/empirical AASHTO methodology. First, the following four critical design input parameters were identified: traffic, subgrade strength, reliability, and design life. The sensitivity analysis of these four
design input parameters were performed using three pavement design software packages to identify which input parameters require the most attention during pavement design.
Based on the current pavement design procedures and sensitivity analysis results, a prototype pavement design and sensitivity analysis (PD&SA) software package was developed to retrieve the pavement thickness design value for a given condition and allow a user to perform a pavement design sensitivity analysis. The prototype PD&SA software is
a computer program that stores pavement design results in database that is designed for the user to input design data from the variety of design programs and query design results for given conditions. The prototype Pavement Design and Sensitivity Analysis (PA&SA) software package was developed to demonstrate the concept of retrieving the
pavement design results from the database for a design sensitivity analysis. This final report does not include the prototype software which will be validated and tested during the next phase.
17. KEY WORDS
pavement thickness design, StreetPave software, WinPas software, APAI software, design sensitivity analysis PD&SA software
18. DISTRIBUTION STATEMENT
No restrictions.
19. SECURITY CLASSIF. (of this report)
None
20. SECURITY CLASSIF. (of this page)
None
21. NO. OF PAGES
77
22. PRICE
N/A

Pavement Thickness Design for Local
Roads in Iowa
Final Report TR-586
February 2010
Principal Investigator
Hosin “David” Lee, Ph. D., P. E.
Associate Professor
Public Policy Center, Department of Civil and Environmental Engineering,
University of Iowa
Researcher
Yongjoo “Thomas” Kim, Ph. D.
Postdoctoral Research Scholar
Public Policy Center, Department of Civil and Environmental Engineering,
University of Iowa
Research Assistant
Jeremy Purvis
Graduate Research Assistant
Public Policy Center, Department of Civil and Environmental Engineering,
University of Iowa
Sponsored by
Iowa Highway Research Board
A report from
Public Policy Center University of Iowa
227 South Quadrangle Iowa City, IA 52242-1192
http://ppc.uiowa.edu

Technical Advisory Committee
Chris Brakke, Iowa DOT, [email protected]
Donna Buchwald, Iowa DOT, [email protected]
John Dostart, Iowa DOT, [email protected]
Cathy Nicholas, Black Hawk County, [email protected]
Myron Parizek, Benton County, [email protected]
Duane Wittstock, West Des Moines, [email protected]
Larry Stevens, SUDAS, [email protected]
Bill Rosener, APAI, ex officio member, [email protected]
Larry Mattusch, APAI, ex officio member, [email protected]
Gordon Smith, ICPA, ex officio member, [email protected]
John Cunningham, ICPA, ex officio member, [email protected]
i
Table of Contents
LIST OF TABLES ........................................................................................................iii
LIST OF FIGURES ...................................................................................................... iv
1. INTRODUCTION ..................................................................................................... 1
1.1 Objectives .......................................................................................................... 1
1.2 Benefits ............................................................................................................. 2
2. PAVEMENT DESIGN PROCEDURES ADOPTED BY SIX DEPARTMENTS OF
TRANSPORTATION ADJACENT TO IOWA ......................................................... 3
2.1 Questionnaire about Local Road Pavement Thickness Design ............................ 4
2.2 Survey Results ................................................................................................... 7
2.3 Summary of Survey Results ............................................................................. 11
3. PAVEMENT THICKNESS DESIGN SOFTWARE PACKAGES USED IN IOWA
................................................................................................................................... 14
3.1 StreetPave Software ......................................................................................... 14
3.2 WinPAS Software ............................................................................................ 16
3.3 APAI Software ................................................................................................. 18
4. SENSITIVITY ANALYSIS OF DESIGN INPUT PARAMETERS USING THREE
PAVEMENT DESIGN SOFTWARE PACKAGES ............................................... 21
4.1 Input Parameters .............................................................................................. 22
4.2 Analysis Results Using StreePave Software...................................................... 26
4.2.1 Concrete Pavement ................................................................................ 26
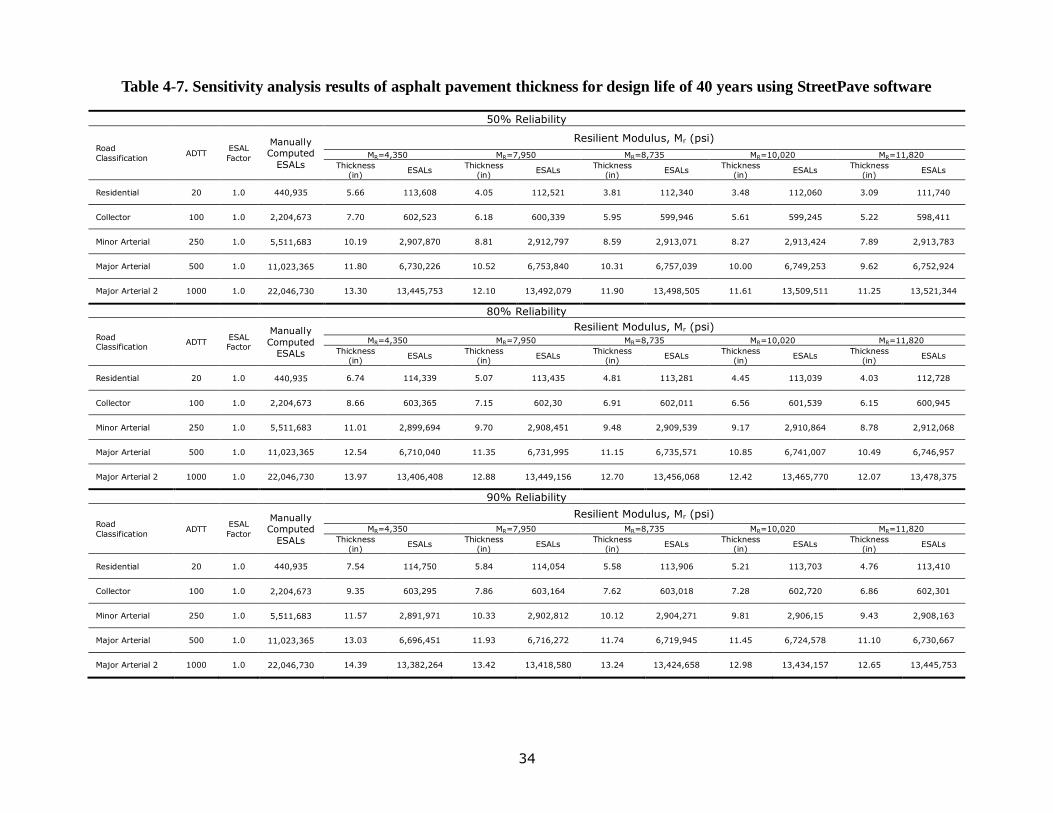
4.2.2 Asphalt Pavement .................................................................................. 32
4.3 Analysis Results Using WinPAS Software ........................................................ 36
4.3.1 Concrete Pavement ................................................................................ 36
4.3.2 Asphalt Pavement .................................................................................. 40
4.4 Analysis Results Using APAI Software ............................................................ 45
4.5 Comparison of Sensitivity Analysis Results ..................................................... 50
5. DEVELOPMENT OF PROTOTYPE PAVEMENT DESIGN AND SENSITIVITY
ANALYSIS SOFTWARE .................................................................................... 55
5.1 Literature Review on Pavement Design and Sensitivity Analysis Software ....... 55
5.2 Prototype Pavement Design and Sensitivity Analysis Software ........................ 57
5.2.1 Asphalt and Concrete Pavement Thickness Design Modules .................. 59
5.2.2 Pavement Design Input and Sensitivity Analysis Module....................... 61
6. SUMMARY AND CONCLUSIONS ....................................................................... 66
REFERENCES ............................................................................................................ 68

ii
APPENDIX .................................................................................................................. 71
A. Minimum Pavement Thickness
B. Survey Form and Survey Responses
C. Sensitivity Analysis Results
iii
LIST OF TABLES
Table 2-1. Summary of local road pavement design procedures in select state DOT's ...... 4
Table 2-2. Questionnaire about local road pavement design procedures ........................... 6
Table 2-3. Summary of survey results on local road pavement thickness design
procedures from five state DOT's ................................................................. 12
Table 3-1. Axle load categories used in StreetPave software .......................................... 16
Table 3-2. Concrete and asphalt ESAL’s generated by a mixed traffic stream ................. 17
Table 4-1. Common design input parameters used for sensitivity analysis ...................... 22
Table 4-2. Traffic input parameters used for sensitivity analysis ..................................... 22
Table 4-3. Additional input parameters required for WinPAS software ........................... 25
Table 4-4. Sensitivity analysis results of concrete pavement thickness for design life of 20
years using StreetPave Software ................................................................... 28
Table 4-5. Sensitivity analysis results of concrete pavement thickness for design life of 40
years using StreetPave Software ................................................................... 29
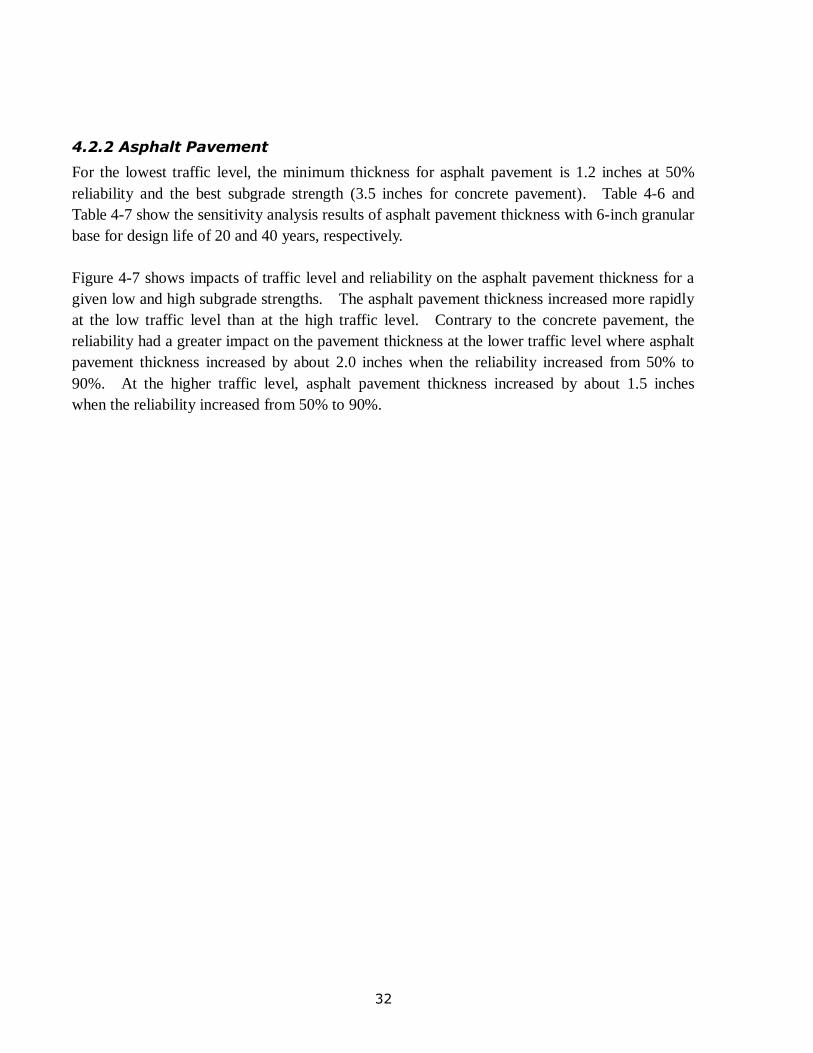
Table 4-6. Sensitivity analysis results of asphalt pavement thickness for design life of 20
years using StreetPave software.................................................................... 33
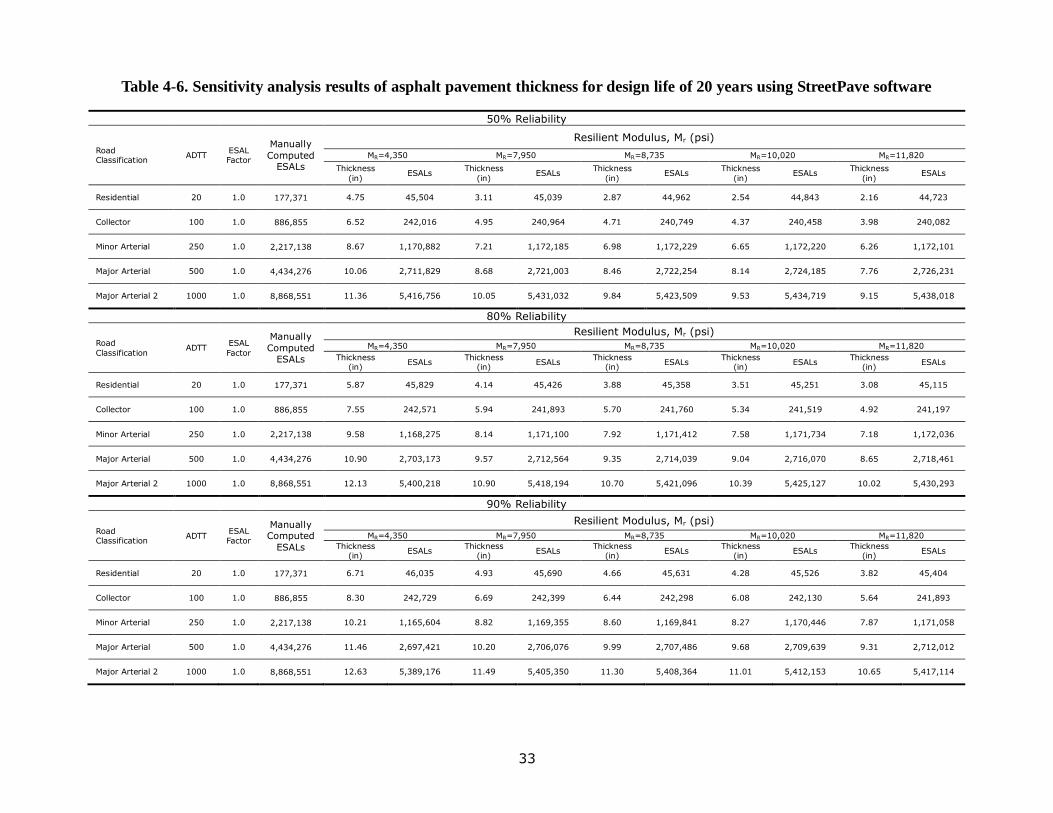
Table 4-7. Sensitivity analysis results of asphalt pavement thickness for design life of 40
years using StreetPave software.................................................................... 34
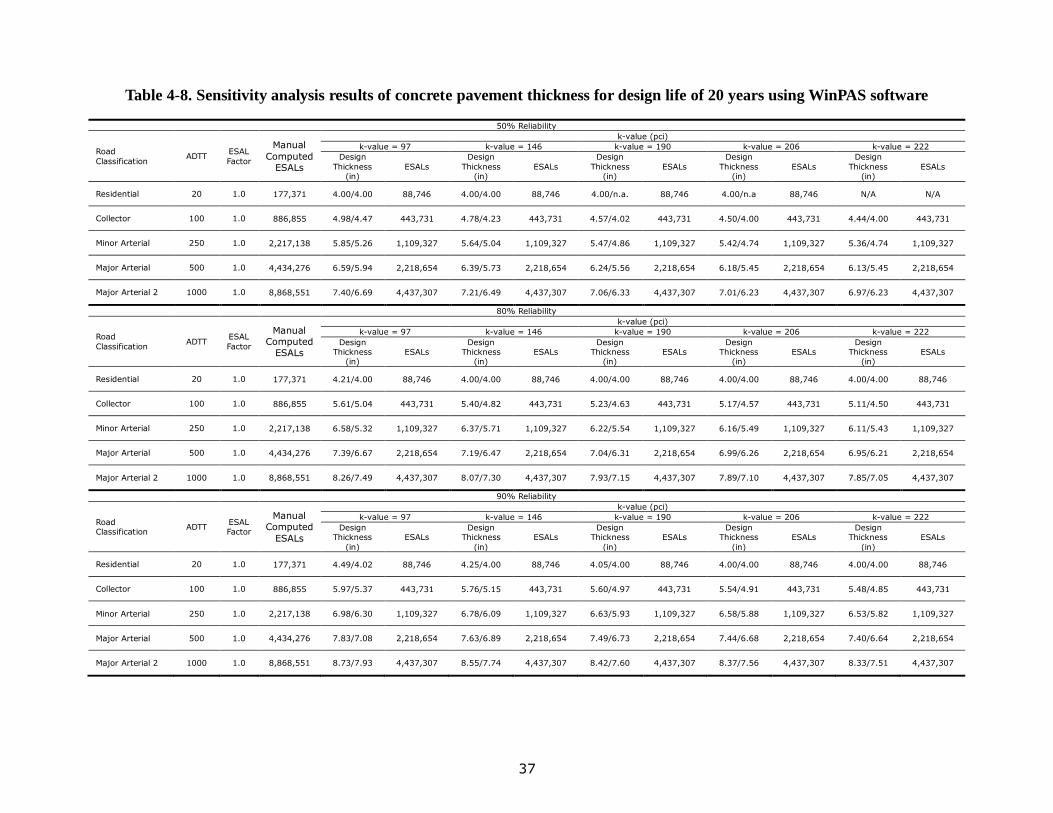
Table 4-8. Sensitivity analysis results of concrete pavement thickness for design life of 20
years using WinPAS software ....................................................................... 37
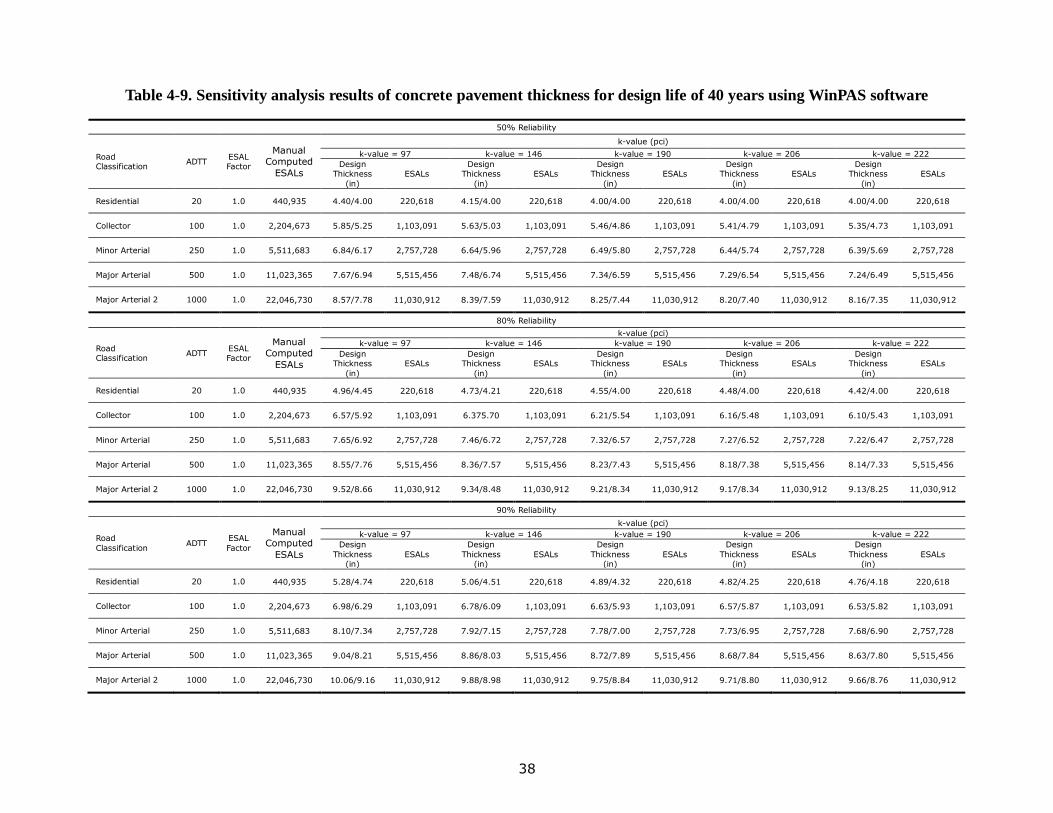
Table 4-9. Sensitivity analysis results of concrete pavement thickness for design life of 40
years using WinPAS software ....................................................................... 38
Table 4-10. Sensitivity analysis results of asphalt pavement thickness for design life of 20
years using WinPAS software ....................................................................... 42
Table 4-11. Sensitivity analysis results of asphalt pavement thickness for design life of 40
years using WinPAS software ....................................................................... 43
Table 4-12. Sensitivity analysis results of asphalt pavement thickness for design life of 20
years using APAI software ........................................................................... 47
Table 4-13. Sensitivity analysis results of asphalt pavement thickness for design life of 40
years using APAI software ........................................................................... 48
Table 4-14. Comparisons of sensitivity analysis results for concrete pavement using
StreetPave and WinPAS software ................................................................. 52
Table 4-15. Comparisons of sensitivity analysis results for asphalt pavement using
StreetPave, APAI, and WinPas software ....................................................... 52
iv
LIST OF FIGURES
Figure 2-1. Survey of low-volume pavement design procedure ........................................ 3
Figure 2-2. Contact information at adjoining state DOT's ................................................ 5
Figure 3-1. Screenshot of StreetPave pavement design software .................................... 15
Figure 3-2. WinPAS pavement design software.............................................................. 17
Figure 3-3 Screenshot of APAI pavement design software ............................................. 18
Figure 3-4. Approximate soil classification areas in Iowa (APAI 1990) .......................... 19
Figure 4-1. Sensitivity analysis flow chart of input parameters for pavement thickness
design .......................................................................................................... 21
Figure 4-2. Traffic inputs required for APAI software .................................................... 24
Figure 4-3. Subgrade inputs required for APAI software ................................................ 25
Figure 4-4. Impacts of traffic level and reliability on concrete pavement thickness given
low and high subgrade strength for 20 years of design life ............................ 30
Figure 4-5. Impact of traffic level and subgrade strength on concrete pavement thickness
given reliability of 80% and the design life of 20 years................................. 31
Figure 4-6. Impact of traffic level and design life at 80% reliability on concrete pavement
thickness ...................................................................................................... 31
Figure 4-7. Impacts of traffic level and reliability on asphalt pavement thickness given
low and high subgrade strength and design life of 20 years........................... 35
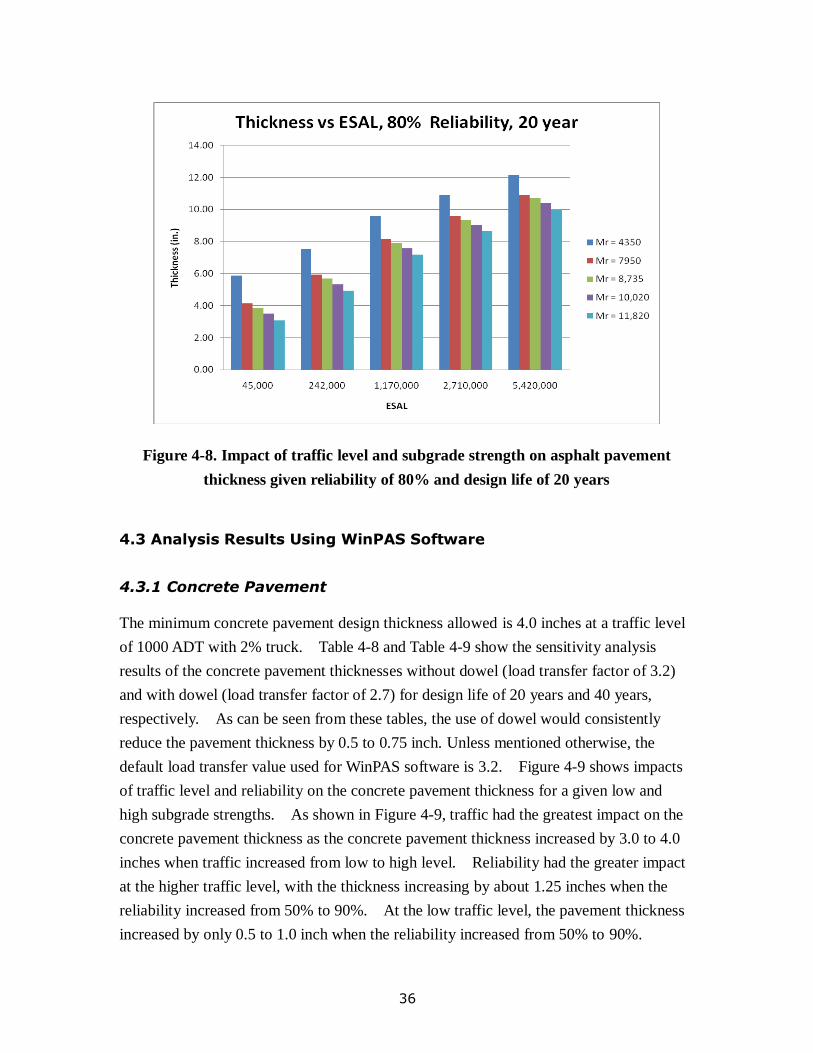
Figure 4-8. Impact of traffic level and subgrade strength on asphalt pavement thickness
given reliability of 80% and design life of 20 years ...................................... 36
Figure 4-9. Impacts of traffic level and reliability on concrete pavement thickness given
low and high subgrade strength and design life of 20 years........................... 39
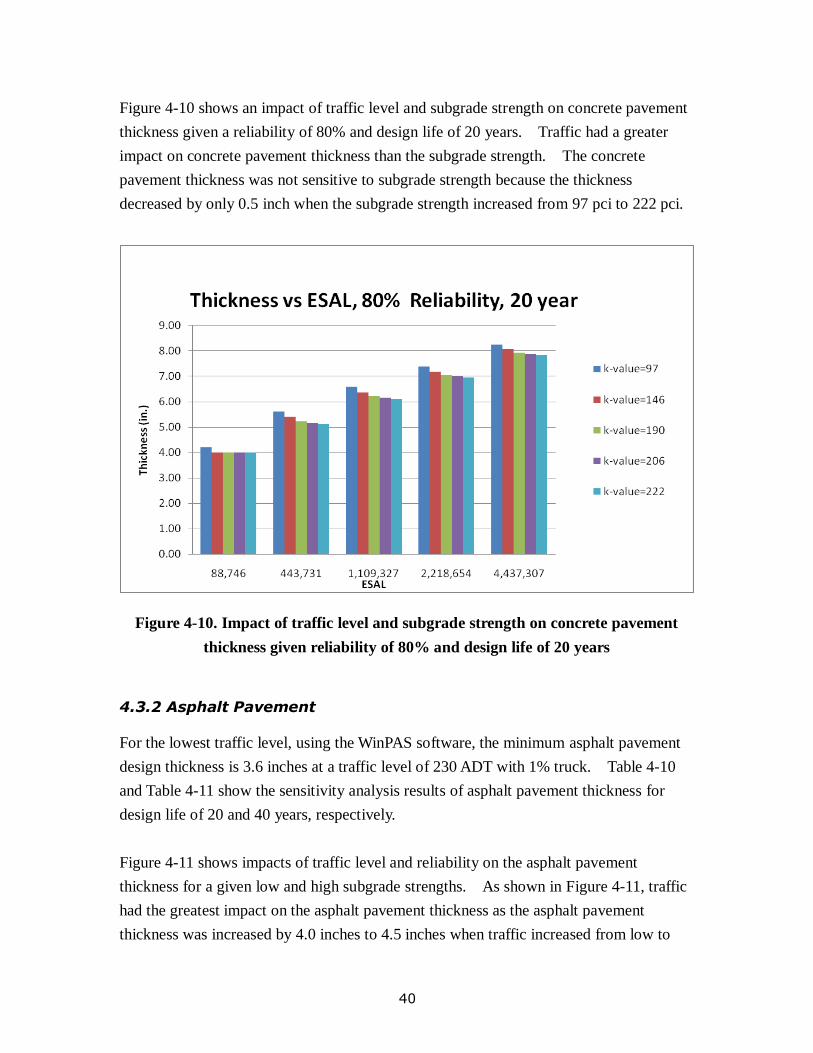
Figure 4-10. Impact of traffic level and subgrade strength on concrete pavement thickness
given reliability of 80% and design life of 20 years ...................................... 40
Figure 4-11. Impacts of traffic level and reliability on asphalt pavement thickness given
low and high subgrade strength and design life of 20 years........................... 44
Figure 4-12. Impact of traffic level and subgrade strength on asphalt pavement thickness
given reliability of 80% and design life of 20 years ...................................... 45
Figure 4-13. Impacts of traffic level and reliability on asphalt pavement thickness given
low and high subgrade strength and design life of 20 years........................... 49
Figure 4-14. Impact of traffic level and suggrade strength on asphalt pavement thickness
given reliability of 80% and design life of 20 years ...................................... 50
Figure 4-15. CBR versus soil classification used in APAI software ................................ 50
Figure 4-16. Comparison of WinPAS and StreetPave software for thickness design of
concrete pavement given reliability of 80% at low and high subgrade strength
v
.................................................................................................................... 53
Figure 4-17. Comparison of the WinPAS, StreetPave, and APAI software for thickness
design of asphalt pavement given low and high subgrade strength ................ 54
Figure 5-1. Class diagram of pavement design and sensitivity analysis software ............ 58
Figure 5-2. User interface of pavement design and sensitivity analysis software ............ 59
Figure 5-3. User interface for asphalt and concrete pavement thickness design modules 60
Figure 5-4. Database structure and relationship in Microsoft access database................. 61
Figure 5-5. Flow chart of pavement design data input and sensitivity analysis module ... 62
Figure 5-6. Screenshot of pavement design database ...................................................... 63
Figure 5-7. Screenshots of sensitivity analysis of design life and reliability on pavement
thickness ...................................................................................................... 64
Figure 5-8. Screenshots of sensitivity analysis of traffic and subgrade support on
pavement thickness ...................................................................................... 65
1
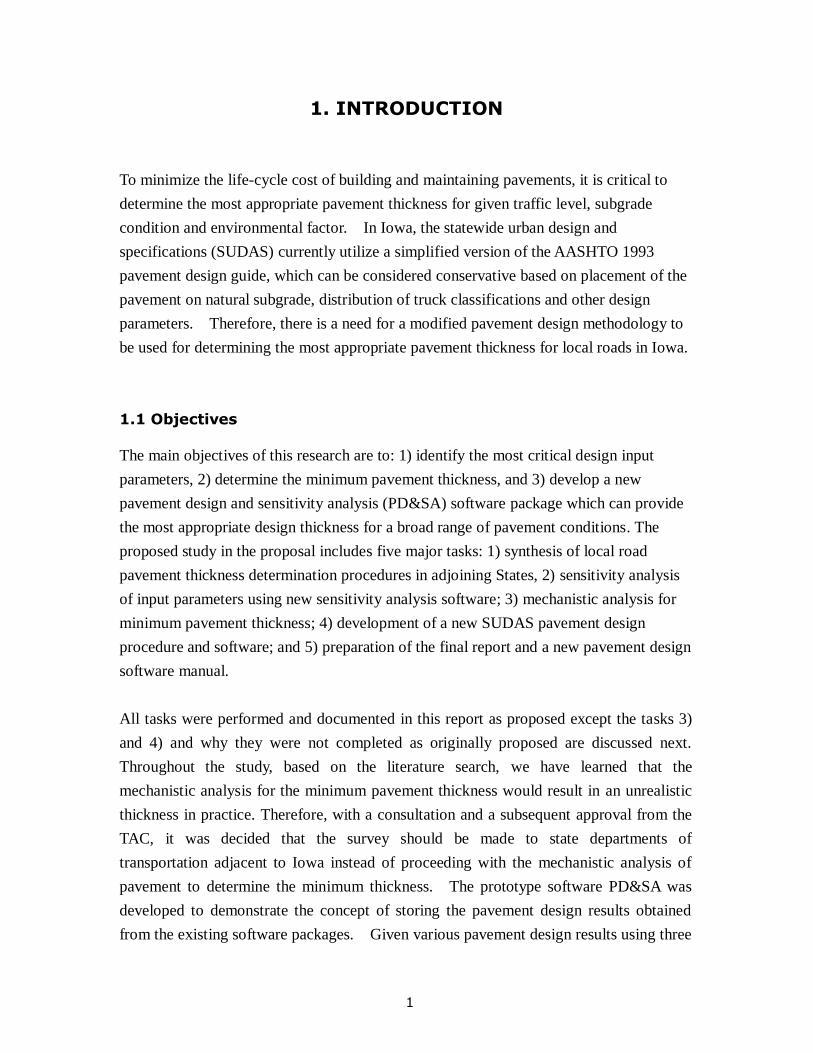
1. INTRODUCTION
To minimize the life-cycle cost of building and maintaining pavements, it is critical to
determine the most appropriate pavement thickness for given traffic level, subgrade
condition and environmental factor. In Iowa, the statewide urban design and
specifications (SUDAS) currently utilize a simplified version of the AASHTO 1993
pavement design guide, which can be considered conservative based on placement of the
pavement on natural subgrade, distribution of truck classifications and other design
parameters. Therefore, there is a need for a modified pavement design methodology to
be used for determining the most appropriate pavement thickness for local roads in Iowa.
1.1 Objectives
The main objectives of this research are to: 1) identify the most critical design input
parameters, 2) determine the minimum pavement thickness, and 3) develop a new
pavement design and sensitivity analysis (PD&SA) software package which can provide
the most appropriate design thickness for a broad range of pavement conditions. The
proposed study in the proposal includes five major tasks: 1) synthesis of local road
pavement thickness determination procedures in adjoining States, 2) sensitivity analysis
of input parameters using new sensitivity analysis software; 3) mechanistic analysis for
minimum pavement thickness; 4) development of a new SUDAS pavement design
procedure and software; and 5) preparation of the final report and a new pavement design
software manual.
All tasks were performed and documented in this report as proposed except the tasks 3)
and 4) and why they were not completed as originally proposed are discussed next.
Throughout the study, based on the literature search, we have learned that the
mechanistic analysis for the minimum pavement thickness would result in an unrealistic
thickness in practice. Therefore, with a consultation and a subsequent approval from the
TAC, it was decided that the survey should be made to state departments of
transportation adjacent to Iowa instead of proceeding with the mechanistic analysis of
pavement to determine the minimum thickness. The prototype software PD&SA was
developed to demonstrate the concept of storing the pavement design results obtained
from the existing software packages. Given various pavement design results using three
2
software packages, it was recommended that the prototype PD&SA software should be
enhanced to include pavement design results from AASHTO Darwin and Asphalt Institute
software packages. It was also recommended that the PD&SA software should be modified to
provide a single pavement thickness value which can be adopted as a standard SUDAS design
thickness for all cities and counties in Iowa. Therefore, this final report does not include the
PD&SA software which will be validated and tested during the next phase.
1.2 Benefits
The most critical input parameters were identified and their typical values for local roads
in Iowa were used to run three existing pavement design software packages. A prototype
PD&SA software package was developed to store the pavement design values in the
database so that a user can determine the optimum pavement thickness by retrieving the
pavement design values from the database without running the actual pavement design
programs. The prototype PD&SA software can be used to make comparisons from the
pavement design catalog that was developed for the database.
3
2. PAVEMENT DESIGN PROCEDURES ADOPTED BY SIX
STATE DEPARTMENT OF TRANSPORTATION ADJACENT
TO IOWA
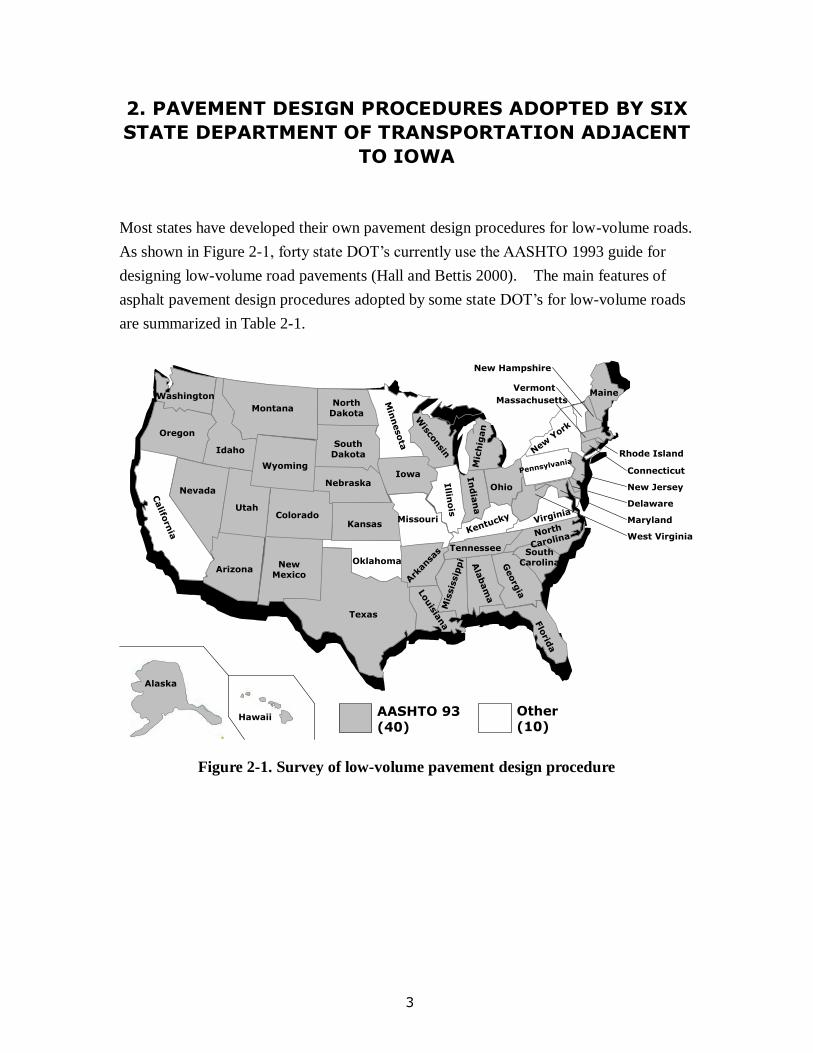
Most states have developed their own pavement design procedures for low-volume roads.
As shown in Figure 2-1, forty state DOT’s currently use the AASHTO 1993 guide for
designing low-volume road pavements (Hall and Bettis 2000). The main features of
asphalt pavement design procedures adopted by some state DOT’s for low-volume roads
are summarized in Table 2-1.
AASHTO 93 (40)
Other(10)
Ala
bam
a
Texas
Oklahoma
Louis
iana
Ark
ansa
s
KansasMissouri
Iowa
Wisco
nsin
Illin
ois
Mic
hig
an
Min
nesota
Mis
sis
sip
pi G
eorg
ia
Flo
rida
In
dia
na
Ohio
Pennsylvania
New
York
Maine
Virginia
Kentucky
North
Carolina
Tennessee South Carolina
North Dakota
South Dakota
Nebraska
New Mexico
Colorado
Washington
Oregon
Idaho
Califo
rnia
Nevada
Utah
Arizona
Alaska
Hawaii
New Hampshire
Vermont
Rhode Island
Massachusetts
Connecticut
New Jersey
Delaware
Maryland
West Virginia
Wyoming
Montana
Figure 2-1. Survey of low-volume pavement design procedure
4
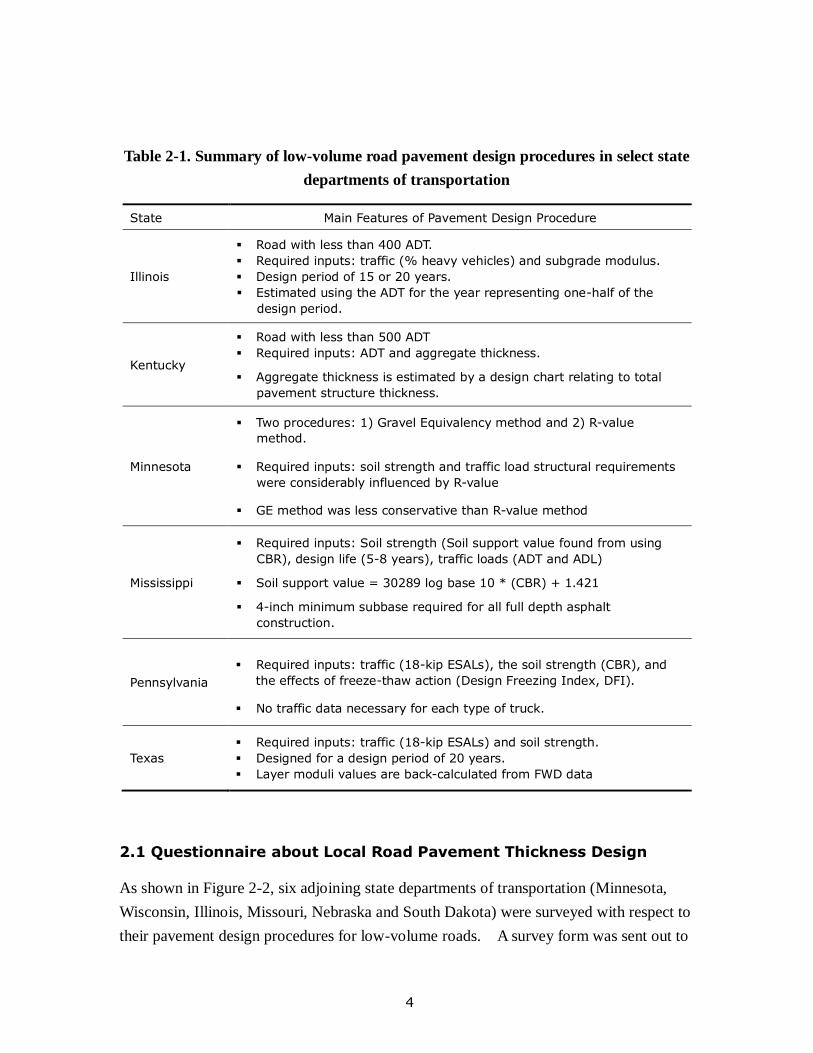
Table 2-1. Summary of low-volume road pavement design procedures in select state
departments of transportation
State Main Features of Pavement Design Procedure
Illinois
Road with less than 400 ADT.
Required inputs: traffic (% heavy vehicles) and subgrade modulus.
Design period of 15 or 20 years.
Estimated using the ADT for the year representing one-half of the
design period.
Kentucky
Road with less than 500 ADT
Required inputs: ADT and aggregate thickness.
Aggregate thickness is estimated by a design chart relating to total
pavement structure thickness.
Minnesota
Two procedures: 1) Gravel Equivalency method and 2) R-value
method.
Required inputs: soil strength and traffic load structural requirements
were considerably influenced by R-value
GE method was less conservative than R-value method
Mississippi
Required inputs: Soil strength (Soil support value found from using
CBR), design life (5-8 years), traffic loads (ADT and ADL)
Soil support value = 30289 log base 10 * (CBR) + 1.421
4-inch minimum subbase required for all full depth asphalt
construction.
Pennsylvania
Required inputs: traffic (18-kip ESALs), the soil strength (CBR), and
the effects of freeze-thaw action (Design Freezing Index, DFI).
No traffic data necessary for each type of truck.
Texas
Required inputs: traffic (18-kip ESALs) and soil strength.
Designed for a design period of 20 years.
Layer moduli values are back-calculated from FWD data
2.1 Questionnaire about Local Road Pavement Thickness Design
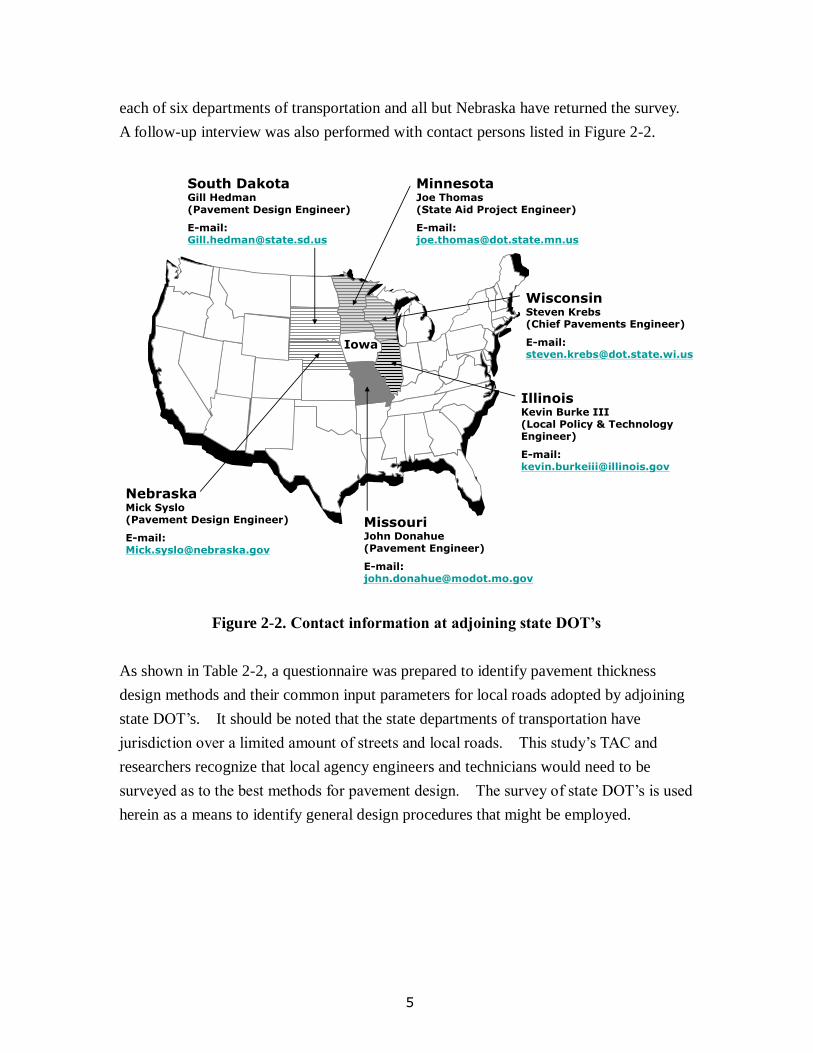
As shown in Figure 2-2, six adjoining state departments of transportation (Minnesota,
Wisconsin, Illinois, Missouri, Nebraska and South Dakota) were surveyed with respect to
their pavement design procedures for low-volume roads. A survey form was sent out to
5
each of six departments of transportation and all but Nebraska have returned the survey.
A follow-up interview was also performed with contact persons listed in Figure 2-2.
IowaIowa
South DakotaGill Hedman(Pavement Design Engineer)
E-mail: [email protected]
NebraskaMick Syslo(Pavement Design Engineer)
E-mail: [email protected]
MissouriJohn Donahue (Pavement Engineer)
E-mail: [email protected]
MinnesotaJoe Thomas(State Aid Project Engineer)
E-mail: [email protected]
WisconsinSteven Krebs (Chief Pavements Engineer)
E-mail: [email protected]
IllinoisKevin Burke III (Local Policy & Technology Engineer)
E-mail: [email protected]
Figure 2-2. Contact information at adjoining state DOT’s
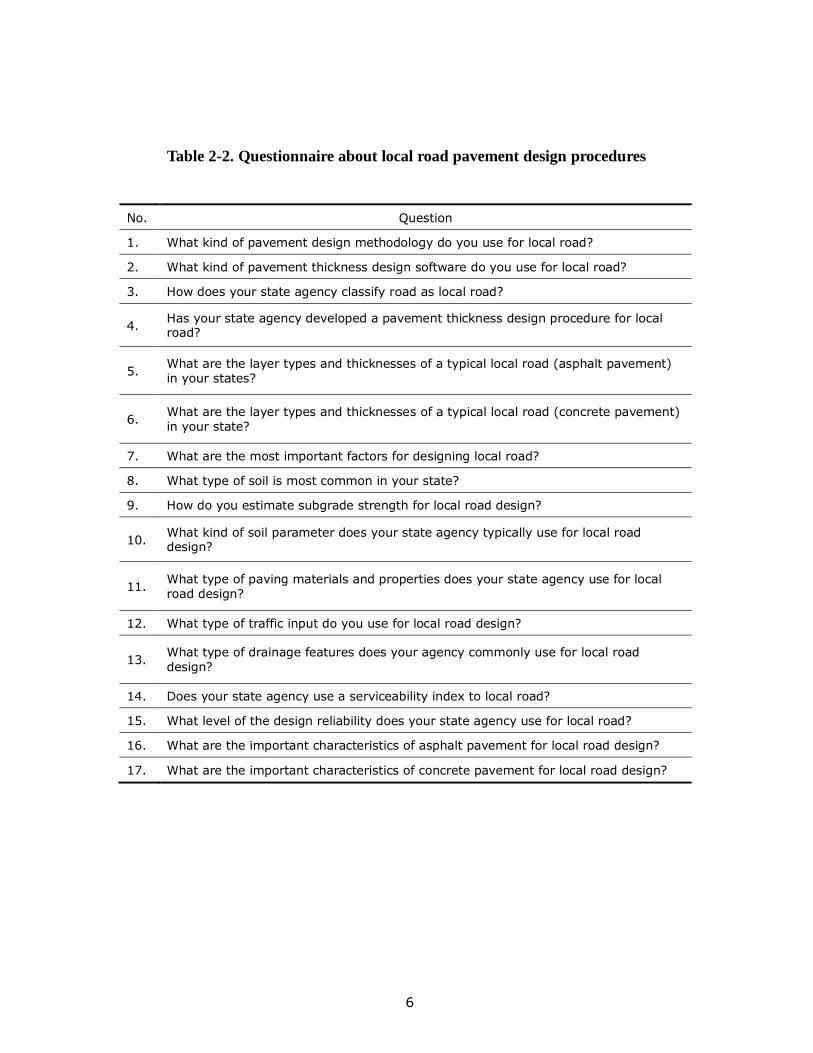
As shown in Table 2-2, a questionnaire was prepared to identify pavement thickness
design methods and their common input parameters for local roads adopted by adjoining
state DOT’s. It should be noted that the state departments of transportation have
jurisdiction over a limited amount of streets and local roads. This study’s TAC and
researchers recognize that local agency engineers and technicians would need to be
surveyed as to the best methods for pavement design. The survey of state DOT’s is used
herein as a means to identify general design procedures that might be employed.
6
Table 2-2. Questionnaire about local road pavement design procedures
No. Question
1. What kind of pavement design methodology do you use for local road?
2. What kind of pavement thickness design software do you use for local road?
3. How does your state agency classify road as local road?
4. Has your state agency developed a pavement thickness design procedure for local road?
5. What are the layer types and thicknesses of a typical local road (asphalt pavement) in your states?
6. What are the layer types and thicknesses of a typical local road (concrete pavement) in your state?
7. What are the most important factors for designing local road?
8. What type of soil is most common in your state?
9. How do you estimate subgrade strength for local road design?
10. What kind of soil parameter does your state agency typically use for local road design?
11. What type of paving materials and properties does your state agency use for local road design?
12. What type of traffic input do you use for local road design?
13. What type of drainage features does your agency commonly use for local road design?
14. Does your state agency use a serviceability index to local road?
15. What level of the design reliability does your state agency use for local road?
16. What are the important characteristics of asphalt pavement for local road design?
17. What are the important characteristics of concrete pavement for local road design?

7
2.2 Survey Results
Five state departments of transportation adjacent to Iowa (Nebraska was the only
exclusion) returned the survey. Survey results are summarized for each question below.
Question 1: What kind of pavement design methodology do you use for local road?
Answer:
Illinois DOT: Other (mechanistic empirical design developed by U of I and IL DOT)
Missouri DOT: AASHTO
Minnesota DOT: Other (charts and tables for soil factor and R-value)
South Dakota DOT: AASHTO
Wisconsin DOT: Other (WisPave based on AASHTO 72)
Question 2: What kind of pavement design software do you use for local road?
Answer:
Illinois DOT: None
Missouri DOT: Mechanistic-empirical pavement design guide
Minnesota DOT: http://www.dot.state.mn.us/materials/pvmtdesign/software.html
South Dakota DOT: 1993 AASHTO design guide and the DARWIN software
Wisconsin DOT: Other (WisPave based on AASHTO 72)
Question 3: How does your state agency classify road as local road?
Answer:
Illinois DOT: less than 400 ADT and less than 0.25 traffic factor
Missouri DOT: less than 1000 AADT and less than a 100 trucks a day
Minnesota DOT: less than 1000 ADT
South Dakota DOT: None
Wisconsin DOT: less than 400 AADT
Question 4: Has your agency developed a pavement design procedure for local
road?
Answer:
Illinois DOT: Yes (http://www.dot.il.gov/blr/manuals/Chapter%2037.pdf)
Missouri DOT: No
Minnesota DOT: Yes
8
(http://www.dot.state.mn.us/materials/pvmtdesign/docs/RValueChart.pdf)
South Dakota DOT: No
Wisconsin DOT: No
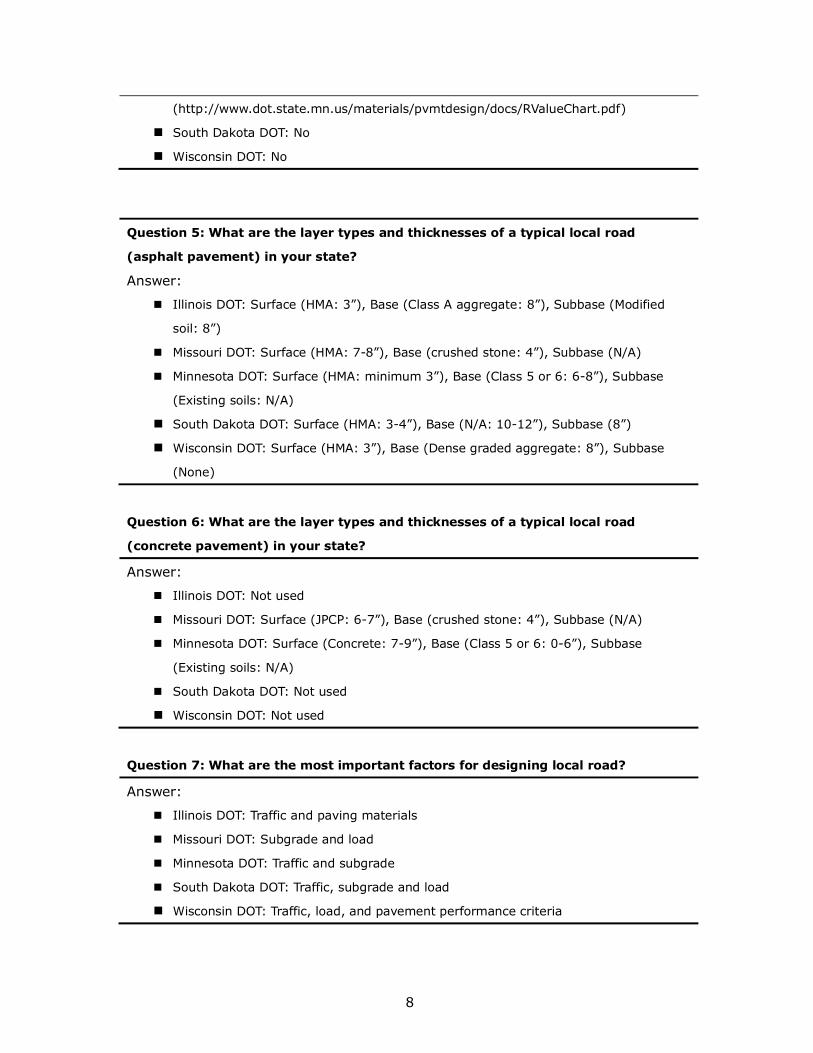
Question 5: What are the layer types and thicknesses of a typical local road
(asphalt pavement) in your state?
Answer:
Illinois DOT: Surface (HMA: 3”), Base (Class A aggregate: 8”), Subbase (Modified
soil: 8”)
Missouri DOT: Surface (HMA: 7-8”), Base (crushed stone: 4”), Subbase (N/A)
Minnesota DOT: Surface (HMA: minimum 3”), Base (Class 5 or 6: 6-8”), Subbase
(Existing soils: N/A)
South Dakota DOT: Surface (HMA: 3-4”), Base (N/A: 10-12”), Subbase (8”)
Wisconsin DOT: Surface (HMA: 3”), Base (Dense graded aggregate: 8”), Subbase
(None)
Question 6: What are the layer types and thicknesses of a typical local road
(concrete pavement) in your state?
Answer:
Illinois DOT: Not used
Missouri DOT: Surface (JPCP: 6-7”), Base (crushed stone: 4”), Subbase (N/A)
Minnesota DOT: Surface (Concrete: 7-9”), Base (Class 5 or 6: 0-6”), Subbase
(Existing soils: N/A)
South Dakota DOT: Not used
Wisconsin DOT: Not used
Question 7: What are the most important factors for designing local road?
Answer:
Illinois DOT: Traffic and paving materials
Missouri DOT: Subgrade and load
Minnesota DOT: Traffic and subgrade
South Dakota DOT: Traffic, subgrade and load
Wisconsin DOT: Traffic, load, and pavement performance criteria
9
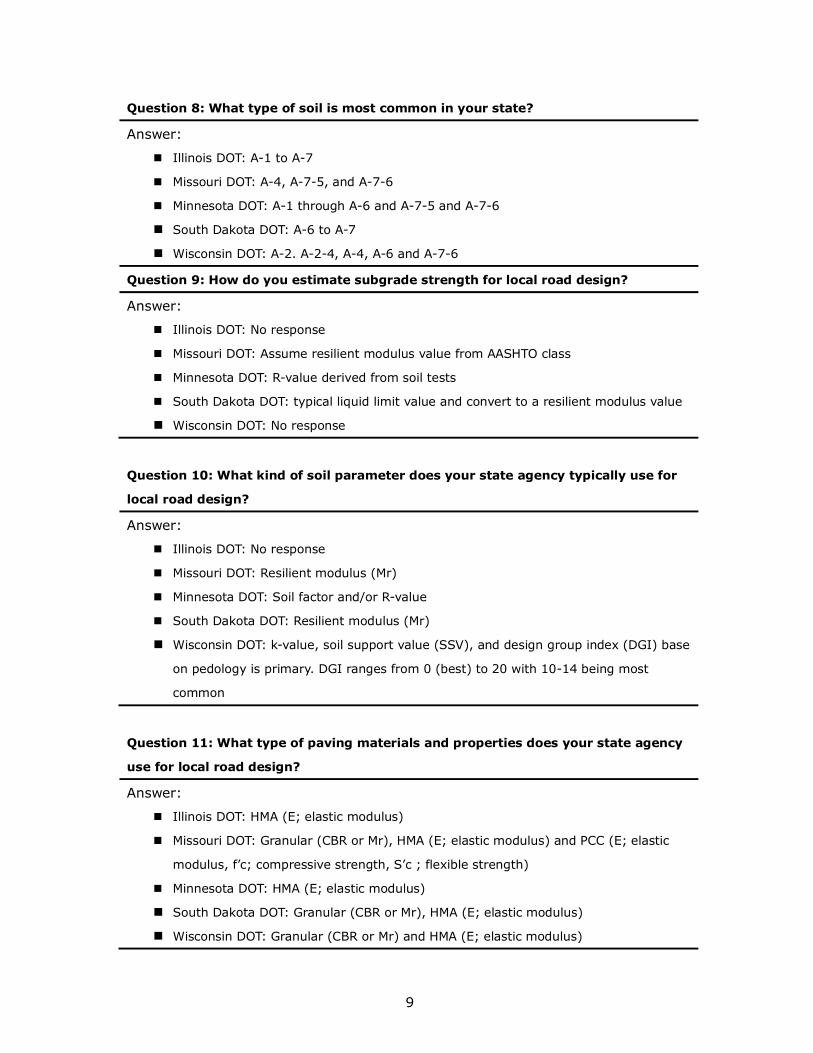
Question 8: What type of soil is most common in your state?
Answer:
Illinois DOT: A-1 to A-7
Missouri DOT: A-4, A-7-5, and A-7-6
Minnesota DOT: A-1 through A-6 and A-7-5 and A-7-6
South Dakota DOT: A-6 to A-7
Wisconsin DOT: A-2. A-2-4, A-4, A-6 and A-7-6
Question 9: How do you estimate subgrade strength for local road design?
Answer:
Illinois DOT: No response
Missouri DOT: Assume resilient modulus value from AASHTO class
Minnesota DOT: R-value derived from soil tests
South Dakota DOT: typical liquid limit value and convert to a resilient modulus value
Wisconsin DOT: No response
Question 10: What kind of soil parameter does your state agency typically use for
local road design?
Answer:
Illinois DOT: No response
Missouri DOT: Resilient modulus (Mr)
Minnesota DOT: Soil factor and/or R-value
South Dakota DOT: Resilient modulus (Mr)
Wisconsin DOT: k-value, soil support value (SSV), and design group index (DGI) base
on pedology is primary. DGI ranges from 0 (best) to 20 with 10-14 being most
common
Question 11: What type of paving materials and properties does your state agency
use for local road design?
Answer:
Illinois DOT: HMA (E; elastic modulus)
Missouri DOT: Granular (CBR or Mr), HMA (E; elastic modulus) and PCC (E; elastic
modulus, f‟c; compressive strength, S‟c ; flexible strength)
Minnesota DOT: HMA (E; elastic modulus)
South Dakota DOT: Granular (CBR or Mr), HMA (E; elastic modulus)
Wisconsin DOT: Granular (CBR or Mr) and HMA (E; elastic modulus)
10
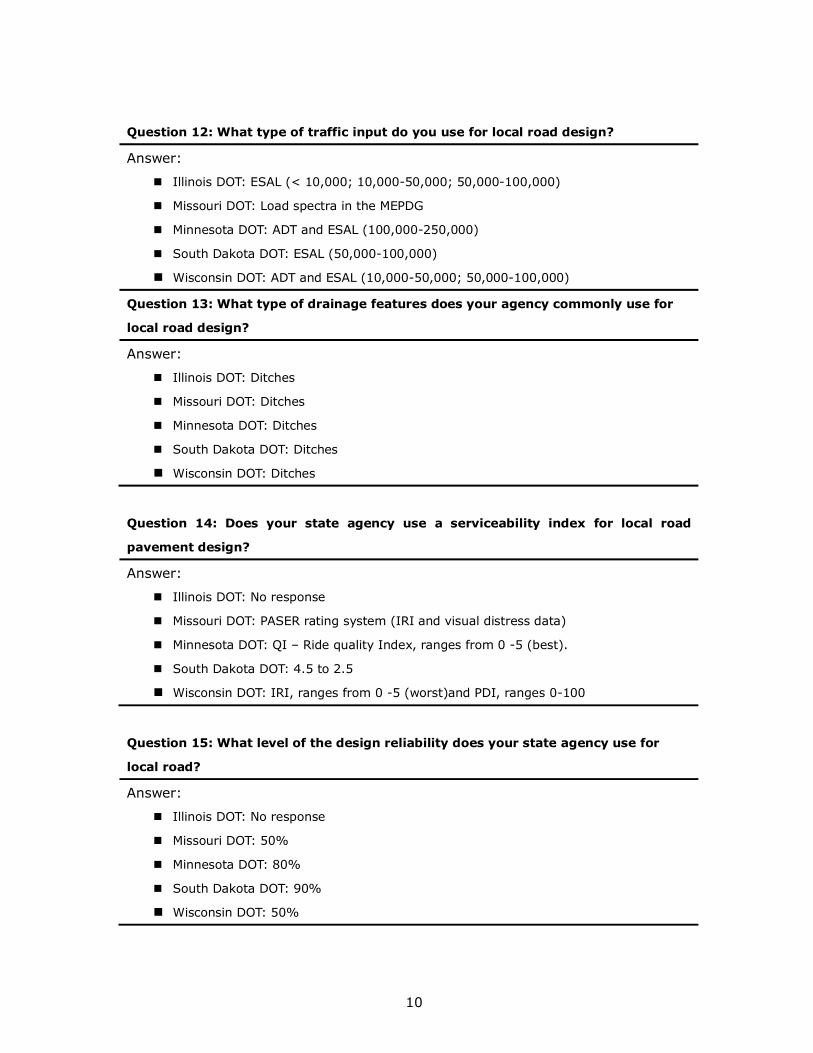
Question 12: What type of traffic input do you use for local road design?
Answer:
Illinois DOT: ESAL (< 10,000; 10,000-50,000; 50,000-100,000)
Missouri DOT: Load spectra in the MEPDG
Minnesota DOT: ADT and ESAL (100,000-250,000)
South Dakota DOT: ESAL (50,000-100,000)
Wisconsin DOT: ADT and ESAL (10,000-50,000; 50,000-100,000)
Question 13: What type of drainage features does your agency commonly use for
local road design?
Answer:
Illinois DOT: Ditches
Missouri DOT: Ditches
Minnesota DOT: Ditches
South Dakota DOT: Ditches
Wisconsin DOT: Ditches
Question 14: Does your state agency use a serviceability index for local road
pavement design?
Answer:
Illinois DOT: No response
Missouri DOT: PASER rating system (IRI and visual distress data)
Minnesota DOT: QI – Ride quality Index, ranges from 0 -5 (best).
South Dakota DOT: 4.5 to 2.5
Wisconsin DOT: IRI, ranges from 0 -5 (worst)and PDI, ranges 0-100
Question 15: What level of the design reliability does your state agency use for
local road?
Answer:
Illinois DOT: No response
Missouri DOT: 50%
Minnesota DOT: 80%
South Dakota DOT: 90%
Wisconsin DOT: 50%
11
Question 16: What are the important characteristics of asphalt pavement for local
road design?
Answer:
Illinois DOT: No response
Missouri DOT: Adequate structure and proper compaction of lower layers
Minnesota DOT: Subgrade and ADT/HCADT
South Dakota DOT: No response
Wisconsin DOT: thickness, PG grade, gradation, asphalt content
Question 17: What are the important characteristics of concrete pavement for local
road design?
Answer:
Illinois DOT: No response
Missouri DOT: Short joint spacing and proper compaction of lower layer
Minnesota DOT: Subgrade and ADT/HCADT
South Dakota DOT: traffic, subgrade, and loads
Wisconsin DOT: N/A
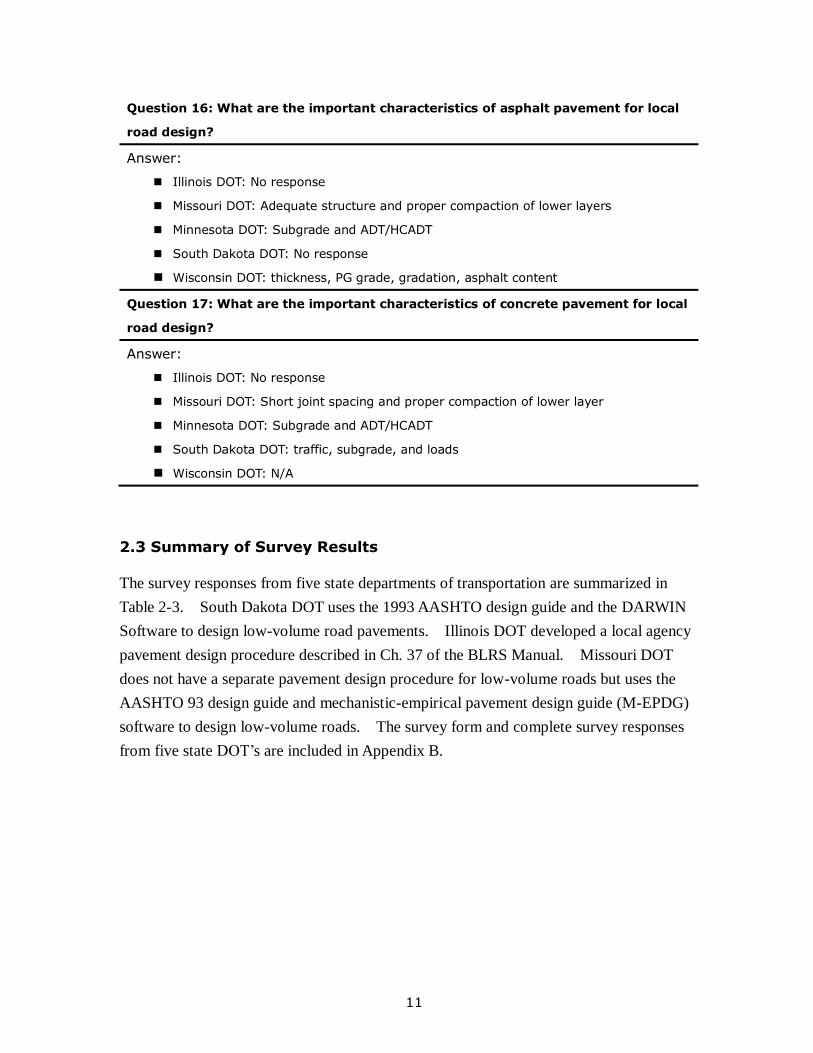
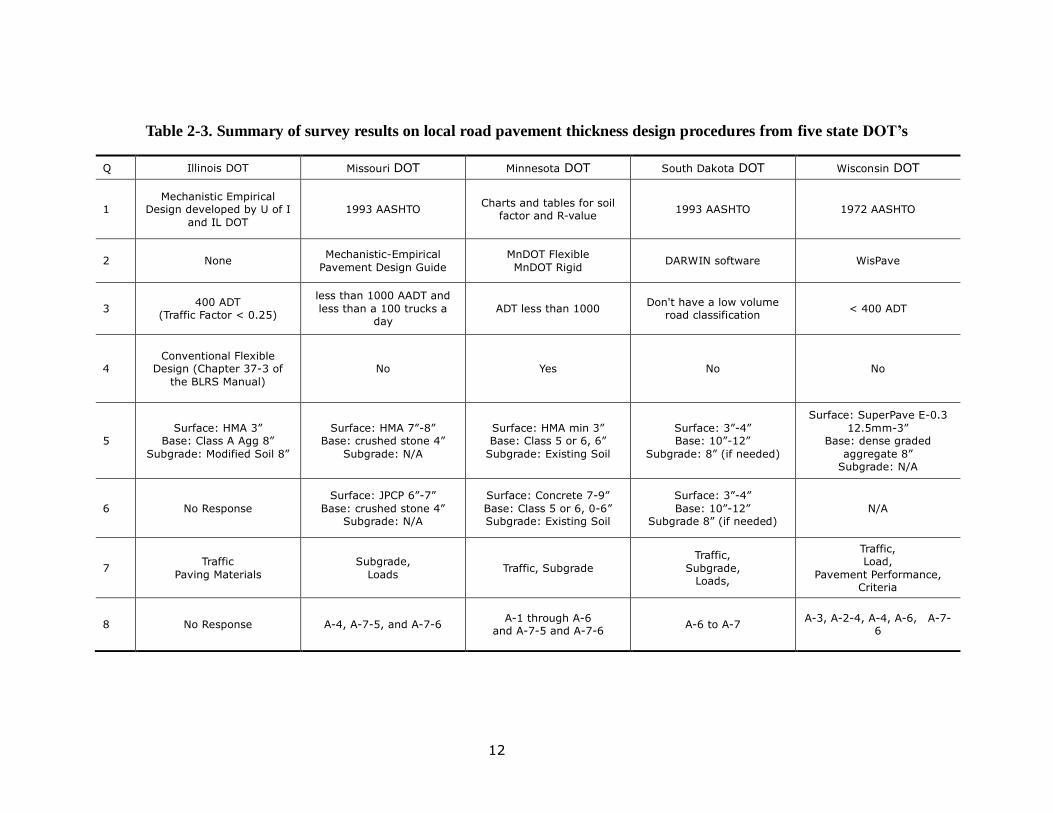
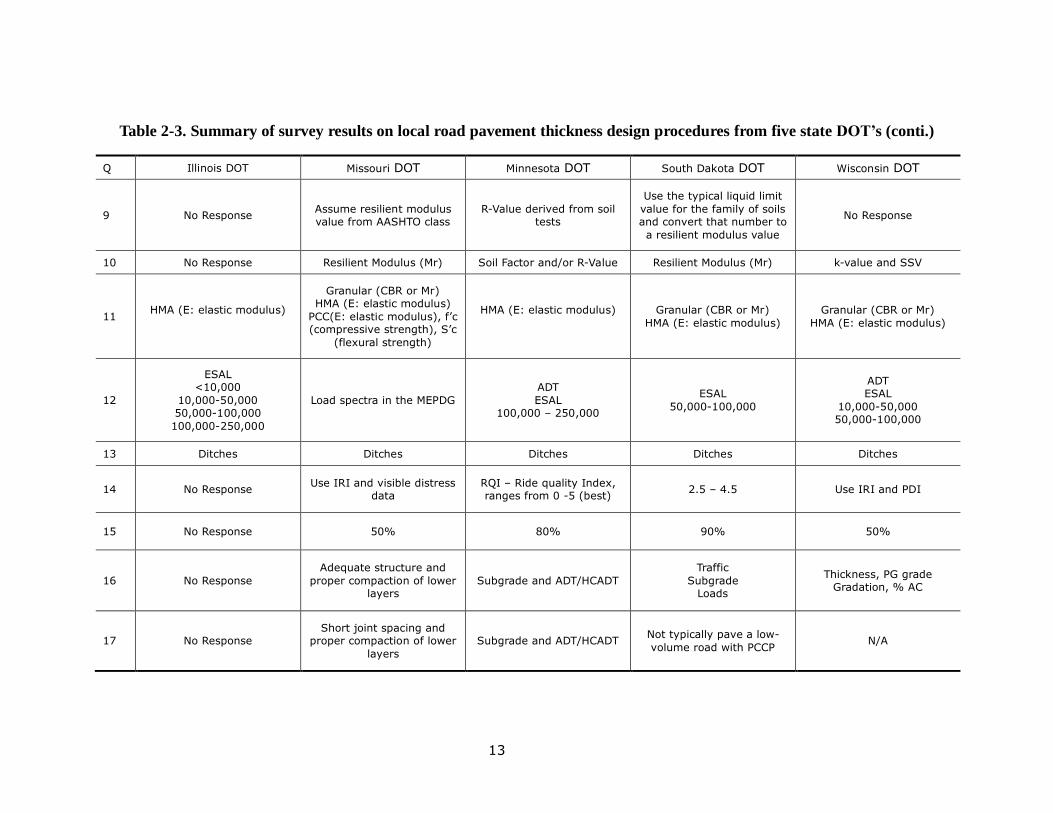
2.3 Summary of Survey Results
The survey responses from five state departments of transportation are summarized in
Table 2-3. South Dakota DOT uses the 1993 AASHTO design guide and the DARWIN
Software to design low-volume road pavements. Illinois DOT developed a local agency
pavement design procedure described in Ch. 37 of the BLRS Manual. Missouri DOT
does not have a separate pavement design procedure for low-volume roads but uses the
AASHTO 93 design guide and mechanistic-empirical pavement design guide (M-EPDG)
software to design low-volume roads. The survey form and complete survey responses
from five state DOT’s are included in Appendix B.
12
Table 2-3. Summary of survey results on local road pavement thickness design procedures from five state DOT’s
Q Illinois DOT Missouri DOT Minnesota DOT South Dakota DOT Wisconsin DOT
1 Mechanistic Empirical
Design developed by U of I
and IL DOT
1993 AASHTO Charts and tables for soil
factor and R-value 1993 AASHTO 1972 AASHTO
2 None Mechanistic-Empirical
Pavement Design Guide
MnDOT Flexible
MnDOT Rigid DARWIN software WisPave
3 400 ADT
(Traffic Factor < 0.25)
less than 1000 AADT and
less than a 100 trucks a day
ADT less than 1000 Don't have a low volume
road classification < 400 ADT
4 Conventional Flexible
Design (Chapter 37-3 of
the BLRS Manual)
No Yes No No
5 Surface: HMA 3”
Base: Class A Agg 8”
Subgrade: Modified Soil 8”
Surface: HMA 7”-8” Base: crushed stone 4”
Subgrade: N/A
Surface: HMA min 3” Base: Class 5 or 6, 6”
Subgrade: Existing Soil
Surface: 3”-4” Base: 10”-12”
Subgrade: 8” (if needed)
Surface: SuperPave E-0.3
12.5mm-3” Base: dense graded
aggregate 8” Subgrade: N/A
6 No Response
Surface: JPCP 6”-7”
Base: crushed stone 4” Subgrade: N/A
Surface: Concrete 7-9”
Base: Class 5 or 6, 0-6” Subgrade: Existing Soil
Surface: 3”-4”
Base: 10”-12” Subgrade 8” (if needed)
N/A
7 Traffic
Paving Materials
Subgrade,
Loads Traffic, Subgrade
Traffic,
Subgrade, Loads,
Traffic, Load,
Pavement Performance, Criteria
8 No Response A-4, A-7-5, and A-7-6
A-1 through A-6 and A-7-5 and A-7-6
A-6 to A-7 A-3, A-2-4, A-4, A-6, A-7-
6
13
Table 2-3. Summary of survey results on local road pavement thickness design procedures from five state DOT’s (conti.)
Q Illinois DOT Missouri DOT Minnesota DOT South Dakota DOT Wisconsin DOT
9 No Response Assume resilient modulus value from AASHTO class
R-Value derived from soil tests
Use the typical liquid limit
value for the family of soils and convert that number to
a resilient modulus value
No Response
10 No Response Resilient Modulus (Mr) Soil Factor and/or R-Value Resilient Modulus (Mr) k-value and SSV
11 HMA (E: elastic modulus)
Granular (CBR or Mr) HMA (E: elastic modulus)
PCC(E: elastic modulus), f‟c (compressive strength), S‟c
(flexural strength)
HMA (E: elastic modulus)
Granular (CBR or Mr)
HMA (E: elastic modulus)
Granular (CBR or Mr)
HMA (E: elastic modulus)
12
ESAL <10,000
10,000-50,000 50,000-100,000
100,000-250,000
Load spectra in the MEPDG
ADT
ESAL 100,000 – 250,000
ESAL
50,000-100,000
ADT ESAL
10,000-50,000 50,000-100,000
13 Ditches Ditches Ditches Ditches Ditches
14 No Response Use IRI and visible distress
data RQI – Ride quality Index, ranges from 0 -5 (best)
2.5 – 4.5 Use IRI and PDI
15 No Response 50% 80% 90% 50%
16 No Response
Adequate structure and
proper compaction of lower layers
Subgrade and ADT/HCADT
Traffic
Subgrade Loads
Thickness, PG grade Gradation, % AC
17 No Response Short joint spacing and
proper compaction of lower
layers
Subgrade and ADT/HCADT Not typically pave a low-
volume road with PCCP N/A
14
3. PAVEMENT THICKNESS DESIGN SOFTWARE
PACKAGES USED IN IOWA
To minimize the life-cycle cost of maintaining pavements, it is critical to determine the
most appropriate pavement thickness for a given traffic level, subgrade condition and
environmental factor. There are several pavement software packages available which
would give different pavement thicknesses for the similar soil and traffic conditions. In
addition, the impacts of design parameters on the pavement thickness are not transparent
to a user. Therefore, there is a critical need for comparing these software packages and
identifying the critical design input parameters through the sensitivity analysis.
In the past, Bergeson and Barber (1998) developed a pavement design method for low-
volume roads in Iowa by utilizing the reclaimed hydrated Class C fly ash as an aggregate
for base and Sharma et al. (2005) developed a guide to improve the quality of subgrade
and subbase. The following three pavement design software packages were evaluated
on how they are different in determining design input parameters and their influences on
the pavement thickness: 1) StreetPave software based on the ACPA thickness design for
concrete highway and street pavements and PCA method (PCA 1984; ACPA 2006), 2)
WinPAS software based on ASSHTO 1993 pavement design guide (ACPA 2006), and 3)
APAI software based on pre-mechanistic/empirical AASHTO methodology (APAI 1990).
3.1 StreetPave Software
StreetPave is a concrete pavement thickness design software package tailored for local
road pavements (PCA 1984; ACPA 2006). This software package generates the
optimum concrete pavement thickness for city, municipal, county, and state roadways.
ACPA claims that it incorporates an asphalt pavement design process based on the
Asphalt Institute method and creates an equivalent asphalt design for the given load
carrying capacity requirement. A life cycle cost analysis module allows a user to perform
a detailed cost/benefits analysis. The input values include project information, traffic
information, pavement design parameters and pavement maintenance schedule. As
shown in Figure 3-1, the StreetPave software displays the optimum concrete thickness,
the equivalent asphalt thickness and the life cycle cost analysis. It also provides the
sensitivity analysis module with regards to k-value, concrete strength, design life,
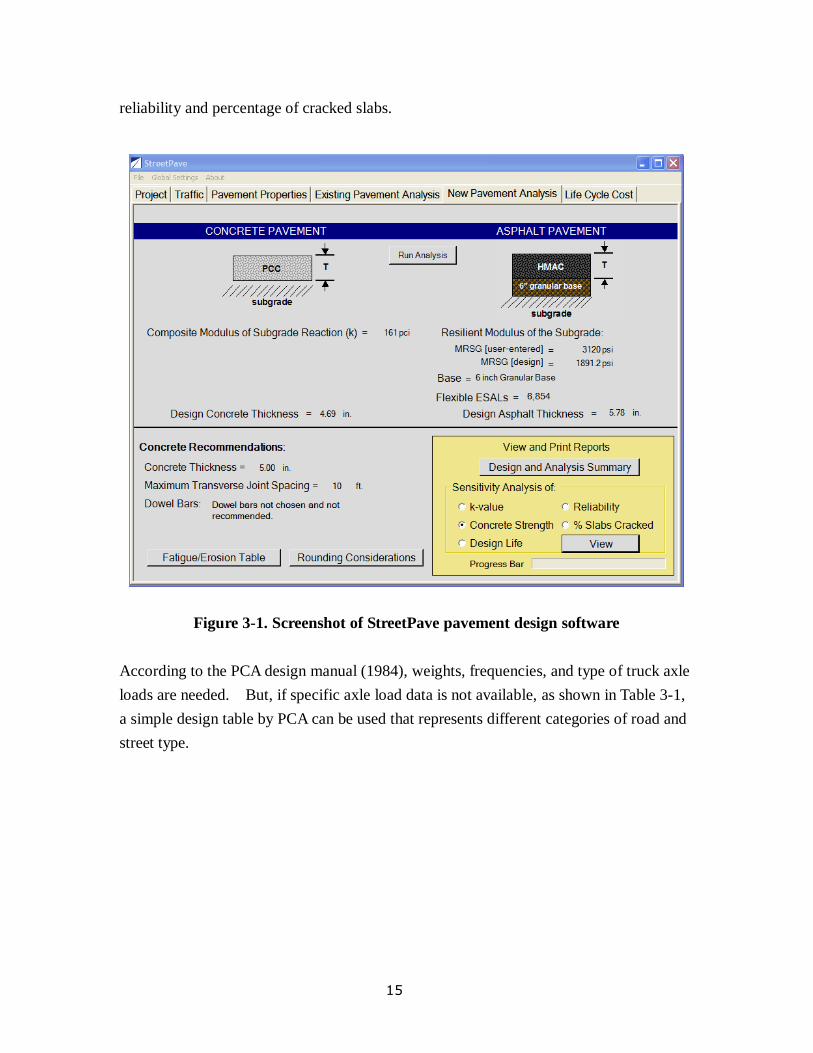
15
reliability and percentage of cracked slabs.
Figure 3-1. Screenshot of StreetPave pavement design software
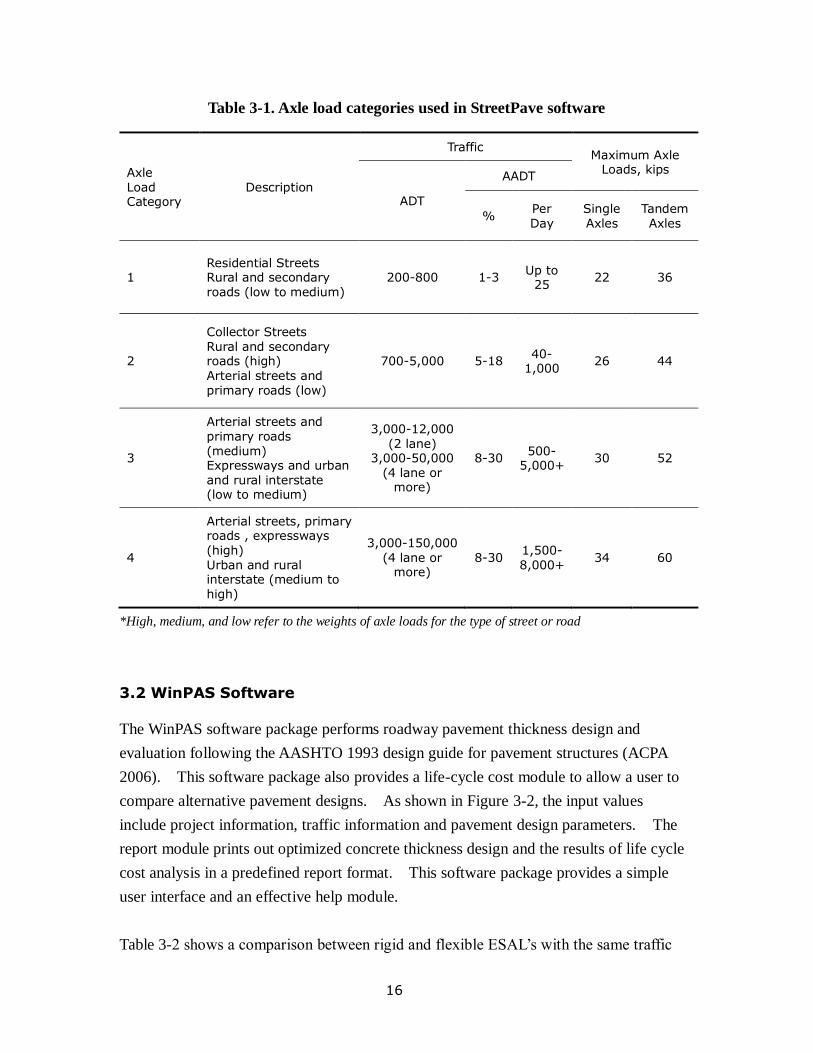
According to the PCA design manual (1984), weights, frequencies, and type of truck axle
loads are needed. But, if specific axle load data is not available, as shown in Table 3-1,
a simple design table by PCA can be used that represents different categories of road and
street type.
16
Table 3-1. Axle load categories used in StreetPave software
Axle Load Category
Description
Traffic Maximum Axle
Loads, kips
ADT
AADT
% Per Day
Single Axles
Tandem Axles
1 Residential Streets Rural and secondary roads (low to medium)
200-800 1-3 Up to
25 22 36
2
Collector Streets Rural and secondary roads (high) Arterial streets and primary roads (low)
700-5,000 5-18 40-
1,000 26 44
3
Arterial streets and primary roads (medium) Expressways and urban and rural interstate (low to medium)
3,000-12,000 (2 lane)
3,000-50,000 (4 lane or
more)
8-30 500-
5,000+ 30 52
4
Arterial streets, primary roads , expressways (high) Urban and rural interstate (medium to high)
3,000-150,000 (4 lane or
more) 8-30
1,500-8,000+
34 60
*High, medium, and low refer to the weights of axle loads for the type of street or road
3.2 WinPAS Software
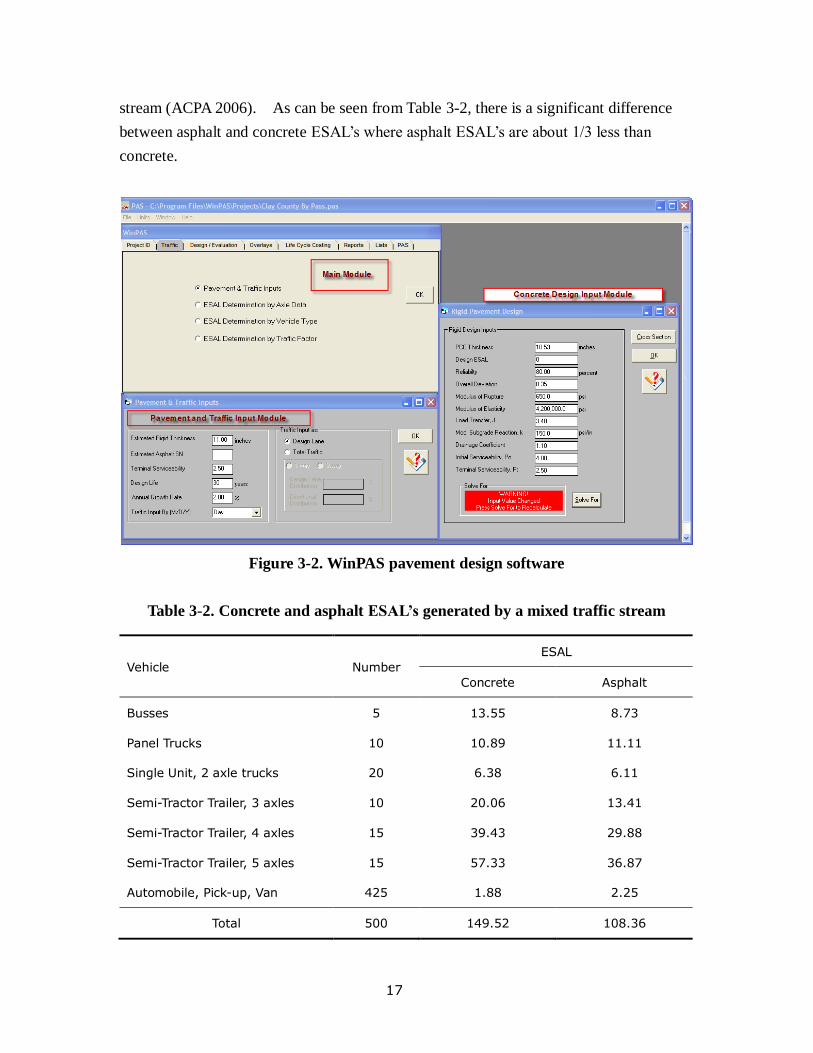
The WinPAS software package performs roadway pavement thickness design and
evaluation following the AASHTO 1993 design guide for pavement structures (ACPA
2006). This software package also provides a life-cycle cost module to allow a user to
compare alternative pavement designs. As shown in Figure 3-2, the input values
include project information, traffic information and pavement design parameters. The
report module prints out optimized concrete thickness design and the results of life cycle
cost analysis in a predefined report format. This software package provides a simple
user interface and an effective help module.
Table 3-2 shows a comparison between rigid and flexible ESAL’s with the same traffic
17
stream (ACPA 2006). As can be seen from Table 3-2, there is a significant difference
between asphalt and concrete ESAL’s where asphalt ESAL’s are about 1/3 less than
concrete.
Figure 3-2. WinPAS pavement design software
Table 3-2. Concrete and asphalt ESAL’s generated by a mixed traffic stream
Vehicle Number
ESAL
Concrete Asphalt
Busses 5 13.55 8.73
Panel Trucks 10 10.89 11.11
Single Unit, 2 axle trucks 20 6.38 6.11
Semi-Tractor Trailer, 3 axles 10 20.06 13.41
Semi-Tractor Trailer, 4 axles 15 39.43 29.88
Semi-Tractor Trailer, 5 axles 15 57.33 36.87
Automobile, Pick-up, Van 425 1.88 2.25
Total 500 149.52 108.36
18
3.3 APAI Software
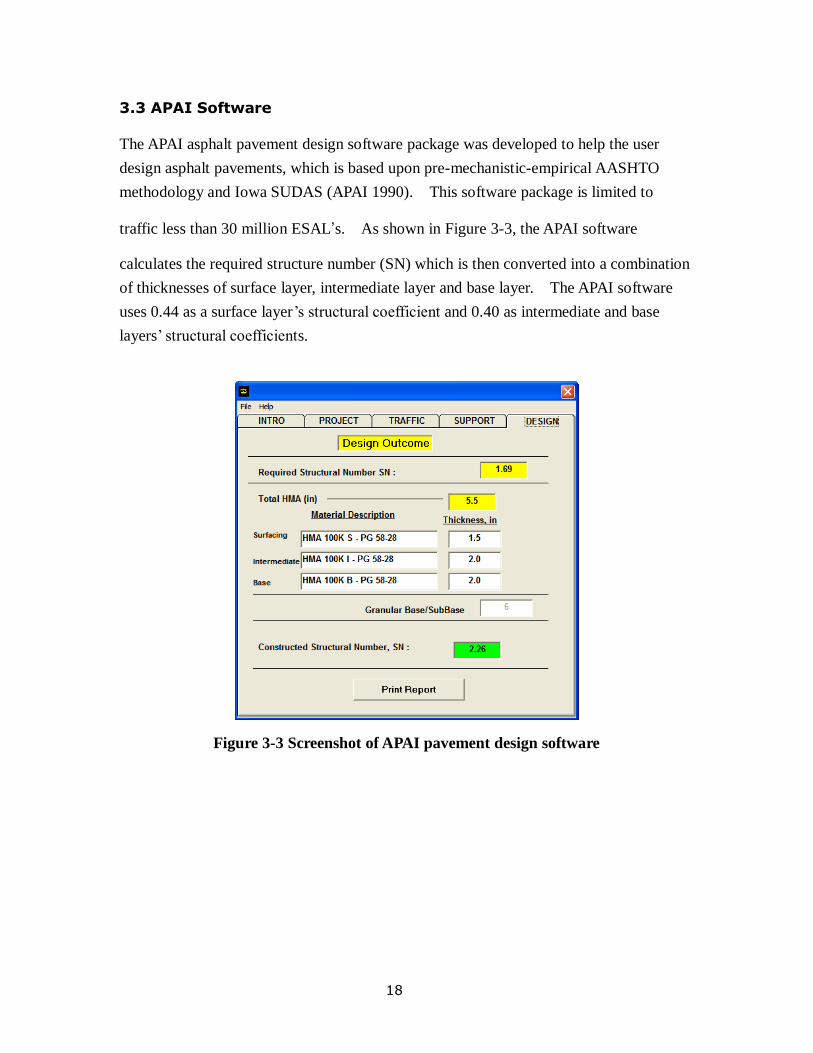
The APAI asphalt pavement design software package was developed to help the user
design asphalt pavements, which is based upon pre-mechanistic-empirical AASHTO
methodology and Iowa SUDAS (APAI 1990). This software package is limited to
traffic less than 30 million ESAL’s. As shown in Figure 3-3, the APAI software
calculates the required structure number (SN) which is then converted into a combination
of thicknesses of surface layer, intermediate layer and base layer. The APAI software
uses 0.44 as a surface layer’s structural coefficient and 0.40 as intermediate and base
layers’ structural coefficients.
Figure 3-3 Screenshot of APAI pavement design software
19
APAI software estimates ESALs based on two cases: 1) generic traffic distributions for
each category (rural-residential, urban-collector, etc.) and starting year ADT and growth
rate, or 2) a user input on truck distribution and truck factor data and starting year ADT
and growth rate. From these inputs and the reliability factor, the ESALs are estimated.
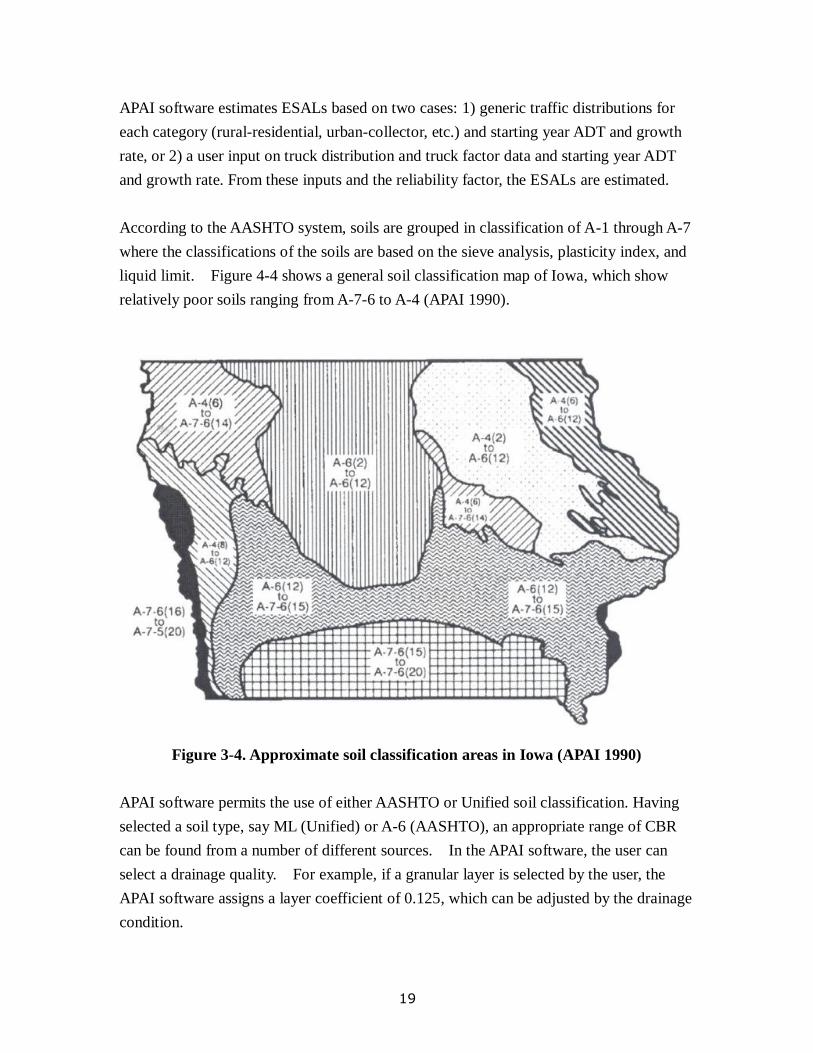
According to the AASHTO system, soils are grouped in classification of A-1 through A-7
where the classifications of the soils are based on the sieve analysis, plasticity index, and
liquid limit. Figure 4-4 shows a general soil classification map of Iowa, which show
relatively poor soils ranging from A-7-6 to A-4 (APAI 1990).
Figure 3-4. Approximate soil classification areas in Iowa (APAI 1990)
APAI software permits the use of either AASHTO or Unified soil classification. Having
selected a soil type, say ML (Unified) or A-6 (AASHTO), an appropriate range of CBR
can be found from a number of different sources. In the APAI software, the user can
select a drainage quality. For example, if a granular layer is selected by the user, the
APAI software assigns a layer coefficient of 0.125, which can be adjusted by the drainage
condition.

20
The AASHTO flexible pavement design method does not use CBR, but uses resilient
modulus. Therefore, to estimate resilient modulus, the APAI software computes the lesser
of 1) Mr = 1500 x CBR and 2) 1941.488*CBR0.06844709
. The reliability used in the
AASHTO method is applied to the logarithm of the ESAL’s and the APAI requires 80%
as a minimum reliability.
21
4. SENSITIVITY ANALYSIS OF DESIGN INPUT
PARAMETERS USING THREE PAVEMENT DESIGN
SOFTWARE PACKAGES
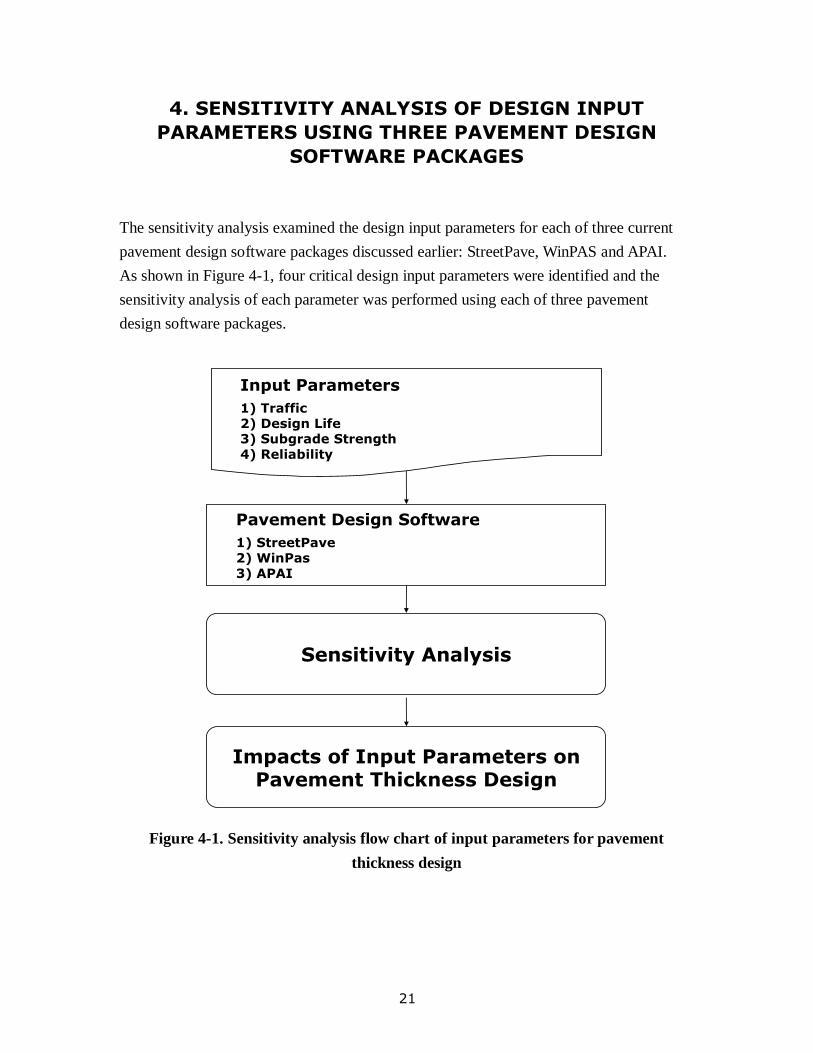
The sensitivity analysis examined the design input parameters for each of three current
pavement design software packages discussed earlier: StreetPave, WinPAS and APAI.
As shown in Figure 4-1, four critical design input parameters were identified and the
sensitivity analysis of each parameter was performed using each of three pavement
design software packages.
Pavement Design Software
1) StreetPave2) WinPas3) APAI
Impacts of Input Parameters onPavement Thickness Design
Input Parameters
1) Traffic2) Design Life3) Subgrade Strength4) Reliability
Sensitivity Analysis
Figure 4-1. Sensitivity analysis flow chart of input parameters for pavement
thickness design
22
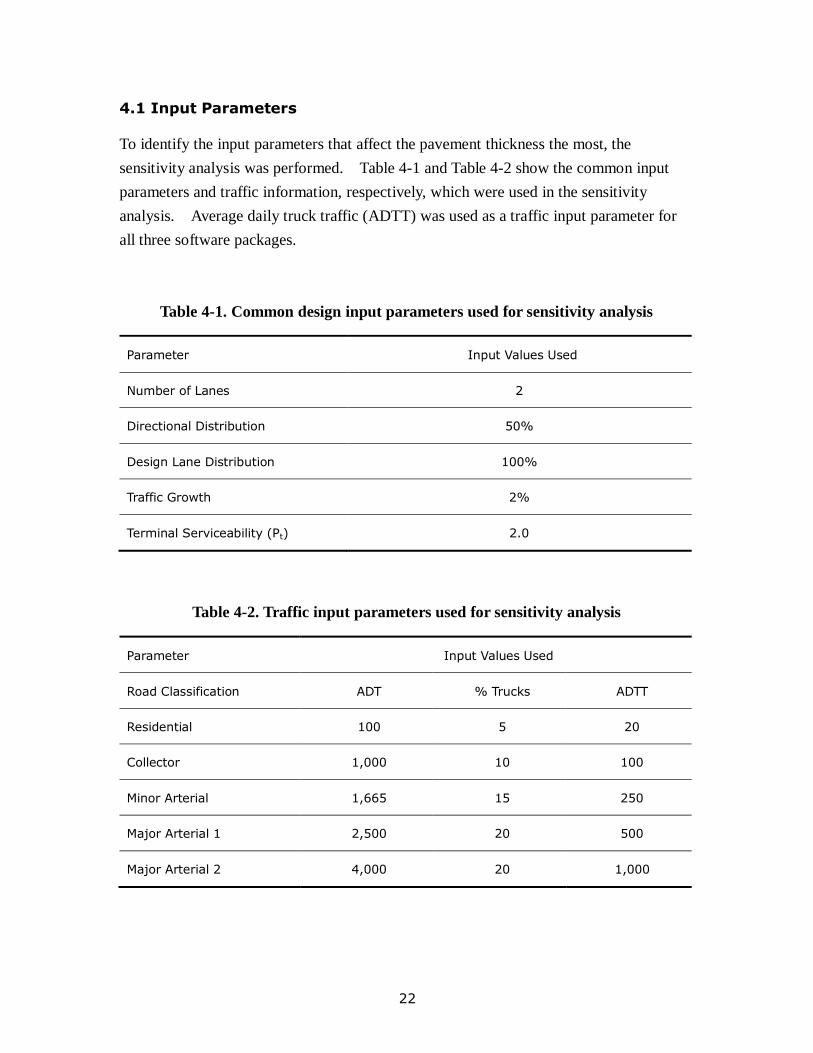
4.1 Input Parameters
To identify the input parameters that affect the pavement thickness the most, the
sensitivity analysis was performed. Table 4-1 and Table 4-2 show the common input
parameters and traffic information, respectively, which were used in the sensitivity
analysis. Average daily truck traffic (ADTT) was used as a traffic input parameter for
all three software packages.
Table 4-1. Common design input parameters used for sensitivity analysis
Parameter Input Values Used
Number of Lanes 2
Directional Distribution 50%
Design Lane Distribution 100%
Traffic Growth 2%
Terminal Serviceability (Pt) 2.0
Table 4-2. Traffic input parameters used for sensitivity analysis
Parameter Input Values Used
Road Classification ADT % Trucks ADTT
Residential 100 5 20
Collector 1,000 10 100
Minor Arterial 1,665 15 250
Major Arterial 1 2,500 20 500
Major Arterial 2 4,000 20 1,000
23
The reliability is used in the AASHTO design equation in the form of ZR S0 where ZR
represents the normal deviate for a given reliability and S0 is the standard deviation in the
design equation. The standard deviation is the amount of statistical error present in the
pavement design equation which represents the amount of scatter between predicted
performance and actual performance and different values are often used for asphalt
(typically 0.45) and concrete pavements (typically 0.35). Both WinPAS and APAI
software packages use this reliability concept. However, StreetPave software applies
the reliability to the flexural fatigue equation for concrete pavements and to the resilient
modulus of the subgrade for asphalt pavements. All three pavement design software
packages were run using two design lives of 20 and 40 years and three levels of reliability
of 50%, 80%, and 90%. However, the APAI pavement design software could not be run
for the 50% reliability because the lowest level allowed was 80%.
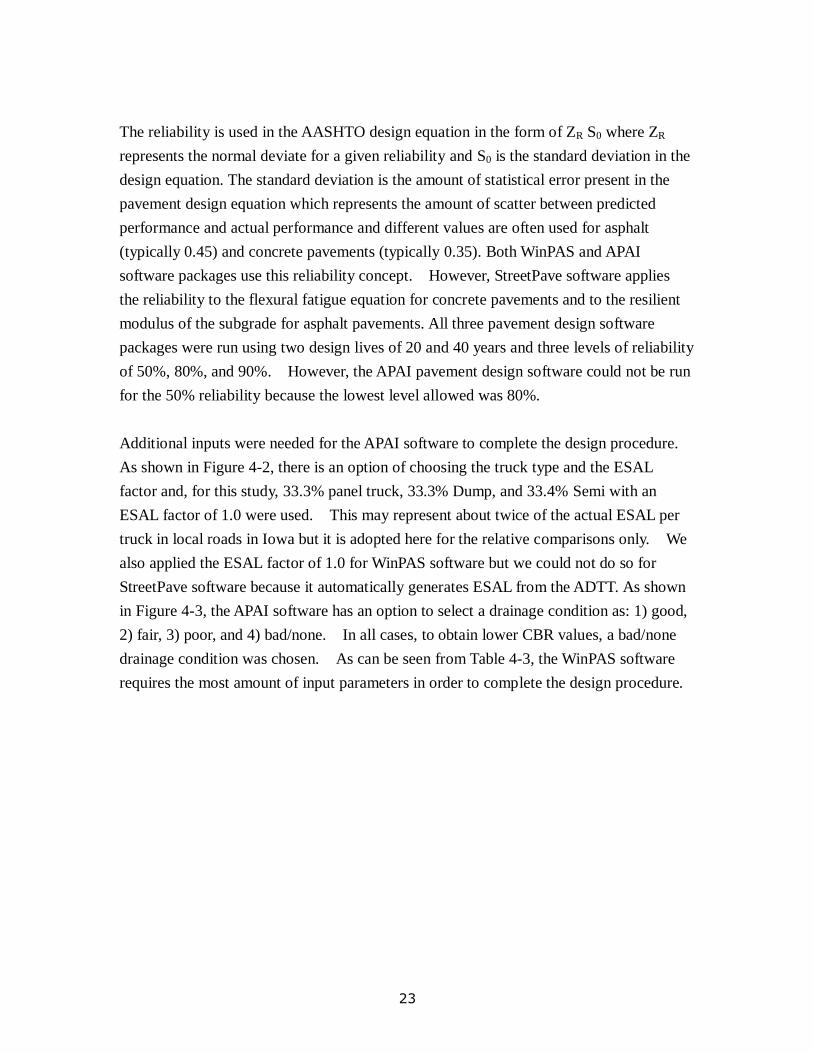
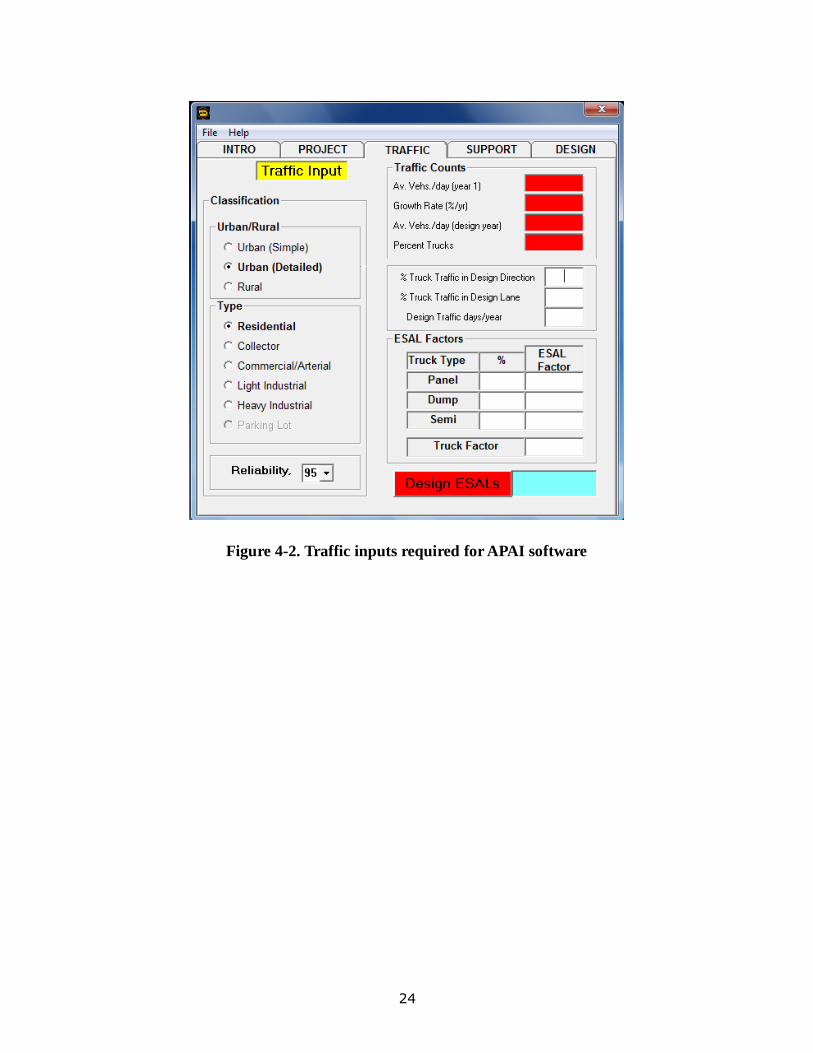
Additional inputs were needed for the APAI software to complete the design procedure.
As shown in Figure 4-2, there is an option of choosing the truck type and the ESAL
factor and, for this study, 33.3% panel truck, 33.3% Dump, and 33.4% Semi with an
ESAL factor of 1.0 were used. This may represent about twice of the actual ESAL per
truck in local roads in Iowa but it is adopted here for the relative comparisons only. We
also applied the ESAL factor of 1.0 for WinPAS software but we could not do so for
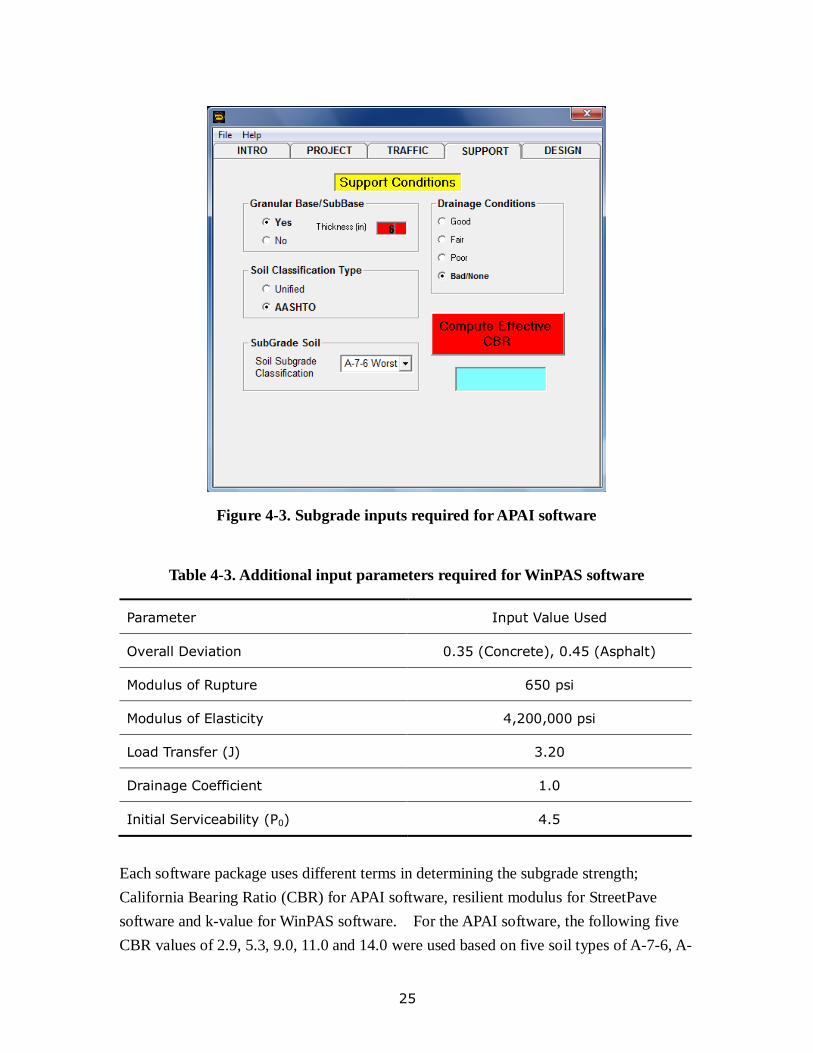
StreetPave software because it automatically generates ESAL from the ADTT. As shown
in Figure 4-3, the APAI software has an option to select a drainage condition as: 1) good,
2) fair, 3) poor, and 4) bad/none. In all cases, to obtain lower CBR values, a bad/none
drainage condition was chosen. As can be seen from Table 4-3, the WinPAS software
requires the most amount of input parameters in order to complete the design procedure.
24
Figure 4-2. Traffic inputs required for APAI software
25
Figure 4-3. Subgrade inputs required for APAI software
Table 4-3. Additional input parameters required for WinPAS software
Parameter Input Value Used
Overall Deviation 0.35 (Concrete), 0.45 (Asphalt)
Modulus of Rupture 650 psi
Modulus of Elasticity 4,200,000 psi
Load Transfer (J) 3.20
Drainage Coefficient 1.0
Initial Serviceability (P0) 4.5
Each software package uses different terms in determining the subgrade strength;
California Bearing Ratio (CBR) for APAI software, resilient modulus for StreetPave
software and k-value for WinPAS software. For the APAI software, the following five
CBR values of 2.9, 5.3, 9.0, 11.0 and 14.0 were used based on five soil types of A-7-6, A-
26
7-5, A-6, A-5, and A-4, respectively after adjusted for no/poor drainage condition. The
APAI software converts these CBR values to resilient moduli of 4350 psi, 7429psi,
10426psi, 11854psi, and 15067psi. Following the StreetPave software manual, the
equivalent resilient modulus values of 4350psi, 7950psi, 8735psi, 10020psi, and 11820psi
were used for StreetPave software. The conversion from CBR to resilient modulus was
based on 1500 *CBR (for CBR values of 2.9 and 5.3) and 1941.488* CBR0.06844709
(for
CBR values of 9.0, 11.0 and 14.0). It should be noted that the equivalent resilient
modulus values used for StreetPave software were lower than the ones used for APAI
software particularly for CBR values of 9.0, 11.0 and 14.0.
To design concrete pavement using, WinPAS converts the resilient modulus values to k-
value using the relationship k = MR/19.4 based on an analysis of a 30-inch plate bearing
test. However, due to the small size of the plate used to develop this relationship, this
conversion equation results in too large k-values. Therefore, using the conversion chart
from CBR to k-value developed by Packard (1973), the following equivalent k-values
were used for the WinPAS software: 97pci, 146pci, 190pci, 206pci and 222pci.
4.2 Analysis Results Using StreePave Software
4.2.1 Concrete Pavement
StreetPave software package recommends the concrete pavement a minimum thickness of
3.5 inches for 25 ADT with 1% truck traffic, 50% reliability, and the best subgrade
strength whereas the AASTHO 1993 design guide recommends 5.0 inches as a minimum
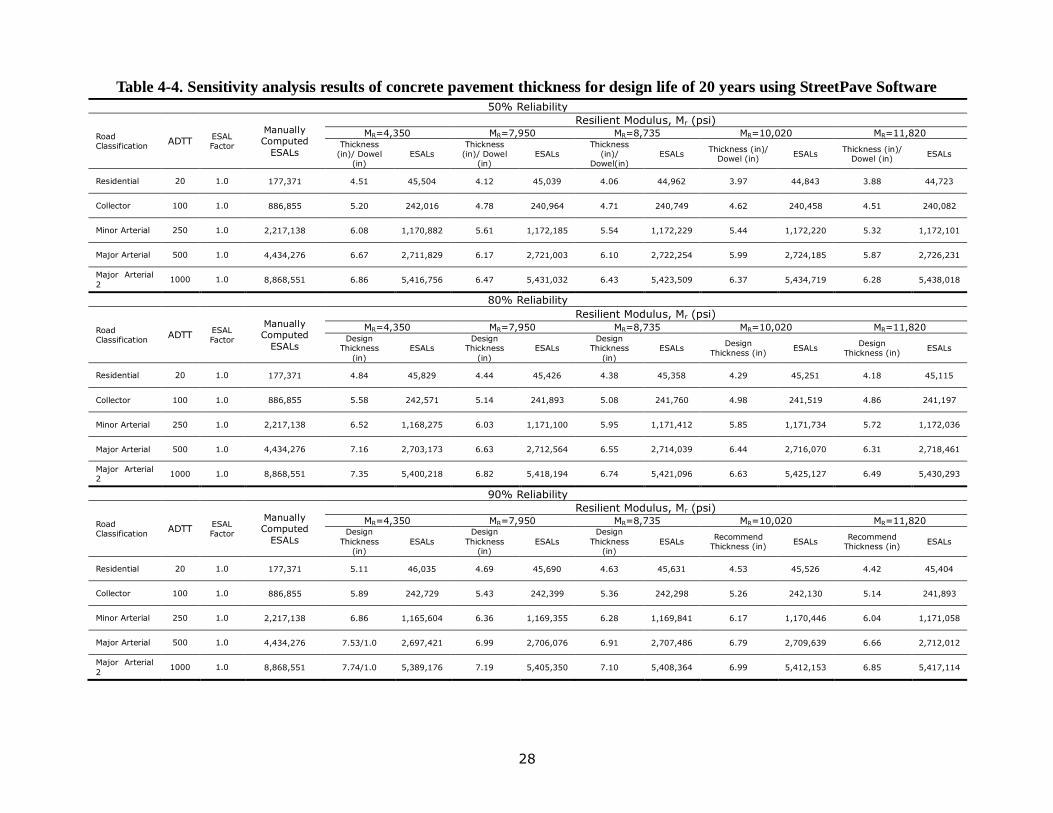
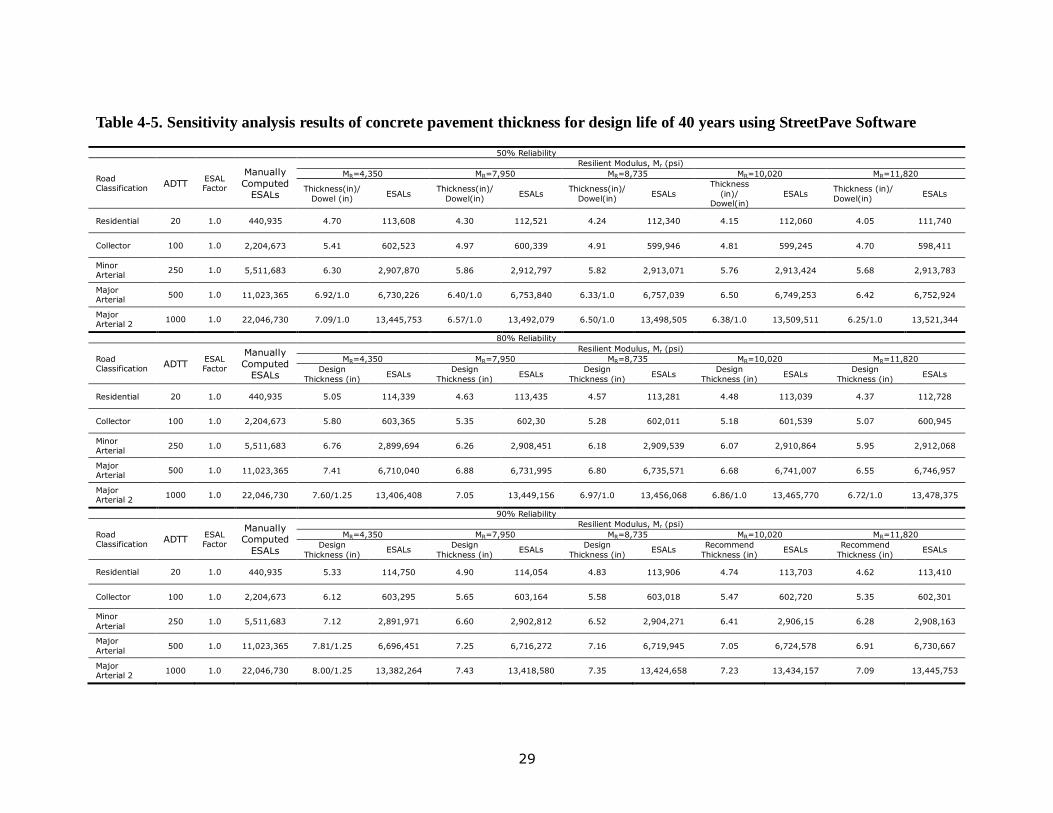
design thickness. Table 4-4 and Table 4-5 show the sensitivity analysis results of
concrete pavement thickness and the diameter of the dowel bar for the design life of 20
years and 40 years, respectively. StreetPave software assume the edge support and
recommend the dowel bar with a diameter of 1.5 inches for the pavement thickness
greater than 10 inches; 1.25 inches for the pavement thickness between 8 and 10 inches;
1.0 inch for the pavement thickness less than 8 inches only when the erosion is a cause of
failure. It should be noted that all tables include the design ESAL values that were
generated by the software packages and they are quite different from the manually
computed ESAL values with 2.0% annual growth rate. The ESAL values generated by
StreetPave software reported as flexible ESAL’s for the concrete pavement design which
indicates the ESAL’s are based on conversion factor for flexible pavements.
27
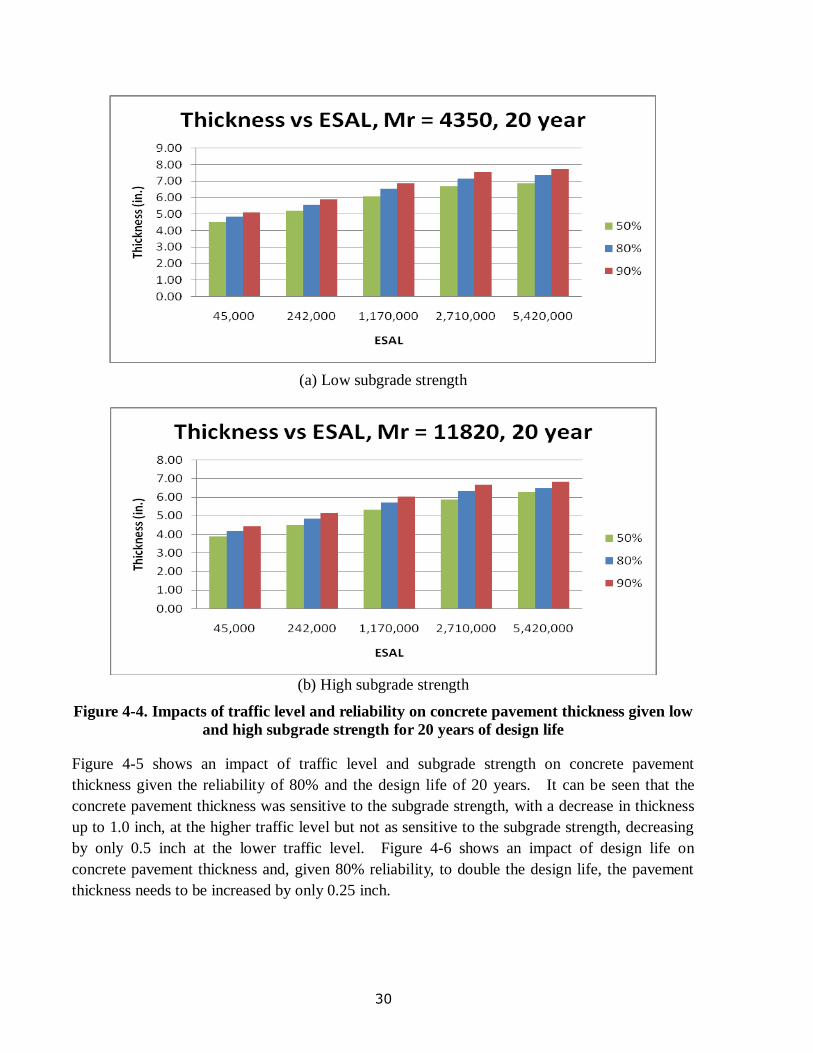
Figure 4-4 shows concrete pavement thickness against traffic level at low and high
subgrade strengths for three different levels of reliability and the design life of 20 years.
As can be seen from Figure 4-4, the pavement thickness is more sensitive to traffic at a
lower traffic level up to 1.17 million (increase in thickness by 1.5 inches) than the higher
traffic level from 1.17 million to 5.42 million ESAL (increase in thickness by 1.0 inch).
Reliability had a limited impact on the thickness, increasing the thickness by up to 0.5
inch, when the reliability increased from 50% to 90%.
28
Table 4-4. Sensitivity analysis results of concrete pavement thickness for design life of 20 years using StreetPave Software
50% Reliability
Road Classification ADTT
ESAL Factor
Manually Computed
ESALs
Resilient Modulus, Mr (psi) MR=4,350 MR=7,950 MR=8,735 MR=10,020 MR=11,820
Thickness (in)/ Dowel
(in) ESALs
Thickness (in)/ Dowel
(in) ESALs
Thickness (in)/
Dowel(in) ESALs
Thickness (in)/ Dowel (in)
ESALs Thickness (in)/
Dowel (in) ESALs
Residential 20 1.0 177,371 4.51 45,504 4.12 45,039 4.06 44,962 3.97 44,843 3.88 44,723
Collector 100 1.0 886,855 5.20 242,016 4.78 240,964 4.71 240,749 4.62 240,458 4.51 240,082
Minor Arterial 250 1.0 2,217,138 6.08 1,170,882 5.61 1,172,185 5.54 1,172,229 5.44 1,172,220 5.32 1,172,101
Major Arterial 500 1.0 4,434,276 6.67 2,711,829 6.17 2,721,003 6.10 2,722,254 5.99 2,724,185 5.87 2,726,231
Major Arterial
2 1000 1.0 8,868,551 6.86 5,416,756 6.47 5,431,032 6.43 5,423,509 6.37 5,434,719 6.28 5,438,018
80% Reliability
Road Classification ADTT
ESAL Factor
Manually Computed
ESALs
Resilient Modulus, Mr (psi) MR=4,350 MR=7,950 MR=8,735 MR=10,020 MR=11,820
Design Thickness
(in)
ESALs Design
Thickness
(in)
ESALs Design
Thickness
(in)
ESALs Design
Thickness (in) ESALs
Design Thickness (in)
ESALs
Residential 20 1.0 177,371 4.84 45,829 4.44 45,426 4.38 45,358 4.29 45,251 4.18 45,115
Collector 100 1.0 886,855 5.58 242,571 5.14 241,893 5.08 241,760 4.98 241,519 4.86 241,197
Minor Arterial 250 1.0 2,217,138 6.52 1,168,275 6.03 1,171,100 5.95 1,171,412 5.85 1,171,734 5.72 1,172,036
Major Arterial 500 1.0 4,434,276 7.16 2,703,173 6.63 2,712,564 6.55 2,714,039 6.44 2,716,070 6.31 2,718,461
Major Arterial 2
1000 1.0 8,868,551 7.35 5,400,218 6.82 5,418,194 6.74 5,421,096 6.63 5,425,127 6.49 5,430,293
90% Reliability
Road Classification ADTT
ESAL Factor
Manually Computed
ESALs
Resilient Modulus, Mr (psi) MR=4,350 MR=7,950 MR=8,735 MR=10,020 MR=11,820
Design
Thickness (in)
ESALs
Design
Thickness (in)
ESALs
Design
Thickness (in)
ESALs Recommend
Thickness (in) ESALs
Recommend Thickness (in)
ESALs
Residential 20 1.0 177,371 5.11 46,035 4.69 45,690 4.63 45,631 4.53 45,526 4.42 45,404
Collector 100 1.0 886,855 5.89 242,729 5.43 242,399 5.36 242,298 5.26 242,130 5.14 241,893
Minor Arterial 250 1.0 2,217,138 6.86 1,165,604 6.36 1,169,355 6.28 1,169,841 6.17 1,170,446 6.04 1,171,058
Major Arterial 500 1.0 4,434,276 7.53/1.0 2,697,421 6.99 2,706,076 6.91 2,707,486 6.79 2,709,639 6.66 2,712,012
Major Arterial
2 1000 1.0 8,868,551 7.74/1.0 5,389,176 7.19 5,405,350 7.10 5,408,364 6.99 5,412,153 6.85 5,417,114
29
Table 4-5. Sensitivity analysis results of concrete pavement thickness for design life of 40 years using StreetPave Software
50% Reliability
Road Classification
ADTT ESAL Factor
Manually
Computed ESALs
Resilient Modulus, Mr (psi)
MR=4,350 MR=7,950 MR=8,735 MR=10,020 MR=11,820
Thickness(in)/
Dowel (in) ESALs
Thickness(in)/
Dowel(in) ESALs
Thickness(in)/
Dowel(in) ESALs
Thickness
(in)/ Dowel(in)
ESALs Thickness (in)/
Dowel(in) ESALs
Residential 20 1.0 440,935 4.70 113,608 4.30 112,521 4.24 112,340 4.15 112,060 4.05 111,740
Collector 100 1.0 2,204,673 5.41 602,523 4.97 600,339 4.91 599,946 4.81 599,245 4.70 598,411
Minor Arterial
250 1.0 5,511,683 6.30 2,907,870 5.86 2,912,797 5.82 2,913,071 5.76 2,913,424 5.68 2,913,783
Major Arterial
500 1.0 11,023,365 6.92/1.0 6,730,226 6.40/1.0 6,753,840 6.33/1.0 6,757,039 6.50 6,749,253 6.42 6,752,924
Major Arterial 2
1000 1.0 22,046,730 7.09/1.0 13,445,753 6.57/1.0 13,492,079 6.50/1.0 13,498,505 6.38/1.0 13,509,511 6.25/1.0 13,521,344
80% Reliability
Road Classification
ADTT ESAL Factor
Manually
Computed ESALs
Resilient Modulus, Mr (psi)
MR=4,350 MR=7,950 MR=8,735 MR=10,020 MR=11,820
Design
Thickness (in) ESALs
Design
Thickness (in) ESALs
Design
Thickness (in) ESALs
Design
Thickness (in) ESALs
Design
Thickness (in) ESALs
Residential 20 1.0 440,935 5.05 114,339 4.63 113,435 4.57 113,281 4.48 113,039 4.37 112,728
Collector 100 1.0 2,204,673 5.80 603,365 5.35 602,30 5.28 602,011 5.18 601,539 5.07 600,945
Minor Arterial
250 1.0 5,511,683 6.76 2,899,694 6.26 2,908,451 6.18 2,909,539 6.07 2,910,864 5.95 2,912,068
Major Arterial
500 1.0 11,023,365 7.41 6,710,040 6.88 6,731,995 6.80 6,735,571 6.68 6,741,007 6.55 6,746,957
Major Arterial 2
1000 1.0 22,046,730 7.60/1.25 13,406,408 7.05 13,449,156 6.97/1.0 13,456,068 6.86/1.0 13,465,770 6.72/1.0 13,478,375
90% Reliability
Road Classification
ADTT ESAL Factor
Manually Computed
ESALs
Resilient Modulus, Mr (psi)
MR=4,350 MR=7,950 MR=8,735 MR=10,020 MR=11,820
Design
Thickness (in) ESALs
Design
Thickness (in) ESALs
Design
Thickness (in) ESALs
Recommend
Thickness (in) ESALs
Recommend
Thickness (in) ESALs
Residential 20 1.0 440,935 5.33 114,750 4.90 114,054 4.83 113,906 4.74 113,703 4.62 113,410
Collector 100 1.0 2,204,673 6.12 603,295 5.65 603,164 5.58 603,018 5.47 602,720 5.35 602,301
Minor
Arterial 250 1.0 5,511,683 7.12 2,891,971 6.60 2,902,812 6.52 2,904,271 6.41 2,906,15 6.28 2,908,163
Major
Arterial 500 1.0 11,023,365 7.81/1.25 6,696,451 7.25 6,716,272 7.16 6,719,945 7.05 6,724,578 6.91 6,730,667
Major Arterial 2
1000 1.0 22,046,730 8.00/1.25 13,382,264 7.43 13,418,580 7.35 13,424,658 7.23 13,434,157 7.09 13,445,753
30
(a) Low subgrade strength
(b) High subgrade strength
Figure 4-4. Impacts of traffic level and reliability on concrete pavement thickness given low
and high subgrade strength for 20 years of design life
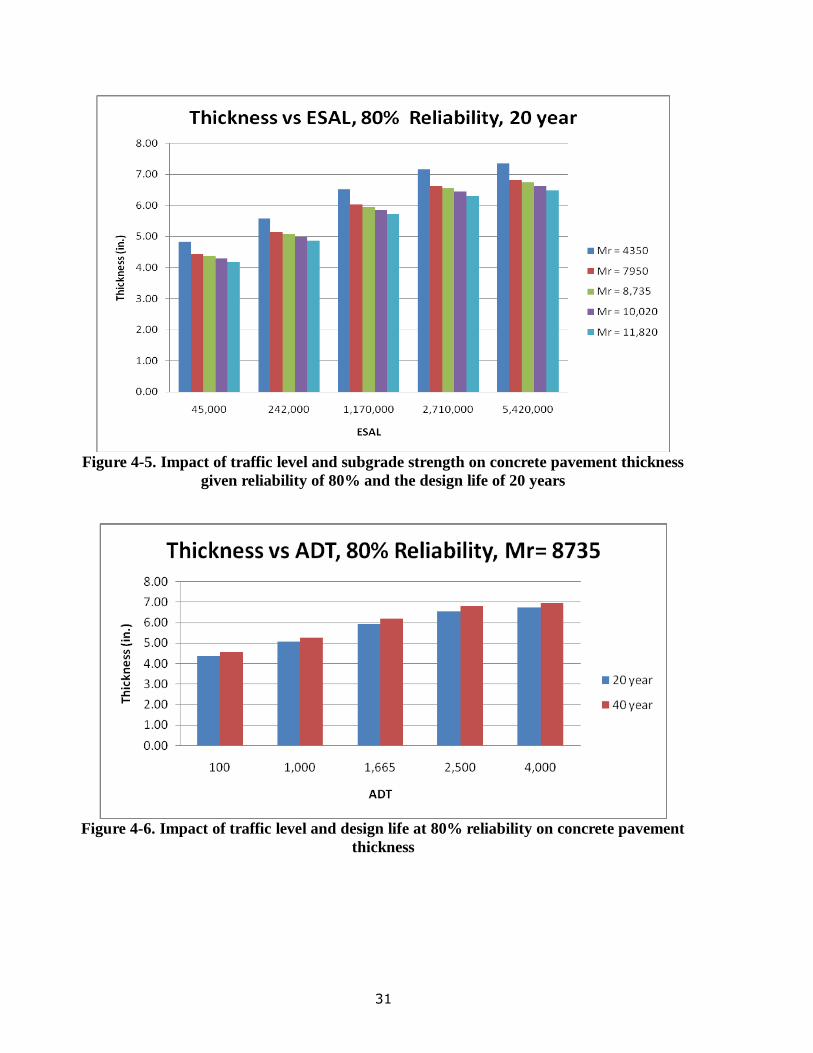
Figure 4-5 shows an impact of traffic level and subgrade strength on concrete pavement
thickness given the reliability of 80% and the design life of 20 years. It can be seen that the
concrete pavement thickness was sensitive to the subgrade strength, with a decrease in thickness
up to 1.0 inch, at the higher traffic level but not as sensitive to the subgrade strength, decreasing
by only 0.5 inch at the lower traffic level. Figure 4-6 shows an impact of design life on
concrete pavement thickness and, given 80% reliability, to double the design life, the pavement
thickness needs to be increased by only 0.25 inch.
31
Figure 4-5. Impact of traffic level and subgrade strength on concrete pavement thickness
given reliability of 80% and the design life of 20 years
Figure 4-6. Impact of traffic level and design life at 80% reliability on concrete pavement
thickness
32
4.2.2 Asphalt Pavement
For the lowest traffic level, the minimum thickness for asphalt pavement is 1.2 inches at 50%
reliability and the best subgrade strength (3.5 inches for concrete pavement). Table 4-6 and
Table 4-7 show the sensitivity analysis results of asphalt pavement thickness with 6-inch granular
base for design life of 20 and 40 years, respectively.
Figure 4-7 shows impacts of traffic level and reliability on the asphalt pavement thickness for a
given low and high subgrade strengths. The asphalt pavement thickness increased more rapidly
at the low traffic level than at the high traffic level. Contrary to the concrete pavement, the
reliability had a greater impact on the pavement thickness at the lower traffic level where asphalt
pavement thickness increased by about 2.0 inches when the reliability increased from 50% to
90%. At the higher traffic level, asphalt pavement thickness increased by about 1.5 inches
when the reliability increased from 50% to 90%.
33
Table 4-6. Sensitivity analysis results of asphalt pavement thickness for design life of 20 years using StreetPave software
50% Reliability
Road Classification
ADTT ESAL Factor
Manually
Computed ESALs
Resilient Modulus, Mr (psi)
MR=4,350 MR=7,950 MR=8,735 MR=10,020 MR=11,820
Thickness
(in) ESALs
Thickness
(in) ESALs
Thickness
(in) ESALs
Thickness
(in) ESALs
Thickness
(in) ESALs
Residential 20 1.0 177,371 4.75 45,504 3.11 45,039 2.87 44,962 2.54 44,843 2.16 44,723
Collector 100 1.0 886,855 6.52 242,016 4.95 240,964 4.71 240,749 4.37 240,458 3.98 240,082
Minor Arterial 250 1.0 2,217,138 8.67 1,170,882 7.21 1,172,185 6.98 1,172,229 6.65 1,172,220 6.26 1,172,101
Major Arterial 500 1.0 4,434,276 10.06 2,711,829 8.68 2,721,003 8.46 2,722,254 8.14 2,724,185 7.76 2,726,231
Major Arterial 2 1000 1.0 8,868,551 11.36 5,416,756 10.05 5,431,032 9.84 5,423,509 9.53 5,434,719 9.15 5,438,018
80% Reliability
Road
Classification ADTT
ESAL
Factor
Manually
Computed ESALs
Resilient Modulus, Mr (psi)
MR=4,350 MR=7,950 MR=8,735 MR=10,020 MR=11,820
Thickness (in)
ESALs Thickness
(in) ESALs
Thickness (in)
ESALs Thickness
(in) ESALs
Thickness (in)
ESALs
Residential 20 1.0 177,371 5.87 45,829 4.14 45,426 3.88 45,358 3.51 45,251 3.08 45,115
Collector 100 1.0 886,855 7.55 242,571 5.94 241,893 5.70 241,760 5.34 241,519 4.92 241,197
Minor Arterial 250 1.0 2,217,138 9.58 1,168,275 8.14 1,171,100 7.92 1,171,412 7.58 1,171,734 7.18 1,172,036
Major Arterial 500 1.0 4,434,276 10.90 2,703,173 9.57 2,712,564 9.35 2,714,039 9.04 2,716,070 8.65 2,718,461
Major Arterial 2 1000 1.0 8,868,551 12.13 5,400,218 10.90 5,418,194 10.70 5,421,096 10.39 5,425,127 10.02 5,430,293
90% Reliability
Road Classification
ADTT ESAL Factor
Manually Computed
ESALs
Resilient Modulus, Mr (psi)
MR=4,350 MR=7,950 MR=8,735 MR=10,020 MR=11,820
Thickness (in)
ESALs Thickness
(in) ESALs
Thickness (in)
ESALs Thickness
(in) ESALs
Thickness (in)
ESALs
Residential 20 1.0 177,371 6.71 46,035 4.93 45,690 4.66 45,631 4.28 45,526 3.82 45,404
Collector 100 1.0 886,855 8.30 242,729 6.69 242,399 6.44 242,298 6.08 242,130 5.64 241,893
Minor Arterial 250 1.0 2,217,138 10.21 1,165,604 8.82 1,169,355 8.60 1,169,841 8.27 1,170,446 7.87 1,171,058
Major Arterial 500 1.0 4,434,276 11.46 2,697,421 10.20 2,706,076 9.99 2,707,486 9.68 2,709,639 9.31 2,712,012
Major Arterial 2 1000 1.0 8,868,551 12.63 5,389,176 11.49 5,405,350 11.30 5,408,364 11.01 5,412,153 10.65 5,417,114
34
Table 4-7. Sensitivity analysis results of asphalt pavement thickness for design life of 40 years using StreetPave software
50% Reliability
Road
Classification ADTT
ESAL
Factor
Manually Computed
ESALs
Resilient Modulus, Mr (psi)
MR=4,350 MR=7,950 MR=8,735 MR=10,020 MR=11,820
Thickness (in)
ESALs Thickness
(in) ESALs
Thickness (in)
ESALs Thickness
(in) ESALs
Thickness (in)
ESALs
Residential 20 1.0 440,935 5.66 113,608 4.05 112,521 3.81 112,340 3.48 112,060 3.09 111,740
Collector 100 1.0 2,204,673 7.70 602,523 6.18 600,339 5.95 599,946 5.61 599,245 5.22 598,411
Minor Arterial 250 1.0 5,511,683 10.19 2,907,870 8.81 2,912,797 8.59 2,913,071 8.27 2,913,424 7.89 2,913,783
Major Arterial 500 1.0 11,023,365 11.80 6,730,226 10.52 6,753,840 10.31 6,757,039 10.00 6,749,253 9.62 6,752,924
Major Arterial 2 1000 1.0 22,046,730 13.30 13,445,753 12.10 13,492,079 11.90 13,498,505 11.61 13,509,511 11.25 13,521,344
80% Reliability
Road Classification
ADTT ESAL Factor
Manually
Computed ESALs
Resilient Modulus, Mr (psi) MR=4,350 MR=7,950 MR=8,735 MR=10,020 MR=11,820
Thickness (in)
ESALs Thickness
(in) ESALs
Thickness (in)
ESALs Thickness
(in) ESALs
Thickness (in)
ESALs
Residential 20 1.0 440,935 6.74 114,339 5.07 113,435 4.81 113,281 4.45 113,039 4.03 112,728
Collector 100 1.0 2,204,673 8.66 603,365 7.15 602,30 6.91 602,011 6.56 601,539 6.15 600,945
Minor Arterial 250 1.0 5,511,683 11.01 2,899,694 9.70 2,908,451 9.48 2,909,539 9.17 2,910,864 8.78 2,912,068
Major Arterial 500 1.0 11,023,365 12.54 6,710,040 11.35 6,731,995 11.15 6,735,571 10.85 6,741,007 10.49 6,746,957
Major Arterial 2 1000 1.0 22,046,730 13.97 13,406,408 12.88 13,449,156 12.70 13,456,068 12.42 13,465,770 12.07 13,478,375
90% Reliability
Road
Classification ADTT
ESAL
Factor
Manually Computed
ESALs
Resilient Modulus, Mr (psi)
MR=4,350 MR=7,950 MR=8,735 MR=10,020 MR=11,820
Thickness (in)
ESALs Thickness
(in) ESALs
Thickness (in)
ESALs Thickness
(in) ESALs
Thickness (in)
ESALs
Residential 20 1.0 440,935 7.54 114,750 5.84 114,054 5.58 113,906 5.21 113,703 4.76 113,410
Collector 100 1.0 2,204,673 9.35 603,295 7.86 603,164 7.62 603,018 7.28 602,720 6.86 602,301
Minor Arterial 250 1.0 5,511,683 11.57 2,891,971 10.33 2,902,812 10.12 2,904,271 9.81 2,906,15 9.43 2,908,163
Major Arterial 500 1.0 11,023,365 13.03 6,696,451 11.93 6,716,272 11.74 6,719,945 11.45 6,724,578 11.10 6,730,667
Major Arterial 2 1000 1.0 22,046,730 14.39 13,382,264 13.42 13,418,580 13.24 13,424,658 12.98 13,434,157 12.65 13,445,753
35
(a) Low subgrade strength
(b) High subgrade strength
Figure 4-7. Impacts of traffic level and reliability on asphalt pavement thickness
given low and high subgrade strength and design life of 20 years
Figure 4-8 shows an impact of traffic level and subgrade strength on asphalt pavement
thickness given a reliability of 80% and design life of 20 years. Contrary to the concrete
pavement, the subgrade strength had the greatest impact on the pavement thickness at the
lowest traffic level where the asphalt pavement thickness decreased by up to 3.0 inches.
At the high traffic level, however, the asphalt pavement thickness decreased by up to 2.0
inches when the subgrade strength increased from 4,350psi to 11,820psi.
36
Figure 4-8. Impact of traffic level and subgrade strength on asphalt pavement
thickness given reliability of 80% and design life of 20 years
4.3 Analysis Results Using WinPAS Software
4.3.1 Concrete Pavement
The minimum concrete pavement design thickness allowed is 4.0 inches at a traffic level
of 1000 ADT with 2% truck. Table 4-8 and Table 4-9 show the sensitivity analysis
results of the concrete pavement thicknesses without dowel (load transfer factor of 3.2)
and with dowel (load transfer factor of 2.7) for design life of 20 years and 40 years,
respectively. As can be seen from these tables, the use of dowel would consistently
reduce the pavement thickness by 0.5 to 0.75 inch. Unless mentioned otherwise, the
default load transfer value used for WinPAS software is 3.2. Figure 4-9 shows impacts
of traffic level and reliability on the concrete pavement thickness for a given low and
high subgrade strengths. As shown in Figure 4-9, traffic had the greatest impact on the
concrete pavement thickness as the concrete pavement thickness increased by 3.0 to 4.0
inches when traffic increased from low to high level. Reliability had the greater impact
at the higher traffic level, with the thickness increasing by about 1.25 inches when the
reliability increased from 50% to 90%. At the low traffic level, the pavement thickness
increased by only 0.5 to 1.0 inch when the reliability increased from 50% to 90%.
37
Table 4-8. Sensitivity analysis results of concrete pavement thickness for design life of 20 years using WinPAS software
50% Reliability
Road
Classification ADTT
ESAL
Factor
Manual
Computed ESALs
k-value (pci)
k-value = 97 k-value = 146 k-value = 190 k-value = 206 k-value = 222
Design
Thickness (in)
ESALs
Design
Thickness (in)
ESALs
Design
Thickness (in)
ESALs
Design
Thickness (in)
ESALs
Design
Thickness (in)
ESALs
Residential 20 1.0 177,371 4.00/4.00 88,746 4.00/4.00 88,746 4.00/n.a. 88,746 4.00/n.a 88,746 N/A N/A
Collector 100 1.0 886,855 4.98/4.47 443,731 4.78/4.23 443,731 4.57/4.02 443,731 4.50/4.00 443,731 4.44/4.00 443,731
Minor Arterial 250 1.0 2,217,138 5.85/5.26 1,109,327 5.64/5.04 1,109,327 5.47/4.86 1,109,327 5.42/4.74 1,109,327 5.36/4.74 1,109,327
Major Arterial 500 1.0 4,434,276 6.59/5.94 2,218,654 6.39/5.73 2,218,654 6.24/5.56 2,218,654 6.18/5.45 2,218,654 6.13/5.45 2,218,654
Major Arterial 2 1000 1.0 8,868,551 7.40/6.69 4,437,307 7.21/6.49 4,437,307 7.06/6.33 4,437,307 7.01/6.23 4,437,307 6.97/6.23 4,437,307
80% Reliability
Road
Classification ADTT
ESAL
Factor
Manual Computed
ESALs
k-value (pci)
k-value = 97 k-value = 146 k-value = 190 k-value = 206 k-value = 222
Design Thickness
(in) ESALs
Design Thickness
(in) ESALs
Design Thickness
(in) ESALs
Design Thickness
(in) ESALs
Design Thickness
(in) ESALs
Residential 20 1.0 177,371 4.21/4.00 88,746 4.00/4.00 88,746 4.00/4.00 88,746 4.00/4.00 88,746 4.00/4.00 88,746
Collector 100 1.0 886,855 5.61/5.04 443,731 5.40/4.82 443,731 5.23/4.63 443,731 5.17/4.57 443,731 5.11/4.50 443,731
Minor Arterial 250 1.0 2,217,138 6.58/5.32 1,109,327 6.37/5.71 1,109,327 6.22/5.54 1,109,327 6.16/5.49 1,109,327 6.11/5.43 1,109,327
Major Arterial 500 1.0 4,434,276 7.39/6.67 2,218,654 7.19/6.47 2,218,654 7.04/6.31 2,218,654 6.99/6.26 2,218,654 6.95/6.21 2,218,654
Major Arterial 2 1000 1.0 8,868,551 8.26/7.49 4,437,307 8.07/7.30 4,437,307 7.93/7.15 4,437,307 7.89/7.10 4,437,307 7.85/7.05 4,437,307
90% Reliability
Road Classification
ADTT ESAL Factor
Manual Computed
ESALs
k-value (pci)
k-value = 97 k-value = 146 k-value = 190 k-value = 206 k-value = 222
Design Thickness
(in)
ESALs Design
Thickness
(in)
ESALs Design
Thickness
(in)
ESALs Design
Thickness
(in)
ESALs Design
Thickness
(in)
ESALs
Residential 20 1.0 177,371 4.49/4.02 88,746 4.25/4.00 88,746 4.05/4.00 88,746 4.00/4.00 88,746 4.00/4.00 88,746
Collector 100 1.0 886,855 5.97/5.37 443,731 5.76/5.15 443,731 5.60/4.97 443,731 5.54/4.91 443,731 5.48/4.85 443,731
Minor Arterial 250 1.0 2,217,138 6.98/6.30 1,109,327 6.78/6.09 1,109,327 6.63/5.93 1,109,327 6.58/5.88 1,109,327 6.53/5.82 1,109,327
Major Arterial 500 1.0 4,434,276 7.83/7.08 2,218,654 7.63/6.89 2,218,654 7.49/6.73 2,218,654 7.44/6.68 2,218,654 7.40/6.64 2,218,654
Major Arterial 2 1000 1.0 8,868,551 8.73/7.93 4,437,307 8.55/7.74 4,437,307 8.42/7.60 4,437,307 8.37/7.56 4,437,307 8.33/7.51 4,437,307
38
Table 4-9. Sensitivity analysis results of concrete pavement thickness for design life of 40 years using WinPAS software
50% Reliability
Road Classification
ADTT ESAL Factor
Manual Computed
ESALs
k-value (pci)
k-value = 97 k-value = 146 k-value = 190 k-value = 206 k-value = 222
Design Thickness
(in)
ESALs Design
Thickness
(in)
ESALs Design
Thickness
(in)
ESALs Design
Thickness
(in)
ESALs Design
Thickness
(in)
ESALs
Residential 20 1.0 440,935 4.40/4.00 220,618 4.15/4.00 220,618 4.00/4.00 220,618 4.00/4.00 220,618 4.00/4.00 220,618
Collector 100 1.0 2,204,673 5.85/5.25 1,103,091 5.63/5.03 1,103,091 5.46/4.86 1,103,091 5.41/4.79 1,103,091 5.35/4.73 1,103,091
Minor Arterial 250 1.0 5,511,683 6.84/6.17 2,757,728 6.64/5.96 2,757,728 6.49/5.80 2,757,728 6.44/5.74 2,757,728 6.39/5.69 2,757,728
Major Arterial 500 1.0 11,023,365 7.67/6.94 5,515,456 7.48/6.74 5,515,456 7.34/6.59 5,515,456 7.29/6.54 5,515,456 7.24/6.49 5,515,456
Major Arterial 2 1000 1.0 22,046,730 8.57/7.78 11,030,912 8.39/7.59 11,030,912 8.25/7.44 11,030,912 8.20/7.40 11,030,912 8.16/7.35 11,030,912
80% Reliability
Road Classification
ADTT ESAL Factor
Manual Computed
ESALs
k-value (pci)
k-value = 97 k-value = 146 k-value = 190 k-value = 206 k-value = 222
Design Thickness
(in)
ESALs Design
Thickness
(in)
ESALs Design
Thickness
(in)
ESALs Design
Thickness
(in)
ESALs Design
Thickness
(in)
ESALs
Residential 20 1.0 440,935 4.96/4.45 220,618 4.73/4.21 220,618 4.55/4.00 220,618 4.48/4.00 220,618 4.42/4.00 220,618
Collector 100 1.0 2,204,673 6.57/5.92 1,103,091 6.375.70 1,103,091 6.21/5.54 1,103,091 6.16/5.48 1,103,091 6.10/5.43 1,103,091
Minor Arterial 250 1.0 5,511,683 7.65/6.92 2,757,728 7.46/6.72 2,757,728 7.32/6.57 2,757,728 7.27/6.52 2,757,728 7.22/6.47 2,757,728
Major Arterial 500 1.0 11,023,365 8.55/7.76 5,515,456 8.36/7.57 5,515,456 8.23/7.43 5,515,456 8.18/7.38 5,515,456 8.14/7.33 5,515,456
Major Arterial 2 1000 1.0 22,046,730 9.52/8.66 11,030,912 9.34/8.48 11,030,912 9.21/8.34 11,030,912 9.17/8.34 11,030,912 9.13/8.25 11,030,912
90% Reliability
Road
Classification ADTT
ESAL
Factor
Manual Computed
ESALs
k-value (pci)
k-value = 97 k-value = 146 k-value = 190 k-value = 206 k-value = 222
Design
Thickness (in)
ESALs
Design
Thickness (in)
ESALs
Design
Thickness (in)
ESALs
Design
Thickness (in)
ESALs
Design
Thickness (in)
ESALs
Residential 20 1.0 440,935 5.28/4.74 220,618 5.06/4.51 220,618 4.89/4.32 220,618 4.82/4.25 220,618 4.76/4.18 220,618
Collector 100 1.0 2,204,673 6.98/6.29 1,103,091 6.78/6.09 1,103,091 6.63/5.93 1,103,091 6.57/5.87 1,103,091 6.53/5.82 1,103,091
Minor Arterial 250 1.0 5,511,683 8.10/7.34 2,757,728 7.92/7.15 2,757,728 7.78/7.00 2,757,728 7.73/6.95 2,757,728 7.68/6.90 2,757,728
Major Arterial 500 1.0 11,023,365 9.04/8.21 5,515,456 8.86/8.03 5,515,456 8.72/7.89 5,515,456 8.68/7.84 5,515,456 8.63/7.80 5,515,456
Major Arterial 2 1000 1.0 22,046,730 10.06/9.16 11,030,912 9.88/8.98 11,030,912 9.75/8.84 11,030,912 9.71/8.80 11,030,912 9.66/8.76 11,030,912

39
(a) Low subgrade strength
(b) High subgrade strength
Figure 4-9. Impacts of traffic level and reliability on concrete pavement thickness
given low and high subgrade strength and design life of 20 years
40
Figure 4-10 shows an impact of traffic level and subgrade strength on concrete pavement
thickness given a reliability of 80% and design life of 20 years. Traffic had a greater
impact on concrete pavement thickness than the subgrade strength. The concrete
pavement thickness was not sensitive to subgrade strength because the thickness
decreased by only 0.5 inch when the subgrade strength increased from 97 pci to 222 pci.
Figure 4-10. Impact of traffic level and subgrade strength on concrete pavement
thickness given reliability of 80% and design life of 20 years
4.3.2 Asphalt Pavement
For the lowest traffic level, using the WinPAS software, the minimum asphalt pavement
design thickness is 3.6 inches at a traffic level of 230 ADT with 1% truck. Table 4-10
and Table 4-11 show the sensitivity analysis results of asphalt pavement thickness for
design life of 20 and 40 years, respectively.
Figure 4-11 shows impacts of traffic level and reliability on the asphalt pavement
thickness for a given low and high subgrade strengths. As shown in Figure 4-11, traffic
had the greatest impact on the asphalt pavement thickness as the asphalt pavement
thickness was increased by 4.0 inches to 4.5 inches when traffic increased from low to

41
high level. Reliability had the greater impact at the higher traffic level, with asphalt
pavement thickness increasing by about 1.5 inches when the reliability increased from
50% to 90%.
Figure 4-12 shows an impact of traffic level and subgrade strength on the asphalt
pavement thickness for a given a reliability of 80% and design life of 20 years. The
subgrade strength had the greatest impact at the high traffic level, decreasing the
thickness by 2.5 inches when the subgrade strength increased from 4,350psi to 11,820psi.
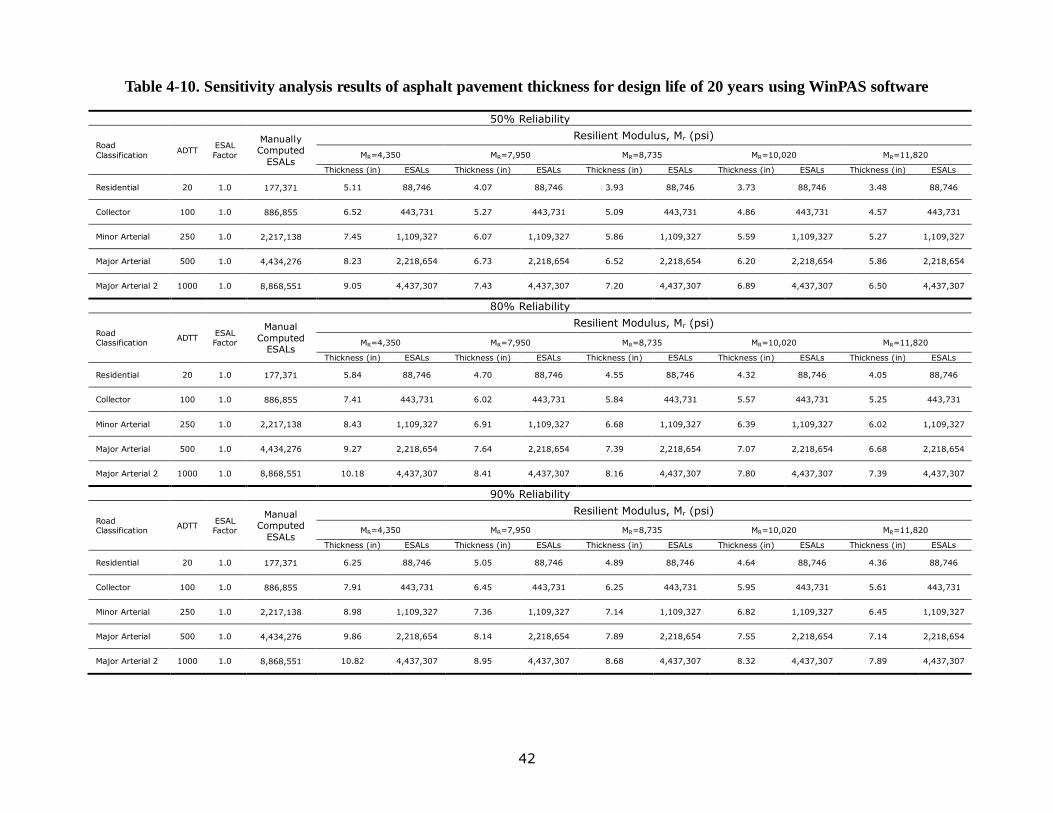
42
Table 4-10. Sensitivity analysis results of asphalt pavement thickness for design life of 20 years using WinPAS software
50% Reliability
Road
Classification ADTT
ESAL
Factor
Manually Computed
ESALs
Resilient Modulus, Mr (psi)
MR=4,350 MR=7,950 MR=8,735 MR=10,020 MR=11,820
Thickness (in) ESALs Thickness (in) ESALs Thickness (in) ESALs Thickness (in) ESALs Thickness (in) ESALs
Residential 20 1.0 177,371 5.11 88,746 4.07 88,746 3.93 88,746 3.73 88,746 3.48 88,746
Collector 100 1.0 886,855 6.52 443,731 5.27 443,731 5.09 443,731 4.86 443,731 4.57 443,731
Minor Arterial 250 1.0 2,217,138 7.45 1,109,327 6.07 1,109,327 5.86 1,109,327 5.59 1,109,327 5.27 1,109,327
Major Arterial 500 1.0 4,434,276 8.23 2,218,654 6.73 2,218,654 6.52 2,218,654 6.20 2,218,654 5.86 2,218,654
Major Arterial 2 1000 1.0 8,868,551 9.05 4,437,307 7.43 4,437,307 7.20 4,437,307 6.89 4,437,307 6.50 4,437,307
80% Reliability
Road Classification
ADTT ESAL Factor
Manual
Computed ESALs
Resilient Modulus, Mr (psi)
MR=4,350 MR=7,950 MR=8,735 MR=10,020 MR=11,820
Thickness (in) ESALs Thickness (in) ESALs Thickness (in) ESALs Thickness (in) ESALs Thickness (in) ESALs
Residential 20 1.0 177,371 5.84 88,746 4.70 88,746 4.55 88,746 4.32 88,746 4.05 88,746
Collector 100 1.0 886,855 7.41 443,731 6.02 443,731 5.84 443,731 5.57 443,731 5.25 443,731
Minor Arterial 250 1.0 2,217,138 8.43 1,109,327 6.91 1,109,327 6.68 1,109,327 6.39 1,109,327 6.02 1,109,327
Major Arterial 500 1.0 4,434,276 9.27 2,218,654 7.64 2,218,654 7.39 2,218,654 7.07 2,218,654 6.68 2,218,654
Major Arterial 2 1000 1.0 8,868,551 10.18 4,437,307 8.41 4,437,307 8.16 4,437,307 7.80 4,437,307 7.39 4,437,307
90% Reliability
Road Classification
ADTT ESAL Factor
Manual Computed
ESALs
Resilient Modulus, Mr (psi)
MR=4,350 MR=7,950 MR=8,735 MR=10,020 MR=11,820
Thickness (in) ESALs Thickness (in) ESALs Thickness (in) ESALs Thickness (in) ESALs Thickness (in) ESALs
Residential 20 1.0 177,371 6.25 88,746 5.05 88,746 4.89 88,746 4.64 88,746 4.36 88,746
Collector 100 1.0 886,855 7.91 443,731 6.45 443,731 6.25 443,731 5.95 443,731 5.61 443,731
Minor Arterial 250 1.0 2,217,138 8.98 1,109,327 7.36 1,109,327 7.14 1,109,327 6.82 1,109,327 6.45 1,109,327
Major Arterial 500 1.0 4,434,276 9.86 2,218,654 8.14 2,218,654 7.89 2,218,654 7.55 2,218,654 7.14 2,218,654
Major Arterial 2 1000 1.0 8,868,551 10.82 4,437,307 8.95 4,437,307 8.68 4,437,307 8.32 4,437,307 7.89 4,437,307
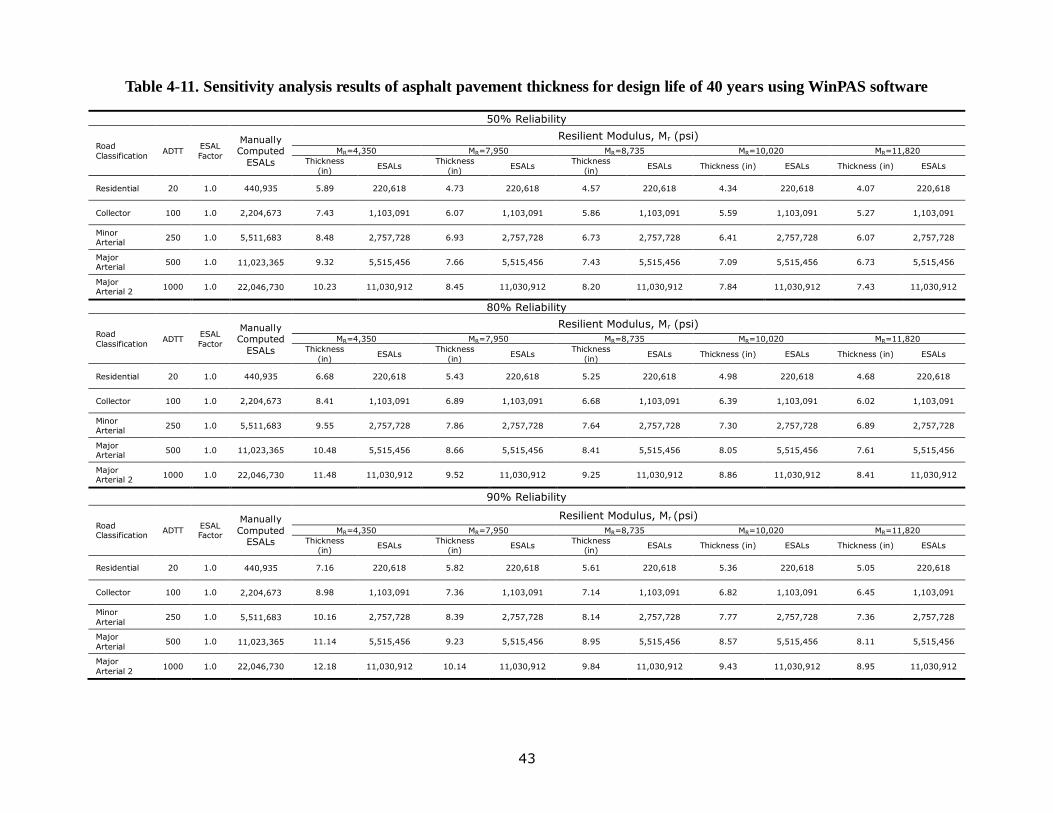
43
Table 4-11. Sensitivity analysis results of asphalt pavement thickness for design life of 40 years using WinPAS software
50% Reliability
Road
Classification ADTT
ESAL
Factor
Manually Computed
ESALs
Resilient Modulus, Mr (psi)
MR=4,350 MR=7,950 MR=8,735 MR=10,020 MR=11,820
Thickness
(in) ESALs
Thickness
(in) ESALs
Thickness
(in) ESALs Thickness (in) ESALs Thickness (in) ESALs
Residential 20 1.0 440,935 5.89 220,618 4.73 220,618 4.57 220,618 4.34 220,618 4.07 220,618
Collector 100 1.0 2,204,673 7.43 1,103,091 6.07 1,103,091 5.86 1,103,091 5.59 1,103,091 5.27 1,103,091
Minor Arterial
250 1.0 5,511,683 8.48 2,757,728 6.93 2,757,728 6.73 2,757,728 6.41 2,757,728 6.07 2,757,728
Major Arterial
500 1.0 11,023,365 9.32 5,515,456 7.66 5,515,456 7.43 5,515,456 7.09 5,515,456 6.73 5,515,456
Major Arterial 2
1000 1.0 22,046,730 10.23 11,030,912 8.45 11,030,912 8.20 11,030,912 7.84 11,030,912 7.43 11,030,912
80% Reliability
Road
Classification ADTT
ESAL
Factor
Manually Computed
ESALs
Resilient Modulus, Mr (psi)
MR=4,350 MR=7,950 MR=8,735 MR=10,020 MR=11,820
Thickness
(in) ESALs
Thickness
(in) ESALs
Thickness
(in) ESALs Thickness (in) ESALs Thickness (in) ESALs
Residential 20 1.0 440,935 6.68 220,618 5.43 220,618 5.25 220,618 4.98 220,618 4.68 220,618
Collector 100 1.0 2,204,673 8.41 1,103,091 6.89 1,103,091 6.68 1,103,091 6.39 1,103,091 6.02 1,103,091
Minor Arterial
250 1.0 5,511,683 9.55 2,757,728 7.86 2,757,728 7.64 2,757,728 7.30 2,757,728 6.89 2,757,728
Major Arterial
500 1.0 11,023,365 10.48 5,515,456 8.66 5,515,456 8.41 5,515,456 8.05 5,515,456 7.61 5,515,456
Major Arterial 2
1000 1.0 22,046,730 11.48 11,030,912 9.52 11,030,912 9.25 11,030,912 8.86 11,030,912 8.41 11,030,912
90% Reliability
Road Classification
ADTT ESAL Factor
Manually
Computed ESALs
Resilient Modulus, Mr (psi)
MR=4,350 MR=7,950 MR=8,735 MR=10,020 MR=11,820
Thickness (in)
ESALs Thickness
(in) ESALs
Thickness (in)
ESALs Thickness (in) ESALs Thickness (in) ESALs
Residential 20 1.0 440,935 7.16 220,618 5.82 220,618 5.61 220,618 5.36 220,618 5.05 220,618
Collector 100 1.0 2,204,673 8.98 1,103,091 7.36 1,103,091 7.14 1,103,091 6.82 1,103,091 6.45 1,103,091
Minor
Arterial 250 1.0 5,511,683 10.16 2,757,728 8.39 2,757,728 8.14 2,757,728 7.77 2,757,728 7.36 2,757,728
Major
Arterial 500 1.0 11,023,365 11.14 5,515,456 9.23 5,515,456 8.95 5,515,456 8.57 5,515,456 8.11 5,515,456
Major
Arterial 2 1000 1.0 22,046,730 12.18 11,030,912 10.14 11,030,912 9.84 11,030,912 9.43 11,030,912 8.95 11,030,912
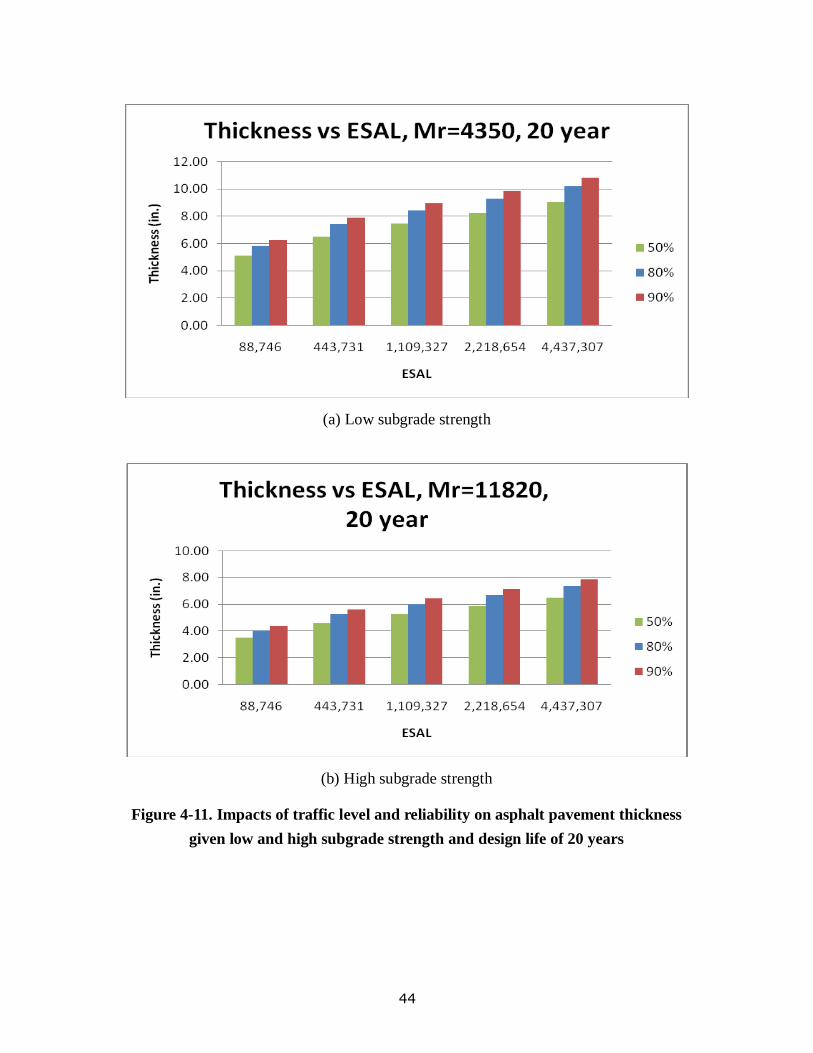
44
(a) Low subgrade strength
(b) High subgrade strength
Figure 4-11. Impacts of traffic level and reliability on asphalt pavement thickness
given low and high subgrade strength and design life of 20 years
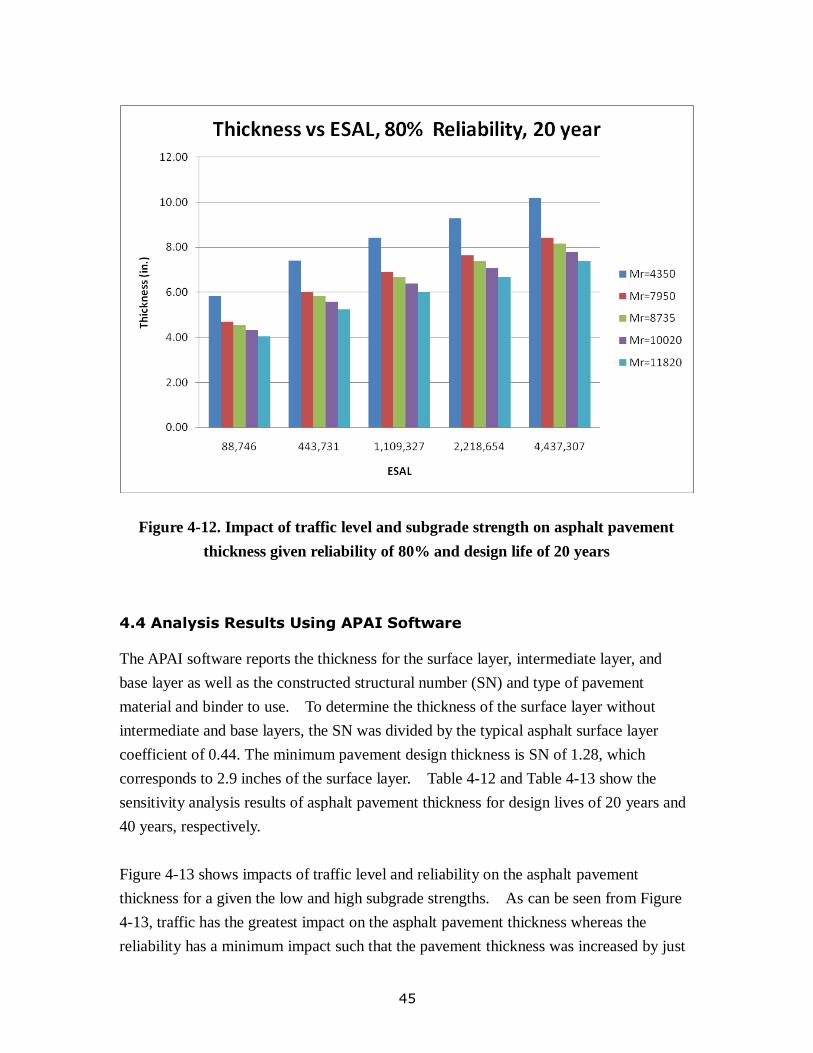
45
Figure 4-12. Impact of traffic level and subgrade strength on asphalt pavement
thickness given reliability of 80% and design life of 20 years
4.4 Analysis Results Using APAI Software
The APAI software reports the thickness for the surface layer, intermediate layer, and
base layer as well as the constructed structural number (SN) and type of pavement
material and binder to use. To determine the thickness of the surface layer without
intermediate and base layers, the SN was divided by the typical asphalt surface layer
coefficient of 0.44. The minimum pavement design thickness is SN of 1.28, which
corresponds to 2.9 inches of the surface layer. Table 4-12 and Table 4-13 show the
sensitivity analysis results of asphalt pavement thickness for design lives of 20 years and
40 years, respectively.
Figure 4-13 shows impacts of traffic level and reliability on the asphalt pavement
thickness for a given the low and high subgrade strengths. As can be seen from Figure
4-13, traffic has the greatest impact on the asphalt pavement thickness whereas the
reliability has a minimum impact such that the pavement thickness was increased by just

46
0.5 inch when the reliability increased from 80% to 90%.
Figure 4-14 shows impacts of the traffic level and subgrade strength on asphalt pavement
thickness for a given the reliability of 80% and design life of 20 years. The asphalt
pavement thickness was more sensitive to the subgrade strength at the high traffic level
by decreasing the thickness by up to 4.0 inches. As shown in Figure 4-15, there seems
to be an error in determining the A-3 subgrade strength where the A-3 subgrade exhibited
a sharp increase in the CBR value.
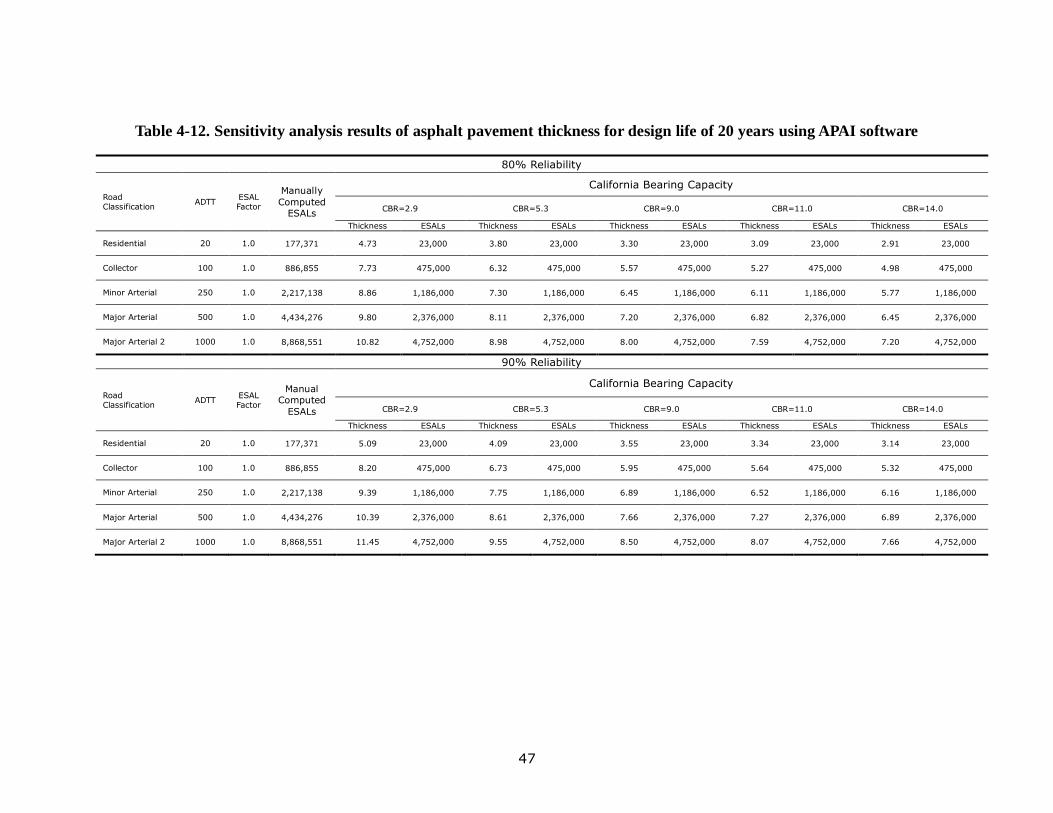
47
Table 4-12. Sensitivity analysis results of asphalt pavement thickness for design life of 20 years using APAI software
80% Reliability
Road Classification
ADTT ESAL Factor
Manually
Computed ESALs
California Bearing Capacity
CBR=2.9 CBR=5.3 CBR=9.0 CBR=11.0 CBR=14.0
Thickness ESALs Thickness ESALs Thickness ESALs Thickness ESALs Thickness ESALs
Residential 20 1.0 177,371 4.73 23,000 3.80 23,000 3.30 23,000 3.09 23,000 2.91 23,000
Collector 100 1.0 886,855 7.73 475,000 6.32 475,000 5.57 475,000 5.27 475,000 4.98 475,000
Minor Arterial 250 1.0 2,217,138 8.86 1,186,000 7.30 1,186,000 6.45 1,186,000 6.11 1,186,000 5.77 1,186,000
Major Arterial 500 1.0 4,434,276 9.80 2,376,000 8.11 2,376,000 7.20 2,376,000 6.82 2,376,000 6.45 2,376,000
Major Arterial 2 1000 1.0 8,868,551 10.82 4,752,000 8.98 4,752,000 8.00 4,752,000 7.59 4,752,000 7.20 4,752,000
90% Reliability
Road Classification
ADTT ESAL Factor
Manual Computed
ESALs
California Bearing Capacity
CBR=2.9 CBR=5.3 CBR=9.0 CBR=11.0 CBR=14.0
Thickness ESALs Thickness ESALs Thickness ESALs Thickness ESALs Thickness ESALs
Residential 20 1.0 177,371 5.09 23,000 4.09 23,000 3.55 23,000 3.34 23,000 3.14 23,000
Collector 100 1.0 886,855 8.20 475,000 6.73 475,000 5.95 475,000 5.64 475,000 5.32 475,000
Minor Arterial 250 1.0 2,217,138 9.39 1,186,000 7.75 1,186,000 6.89 1,186,000 6.52 1,186,000 6.16 1,186,000
Major Arterial 500 1.0 4,434,276 10.39 2,376,000 8.61 2,376,000 7.66 2,376,000 7.27 2,376,000 6.89 2,376,000
Major Arterial 2 1000 1.0 8,868,551 11.45 4,752,000 9.55 4,752,000 8.50 4,752,000 8.07 4,752,000 7.66 4,752,000
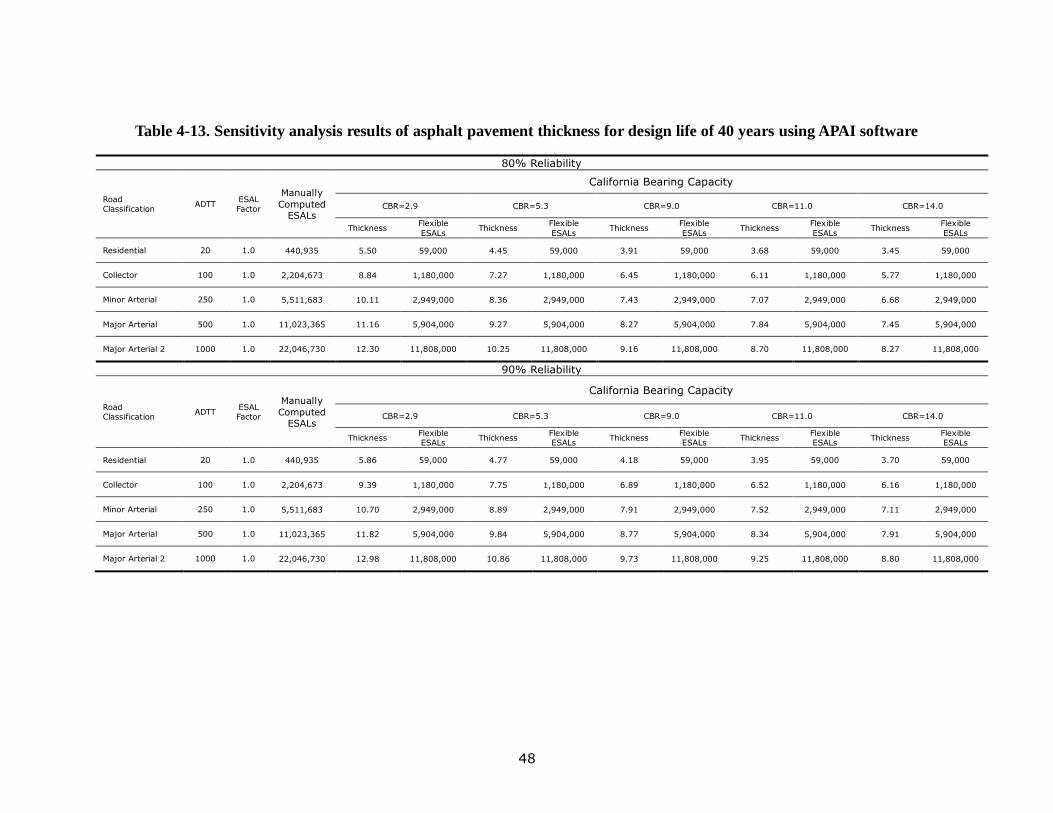
48
Table 4-13. Sensitivity analysis results of asphalt pavement thickness for design life of 40 years using APAI software
80% Reliability
Road Classification
ADTT ESAL Factor
Manually
Computed ESALs
California Bearing Capacity
CBR=2.9 CBR=5.3 CBR=9.0 CBR=11.0 CBR=14.0
Thickness Flexible
ESALs Thickness
Flexible
ESALs Thickness
Flexible
ESALs Thickness
Flexible
ESALs Thickness
Flexible
ESALs
Residential 20 1.0 440,935 5.50 59,000 4.45 59,000 3.91 59,000 3.68 59,000 3.45 59,000
Collector 100 1.0 2,204,673 8.84 1,180,000 7.27 1,180,000 6.45 1,180,000 6.11 1,180,000 5.77 1,180,000
Minor Arterial 250 1.0 5,511,683 10.11 2,949,000 8.36 2,949,000 7.43 2,949,000 7.07 2,949,000 6.68 2,949,000
Major Arterial 500 1.0 11,023,365 11.16 5,904,000 9.27 5,904,000 8.27 5,904,000 7.84 5,904,000 7.45 5,904,000
Major Arterial 2 1000 1.0 22,046,730 12.30 11,808,000 10.25 11,808,000 9.16 11,808,000 8.70 11,808,000 8.27 11,808,000
90% Reliability
Road Classification
ADTT ESAL Factor
Manually
Computed ESALs
California Bearing Capacity
CBR=2.9 CBR=5.3 CBR=9.0 CBR=11.0 CBR=14.0
Thickness Flexible ESALs
Thickness Flexible ESALs
Thickness Flexible ESALs
Thickness Flexible ESALs
Thickness Flexible ESALs
Residential 20 1.0 440,935 5.86 59,000 4.77 59,000 4.18 59,000 3.95 59,000 3.70 59,000
Collector 100 1.0 2,204,673 9.39 1,180,000 7.75 1,180,000 6.89 1,180,000 6.52 1,180,000 6.16 1,180,000
Minor Arterial 250 1.0 5,511,683 10.70 2,949,000 8.89 2,949,000 7.91 2,949,000 7.52 2,949,000 7.11 2,949,000
Major Arterial 500 1.0 11,023,365 11.82 5,904,000 9.84 5,904,000 8.77 5,904,000 8.34 5,904,000 7.91 5,904,000
Major Arterial 2 1000 1.0 22,046,730 12.98 11,808,000 10.86 11,808,000 9.73 11,808,000 9.25 11,808,000 8.80 11,808,000
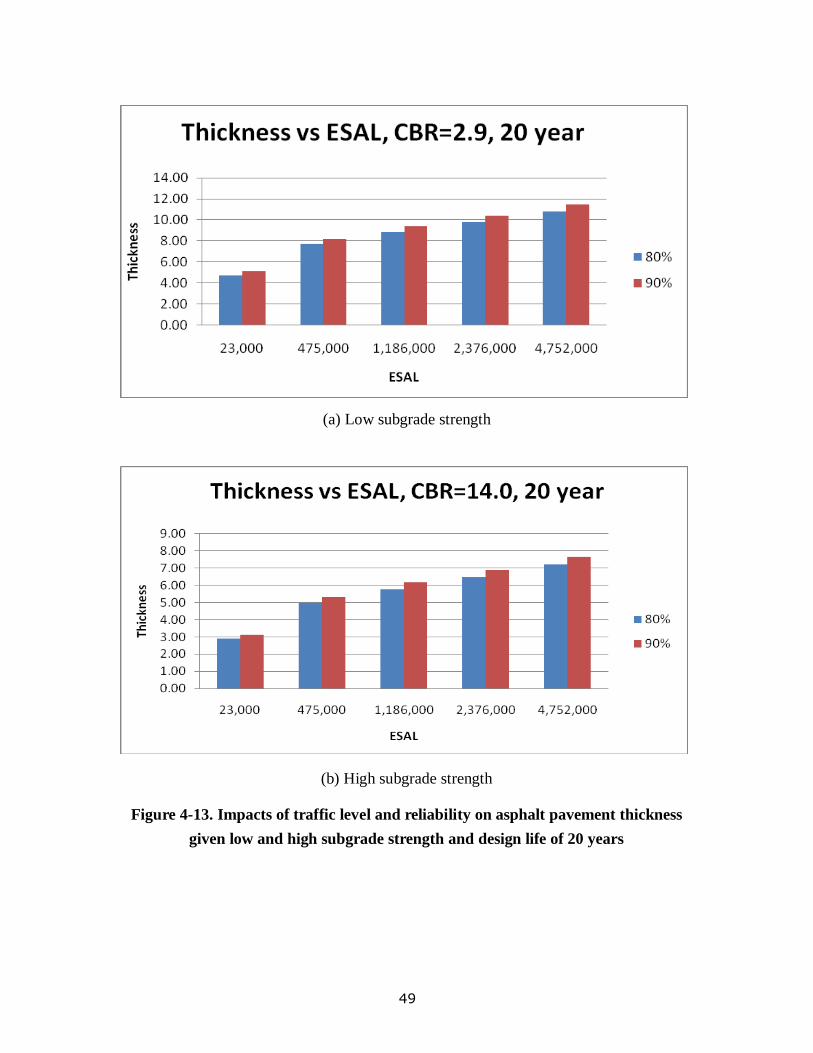
49
(a) Low subgrade strength
(b) High subgrade strength
Figure 4-13. Impacts of traffic level and reliability on asphalt pavement thickness
given low and high subgrade strength and design life of 20 years
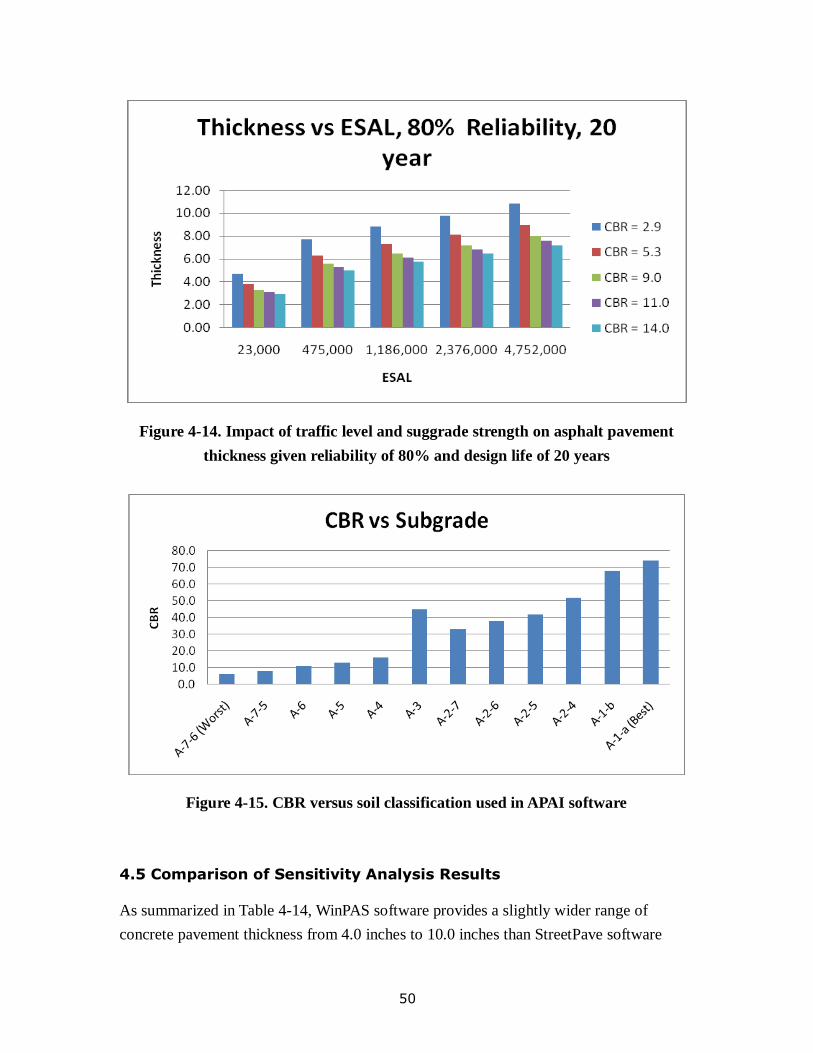
50
Figure 4-14. Impact of traffic level and suggrade strength on asphalt pavement
thickness given reliability of 80% and design life of 20 years
Figure 4-15. CBR versus soil classification used in APAI software
4.5 Comparison of Sensitivity Analysis Results
As summarized in Table 4-14, WinPAS software provides a slightly wider range of
concrete pavement thickness from 4.0 inches to 10.0 inches than StreetPave software
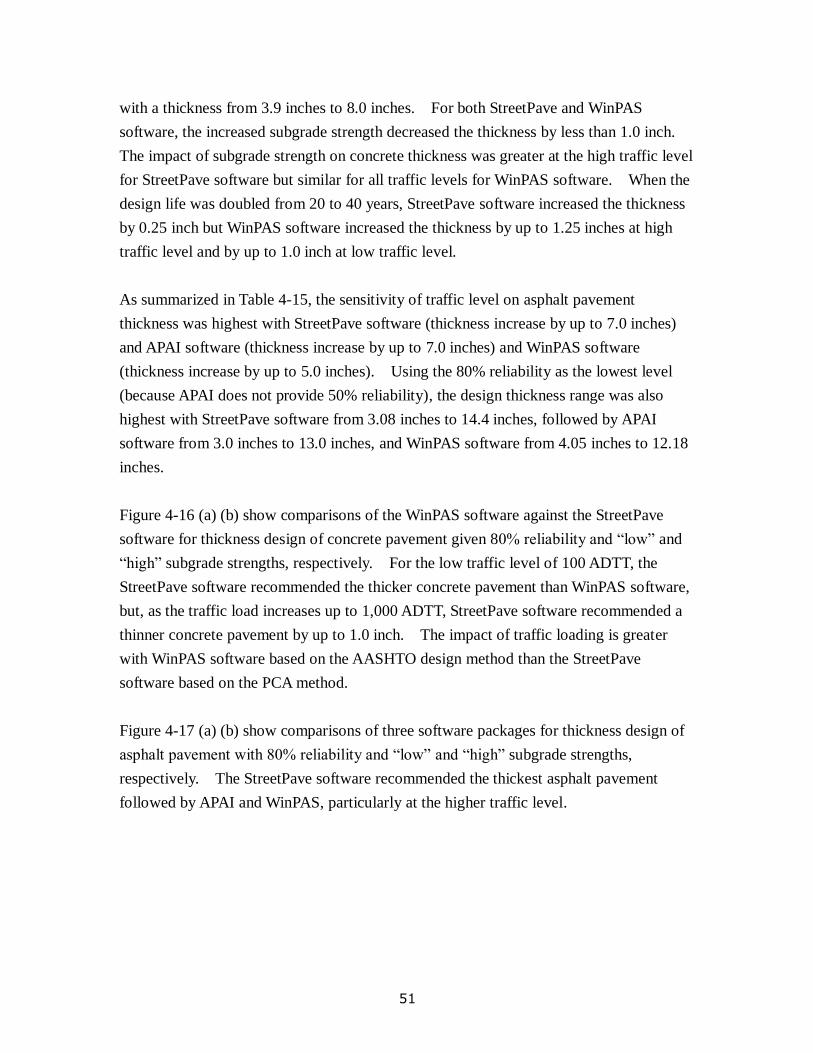
51
with a thickness from 3.9 inches to 8.0 inches. For both StreetPave and WinPAS
software, the increased subgrade strength decreased the thickness by less than 1.0 inch.
The impact of subgrade strength on concrete thickness was greater at the high traffic level
for StreetPave software but similar for all traffic levels for WinPAS software. When the
design life was doubled from 20 to 40 years, StreetPave software increased the thickness
by 0.25 inch but WinPAS software increased the thickness by up to 1.25 inches at high
traffic level and by up to 1.0 inch at low traffic level.
As summarized in Table 4-15, the sensitivity of traffic level on asphalt pavement
thickness was highest with StreetPave software (thickness increase by up to 7.0 inches)
and APAI software (thickness increase by up to 7.0 inches) and WinPAS software
(thickness increase by up to 5.0 inches). Using the 80% reliability as the lowest level
(because APAI does not provide 50% reliability), the design thickness range was also
highest with StreetPave software from 3.08 inches to 14.4 inches, followed by APAI
software from 3.0 inches to 13.0 inches, and WinPAS software from 4.05 inches to 12.18
inches.
Figure 4-16 (a) (b) show comparisons of the WinPAS software against the StreetPave
software for thickness design of concrete pavement given 80% reliability and “low” and
“high” subgrade strengths, respectively. For the low traffic level of 100 ADTT, the
StreetPave software recommended the thicker concrete pavement than WinPAS software,
but, as the traffic load increases up to 1,000 ADTT, StreetPave software recommended a
thinner concrete pavement by up to 1.0 inch. The impact of traffic loading is greater
with WinPAS software based on the AASHTO design method than the StreetPave
software based on the PCA method.
Figure 4-17 (a) (b) show comparisons of three software packages for thickness design of
asphalt pavement with 80% reliability and “low” and “high” subgrade strengths,
respectively. The StreetPave software recommended the thickest asphalt pavement
followed by APAI and WinPAS, particularly at the higher traffic level.
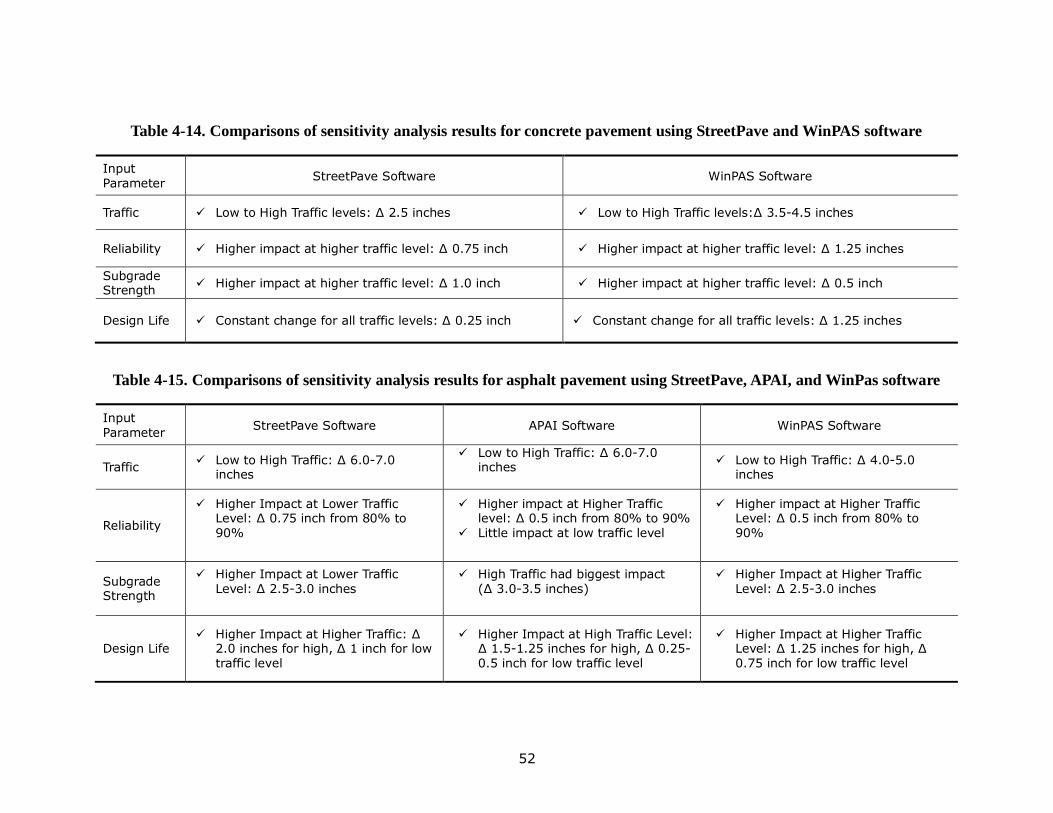
52
Table 4-14. Comparisons of sensitivity analysis results for concrete pavement using StreetPave and WinPAS software
Input Parameter
StreetPave Software WinPAS Software
Traffic Low to High Traffic levels: ∆ 2.5 inches Low to High Traffic levels:∆ 3.5-4.5 inches
Reliability Higher impact at higher traffic level: ∆ 0.75 inch Higher impact at higher traffic level: ∆ 1.25 inches
Subgrade Strength
Higher impact at higher traffic level: ∆ 1.0 inch Higher impact at higher traffic level: ∆ 0.5 inch
Design Life Constant change for all traffic levels: ∆ 0.25 inch Constant change for all traffic levels: ∆ 1.25 inches
Table 4-15. Comparisons of sensitivity analysis results for asphalt pavement using StreetPave, APAI, and WinPas software
Input Parameter
StreetPave Software APAI Software WinPAS Software
Traffic Low to High Traffic: ∆ 6.0-7.0
inches
Low to High Traffic: ∆ 6.0-7.0 inches
Low to High Traffic: ∆ 4.0-5.0 inches
Reliability
Higher Impact at Lower Traffic Level: ∆ 0.75 inch from 80% to 90%
Higher impact at Higher Traffic level: ∆ 0.5 inch from 80% to 90%
Little impact at low traffic level
Higher impact at Higher Traffic Level: ∆ 0.5 inch from 80% to 90%
Subgrade Strength
Higher Impact at Lower Traffic Level: ∆ 2.5-3.0 inches
High Traffic had biggest impact (∆ 3.0-3.5 inches)
Higher Impact at Higher Traffic Level: ∆ 2.5-3.0 inches
Design Life Higher Impact at Higher Traffic: ∆
2.0 inches for high, ∆ 1 inch for low traffic level
Higher Impact at High Traffic Level: ∆ 1.5-1.25 inches for high, ∆ 0.25-0.5 inch for low traffic level
Higher Impact at Higher Traffic Level: ∆ 1.25 inches for high, ∆ 0.75 inch for low traffic level
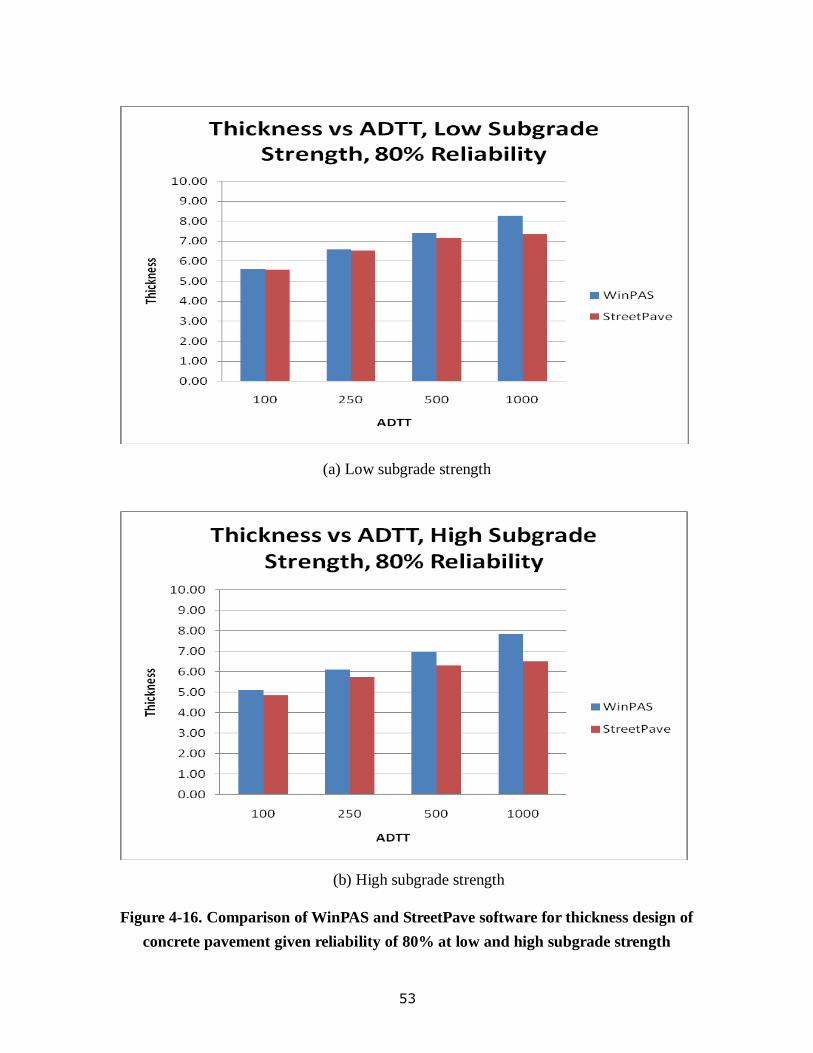
53
(a) Low subgrade strength
(b) High subgrade strength
Figure 4-16. Comparison of WinPAS and StreetPave software for thickness design of
concrete pavement given reliability of 80% at low and high subgrade strength
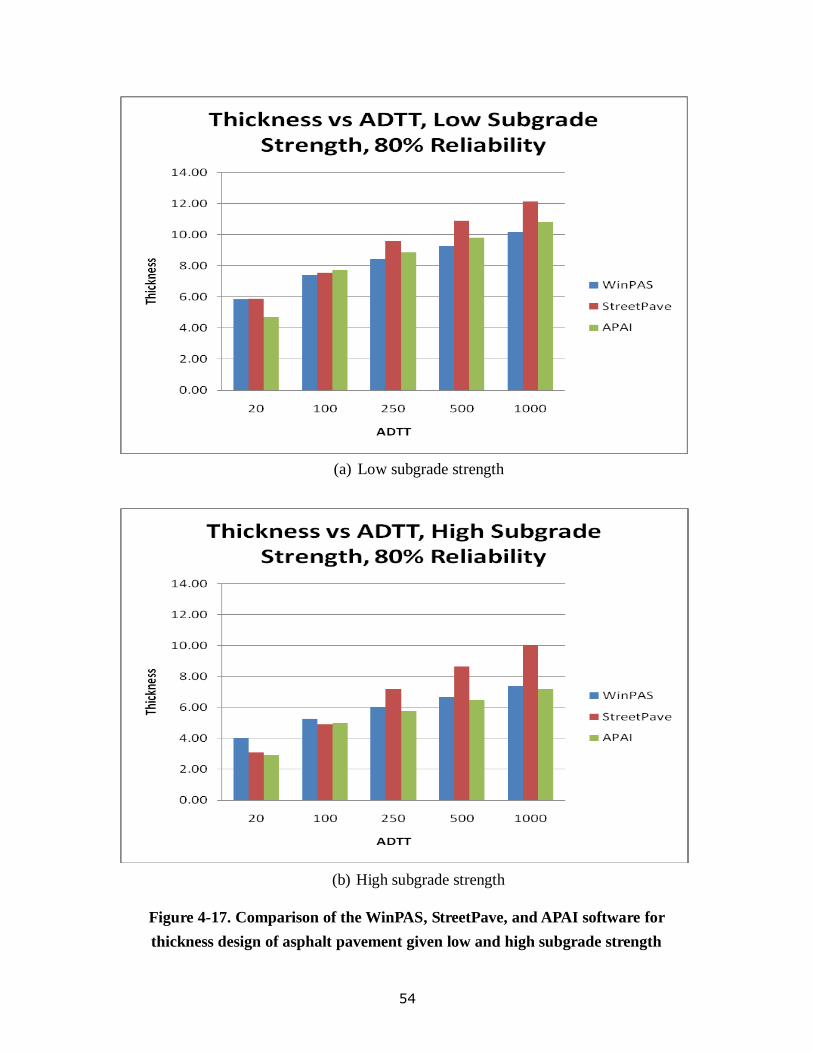
54
(a) Low subgrade strength
(b) High subgrade strength
Figure 4-17. Comparison of the WinPAS, StreetPave, and APAI software for
thickness design of asphalt pavement given low and high subgrade strength
55
5. DEVELOPMENT OF PROTOTYPE PAVEMENT DESIGN
AND SENSITIVITY ANALYSIS SOFTWARE
As discussed earlier, there exist a number of pavement design software packages that
generate different thicknesses for the given condition. Some pavement design software
packages takes a significant amount of time to run without providing a user with a design
value. In addition, most of these pavement design software packages do not give a user
an option to perform the design sensitivity analysis by generating multiple designs by
automatically varying input values.
The main purpose of this prototype pavement design and sensitivity analysis (PD&SA)
software is to store the pavement design values in the database so that a user can perform
the pavement design by retrieving the pavement design values from the database without
running the actual pavement design programs.
First, a number of pavement design values were generated by running different pavement
design software packages by varying input parameters. Second, the generated pavement
design values were stored in the database. Third, the pavement design and sensitivity
analysis (PD&SA) software was then developed to retrieve the pavement design data
from the database and perform a sensitivity analysis with respect to various design input
parameters.
5.1 Literature Review on Pavement Design and Sensitivity Analysis
Software
PAvement Design system for new and existing Asphalt Pavements (PADAP) pavement
simulation software was developed aiming for designing new pavements and
reconstruction/ rehabilitation of existing ones considering axle loads, environmental
conditions and seasonal nonlinear material properties of unbound granular layers and
subgrade soils (Uddin and Ricalde 2000). The PADAP program is intended to evaluate
asphalt pavement performance models by simulating seasonal temperature variations,
moisture content predictions, and axle load configurations.
The Federal Aviation Administration (FAA) developed new airfield pavement design
56
software named FAARFIELD (FAA Rigid and Flexible Iterative Elastic Layered Design).
It incorporates three-dimensional finite element (3D-FE) stress computation for design of
new rigid pavements (Brill 2004). The sensitivity analysis can be performed to compare
the new design method against the previous design method, LEDFAA (Layered Elastic
Design FAA), which was developed based on 1970’s full-scale tests (McQueen and Guo
2004).
The National Cooperative Highway Research Program initiated NCHRP 1-37A project to
develop a pavement design software based on 2002 Mechanistic-Empirical Pavement
Design Guide (M-EPDG) (ARA 2004). It is intended to be user-friendly software and
provide pavement designers with answers to analyze not to design pavements. It asks a
user to enter the pavement design thickness and expect a user to do a trial and error
procedure until the design entered by a user satisfies the performance requirement. The
software adopted hierarchical approach to design inputs to provide the designer with a lot
of flexibility in obtaining the design inputs. In addition, the software has very limited
capability in performing the design sensitivity analysis except for drainage requirements.
Efforts have been made to analyze unbound granular layer of the flexible pavement
structure of the 2002 M-EPDG software (Masad and Little 2004). It was found that the
fatigue life predicted using the nonlinear anisotropic approach is higher than the life
predicted using the nonlinear isotropic approach. The sensitivity analysis of the 2002
M-EPDG model showed that the base modulus and thickness have significant influence
on the international roughness index and the longitudinal cracking.
Kannekanti and Harvey (2005, 2006) performed the sensitivity analysis of 2002 M-
EPDG rigid pavement distress prediction models. They ran 2002 M-EPDG software for
all combinations of the key variables including traffic volume, axle load distribution,
climate zone, thickness, shoulder type, joint spacing, load transfer efficiency, concrete
strength, base type, and subgrade type. They concluded that the 2002 M-EPDG
produces reasonable predictions of rigid pavement performance. However, it was stated
that some of the inputs required by the software are hard to obtain such that the designer
has to rely on default values suggested by the design guide or use approximate values.
Schwartz (2007) compared the 2002 M-EPDG pavement designs with 1993 AASHTO
design method and performed the sensitivity analysis of the 2002 M-EPDG pavement
design guide by varying the key design input parameters. It was reported that 2002 M-
EPDG underestimated the performance of pavements in warm locations compared to
1993 AASHTO guide. Particularly, it was discovered that the sensitivity of predicted
57
performance to the distress model calibration coefficients is much greater than for most
other design parameters considered in their study.
5.2 Prototype Pavement Design and Sensitivity Analysis Software
The PD&SA software is a computer program that combines pavement design function
and sensitivity analysis capability. The user interface is designed for the pavement
designer to enter pavement design data, which were generated using the existing software
packages, into database. When a user enters the input parameters, the PD&SA software
retrieves the most appropriate pavement design from the database for the given condition.
At the same time, the software produces graphs of multiple designs for various input
parameters that would allow a user to consider different design thicknesses for varying
input values. The PD&SA software works as a design database and provides the user
with an easy-to-use tool for pavements design and sensitivity analysis.
The PD&SA software consists of four modules: asphalt pavement design, concrete
pavement design, input pavement design data and run sensitivity analysis. The asphalt
and concrete pavement design modules provide the user with a tool to query the design
database. The design data input module provides a spreadsheet user interface to input
design data and the sensitivity analysis module provides a graphic user interface to run a
sensitivity analysis.
The PD&SA software was developed using the Microsoft Visual Studio 2008 and .NET
class libraries that were designed based on Object-Oriented Programming (OOP)
principles. Figure 5-1 shows the class diagram of PD&SA software which provides
quick access to methods, properties, and fields of each class. The “Program” class is the
entry point of the program and runs “MainForm” class. If the user sets to display
“Welcome” dialog, the “StartUpForm” will show up at the startup to provide shortcuts to
frequently used modules. The “AcpNewForm” class contains parameters for asphalt
pavement design. It queries asphalt pavement design data with user input and displays
its result. “Print” button on this form displays design report which can be exported in
PDF, Excel, and Text formats. The “DesignDataInputForm” class provides an interface
for the user to input design data. The “SensitivityForm” class is designed to run
sensitivity analysis and display charts with its results. “DesignLifeForm”,
“ReliabilityForm”, “TrafficForm”, “PropertiesForm”, “SubbaseForm” classes provide
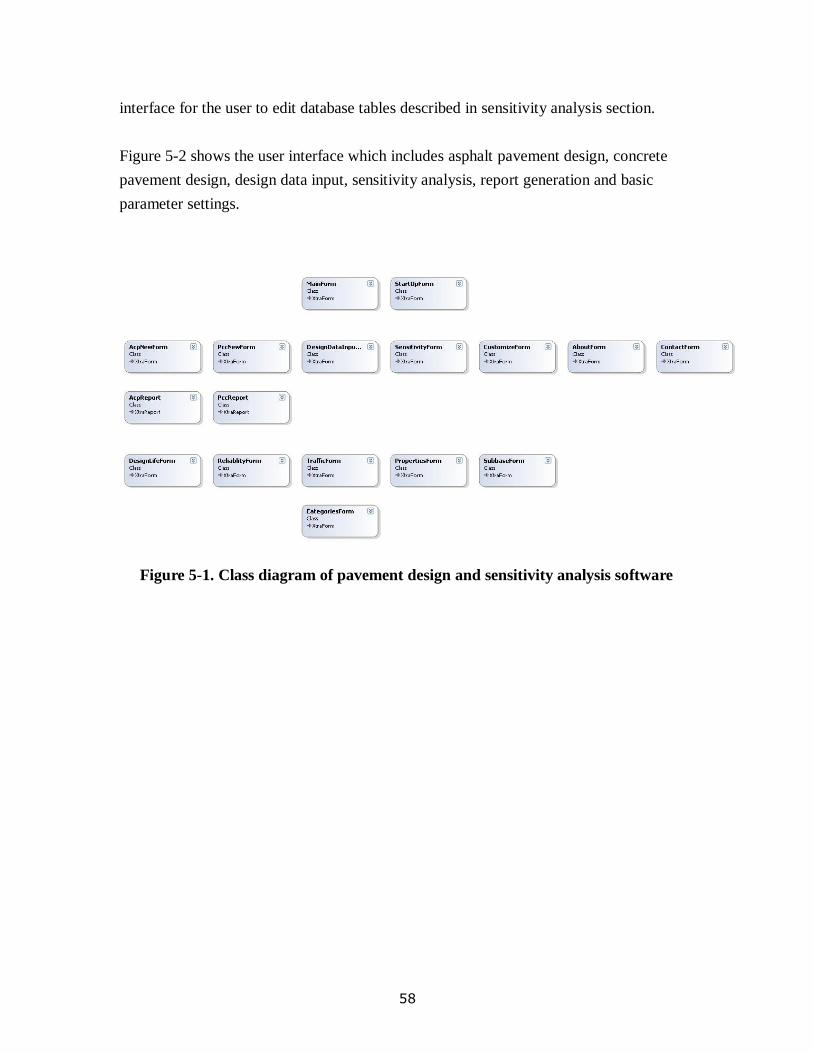
58
interface for the user to edit database tables described in sensitivity analysis section.
Figure 5-2 shows the user interface which includes asphalt pavement design, concrete
pavement design, design data input, sensitivity analysis, report generation and basic
parameter settings.
Figure 5-1. Class diagram of pavement design and sensitivity analysis software
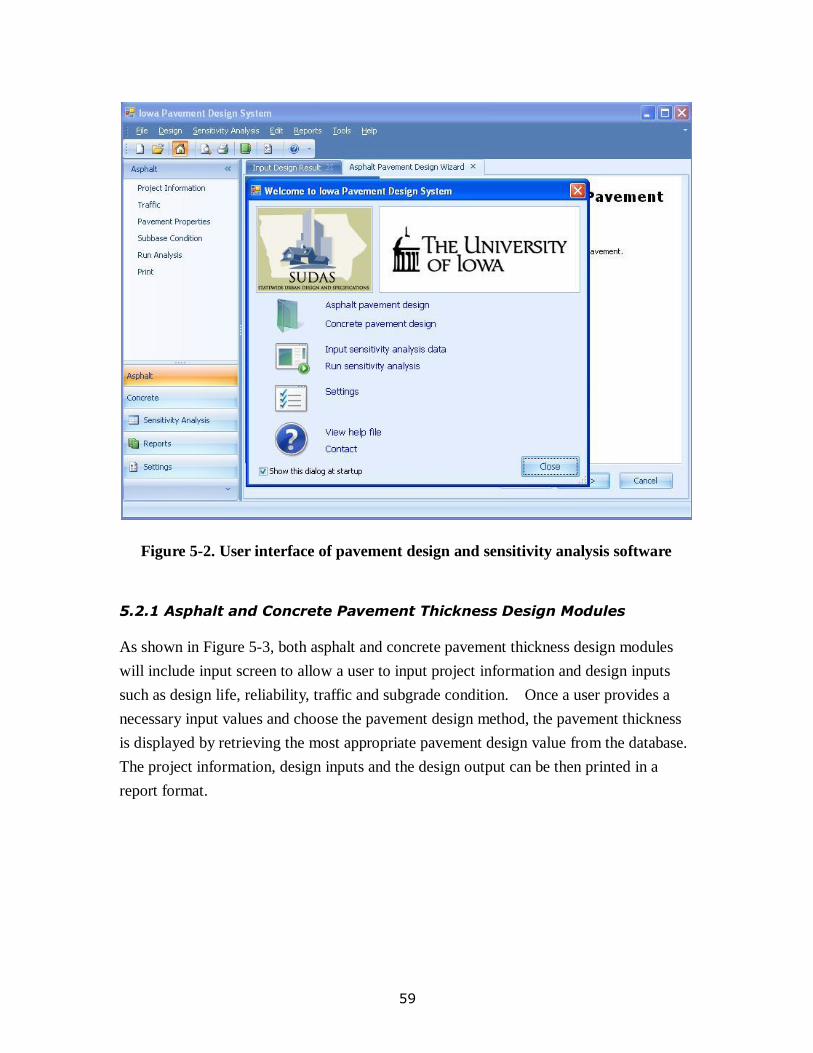
59
Figure 5-2. User interface of pavement design and sensitivity analysis software
5.2.1 Asphalt and Concrete Pavement Thickness Design Modules
As shown in Figure 5-3, both asphalt and concrete pavement thickness design modules
will include input screen to allow a user to input project information and design inputs
such as design life, reliability, traffic and subgrade condition. Once a user provides a
necessary input values and choose the pavement design method, the pavement thickness
is displayed by retrieving the most appropriate pavement design value from the database.
The project information, design inputs and the design output can be then printed in a
report format.
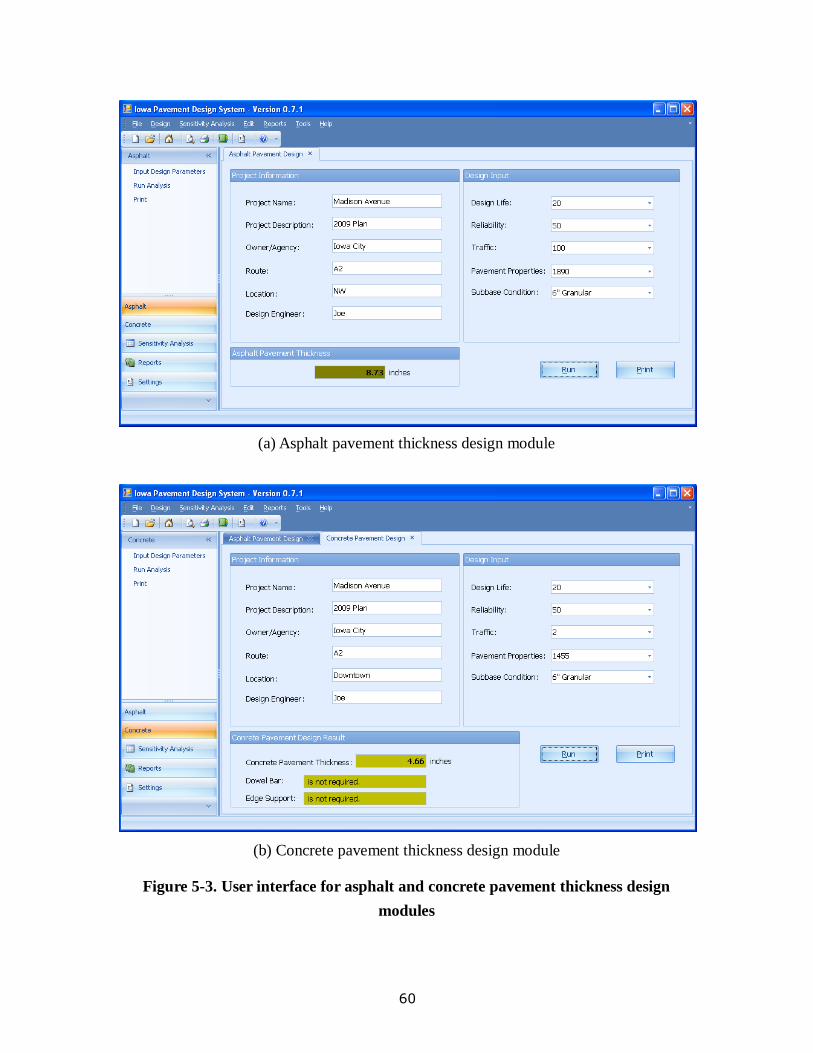
60
(a) Asphalt pavement thickness design module
(b) Concrete pavement thickness design module
Figure 5-3. User interface for asphalt and concrete pavement thickness design
modules
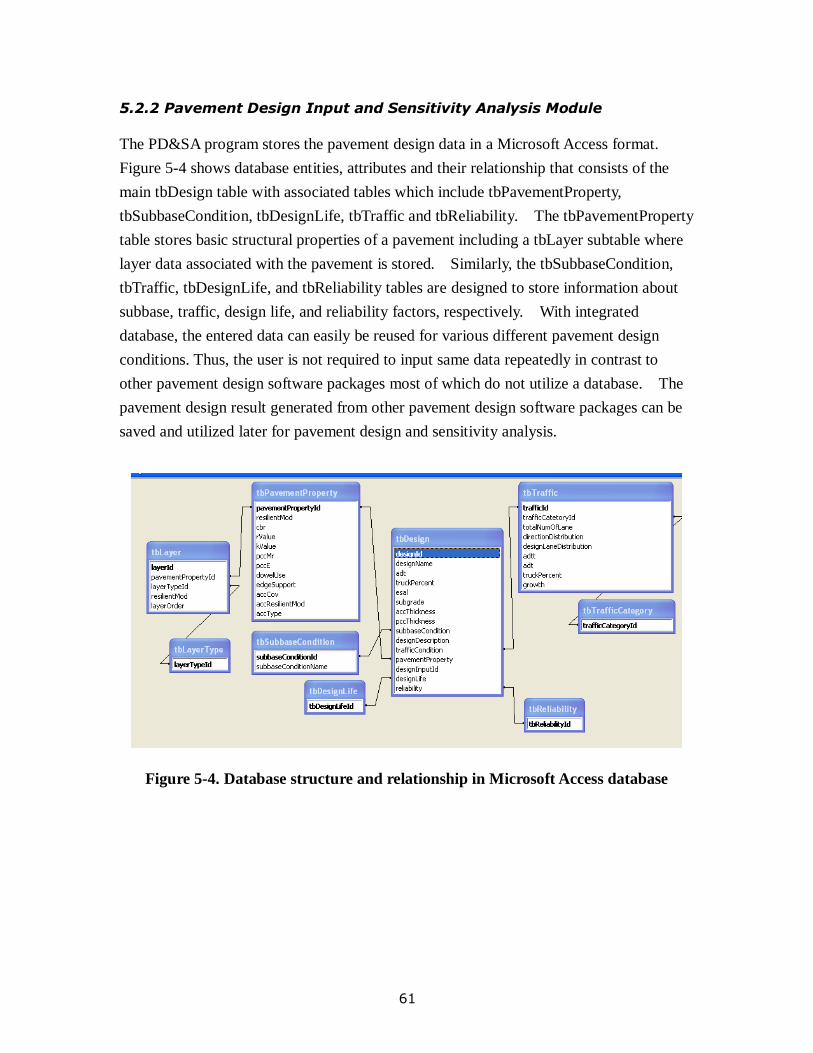
61
5.2.2 Pavement Design Input and Sensitivity Analysis Module
The PD&SA program stores the pavement design data in a Microsoft Access format.
Figure 5-4 shows database entities, attributes and their relationship that consists of the
main tbDesign table with associated tables which include tbPavementProperty,
tbSubbaseCondition, tbDesignLife, tbTraffic and tbReliability. The tbPavementProperty
table stores basic structural properties of a pavement including a tbLayer subtable where
layer data associated with the pavement is stored. Similarly, the tbSubbaseCondition,
tbTraffic, tbDesignLife, and tbReliability tables are designed to store information about
subbase, traffic, design life, and reliability factors, respectively. With integrated
database, the entered data can easily be reused for various different pavement design
conditions. Thus, the user is not required to input same data repeatedly in contrast to
other pavement design software packages most of which do not utilize a database. The
pavement design result generated from other pavement design software packages can be
saved and utilized later for pavement design and sensitivity analysis.
Figure 5-4. Database structure and relationship in Microsoft Access database
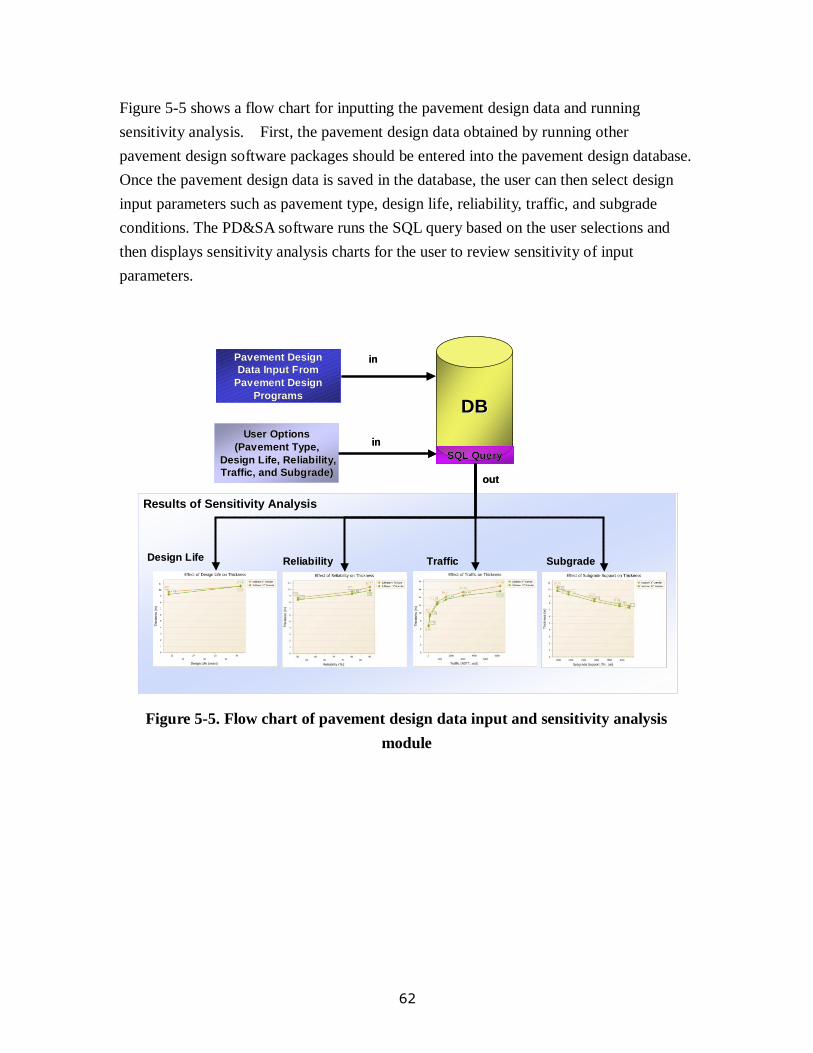
62
Figure 5-5 shows a flow chart for inputting the pavement design data and running
sensitivity analysis. First, the pavement design data obtained by running other
pavement design software packages should be entered into the pavement design database.
Once the pavement design data is saved in the database, the user can then select design
input parameters such as pavement type, design life, reliability, traffic, and subgrade
conditions. The PD&SA software runs the SQL query based on the user selections and
then displays sensitivity analysis charts for the user to review sensitivity of input
parameters.
Results of Sensitivity AnalysisResults of Sensitivity Analysis
Pavement Design Pavement Design
Data Input From Data Input From
Pavement Design Pavement Design
ProgramsPrograms
DBDB
User Options User Options
(Pavement Type, (Pavement Type,
Design Life, Reliability, Design Life, Reliability,
Traffic, and Subgrade)Traffic, and Subgrade)outout
inin
SQL QuerySQL Query
inin
Design LifeDesign Life ReliabilityReliability TrafficTraffic SubgradeSubgrade
Figure 5-5. Flow chart of pavement design data input and sensitivity analysis
module
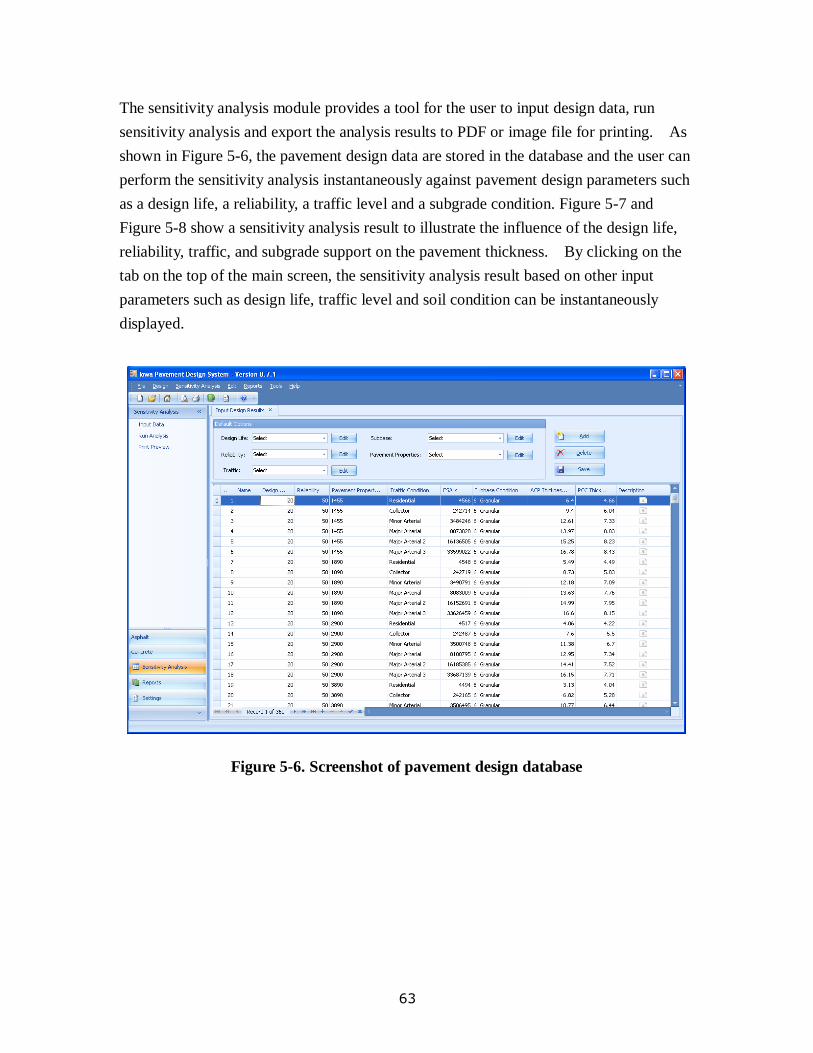
63
The sensitivity analysis module provides a tool for the user to input design data, run
sensitivity analysis and export the analysis results to PDF or image file for printing. As
shown in Figure 5-6, the pavement design data are stored in the database and the user can
perform the sensitivity analysis instantaneously against pavement design parameters such
as a design life, a reliability, a traffic level and a subgrade condition. Figure 5-7 and
Figure 5-8 show a sensitivity analysis result to illustrate the influence of the design life,
reliability, traffic, and subgrade support on the pavement thickness. By clicking on the
tab on the top of the main screen, the sensitivity analysis result based on other input
parameters such as design life, traffic level and soil condition can be instantaneously
displayed.
Figure 5-6. Screenshot of pavement design database
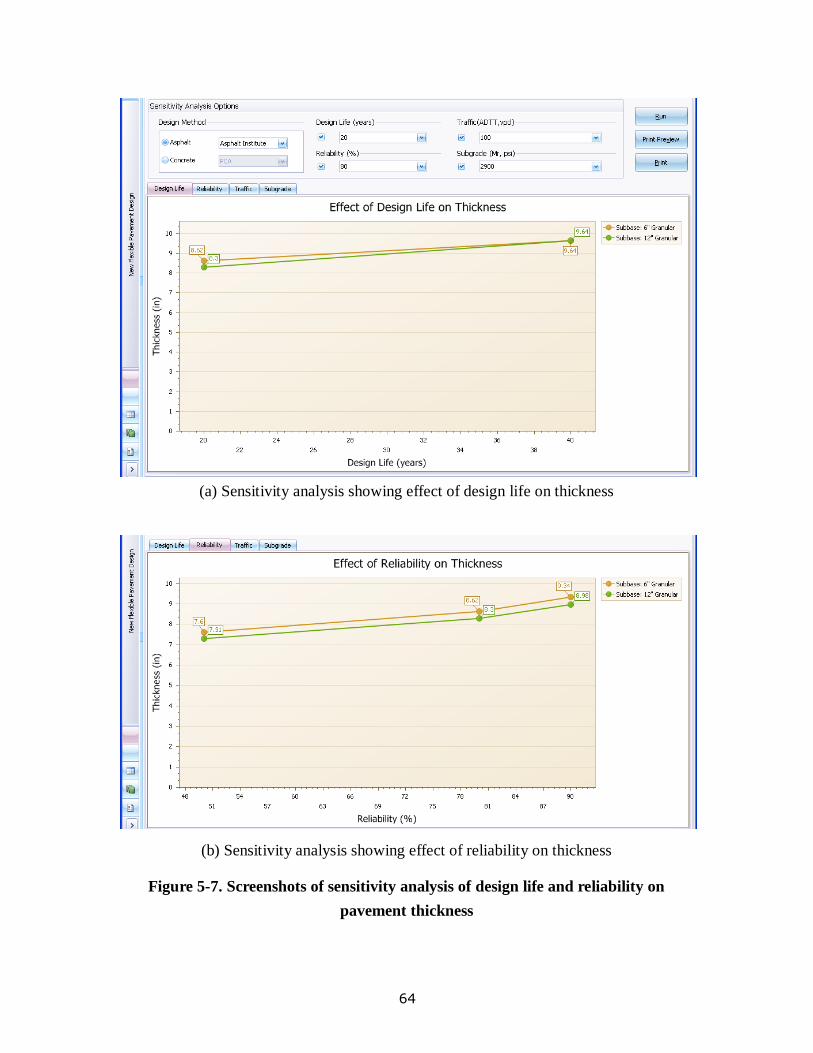
64
(a) Sensitivity analysis showing effect of design life on thickness
(b) Sensitivity analysis showing effect of reliability on thickness
Figure 5-7. Screenshots of sensitivity analysis of design life and reliability on
pavement thickness
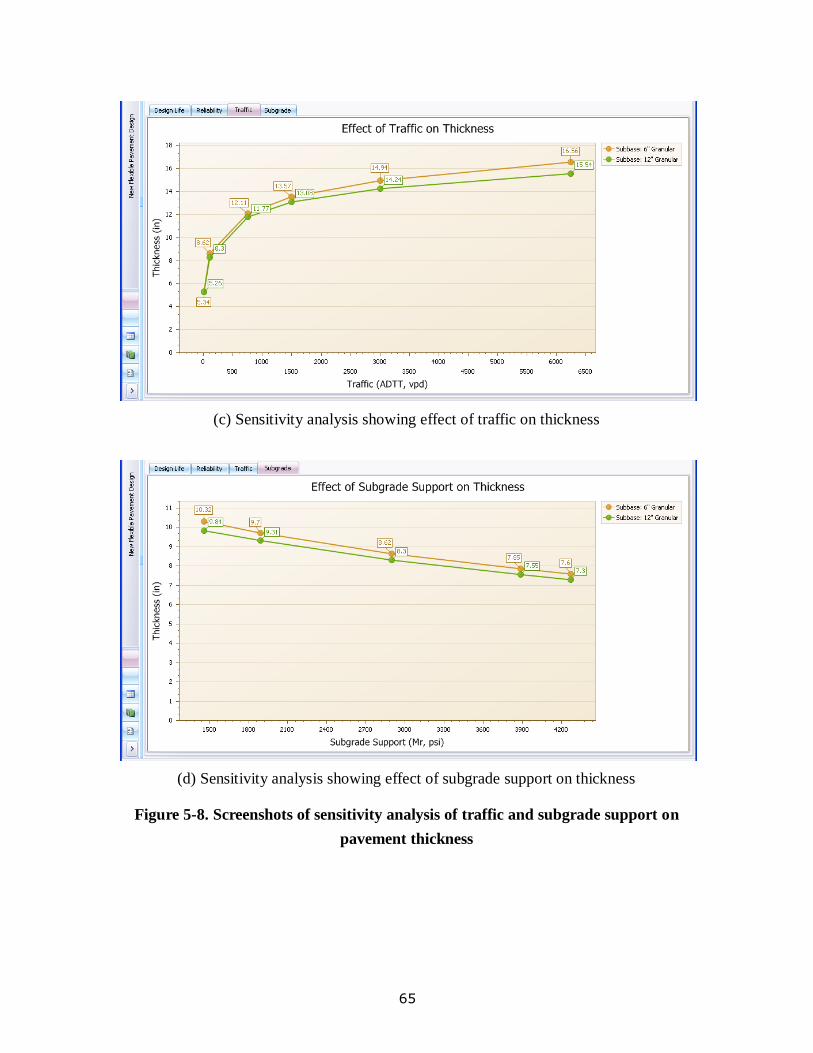
65
(c) Sensitivity analysis showing effect of traffic on thickness
(d) Sensitivity analysis showing effect of subgrade support on thickness
Figure 5-8. Screenshots of sensitivity analysis of traffic and subgrade support on
pavement thickness
66
6. SUMMARY AND CONCLUSIONS
Statewide urban design and specifications (SUDAS) currently utilizes a simplified
version of the AASHTO 1993 pavement design guide, which is conservative based on
placement of the pavement on natural subgrade, distribution of truck classifications and
other design parameters. Therefore, there is a need for a modified pavement design
methodology to be used for determining the optimum pavement thickness in local roads
in Iowa.
First, the survey was performed to identify pavement thickness design procedures for low
volume roads and common input parameters from the adjoining state departments of
transportation to Iowa. Another survey was performed to identify the minimum
pavement thicknesses under the lowest traffic level and the strongest subgrade condition
from 50 state departments of transportation.
Three pavement design software packages were compared with respect to how they were
different in determining design input parameters and their influences on the pavement
thickness. StreetPave designs the concrete pavement thickness based on the PCA method
and the equivalent asphalt pavement thickness. The WinPAS software performs both
concrete and asphalt pavement following the AASHTO 1993 design method. The APAI
software designs asphalt pavement based on pre-mechanistic/empirical AASHTO
methodology and Iowa SUDAS.
Four critical design input parameters were identified: traffic, subgrade strength, reliability
and design life. The sensitivity analysis of these four design input parameters were
performed using three pavement design software packages in order to identify which
input parameters would require the most attention during pavement design and how these
three software packages’ design outputs differ. Based on the current pavement design
procedures and sensitivity analysis results, a prototype pavement design and sensitivity
analysis (PD&SA) software package was developed to allow a user to perform pavement
design sensitivity analysis.
Conclusions
67
Based on the limited research, the following conclusions are derived:
1. A sensitivity analysis revealed that three pavement design software packages
may recommended slightly different pavement thicknesses for the similar
condition. To confirm this finding, a further analysis of ESAL’s, load transfer
factor, reliability and subgrade support is needed.
2. When the design life was doubled from 20 to 40 years, the StreetPave increased
the concrete pavement thickness by 0.25 inch whereas the WinPAS increased the
thickness by up to 1.25 inches.
3. For the same input parameters for designing asphalt pavements, the StreetPave
software recommended the thickest asphalt pavement followed by the WinPAS
and APAI software. For the high subgrade strength and low traffic level,
however, the WinPAS software recommended the thicker asphalt pavement than
the StreetPave and the APAI software.
4. Based on the sensitivity analysis result of three pavement design software
packages, the traffic level has the highest impact on both concrete and asphalt
pavement design followed by the subgrade strength, reliability and design life.
5. The prototype Pavement Design and Sensitivity Analysis (PA&SA) software
package was developed to demonstrate the concept of storing the pavement
design results in the database for a design sensitivity analysis. This final report
does not include the prototype software which will be validated and tested during
the next phase
Future Studies
1. Minimum pavement thickness survey should be conducted among engineers from
cities and counties in Iowa and surrounding states with regard their design
process and scenario. This survey should be to get “typical” pavement
thicknesses for flexible and rigid pavements from local agencies.
2. Additional sensitivity analysis using DARWIN and the Asphalt Institute software
should be performed to be compared against the sensitivity analysis results from
StreetPave, WinPas, and APAI software packages.
3. Traffic mix and its conversion to ESAL should be clarified to determine their
effects on the pavement thickness.
68
4. Traffic mix, ESAL conversion factor, equivalency of subgrade strengths should
be investigated to ensure the design inputs for each software package would
represent the equivalent traffic level and subgrade strength.
5. PD&SA software should be modified to add more design input parameters, i.e.,
edge support and dowel bar, and the updated the sensitivity analysis results from
DARWIN and Asphalt Institute software packages.
6. The PD&SA software should be modified to show the sensitivity analysis of
different pavement design values generated by various pavement design software
packages on the same screen.
7. For a given condition, the PD&SA software should provide a single pavement
design thickness value as the SUDAS standard design.
REFERENCES
AI (1983) “Asphalt Pavement Thickness Design Asphalt.” Information Series No. 181
(IS-181), Asphalt Institution, College Park, Maryland.
APAI (1990) “Asphalt Paving Design Guide.” Asphalt Paving Association of Iowa, West
Des Moines, Iowa.
AASHTO (1993) “AASHTO Guide for Design of Pavement Structures.” American
Association of State Highway and Transportation Officials, Washington, D. C.
ACPA (2006) “Design of Concrete Pavement for Street and Roads.” American Concrete
Pavement Association, Washington, D.C.
ARA, Inc and ERES Consultants Division (2004). “NCHRP 1-37A: Guide for
Mechanistic-Empirical Design of New and Rehabilitated Pavement Structures.” National
Cooperative Highway Research Program, TRB, National Research Council, Washington
D.C.
Masad, S. and Little, D. N. (2004) “Sensitivity Analysis of Flexible Pavement Response
and AASHTO 2002 Design Guide to Properties of Unbound Layers.” ICAR-504-1,
International Center for Aggregates Research, Austin, Texas.
69
Brill, D. R., Kawa, I., and Hayhoe, G. F. (2004) “Development of FAARFIELD Airport
Pavement Design Software.” Transportation Systems 2004 Workshop, Ft. Lauderdale,
Florida.
Bergeson, K. L. and Barber, A. G. (1998) “Iowa Thickness Design Guide for Low Volume
Roads Using Reclaimed Hydrated Class C Fly Ash Bases.” Transportation Conference
Proceedings, Washington D.C.
Freeme and Marais (1973) “Thin Bituminous Surfaces: Their Fatigue Behavior and
Prediction.” Special Report 140, Highway research Board, pp. 158-179.
Hall, K. D. and Bettis, J. W. (2000) “Development of Comprehensive Low-Volume
Pavement Design Procedures.” Arkansas Highway and Transportation Department,
Report No. MBTC 1070, Little Rock, Arkansas.
Hwang, Y. H. (2004). “Pavement Analysis and Design.” Prentice Hall.
Kannekanti V. and Harvey, J. (2005) “Sensitivity Analysis of 2002 Design Guide Rigid
Pavement Distress Prediction Models.” Pavement Research Center, University of
California, Davis, University of California, Berkeley.
Kannekanti V. and Harvey, J. (2006) “Sensitivity Analysis of 2002 Design Guide Distress
Prediction Models for Jointed Plain Concrete Pavement.” Transportation Research
Record 1947, TRB, National Research Council, Washington, D.C., pp. 91-100.
McQueen, R. D., and Guo, E. H. (2004) “Sensitivity Analysis of Major Parameters in
Rigid Pavement Design Procedures.” Transportation Systems 2004 Workshop, Ft.
Lauderdale, Florida.
Packard, R. G. (1973) “Design of Concrete Airport Pavement.” Portland Cement
Association (PCA), EB 050.03P, Skokie, Illinois
PCA (1984) “Thickness Design for Concrete Highway and Street Pavements.” Portland
Cement Association (PCA), EB 109P, Skokie, Illinois
Sharma, R., Stevens, L., Ceylan, H., White, D., and Schaefer, V. (2005) “Design Guide
for Improved Quality of Roadway Subgrades and Subbases.” Iowa Highway Research
Board, TR-525, Iowa DOT, Ames, Iowa.
Schwartz, C. W. (2007) “Implementation of the NCHRP 1-37A Design Guide Final
Report Volume 1: Summary of Findings and Implementation Plan.” MDSHA Project No.

70
SP0077B41 UMD FRS No. 430572, Lutherville, Maryland.
Uddin, W. and Ricalde, L. (200) “An Environmental and Load Simulation Software for
Designing Longer Lasting Asphalt Highways.” Infrastructure and Transportation,
Memphis Area Engineering Societies Conference (MAESC), Memphis, Tennessee.
71
APPENDIX
A. Minimum Pavement Thickness
B. Survey Form and Survey Responses
C. Sensitivity Analysis Results

72
Appendix A
A-1. Minimum Pavement Thickness
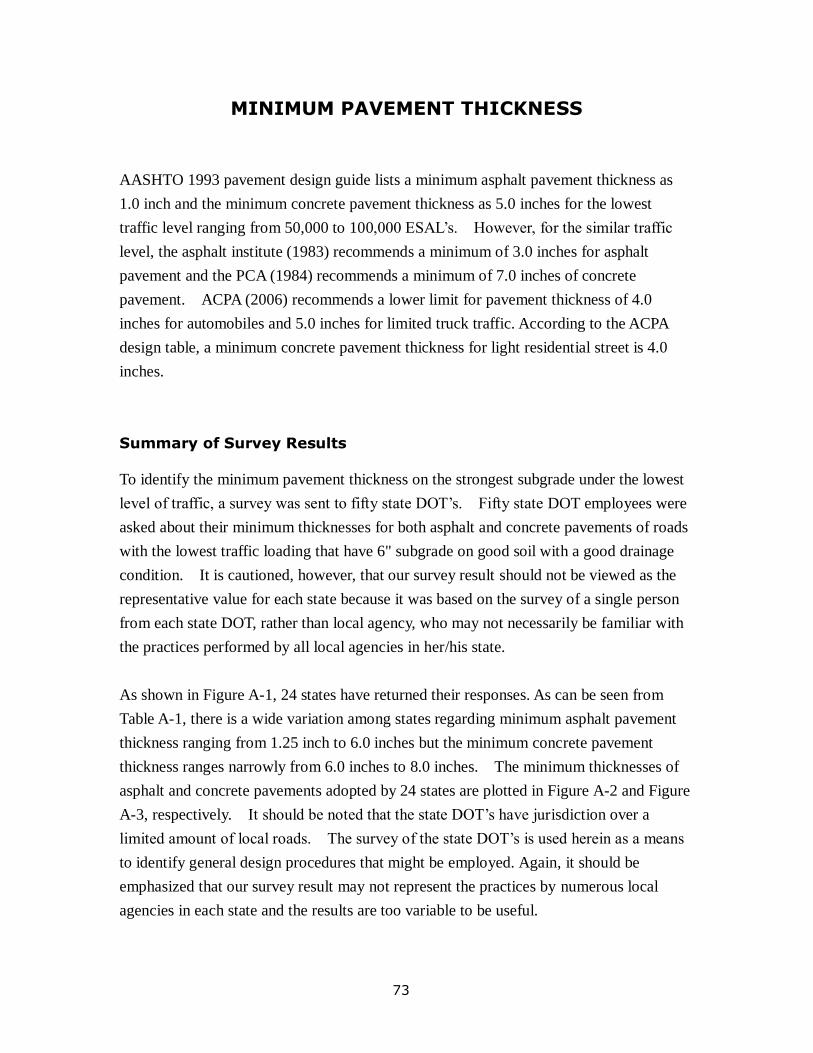
73
MINIMUM PAVEMENT THICKNESS
AASHTO 1993 pavement design guide lists a minimum asphalt pavement thickness as
1.0 inch and the minimum concrete pavement thickness as 5.0 inches for the lowest
traffic level ranging from 50,000 to 100,000 ESAL’s. However, for the similar traffic
level, the asphalt institute (1983) recommends a minimum of 3.0 inches for asphalt
pavement and the PCA (1984) recommends a minimum of 7.0 inches of concrete
pavement. ACPA (2006) recommends a lower limit for pavement thickness of 4.0
inches for automobiles and 5.0 inches for limited truck traffic. According to the ACPA
design table, a minimum concrete pavement thickness for light residential street is 4.0
inches.
Summary of Survey Results
To identify the minimum pavement thickness on the strongest subgrade under the lowest
level of traffic, a survey was sent to fifty state DOT’s. Fifty state DOT employees were
asked about their minimum thicknesses for both asphalt and concrete pavements of roads
with the lowest traffic loading that have 6" subgrade on good soil with a good drainage
condition. It is cautioned, however, that our survey result should not be viewed as the
representative value for each state because it was based on the survey of a single person
from each state DOT, rather than local agency, who may not necessarily be familiar with
the practices performed by all local agencies in her/his state.
As shown in Figure A-1, 24 states have returned their responses. As can be seen from
Table A-1, there is a wide variation among states regarding minimum asphalt pavement
thickness ranging from 1.25 inch to 6.0 inches but the minimum concrete pavement
thickness ranges narrowly from 6.0 inches to 8.0 inches. The minimum thicknesses of
asphalt and concrete pavements adopted by 24 states are plotted in Figure A-2 and Figure
A-3, respectively. It should be noted that the state DOT’s have jurisdiction over a
limited amount of local roads. The survey of the state DOT’s is used herein as a means
to identify general design procedures that might be employed. Again, it should be
emphasized that our survey result may not represent the practices by numerous local
agencies in each state and the results are too variable to be useful.
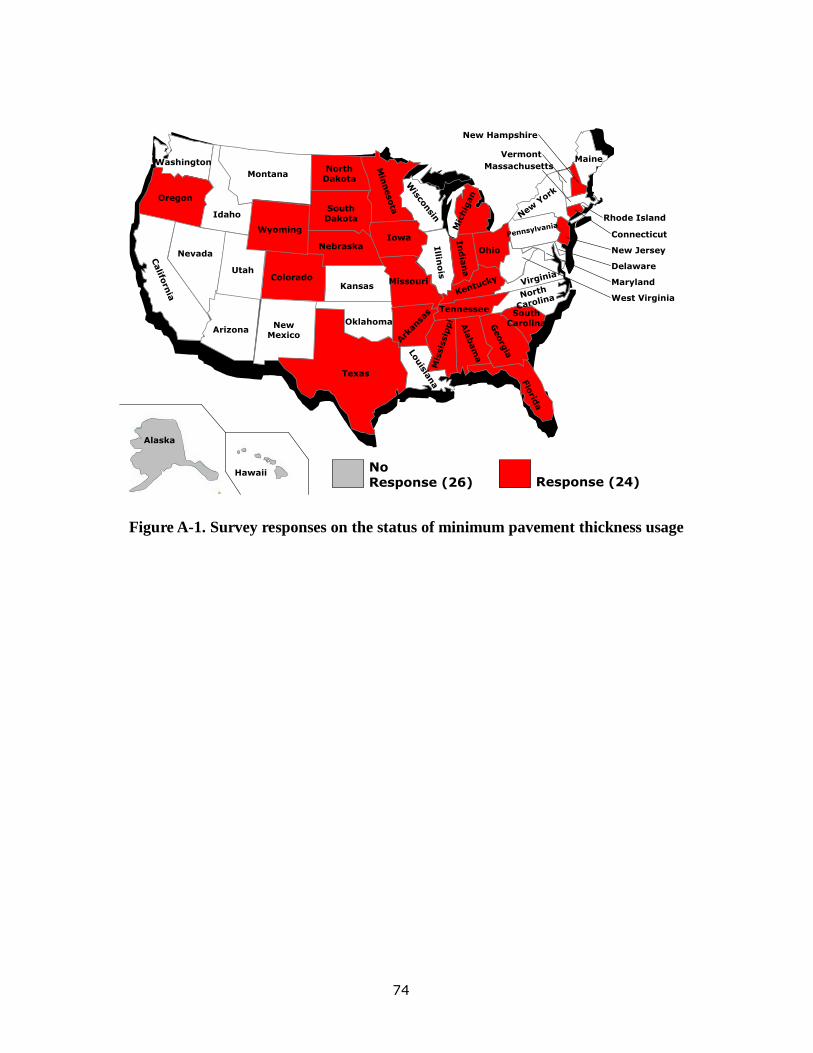
74
No Response (26) Response (24)
Ala
bam
a
Texas
Oklahoma
Louis
iana
Ark
ansa
s
KansasMissouri
Iowa
Wisco
nsin
Illin
ois
Mic
hig
an
Min
nesota
Mis
sis
sip
pi G
eorg
ia
Flo
rida
In
dia
na
Ohio
Pennsylvania
New
York
Maine
Virginia
Kentucky
North
Carolina
Tennessee South Carolina
North Dakota
South Dakota
Nebraska
New Mexico
Colorado
Washington
Oregon
Idaho
Califo
rnia
Nevada
Utah
Arizona
Alaska
Hawaii
New Hampshire
Vermont
Rhode Island
Massachusetts
Connecticut
New Jersey
Delaware
Maryland
West Virginia
Wyoming
Montana
Figure A-1. Survey responses on the status of minimum pavement thickness usage
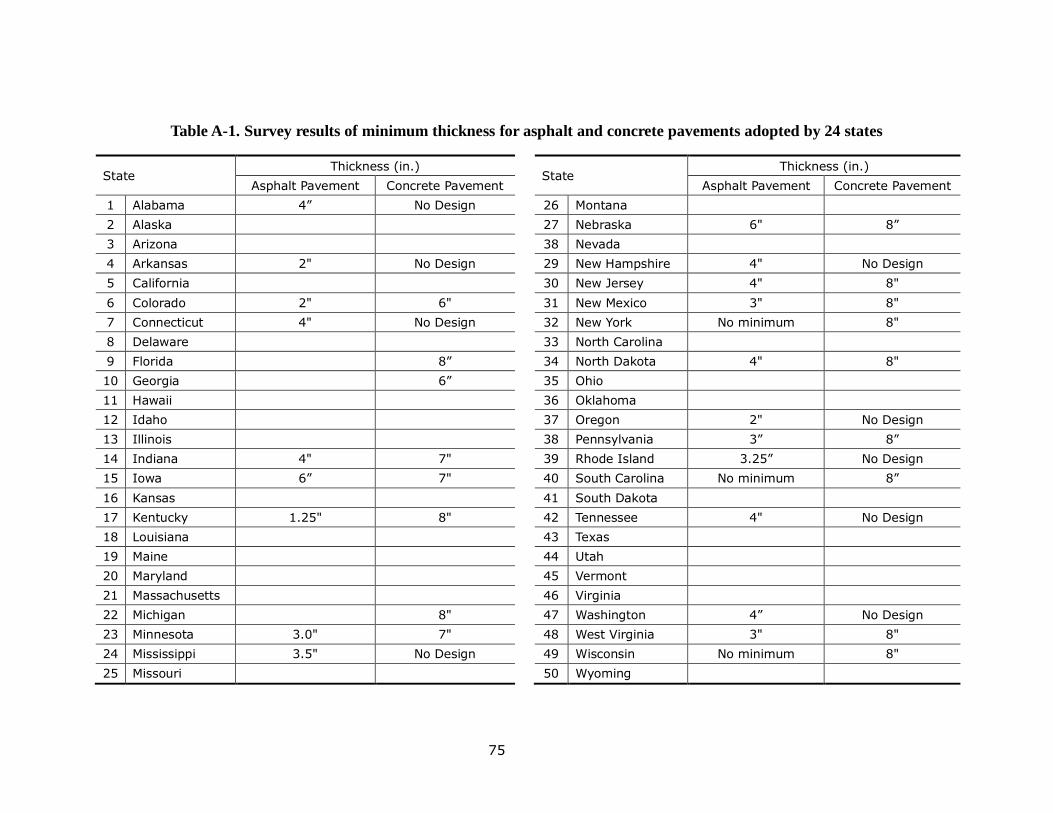
75
Table A-1. Survey results of minimum thickness for asphalt and concrete pavements adopted by 24 states
State Thickness (in.)
State Thickness (in.)
Asphalt Pavement Concrete Pavement Asphalt Pavement Concrete Pavement
1 Alabama 4” No Design 26 Montana
2 Alaska 27 Nebraska 6" 8”
3 Arizona 38 Nevada
4 Arkansas 2" No Design 29 New Hampshire 4" No Design
5 California 30 New Jersey 4" 8"
6 Colorado 2" 6" 31 New Mexico 3" 8"
7 Connecticut 4" No Design 32 New York No minimum 8"
8 Delaware 33 North Carolina
9 Florida 8” 34 North Dakota 4" 8"
10 Georgia 6” 35 Ohio
11 Hawaii 36 Oklahoma
12 Idaho 37 Oregon 2" No Design
13 Illinois 38 Pennsylvania 3” 8”
14 Indiana 4" 7" 39 Rhode Island 3.25” No Design
15 Iowa 6” 7" 40 South Carolina No minimum 8”
16 Kansas 41 South Dakota
17 Kentucky 1.25" 8" 42 Tennessee 4" No Design
18 Louisiana 43 Texas
19 Maine 44 Utah
20 Maryland 45 Vermont
21 Massachusetts 46 Virginia
22 Michigan 8" 47 Washington 4” No Design
23 Minnesota 3.0" 7" 48 West Virginia 3" 8"
24 Mississippi 3.5" No Design 49 Wisconsin No minimum 8"
25 Missouri 50 Wyoming
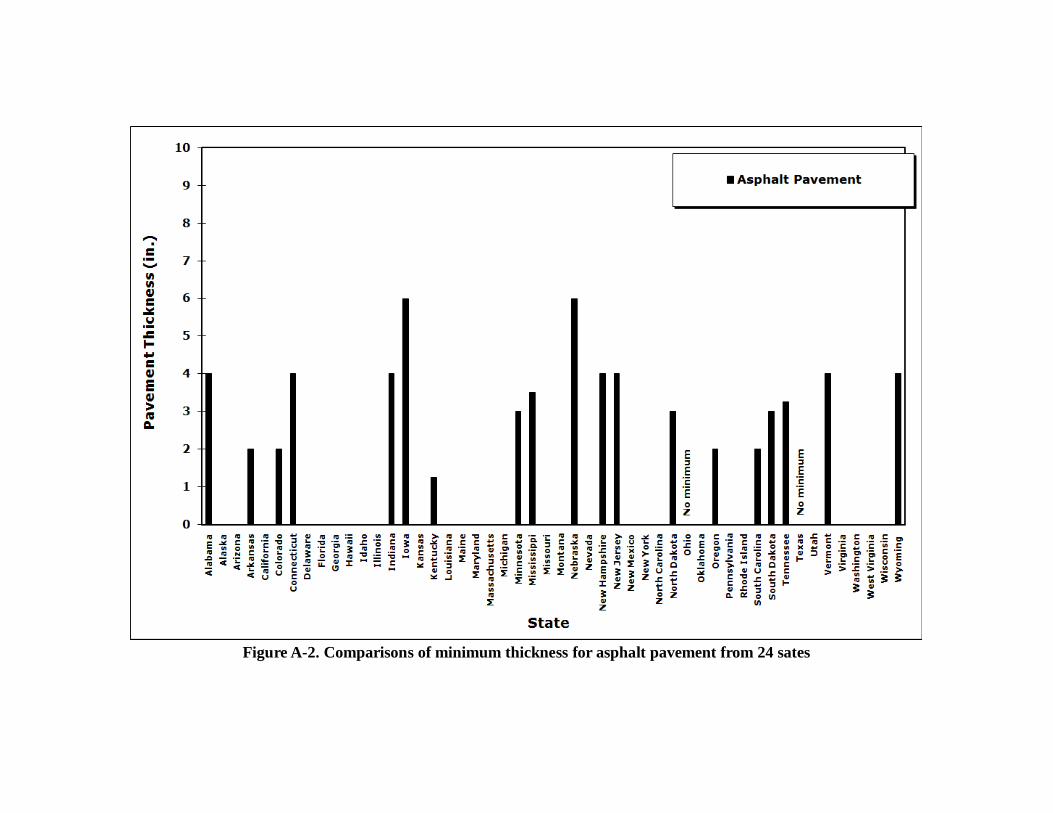
Figure A-2. Comparisons of minimum thickness for asphalt pavement from 24 sates
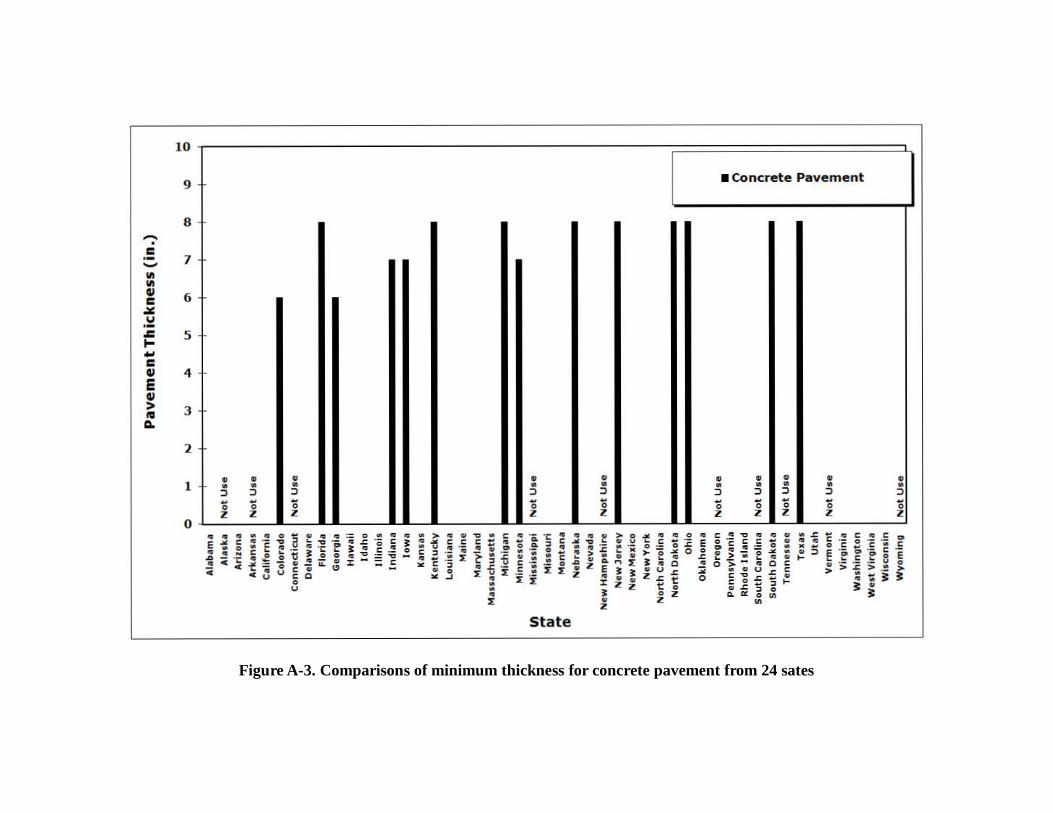
Figure A-3. Comparisons of minimum thickness for concrete pavement from 24 sates
Pa
ve
me
nt T
hic
knes
s (i
n.)
.... 0
.... I>
J w
""
(./1
01
'-I
co
10
0
Ala
bam
a A
lask
a N
ot
Use
A
rizo
na
Ark
ansa
s N
ot
Use
C
alif
orni
a C
olo
rad
o
Co
nn
ecti
cut
No
t U
se
Del
aw
are
Flo
rid
a G
eorg
ia
Ha
wai
i I d
aho
Il
lino
is
Ind
ian
a Io
wa
Kan
sas
Ken
tuck
y L
ouis
iana
M
ain
e M
aryl
and
M
assa
chu
sett
s M
ich
igan
M
inn
eso
ta
U)
Mis
siss
ipp
i N
ot
Use
,...
Mis
sou
ri Q
l ,... M
on
tan
a ('I
) N
ebra
ska
Nev
ada
Ne
w H
amps
hir
e N
ot
Use
N
ew
Jer
sey
N
ew
Mex
ico
Ne
w Y
ork
No
rth
Car
olin
a N
ort
h D
ako
ta
Ohi
o O
klah
om
a O
reg
on
N
ot
Use
P
en
nsy
lvan
ia
• R
hod
e I s
tan
d
~ S
ou
th C
arol
ina
No
t U
se
:I
n S
ou
th D
ako
ta
@
Ten
nes
see
No
t U
se
,... , T
exa
s ,
Uta
h
Ill <
Ver
mo
nt
No
t U
se
, 3 V
irgi
nia
, w
ash
ing
ton
:I
,... W
est
Vir
gini
a W
isco
nsin
W
yo
min
g
No
t U
se

Appendix B
B-1. Survey Form
B-2. Survey Responses
Illinois DOT
Missouri DOT
Minnesota DOT
South Dakota DOT
Wisconsin DOT

B-1. Survey Form
Survey on Local Road Pavement Thickness Design
Procedures
Prepared by:
Hosin “David” Lee, Ph.D., P.E.
Public Policy Center, 227 SQ
Civil and Environmental Engineering
Iowa City, IA 52242-1192
University of Iowa
E-mail: [email protected]
Phone: 319-335-6818
Fax: 319-335-6801
INSTRODUCTION: University of Iowa is initiating in conducting a research project
on “Pavement Thickness Design for Local Roads in Iowa”. This survey is part of a
research effort sponsored by the Iowa Department of Transportation. The principal
investigator is Professor Hosin “David” Lee at the University of Iowa. On behalf of
our research committee, we would like to solicit your opinion on the status of local
road pavement thickness design procedures in your state. The main objective of this
survey is to investigate pavement thickness design procedure for low-volume roads
and identify design parameters needed for low-volume pavement design in adjoining
States. All participants will receive a summary of the survey results by e-mail after
all of the responses have been compiled. Thank you for your willingness to
participate!

QUESTIONNAIRE SURVEY FORM
Participant: Name: Position Title: Phone Number: E-mail Address: Organization Name:
1. What kind of pavement design methodology do you use for low volume road?
American Association of State Highway and Transportation Officials (AASHTO)
Asphalt Institute (AI)
Portland Cement Association (PCA)
American Concrete Pavement Association (ACPA)
American Concrete Pavement Association (ACPA)
US Army Corps of Engineers (UCSA)
Other (Please note)
2. What kind of pavement thickness design software do you use for low
volume road? Please mark all that apply.
Asphalt Institute (AI)
WinPas Pavement Design Software
Street Pave Software
Other (please note)
3. How does your state agency classify as low-volume road? What roads
may be designated as a low-volume road? 4. Has your state agency developed a pavement thickness design procedure
for low-volume road?
Yes (if yes, please explain the procedure or send me specification documentation)
No
5. What are the layer types and thicknesses of a typical flexible low-volume
road in your states? Please include units. 1) Surface: material description: type here; thickness: type here 2) Base: material description: type here; thickness: type here 3) Subbase: material description: type here; thickness: type here 4) Other features: type here

6. What are the layer types and thicknesses of a typical rigid low-volume road in your state? Please include units.
1) Surface: material description: type here; thickness: type here
2) Base: material description: type here; thickness: type here 3) Subbase: material description: type here; thickness: type here 4) Other features: type here
7. What are the most important of below factors for designing low-volume
road?
Traffic
Drainage
Subgrade
Paving Materials
Loads
Pavement Performance Criteria
Desired Reliability
8. What type of soils do you have? (A-1 to A-7)
9. How do you estimate subgrade strength for low-volume road design?
1) Soil classification (Describe: type here) 2) Laboratory testing (Describe: type here) 3) Field experience (Describe: type here) 4) Other: type here
10. What soil parameter does your state agency typically use for low-volume load design?
California Bearing Ratio (CBR)
Resilient Modulus (Mr)
Modulus of Subgrade Reaction (k-value)
11. What paving materials and properties does your state agency typically use for low volume road design?
Granular (CBR or Mr)
Treated Granular (MR (resilient modulus))
Hot Mix Asphalt (E (elastic modulus))
Portland Cement Concrete (E (elastic modulus), f’c (compressive strength), S’c (flexural strength)

12. What type of traffic input do you use for low-volume road design?
Maximum Load
ADT
ESAL (if, what the typical ESAL range does your state agency use for low-volume load?)
<10,000
10,000-50,000
50,000-100,000
100,000-250,000
250,000-500,000
13. What types of drainage features does your agency commonly use for
low-volume road design?
Ditches
Edge Drains
Drainage Layer
Other (please note)
14. Does your state agency use a serviceability index to low volume load? 15. What design reliability does your state agency use for low volume load? 16. What are the important characteristics of flexible pavement for low-
volume road design?
17. What are the important characteristics of rigid pavement for low-volume road design?
B-2. Survey Responses
Illinois DOT
Missouri DOT
Minnesota DOT
South Dakota DOT
Wisconsin DOT

QUESTIONNAIRE SURVEY FORM Participant Name: Kevin Burke III Position Title: Local Policy & Technology Engineer Phone Number: (217) 7855048 E-mail Address: [email protected] Organization Name: Illinois Department of Transportation
1. What kind of pavement design methodology do you use for low volume road?
American Association of State Highway and Transportation Officials (AASHTO)
Asphalt Institute (AI)
Portland Cement Association (PCA)
American Concrete Pavement Association (ACPA)
American Concrete Pavement Association (ACPA)
US Army Corps of Engineers (UCSA)
Other (Please note)
Mechanistic Empirical Design developed by U of I and IL DOT 2. What kind of pavement thickness design software do you use for low volume
road? Please mark all that apply.
Asphalt Institute (AI)
WinPas Pavement Design Software
Street Pave Software
Other (please note)
None
3. How does your state agency classify as low-volume road? What roads may be
designated as a low-volume road? 400 ADT; Traffic Factor<0.25
4. Has your state agency developed a pavement thickness design procedure for low-
volume road?
Yes (if yes, please explain the procedure or send me specification documentation)
No
Conventional Flexible Design (Chapter 37-3 of the BLRS Manual http://www.dot.il.gov/blr/manuals/Chapter%2037.pdf

5. What are the layer types and thicknesses of a typical flexible low-volume road in your states? Please include units.
1) Surface: material description: HMA; thickness: 3”
2) Base: material description: Class A Aggregate: thickness: 8” 3) Subbase: material description: Modified Soil; thickness: 8” 4) Other features: type here
6. What are the layer types and thicknesses of a typical rigid low-volume road in
your state? Please include units. 5) Surface: material description: type here; thickness: type here 6) Base: material description: type here; thickness: type here 7) Subbase: material description: type here; thickness: type here 8) Other features: type here
7. What are the most important of below factors for designing low-volume road?
Traffic
Drainage
Subgrade
Paving Materials
Loads
Pavement Performance Criteria
Desired Reliability
8. What type of soils do you have?
(A-1 to A-7) 9. How do you estimate subgrade strength for low-volume road design?
5) Soil classification (Describe: type here) 6) Laboratory testing (Describe: type here) 7) Field experience (Describe: type here) 8) Other: type here
10. What soil parameter does your state agency typically use for low-volume load design?
California Bearing Ratio (CBR)
Resilient Modulus (Mr)
Modulus of Subgrade Reaction (k-value)

11. What paving materials and properties does your state agency typically use for low volume road design?
Granular (CBR or Mr)
Treated Granular (MR (resilient modulus))
Hot Mix Asphalt (E (elastic modulus))
Portland Cement Concrete (E (elastic modulus), f’c (compressive strength), S’c (flexural strength)
12. What type of traffic input do you use for low-volume road design?
Maximum Load
ADT
ESAL (if, what the typical ESAL range does your state agency use for low-volume load?)
<10,000
10,000-50,000
50,000-100,000
100,000-250,000
250,000-500,000
13. What types of drainage features does your agency commonly use for low-volume
road design?
Ditches
Edge Drains
Drainage Layer
Other (please note)
14. Does your state agency use a serviceability index to low volume load? 15. What design reliability does your state agency use for low volume load?
16. What are the important characteristics of flexible pavement for low-volume road design?
17. What are the important characteristics of rigid pavement for low-volume road
design?
QUESTIONNAIRE SURVEY FORM Participant Name: John Donahue Position Title: Pavement Engineer Phone Number: (573) 526-4334 E-mail Address: [email protected] Organization Name: Missouri Department of Transportation
1. What kind of pavement design methodology do you use for low volume road?
American Association of State Highway and Transportation Officials (AASHTO)
Asphalt Institute (AI)
Portland Cement Association (PCA)
American Concrete Pavement Association (ACPA)
American Concrete Pavement Association (ACPA)
US Army Corps of Engineers (UCSA)
Other (Please note)
2. What kind of pavement thickness design software do you use for low volume
road? Please mark all that apply.
Asphalt Institute (AI)
WinPas Pavement Design Software
Street Pave Software
Other (please note)
Mechanistic-Empirical Pavement Design Guide
3. How does your state agency classify as low-volume road? What roads may be designated as a low-volume road? MoDOT currently defines nearly all non-principle arterial routes as minor, which may or may not mean they‟re low volume. For planning purposes we don‟t have any official substratification of the „minor‟ category. However, from a designer‟s perspective, routes that merit mention as „low volume‟, using functional
classification terms, would consist of nearly all rural major and minor collectors and some minor arterials. Traffic-wise, low volume means less than 1000 AADT and less than a 100 trucks a day. Since this survey concerns designing these types of route, keep in mind that we almost never build new or reconstruct existing ones. The few cases where this occurs are generally for short approaches to bridge replacements and adding turn lanes. Our budget,
particularly at this crucial time, will not allow the luxury of much more than a 1” surface level course every ten years or so on true low volume routes. So, these answers are somewhat hypothetical in the sense that we seldom do what I‟m explaining in these other answers. But for the times that we do, the MEPDG is our primary design tool for low volume routes, the same as if we were working on I-70 or I-44.

4. Has your state agency developed a pavement thickness design procedure for low-volume road?
Yes (if yes, please explain the procedure or send me specification documentation)
No
5. What are the layer types and thicknesses of a typical flexible low-volume road in
your states? Please include units.
1) Surface: material description: hot mix asphalt; thickness: 7” – 8” 2) Base: material description: crushed stone; thickness: 4” 3) Subbase: material description: N/A 4) Other features: type here
6. What are the layer types and thicknesses of a typical rigid low-volume road in
your state? Please include units. 1) Surface: material description: JPCP; thickness: 6” – 7” 2) Base: material description: crushed stone; thickness: 4” 3) Subbase: material description: N/A 4) Other features: type here
7. What are the most important of below factors for designing low-volume road?
Traffic
Drainage
Subgrade
Paving Materials
Loads
Pavement Performance Criteria
Desired Reliability
8. What type of soils do you have?
(A-1 to A-7): Primarily A-4, A-7-5, and A-7-6 soils. In the SE part of Missouri there are some A-3 areas.
9. How do you estimate subgrade strength for low-volume road design? 1) Soil classification (Usually assume resilient modulus value from AASHTO
Class) 2) Laboratory testing (Describe: type here) 3) Field experience (Describe: type here) 4) Other: type here
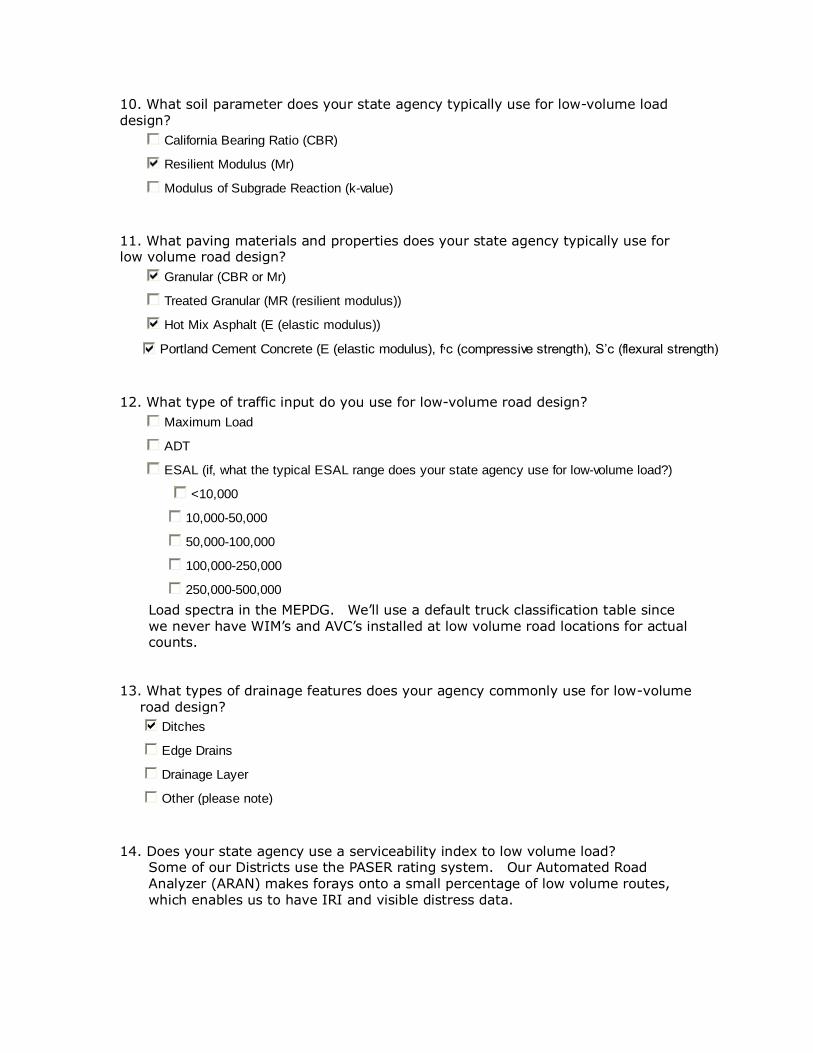
10. What soil parameter does your state agency typically use for low-volume load design?
California Bearing Ratio (CBR)
Resilient Modulus (Mr)
Modulus of Subgrade Reaction (k-value)
11. What paving materials and properties does your state agency typically use for low volume road design?
Granular (CBR or Mr)
Treated Granular (MR (resilient modulus))
Hot Mix Asphalt (E (elastic modulus))
Portland Cement Concrete (E (elastic modulus), f’c (compressive strength), S’c (flexural strength)
12. What type of traffic input do you use for low-volume road design?
Maximum Load
ADT
ESAL (if, what the typical ESAL range does your state agency use for low-volume load?)
<10,000
10,000-50,000
50,000-100,000
100,000-250,000
250,000-500,000
Load spectra in the MEPDG. We‟ll use a default truck classification table since we never have WIM‟s and AVC‟s installed at low volume road locations for actual counts.
13. What types of drainage features does your agency commonly use for low-volume
road design?
Ditches
Edge Drains
Drainage Layer
Other (please note)
14. Does your state agency use a serviceability index to low volume load?
Some of our Districts use the PASER rating system. Our Automated Road Analyzer (ARAN) makes forays onto a small percentage of low volume routes, which enables us to have IRI and visible distress data.

15. What design reliability does your state agency use for low volume load? 50%
16. What are the important characteristics of flexible pavement for low-volume road
design? Adequate structure and proper compaction of lower layers.
17. What are the important characteristics of rigid pavement for low-volume road
design? Short joint spacing and proper compaction of lower layers.

QUESTIONNAIRE SURVEY FORM Participant: Name: Joe Thomas, P.E. Position Title: State Aid Project Engineer Phone Number: 651-366-3831 E-mail Address: [email protected] Organization Name: Minnesota Department of Transportation – State Aid Division
1. What kind of pavement design methodology do you use for low volume road?
American Association of State Highway and Transportation Officials (AASHTO)
Asphalt Institute (AI)
Portland Cement Association (PCA)
American Concrete Pavement Association (ACPA)
American Concrete Pavement Association (ACPA)
US Army Corps of Engineers (UCSA)
Other (Please note)
Charts and tables for soil factor and R-value 2. What kind of pavement thickness design software do you use for low volume
road? Please mark all that apply.
Asphalt Institute (AI)
WinPas Pavement Design Software
Street Pave Software
Other (please note)
See Pavement Design website:
http://www.dot.state.mn.us/materials/pvmtdesign/software.html 3. How does your state agency classify as low-volume road? What roads may be
designated as a low-volume road? ADT less than 1000
4. Has your state agency developed a pavement thickness design procedure for low-
volume road?
Yes (if yes, please explain the procedure or send me specification documentation)
No
http://www.dot.state.mn.us/materials/pvmtdesign/docs/RValueChart.pdf (10 ton) See attached pdf. for 7 ton and 9 ton design
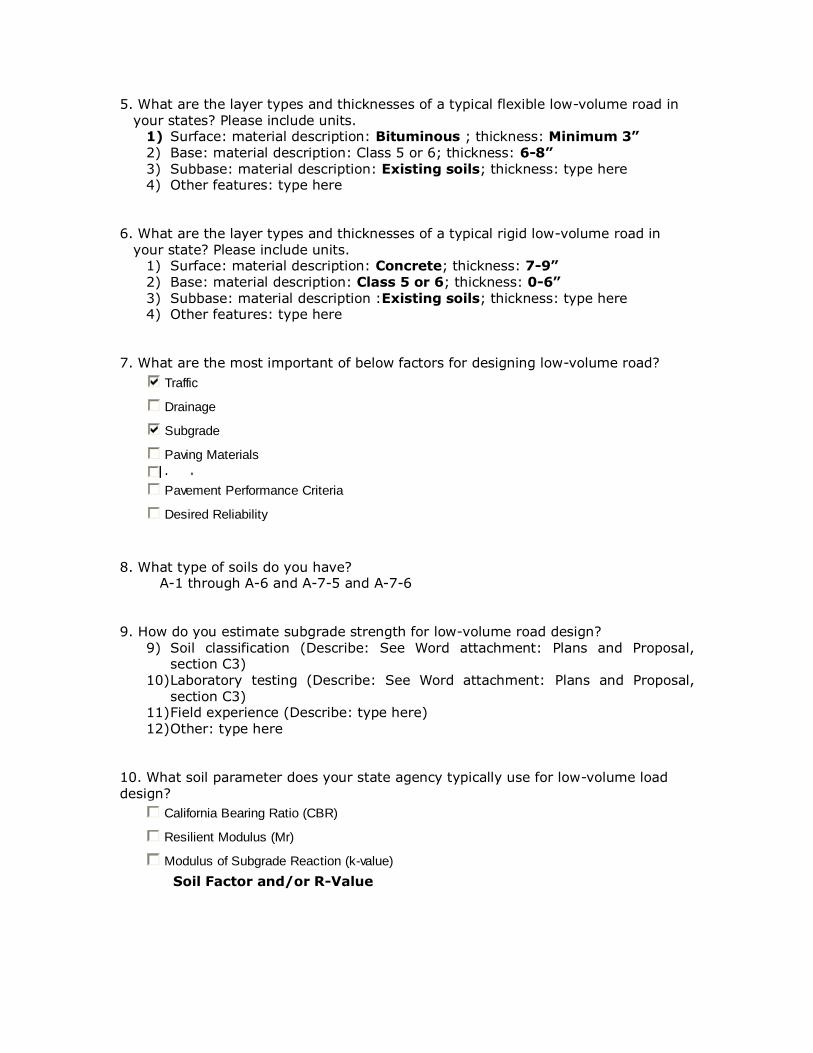
5. What are the layer types and thicknesses of a typical flexible low-volume road in your states? Please include units.
1) Surface: material description: Bituminous ; thickness: Minimum 3”
2) Base: material description: Class 5 or 6; thickness: 6-8” 3) Subbase: material description: Existing soils; thickness: type here 4) Other features: type here
6. What are the layer types and thicknesses of a typical rigid low-volume road in
your state? Please include units. 1) Surface: material description: Concrete; thickness: 7-9” 2) Base: material description: Class 5 or 6; thickness: 0-6” 3) Subbase: material description :Existing soils; thickness: type here 4) Other features: type here
7. What are the most important of below factors for designing low-volume road?
Traffic
Drainage
Subgrade
Paving Materials
Loads
Pavement Performance Criteria
Desired Reliability
8. What type of soils do you have? A-1 through A-6 and A-7-5 and A-7-6
9. How do you estimate subgrade strength for low-volume road design?
9) Soil classification (Describe: See Word attachment: Plans and Proposal, section C3)
10) Laboratory testing (Describe: See Word attachment: Plans and Proposal, section C3)
11) Field experience (Describe: type here) 12) Other: type here
10. What soil parameter does your state agency typically use for low-volume load design?
California Bearing Ratio (CBR)
Resilient Modulus (Mr)
Modulus of Subgrade Reaction (k-value)
Soil Factor and/or R-Value

11. What paving materials and properties does your state agency typically use for low volume road design?
Granular (CBR or Mr)
Treated Granular (MR (resilient modulus))
Hot Mix Asphalt (E (elastic modulus))
Portland Cement Concrete (E (elastic modulus), f’c (compressive strength), S’c (flexural strength)
12. What type of traffic input do you use for low-volume road design?
Maximum Load
ADT
ESAL (if, what the typical ESAL range does your state agency use for low-volume load?)
<10,000
10,000-50,000
50,000-100,000
100,000-250,000
250,000-500,000
13. What types of drainage features does your agency commonly use for low-volume
road design?
Ditches
Edge Drains
Drainage Layer
Other (please note)
14. Does your state agency use a serviceability index to low volume load? RQI – Ride quality Index, ranges from 0 -5 (best). Obtained from International Roughness Index (IRI )and Surface Rating (SR) values 15. What design reliability does your state agency use for low volume load?
80% 16. What are the important characteristics of flexible pavement for low-volume road
design? Subgrade and ADT/HCADT
17. What are the important characteristics of rigid pavement for low-volume road
design? Subgrade and ADT/HCADT

QUESTIONNAIRE SURVEY FORM Participant: Name: Gill L Hedman Position Title: Pavement Design Engineer Phone Number: (605) 773-5503 E-mail Address: [email protected] Organization Name: South Dakota Department of Transportation
1. What kind of pavement design methodology do you use for low volume road?
American Association of State Highway and Transportation Officials (AASHTO)
Asphalt Institute (AI)
Portland Cement Association (PCA)
American Concrete Pavement Association (ACPA)
American Concrete Pavement Association (ACPA)
US Army Corps of Engineers (UCSA)
Other (Please note)
2. What kind of pavement thickness design software do you use for low volume
road? Please mark all that apply.
Asphalt Institute (AI)
WinPas Pavement Design Software
Street Pave Software
Other (please note)
We use the 1993 AASHTO Design Guide and the DARWIN Software to design low volume pavements
3. How does your state agency classify as low-volume road? What roads may be
designated as a low-volume road? We in South Dakota don't have a low volume road classification; the classification of our system is set up by usage.
4. Has your state agency developed a pavement thickness design procedure for low-
volume road?
Yes (if yes, please explain the procedure or send me specification documentation)
No
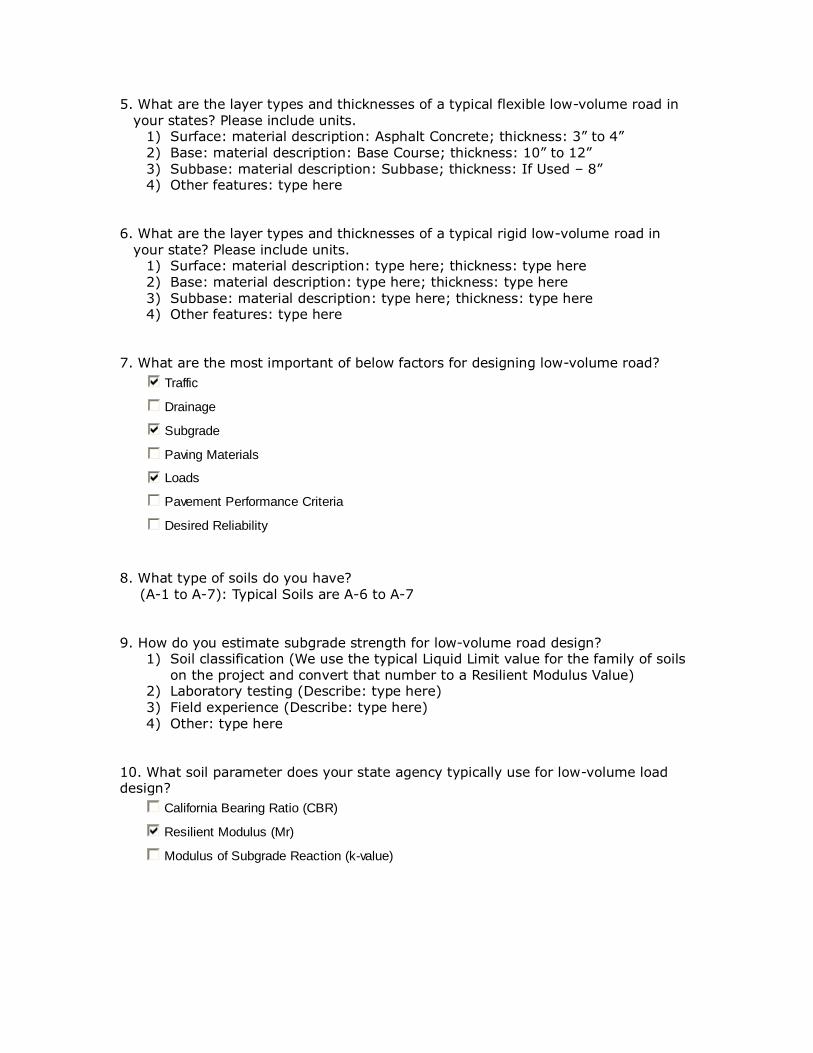
5. What are the layer types and thicknesses of a typical flexible low-volume road in your states? Please include units.
1) Surface: material description: Asphalt Concrete; thickness: 3” to 4”
2) Base: material description: Base Course; thickness: 10” to 12” 3) Subbase: material description: Subbase; thickness: If Used – 8” 4) Other features: type here
6. What are the layer types and thicknesses of a typical rigid low-volume road in
your state? Please include units. 1) Surface: material description: type here; thickness: type here 2) Base: material description: type here; thickness: type here 3) Subbase: material description: type here; thickness: type here 4) Other features: type here
7. What are the most important of below factors for designing low-volume road?
Traffic
Drainage
Subgrade
Paving Materials
Loads
Pavement Performance Criteria
Desired Reliability
8. What type of soils do you have?
(A-1 to A-7): Typical Soils are A-6 to A-7 9. How do you estimate subgrade strength for low-volume road design?
1) Soil classification (We use the typical Liquid Limit value for the family of soils on the project and convert that number to a Resilient Modulus Value)
2) Laboratory testing (Describe: type here) 3) Field experience (Describe: type here) 4) Other: type here
10. What soil parameter does your state agency typically use for low-volume load design?
California Bearing Ratio (CBR)
Resilient Modulus (Mr)
Modulus of Subgrade Reaction (k-value)

11. What paving materials and properties does your state agency typically use for low volume road design?
Granular (CBR or Mr)
Treated Granular (MR (resilient modulus))
Hot Mix Asphalt (E (elastic modulus))
Portland Cement Concrete (E (elastic modulus), f’c (compressive strength), S’c (flexural strength)
12. What type of traffic input do you use for low-volume road design?
Maximum Load
ADT
ESAL (if, what the typical ESAL range does your state agency use for low-volume load?)
<10,000
10,000-50,000
50,000-100,000
100,000-250,000
250,000-500,000
13. What types of drainage features does your agency commonly use for low-volume
road design?
Ditches
Edge Drains
Drainage Layer
Other (please note)
14. Does your state agency use a serviceability index to low volume load?
4.5 to 2.5 15. What design reliability does your state agency use for low volume load?
90%
16. What are the important characteristics of flexible pavement for low-volume road
design? They were detailed above in question #7.
17. What are the important characteristics of rigid pavement for low-volume road
design? We will not typically pave a low volume road with PCCP unless it would

QUESTIONNAIRE SURVEY FORM
Participant:
Name: Laura L. Fenley, P.E.
Position Title: Pavement Structural Engineer
Phone Number: 608-246-5455
E-mail address: [email protected]
Organization Name: Wisconsin Department of Transportation
1. What kind of pavement design methodology do you use for low volume road?
American Association of State Highway and Transportation Officials (AASHTO)
Asphalt Institute (AI)
Portland Cement Association (PCA)
American Concrete Pavement Association (ACPA)
American Concrete Pavement Association (ACPA)
US Army Corps of Engineers (UCSA)
Other
(See Q #2)
2. What kind of pavement thickness design software do you use for low volume
road? Please mark all that apply.
Asphalt Institute (AI)
WinPas Pavement Design Software
Street Pave Software
Other
(WisPave based on AASHTO 72)
3. How does your state agency classify as low-volume road? What roads may be
designated as a low-volume road?
<400 AADT.

4. Has your state agency developed a pavement thickness design procedure for low-
volume road?
Yes (if yes, please explain the procedure or send me specification
documentation)
No
We use the same procedure for all volume, including low-volume. However, many
roadways w/volumes that low are not WisDOT designed
5. What are the layer types and thicknesses of a typical flexible low-volume road in
your states? Please include units.
5) Surface: Material description: Asphalt Concrete; thickness: Superpave
12.5mm E-0.3, 3”
6) Base: Material description: Base Course; thickness: dense graded aggregate
8”
7) Subbase: Material description: Subbase; thickness: If Used – None
8) Other features: Type here
6. What are the layer types and thicknesses of a typical rigid low-volume road in
your state? Please include units.
1. Surface: Material description: Asphalt Concrete; thickness:
2. Base: Material description: Base Course; thickness:”
3. Subbase: Material description: Subbase; thickness: If Used
4. Other features: Type here
It would not be typical to use concrete for a low-volume road
7. What are the most important of below factors for designing low-volume road?
Traffic
Drainage
Subgrade
Paving Materials
Loads
Pavement Performance Criteria
Desired Reliability

8. What type of soils do you have?
A-3; A-2-4; A-4; A-6; A-7-6
9. How do you estimate subgrade strength for low-volume road design?
1. Soil classification (Describe).
2. Laboratory testing (Describe: Type here)
3. Field experience (Describe: Type here)
4. Other: Type here
10. What soil parameter does your state agency typically use for low-volume load
design?
California Bearing Ratio (CBR)
Resilient Modulus (Mr)
Modulus of Subgrade Reaction (k-value)
We employ k-value and soil support vale (SSV) – DGI (design group index) based
on pedology. DGI is primary. Our DGI ranges from 0 (best) to 20 with 10-14
being most common.
11. What paving materials and properties does your state agency typically use for
low volume road design?
Granular (CBR or Mr)(not if WisDOT designed)
Treated Granular (MR (resilient modulus))
Hot Mix Asphalt (E (elastic modulus))
Portland Cement Concrete (E (elastic modulus), f’c (compressive strength), S’c (flexural strength)
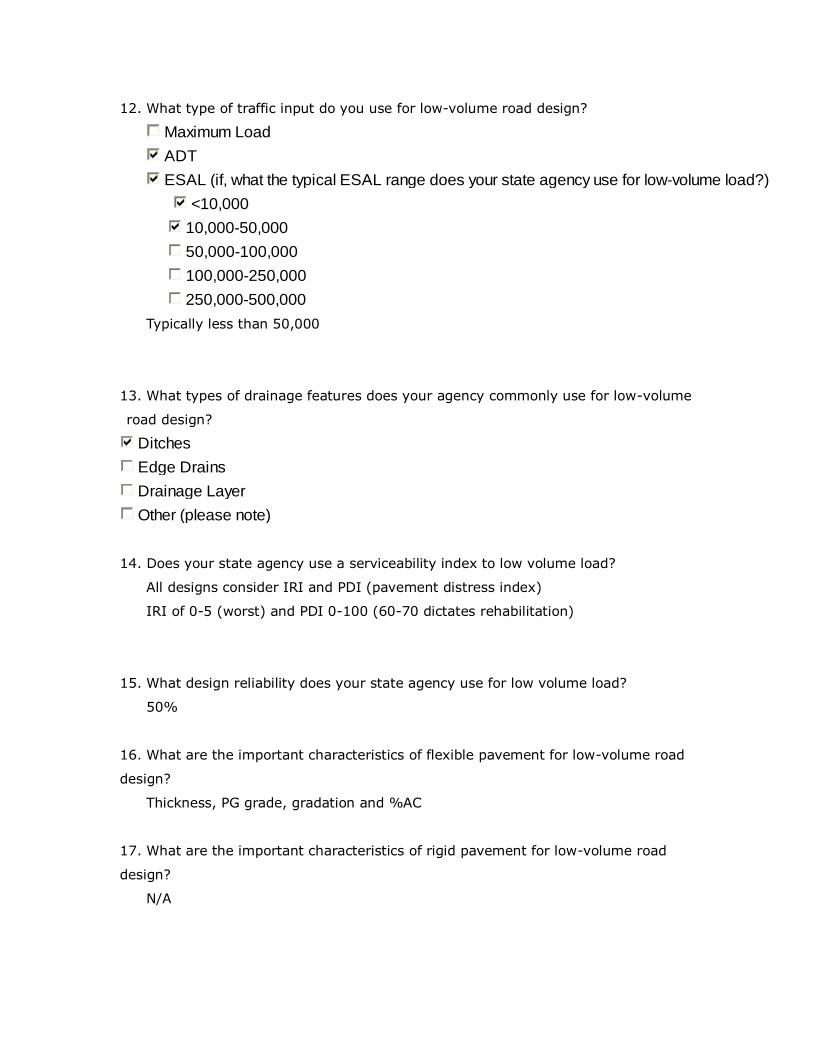
12. What type of traffic input do you use for low-volume road design?
Maximum Load
ADT
ESAL (if, what the typical ESAL range does your state agency use for low-volume load?)
<10,000
10,000-50,000
50,000-100,000
100,000-250,000
250,000-500,000
Typically less than 50,000
13. What types of drainage features does your agency commonly use for low-volume
road design?
Ditches
Edge Drains
Drainage Layer
Other (please note)
14. Does your state agency use a serviceability index to low volume load?
All designs consider IRI and PDI (pavement distress index)
IRI of 0-5 (worst) and PDI 0-100 (60-70 dictates rehabilitation)
15. What design reliability does your state agency use for low volume load?
50%
16. What are the important characteristics of flexible pavement for low-volume road
design?
Thickness, PG grade, gradation and %AC
17. What are the important characteristics of rigid pavement for low-volume road
design?
N/A
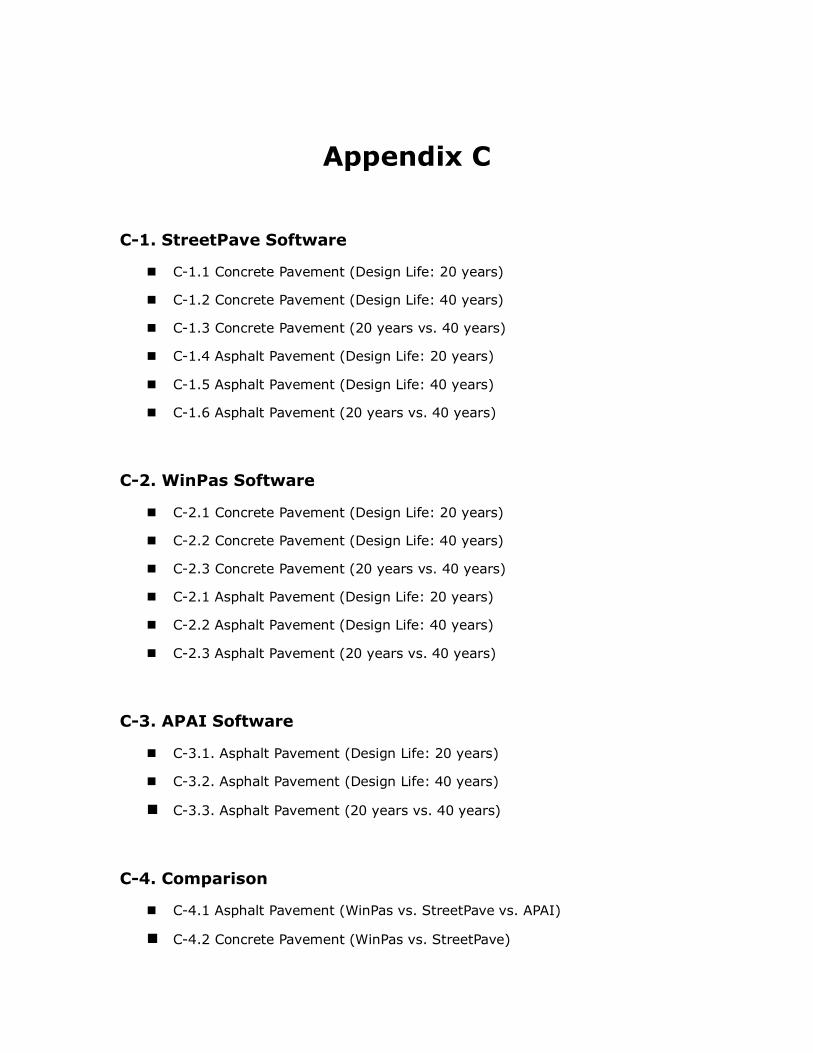
Appendix C
C-1. StreetPave Software
C-1.1 Concrete Pavement (Design Life: 20 years)
C-1.2 Concrete Pavement (Design Life: 40 years)
C-1.3 Concrete Pavement (20 years vs. 40 years)
C-1.4 Asphalt Pavement (Design Life: 20 years)
C-1.5 Asphalt Pavement (Design Life: 40 years)
C-1.6 Asphalt Pavement (20 years vs. 40 years)
C-2. WinPas Software
C-2.1 Concrete Pavement (Design Life: 20 years)
C-2.2 Concrete Pavement (Design Life: 40 years)
C-2.3 Concrete Pavement (20 years vs. 40 years)
C-2.1 Asphalt Pavement (Design Life: 20 years)
C-2.2 Asphalt Pavement (Design Life: 40 years)
C-2.3 Asphalt Pavement (20 years vs. 40 years)
C-3. APAI Software
C-3.1. Asphalt Pavement (Design Life: 20 years)
C-3.2. Asphalt Pavement (Design Life: 40 years)
C-3.3. Asphalt Pavement (20 years vs. 40 years)
C-4. Comparison
C-4.1 Asphalt Pavement (WinPas vs. StreetPave vs. APAI)
C-4.2 Concrete Pavement (WinPas vs. StreetPave)
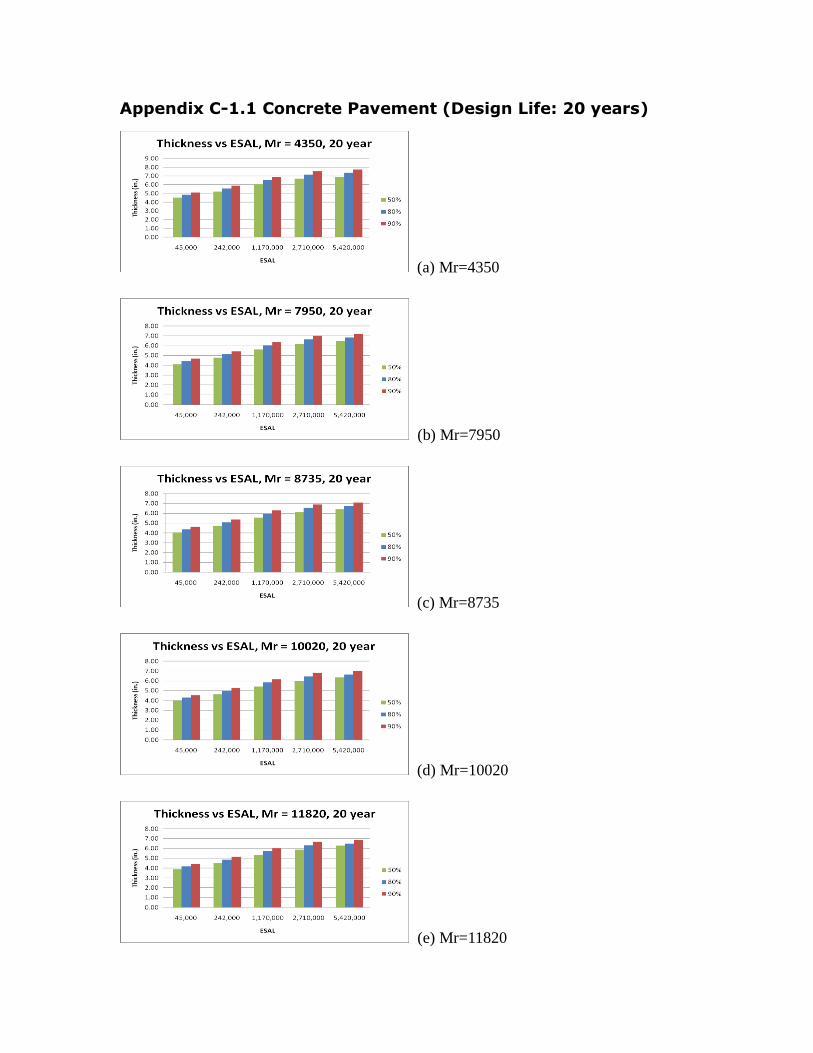
Appendix C-1.1 Concrete Pavement (Design Life: 20 years)
(a) Mr=4350
(b) Mr=7950
(c) Mr=8735
(d) Mr=10020
(e) Mr=11820
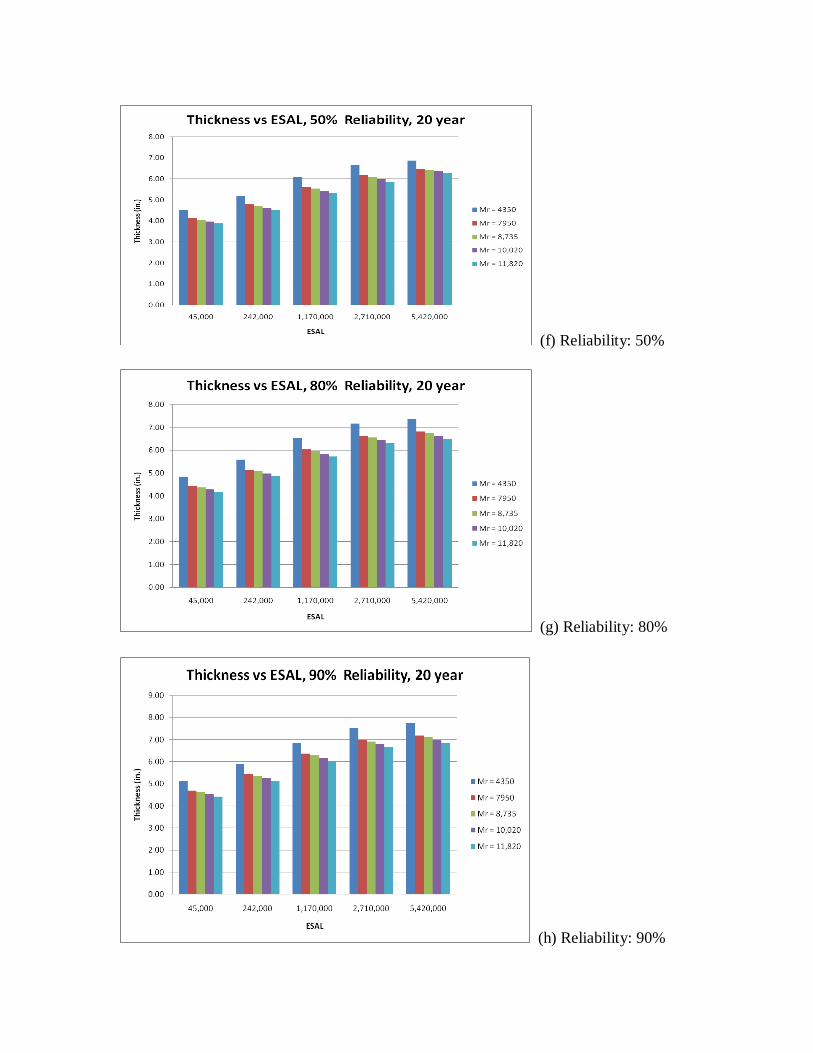
(f) Reliability: 50%
(g) Reliability: 80%
(h) Reliability: 90%
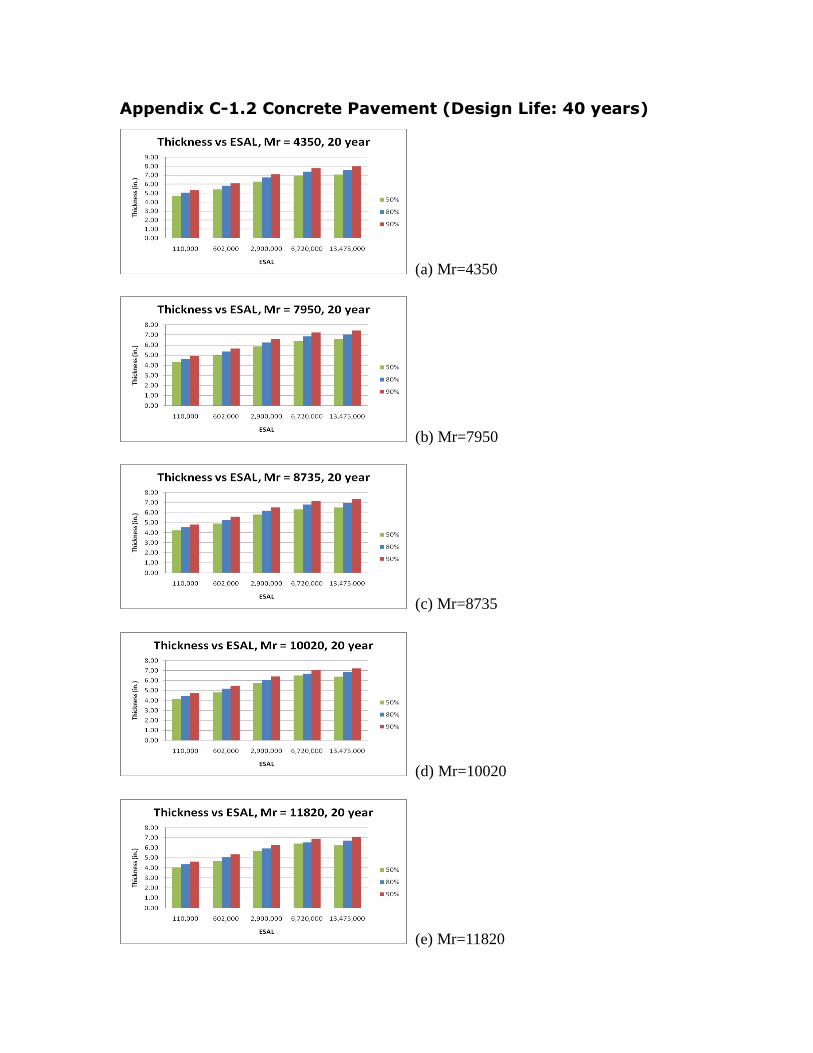
Appendix C-1.2 Concrete Pavement (Design Life: 40 years)
(a) Mr=4350
(b) Mr=7950
(c) Mr=8735
(d) Mr=10020
(e) Mr=11820
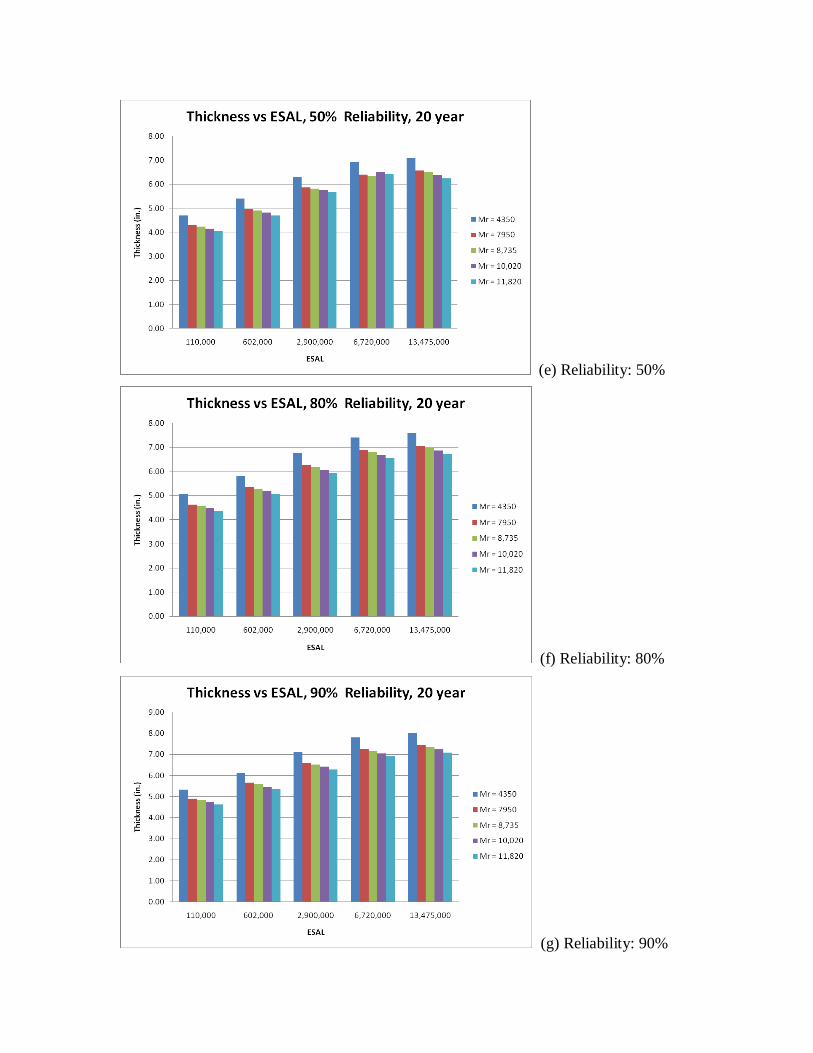
(e) Reliability: 50%
(f) Reliability: 80%
(g) Reliability: 90%
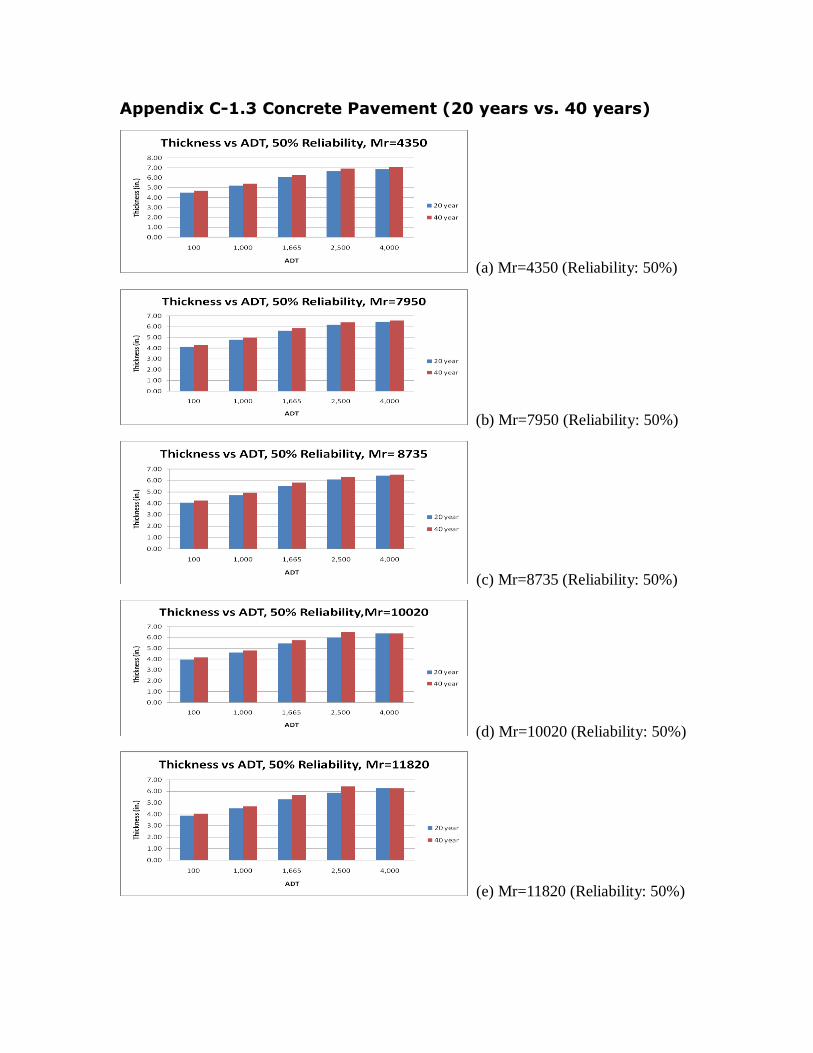
Appendix C-1.3 Concrete Pavement (20 years vs. 40 years)
(a) Mr=4350 (Reliability: 50%)
(b) Mr=7950 (Reliability: 50%)
(c) Mr=8735 (Reliability: 50%)
(d) Mr=10020 (Reliability: 50%)
(e) Mr=11820 (Reliability: 50%)
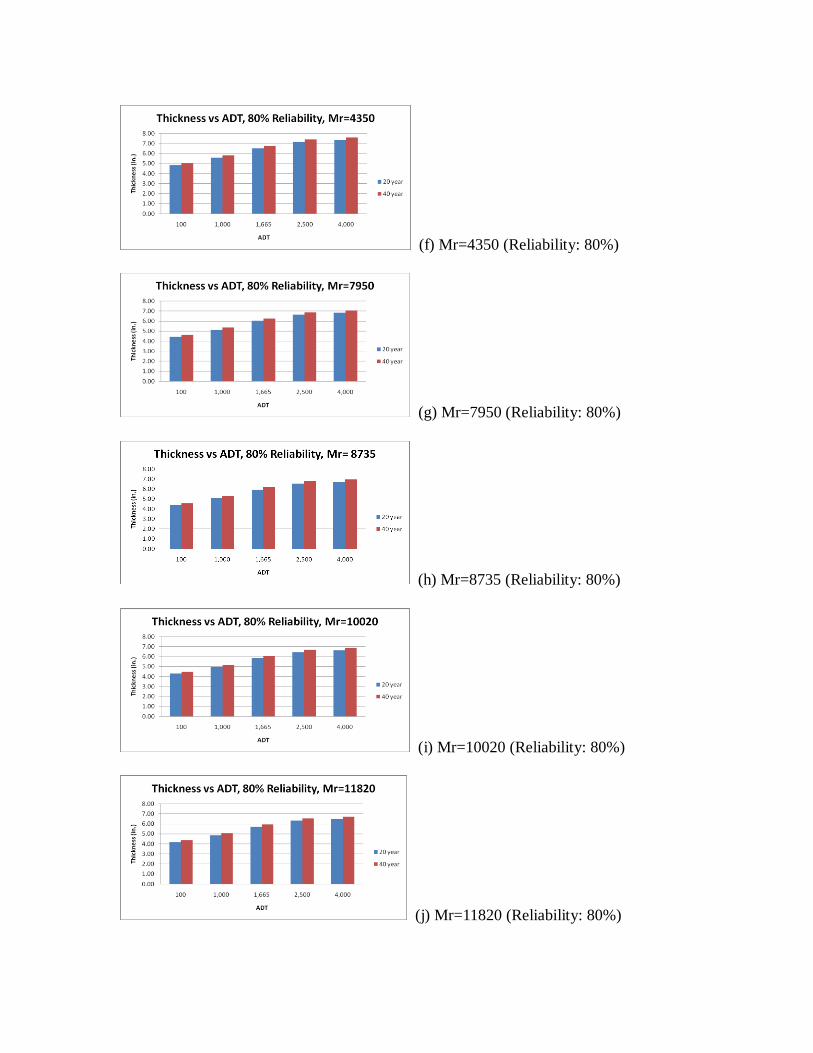
(f) Mr=4350 (Reliability: 80%)
(g) Mr=7950 (Reliability: 80%)
(h) Mr=8735 (Reliability: 80%)
(i) Mr=10020 (Reliability: 80%)
(j) Mr=11820 (Reliability: 80%)
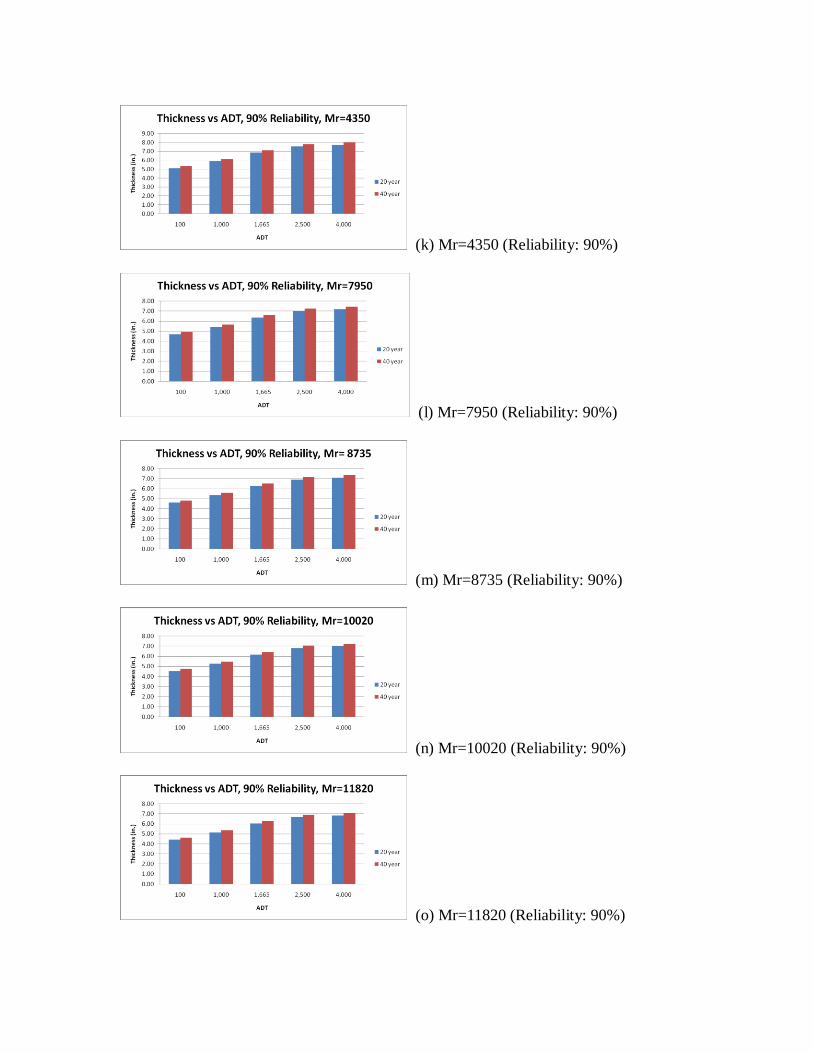
(k) Mr=4350 (Reliability: 90%)
(l) Mr=7950 (Reliability: 90%)
(m) Mr=8735 (Reliability: 90%)
(n) Mr=10020 (Reliability: 90%)
(o) Mr=11820 (Reliability: 90%)
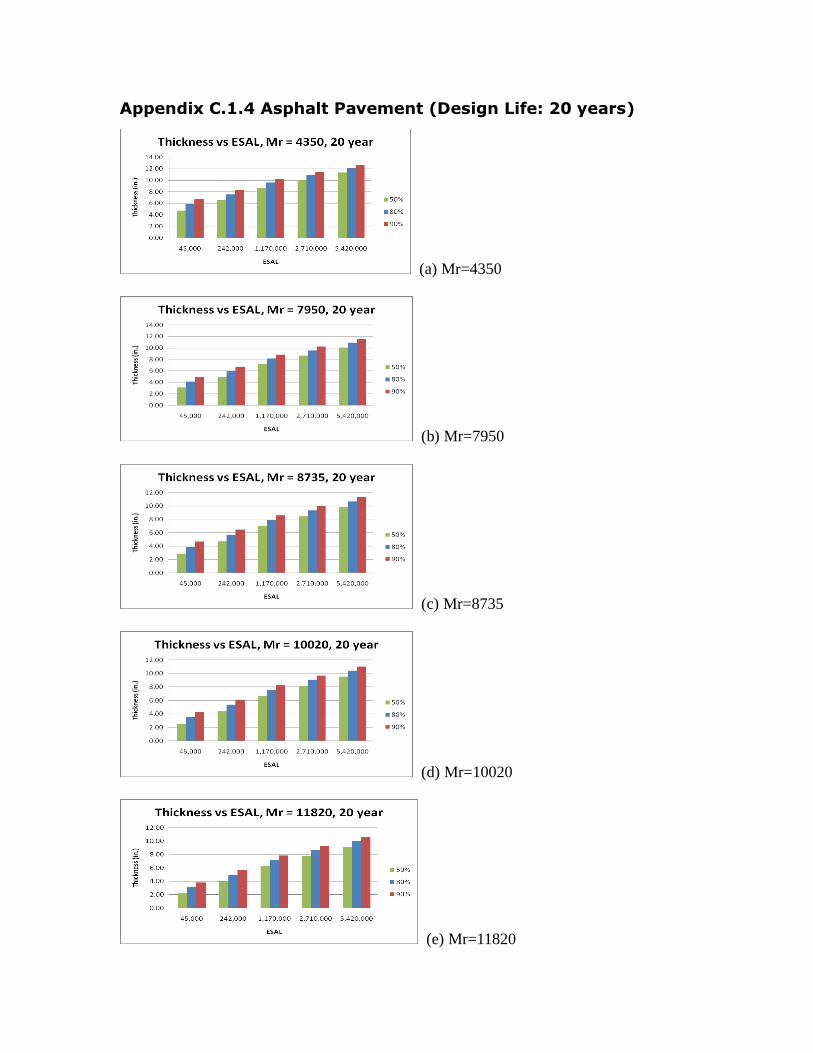
Appendix C.1.4 Asphalt Pavement (Design Life: 20 years)
(a) Mr=4350
(b) Mr=7950
(c) Mr=8735
(d) Mr=10020
(e) Mr=11820
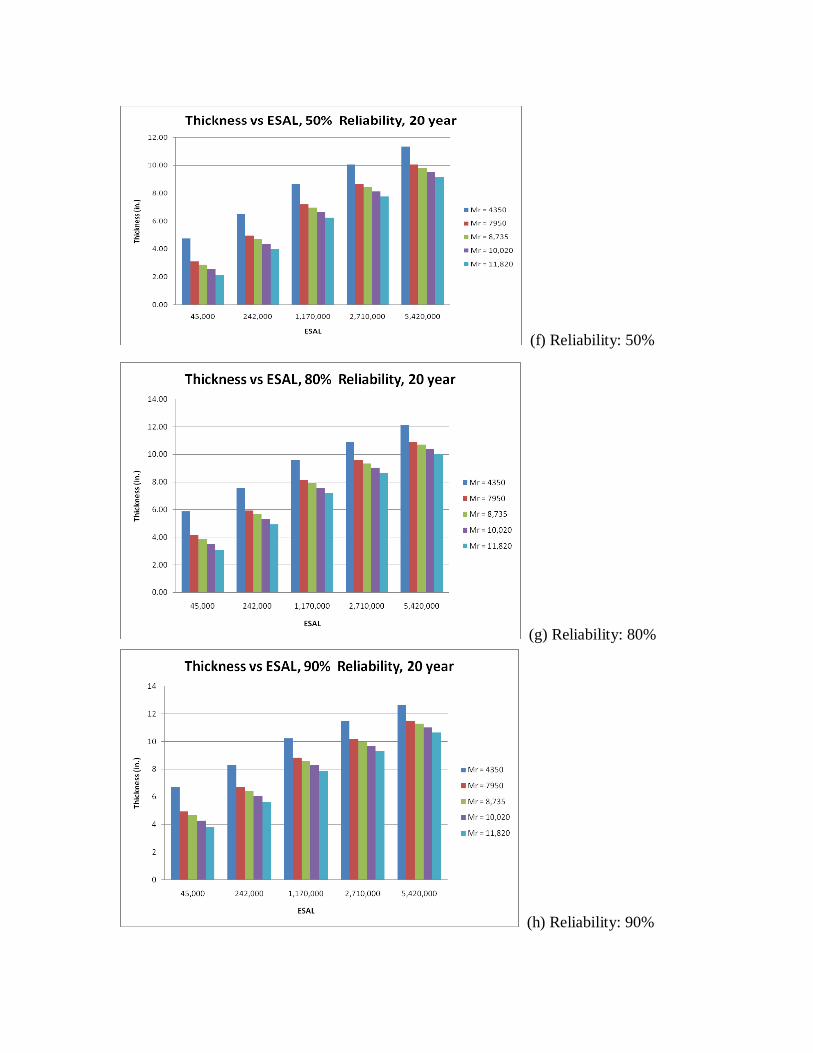
(f) Reliability: 50%
(g) Reliability: 80%
(h) Reliability: 90%
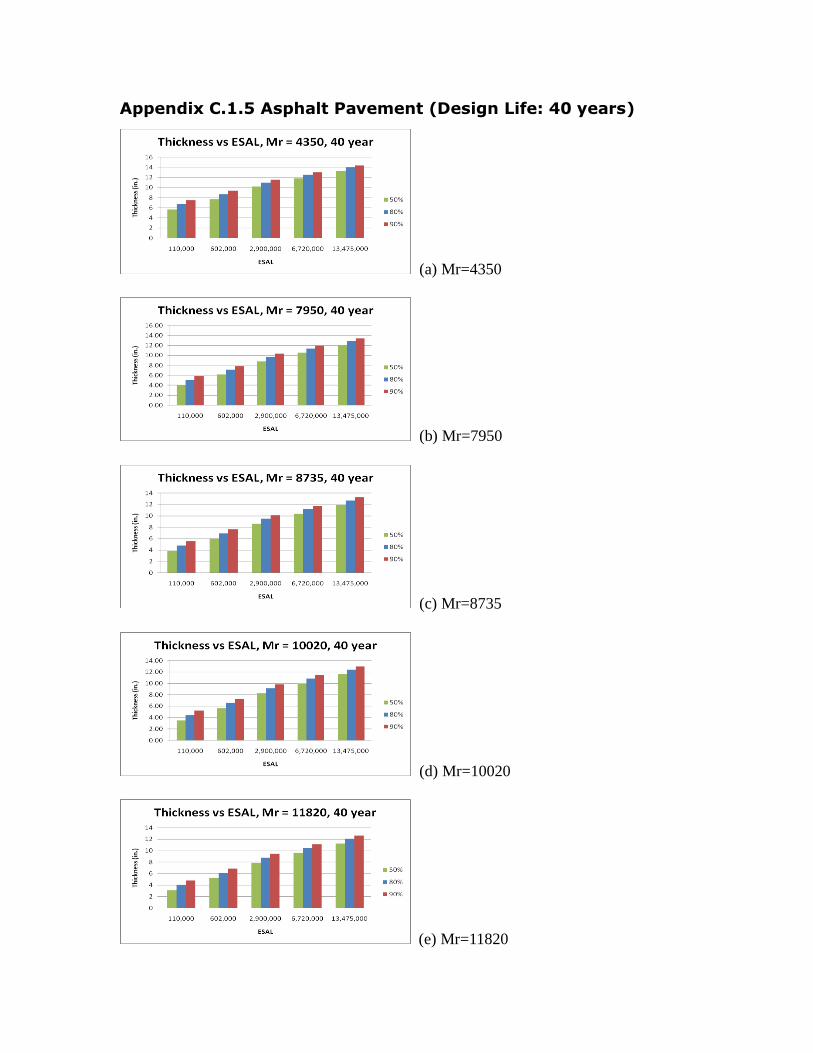
Appendix C.1.5 Asphalt Pavement (Design Life: 40 years)
(a) Mr=4350
(b) Mr=7950
(c) Mr=8735
(d) Mr=10020
(e) Mr=11820
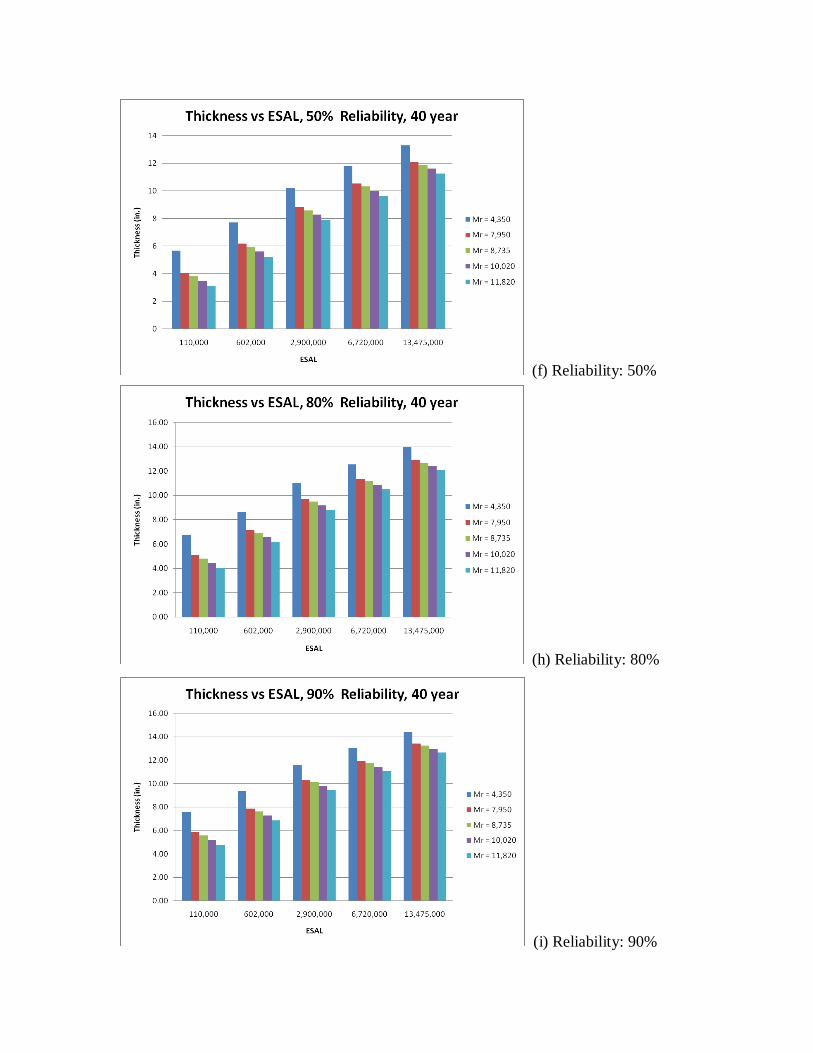
(f) Reliability: 50%
(h) Reliability: 80%
(i) Reliability: 90%
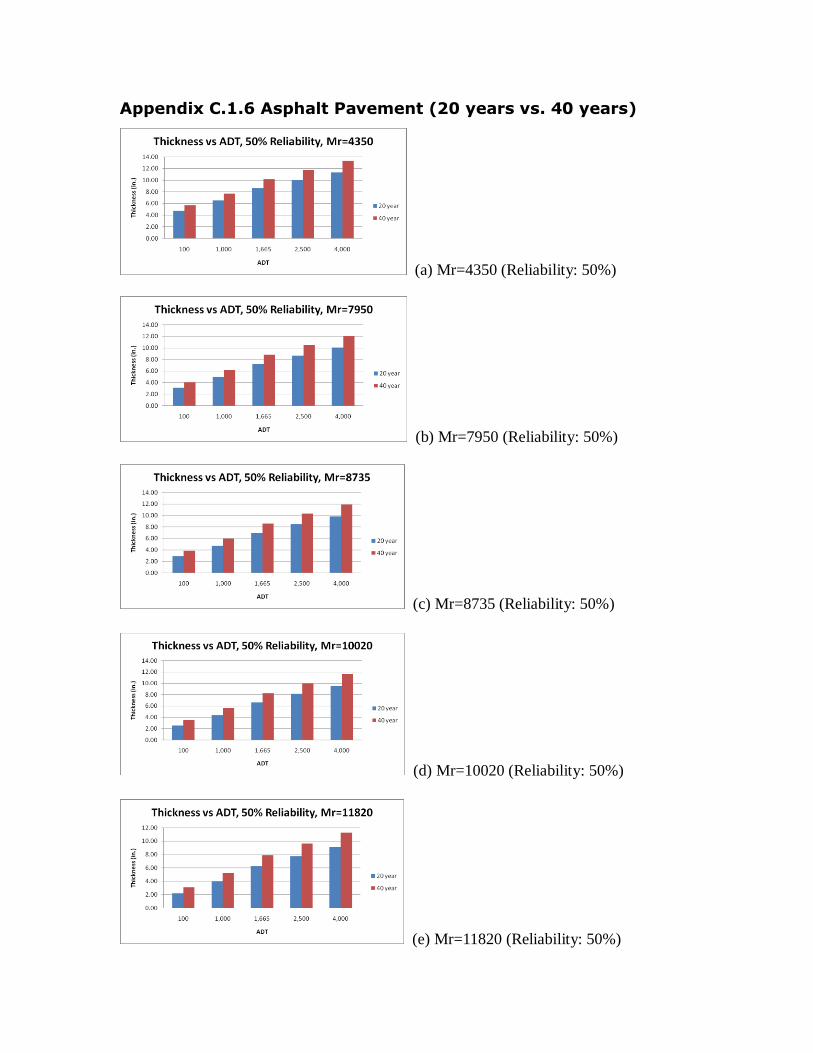
Appendix C.1.6 Asphalt Pavement (20 years vs. 40 years)
(a) Mr=4350 (Reliability: 50%)
(b) Mr=7950 (Reliability: 50%)
(c) Mr=8735 (Reliability: 50%)
(d) Mr=10020 (Reliability: 50%)
(e) Mr=11820 (Reliability: 50%)
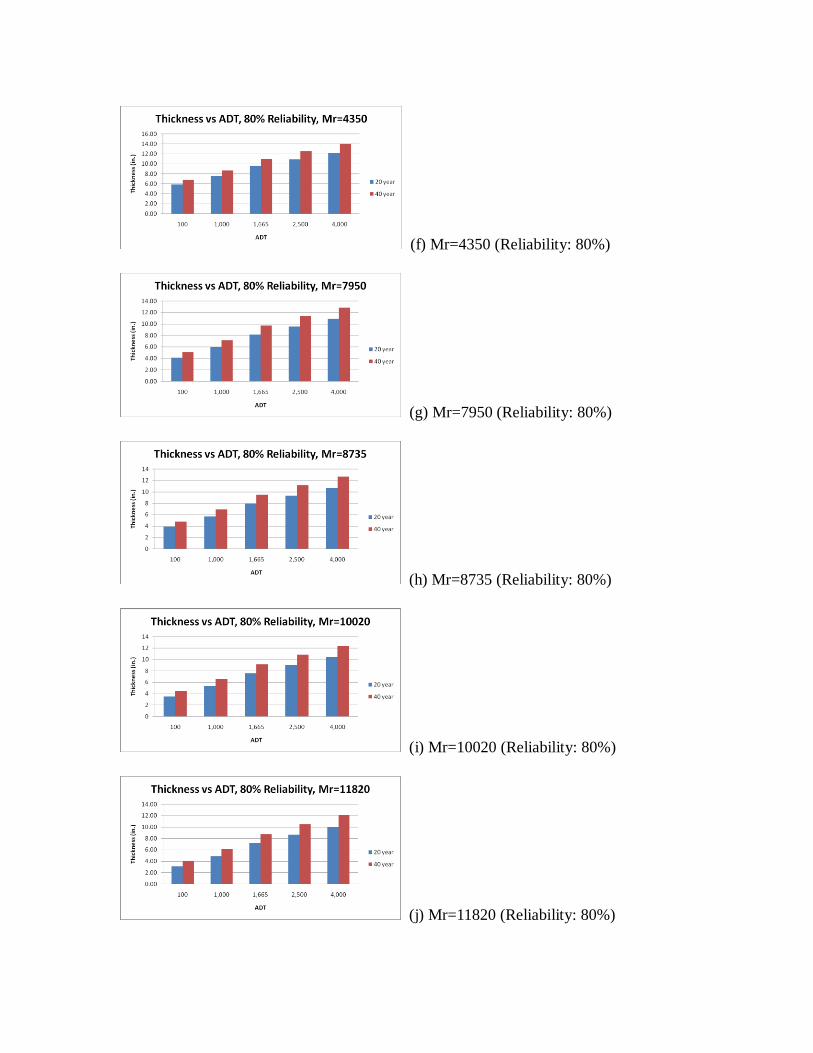
(f) Mr=4350 (Reliability: 80%)
(g) Mr=7950 (Reliability: 80%)
(h) Mr=8735 (Reliability: 80%)
(i) Mr=10020 (Reliability: 80%)
(j) Mr=11820 (Reliability: 80%)
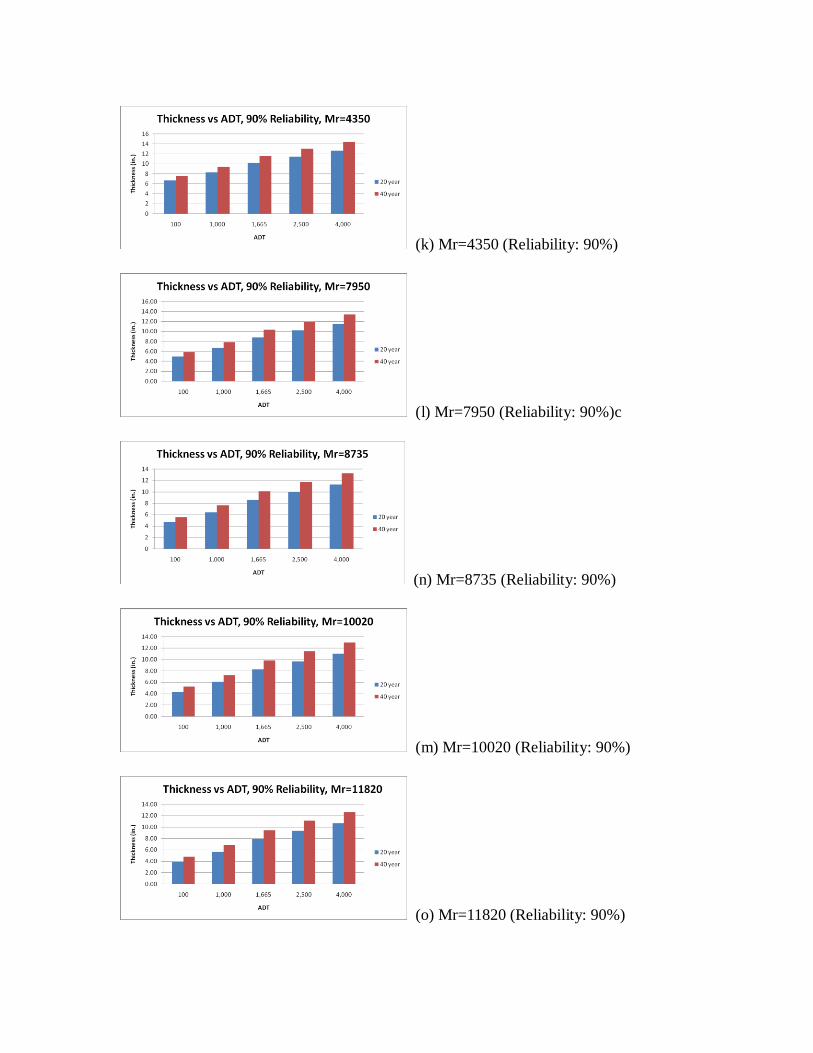
(k) Mr=4350 (Reliability: 90%)
(l) Mr=7950 (Reliability: 90%)c
(n) Mr=8735 (Reliability: 90%)
(m) Mr=10020 (Reliability: 90%)
(o) Mr=11820 (Reliability: 90%)
C-2 WinPas Software
C-2.1 Concrete Pavement (Design Life: 20 years)
C-2.2 Concrete Pavement (Design Life: 40 years)
C-2.3 Concrete Pavement (20 years vs. 40 years)
C-1.4 Asphalt Pavement (Design Life: 20 years)
C-1.5 Asphalt Pavement (Design Life: 40 years)
C-1.6 Asphalt Pavement (20 years vs. 40 years)
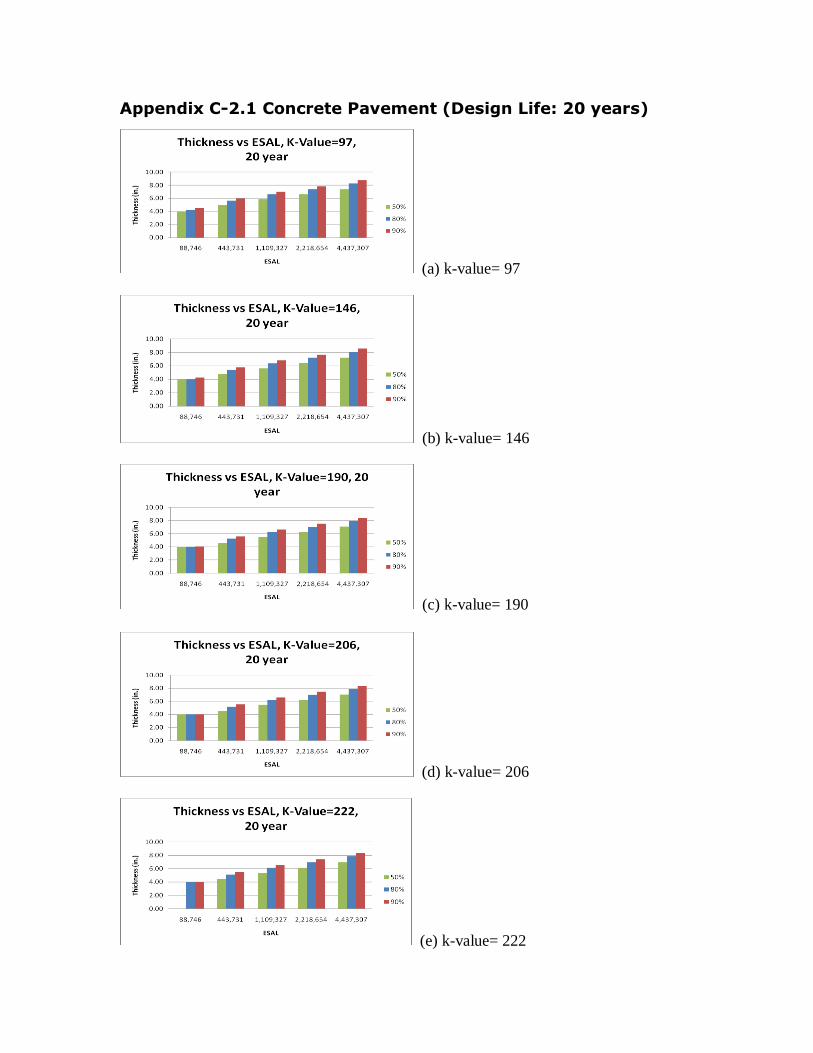
Appendix C-2.1 Concrete Pavement (Design Life: 20 years)
(a) k-value= 97
(b) k-value= 146
(c) k-value= 190
(d) k-value= 206
(e) k-value= 222
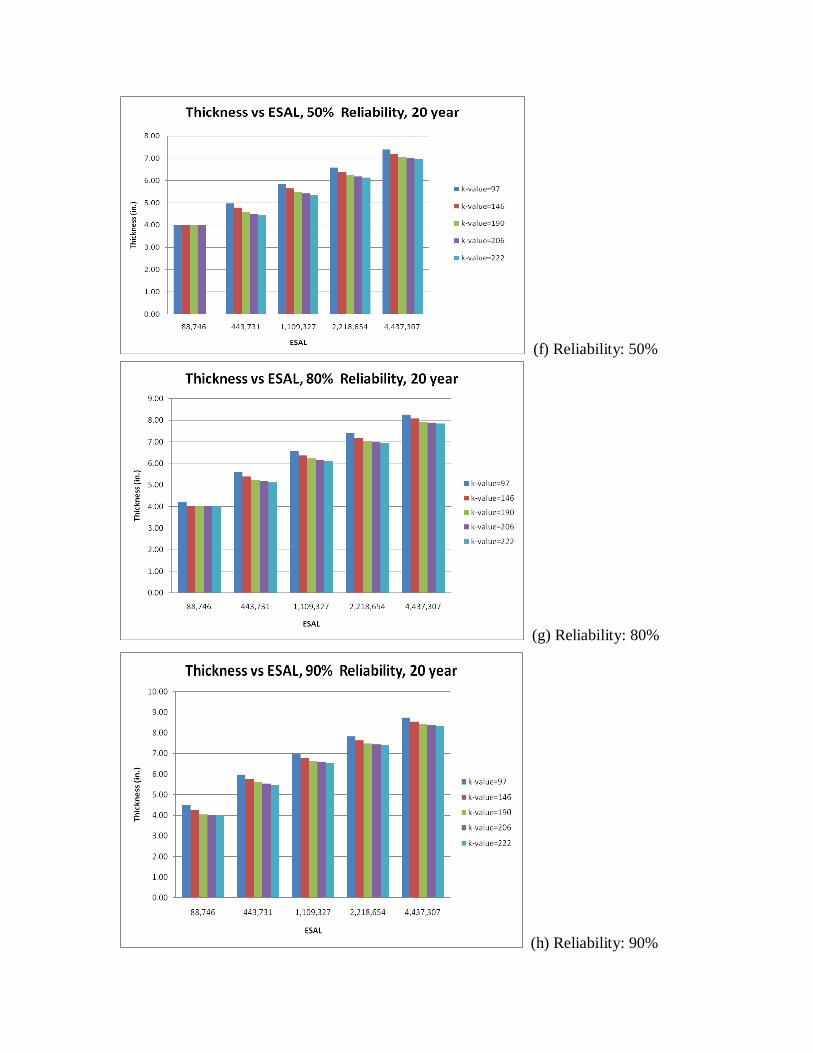
(f) Reliability: 50%
(g) Reliability: 80%
(h) Reliability: 90%
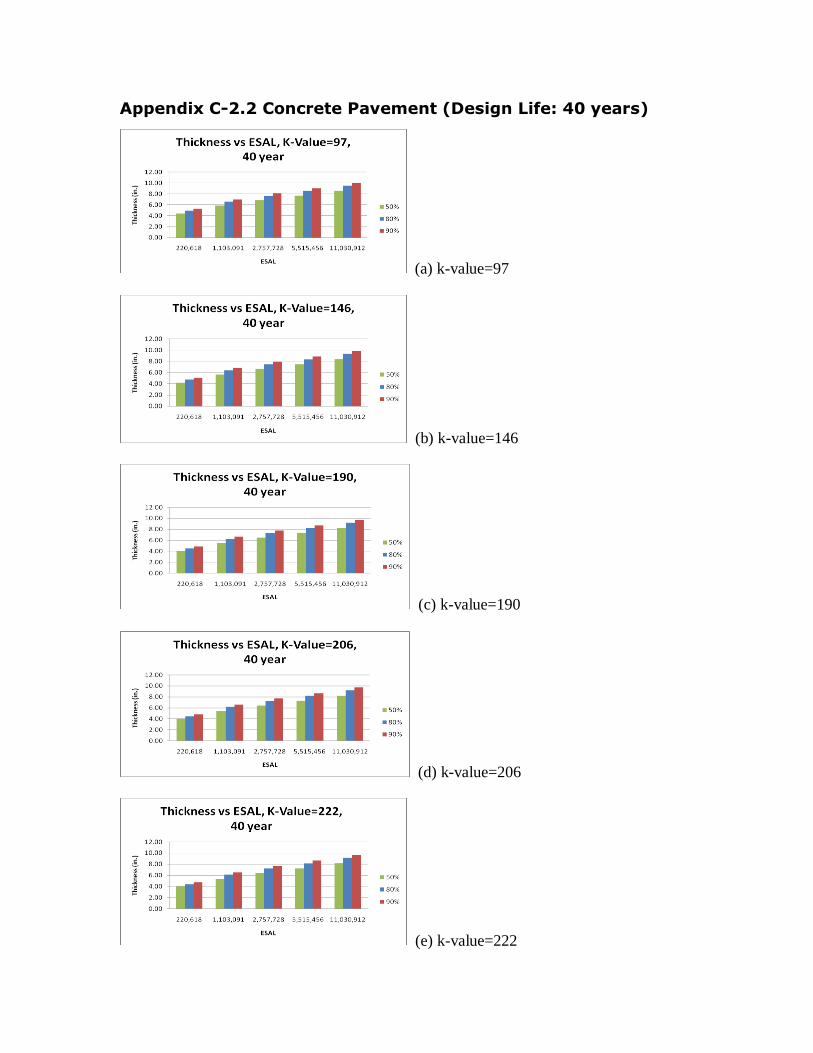
Appendix C-2.2 Concrete Pavement (Design Life: 40 years)
(a) k-value=97
(b) k-value=146
(c) k-value=190
(d) k-value=206
(e) k-value=222
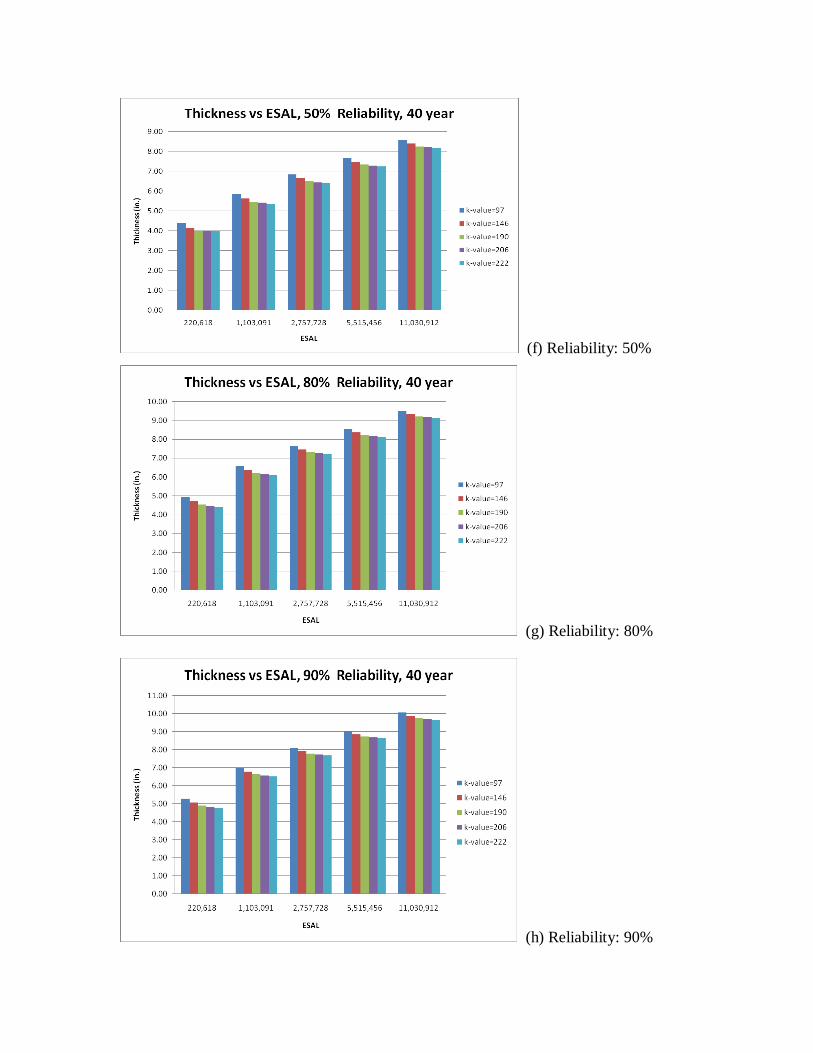
(f) Reliability: 50%
(g) Reliability: 80%
(h) Reliability: 90%
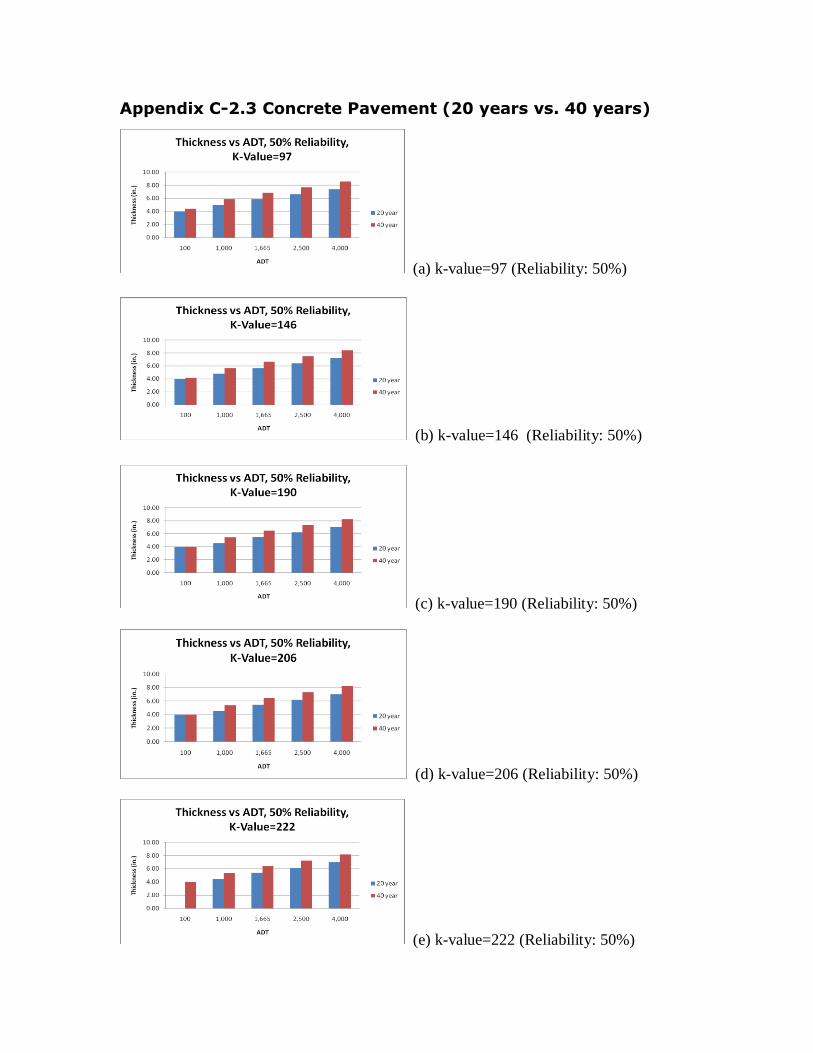
Appendix C-2.3 Concrete Pavement (20 years vs. 40 years)
(a) k-value=97 (Reliability: 50%)
(b) k-value=146 (Reliability: 50%)
(c) k-value=190 (Reliability: 50%)
(d) k-value=206 (Reliability: 50%)
(e) k-value=222 (Reliability: 50%)
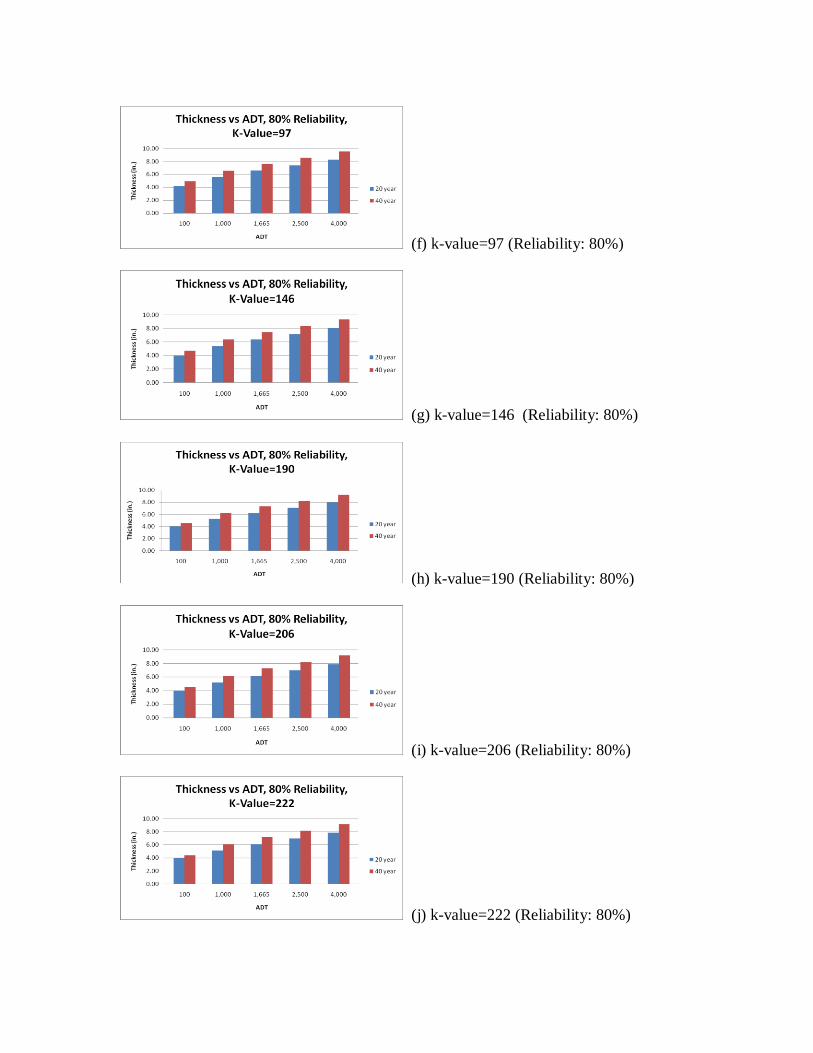
(f) k-value=97 (Reliability: 80%)
(g) k-value=146 (Reliability: 80%)
(h) k-value=190 (Reliability: 80%)
(i) k-value=206 (Reliability: 80%)
(j) k-value=222 (Reliability: 80%)
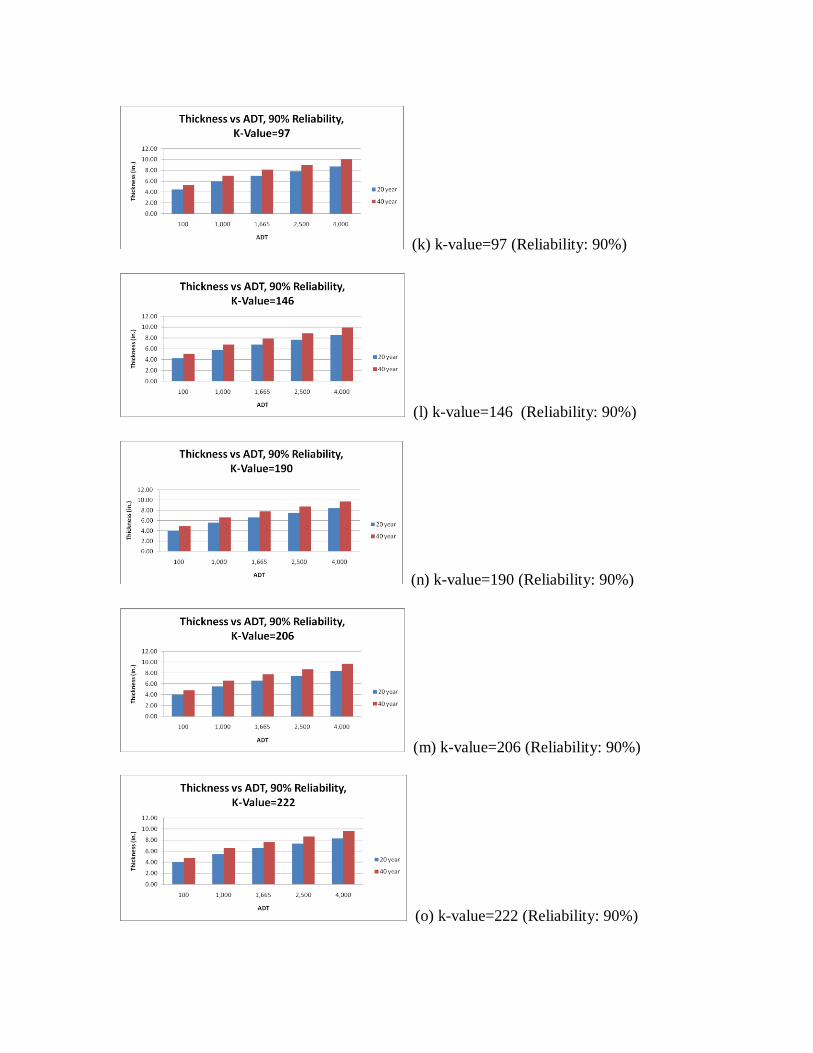
(k) k-value=97 (Reliability: 90%)
(l) k-value=146 (Reliability: 90%)
(n) k-value=190 (Reliability: 90%)
(m) k-value=206 (Reliability: 90%)
(o) k-value=222 (Reliability: 90%)
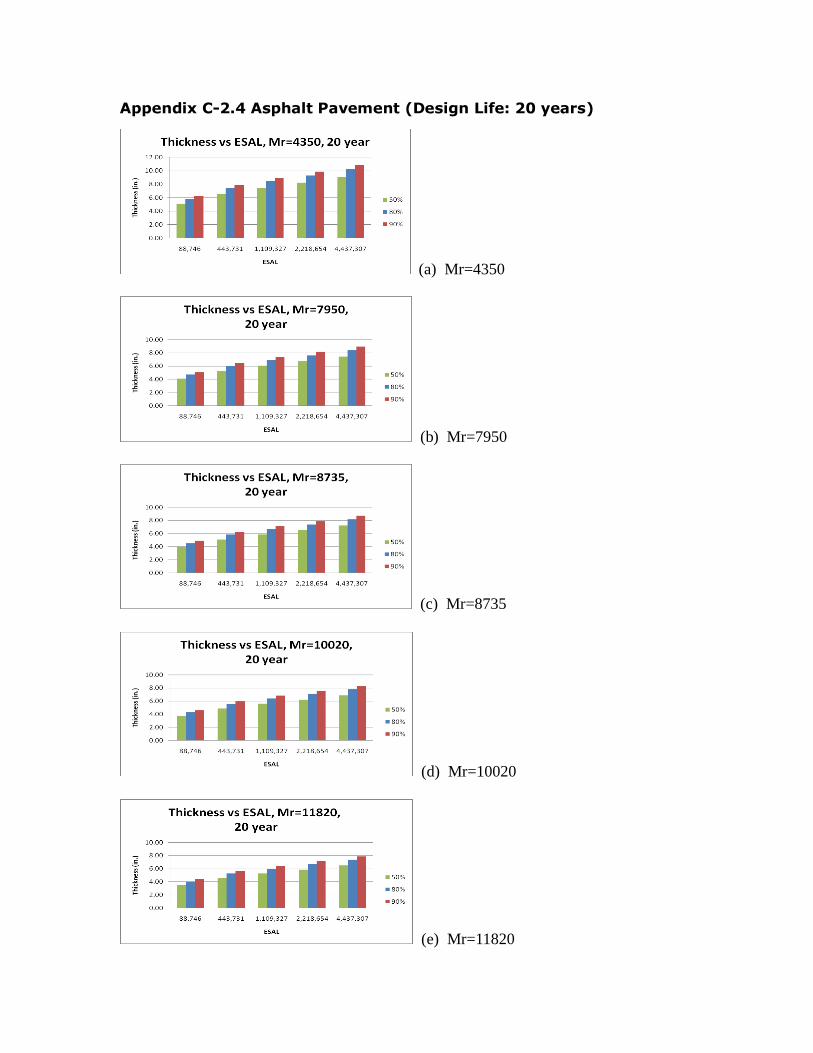
Appendix C-2.4 Asphalt Pavement (Design Life: 20 years)
(a) Mr=4350
(b) Mr=7950
(c) Mr=8735
(d) Mr=10020
(e) Mr=11820
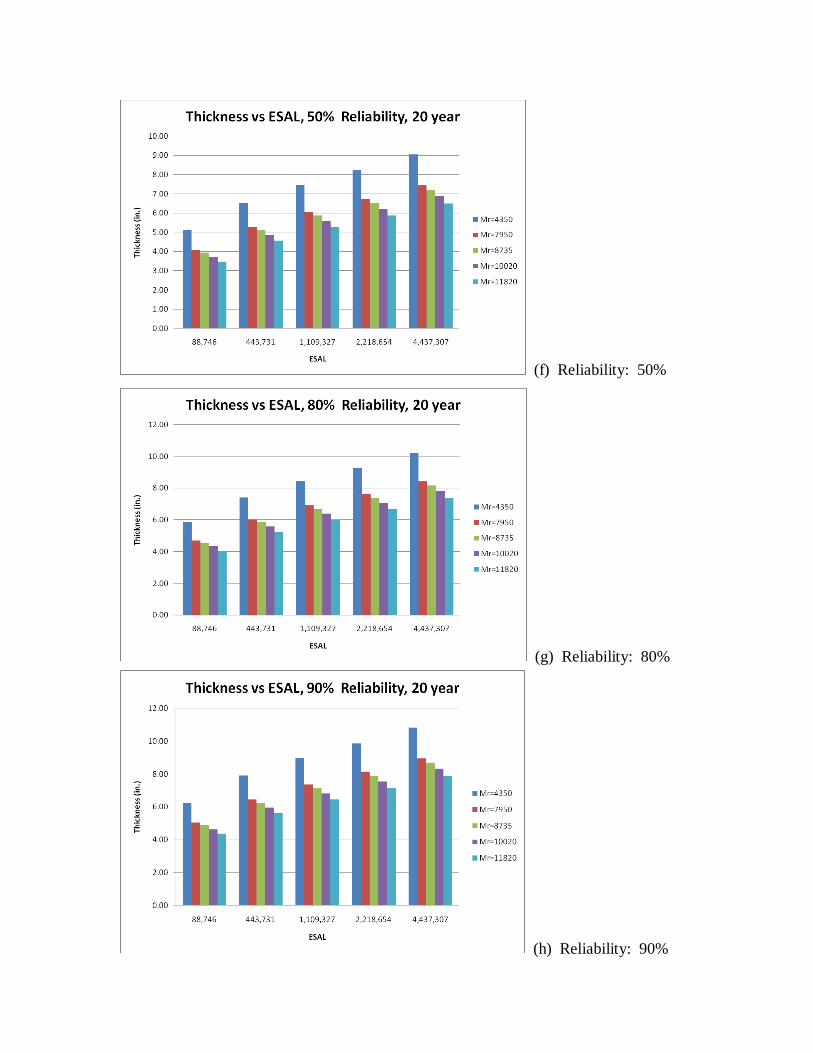
(f) Reliability: 50%
(g) Reliability: 80%
(h) Reliability: 90%
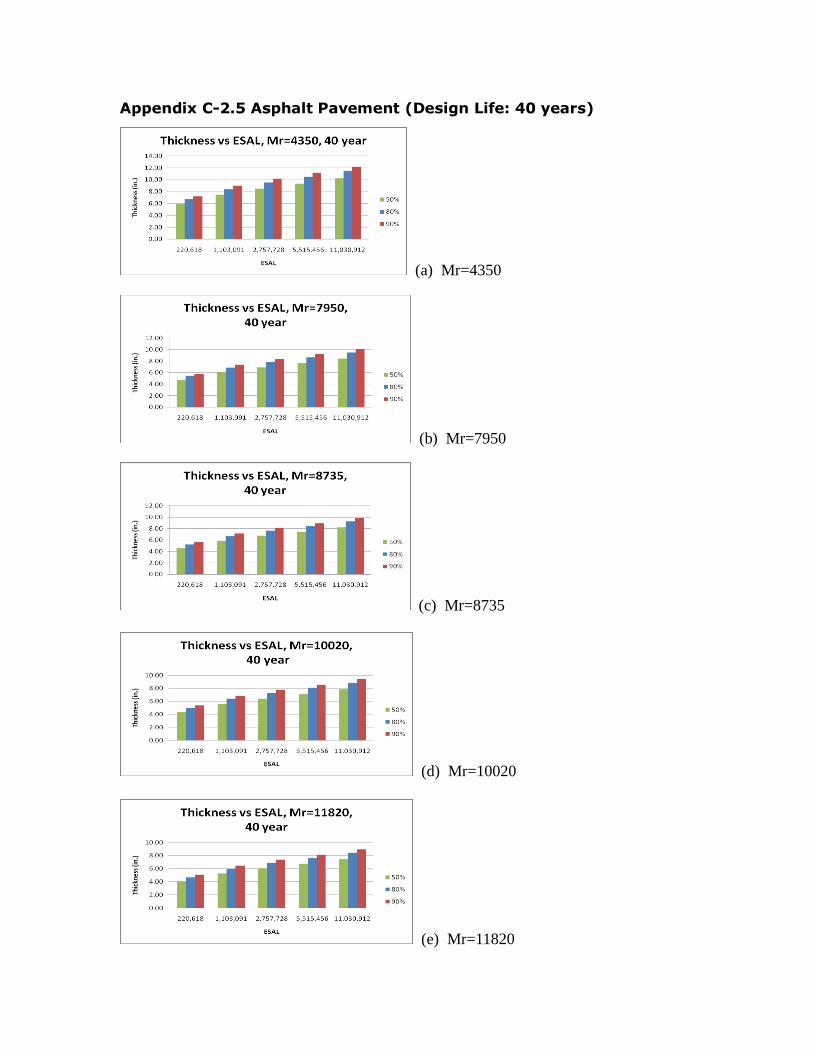
Appendix C-2.5 Asphalt Pavement (Design Life: 40 years)
(a) Mr=4350
(b) Mr=7950
(c) Mr=8735
(d) Mr=10020
(e) Mr=11820
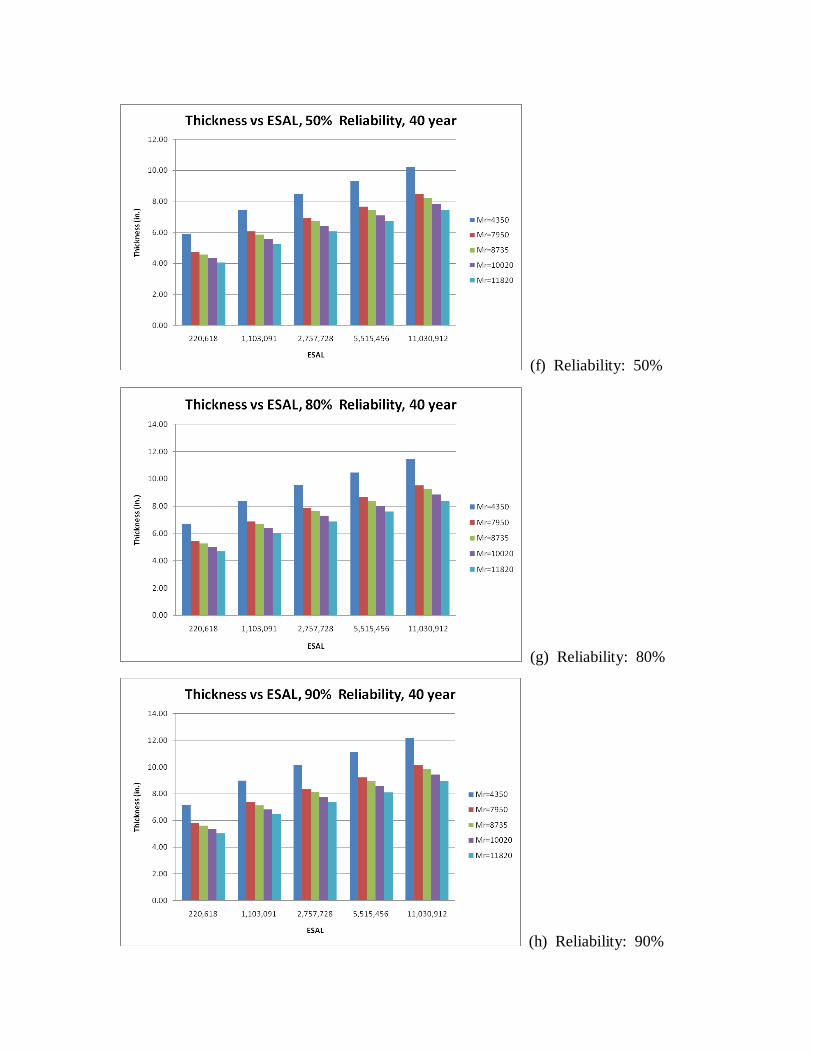
(f) Reliability: 50%
(g) Reliability: 80%
(h) Reliability: 90%
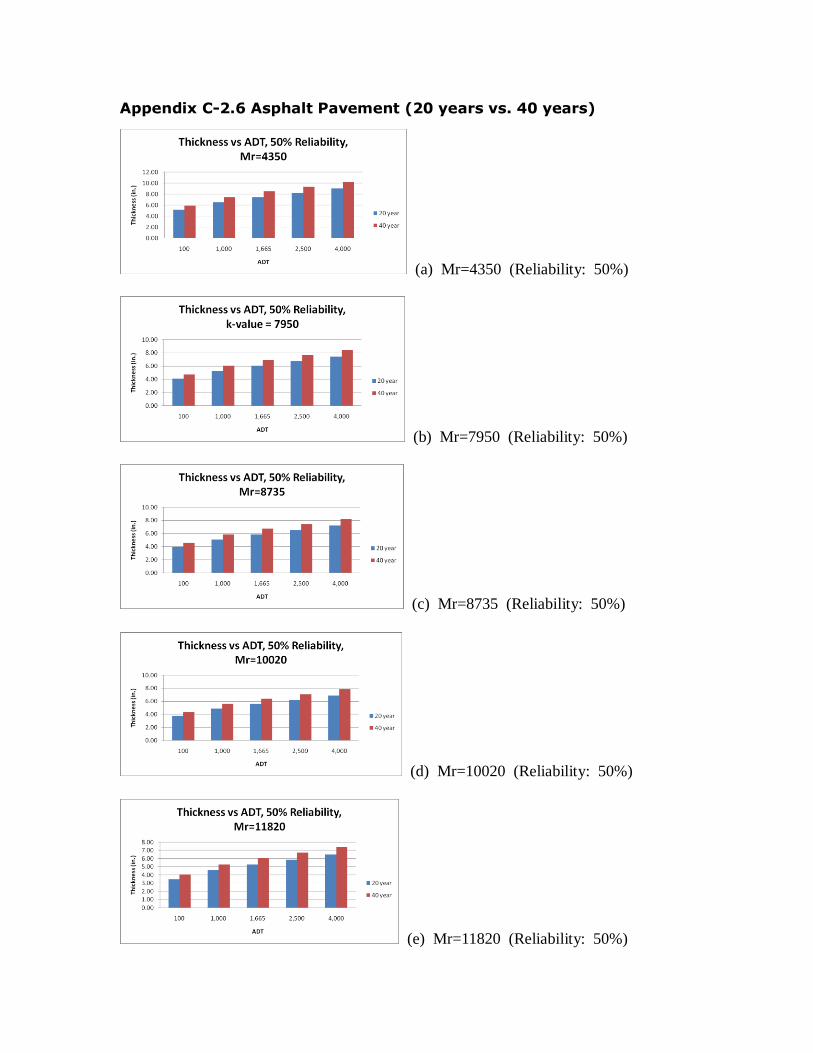
Appendix C-2.6 Asphalt Pavement (20 years vs. 40 years)
(a) Mr=4350 (Reliability: 50%)
(b) Mr=7950 (Reliability: 50%)
(c) Mr=8735 (Reliability: 50%)
(d) Mr=10020 (Reliability: 50%)
(e) Mr=11820 (Reliability: 50%)
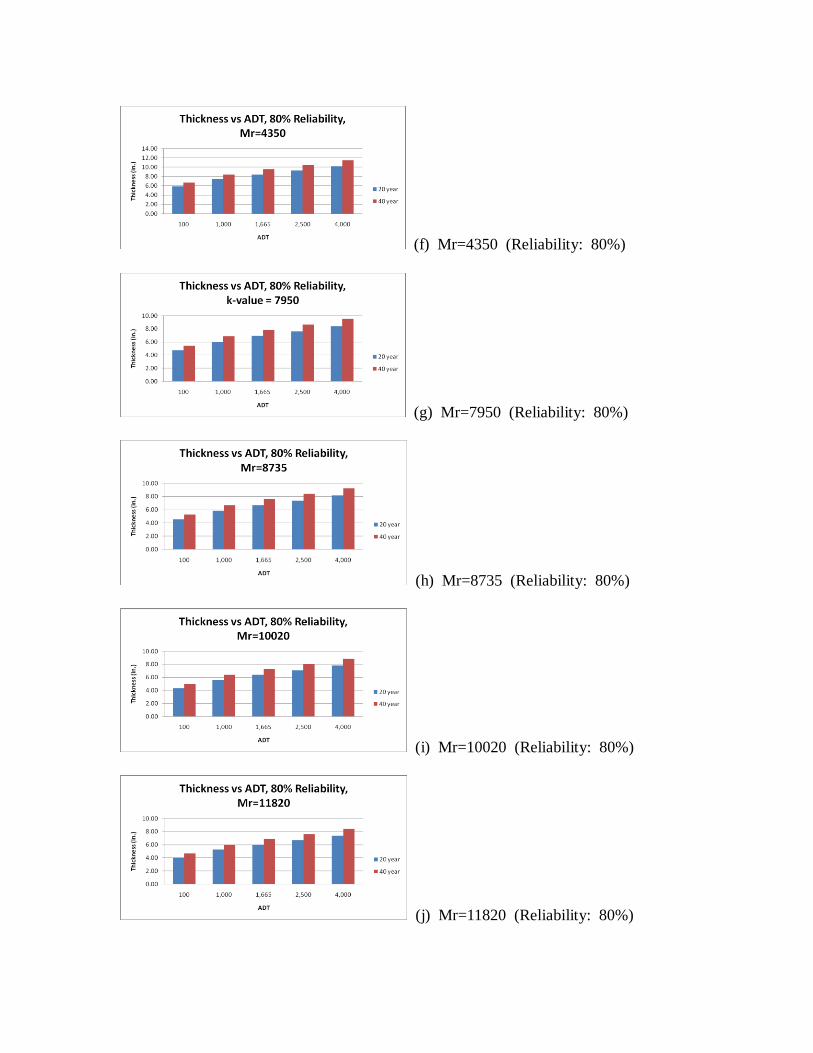
(f) Mr=4350 (Reliability: 80%)
(g) Mr=7950 (Reliability: 80%)
(h) Mr=8735 (Reliability: 80%)
(i) Mr=10020 (Reliability: 80%)
(j) Mr=11820 (Reliability: 80%)
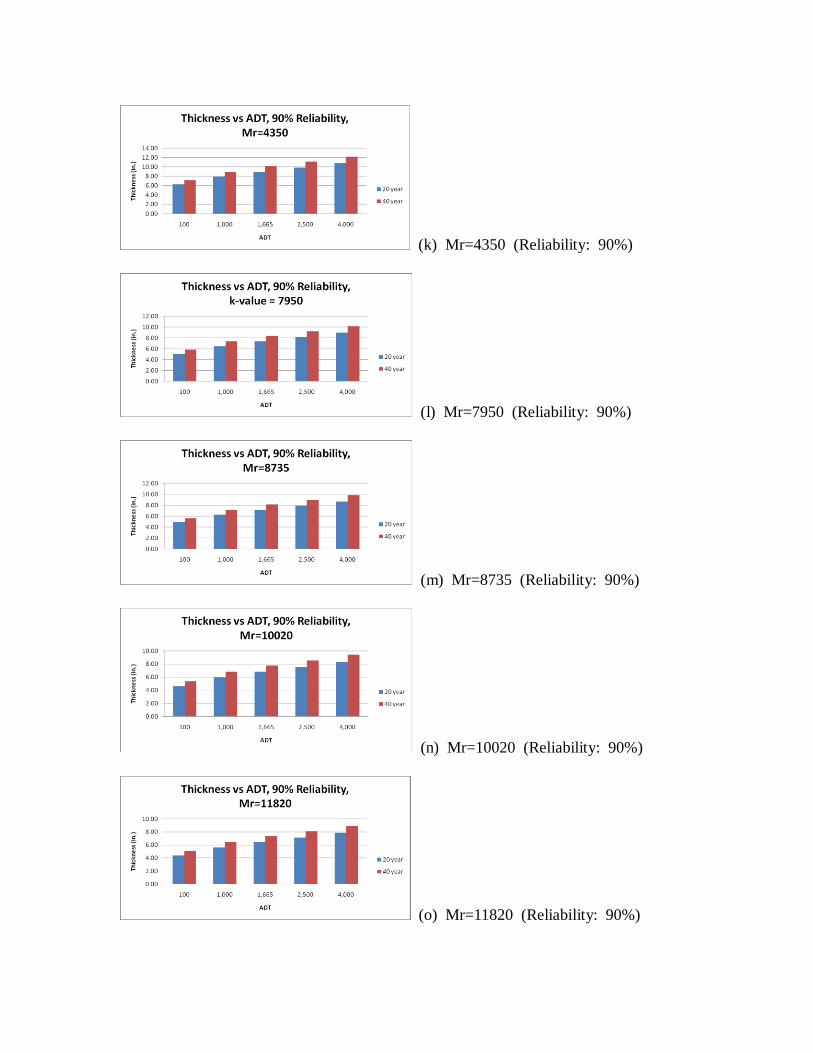
(k) Mr=4350 (Reliability: 90%)
(l) Mr=7950 (Reliability: 90%)
(m) Mr=8735 (Reliability: 90%)
(n) Mr=10020 (Reliability: 90%)
(o) Mr=11820 (Reliability: 90%)
C-3 APAI Software
C-3.1 Asphalt Pavement (Design Life: 20 years)
C-3.2 Asphalt Pavement (Design Life: 40 years)
C-3.3 Asphalt Pavement (20 years vs. 40 years)
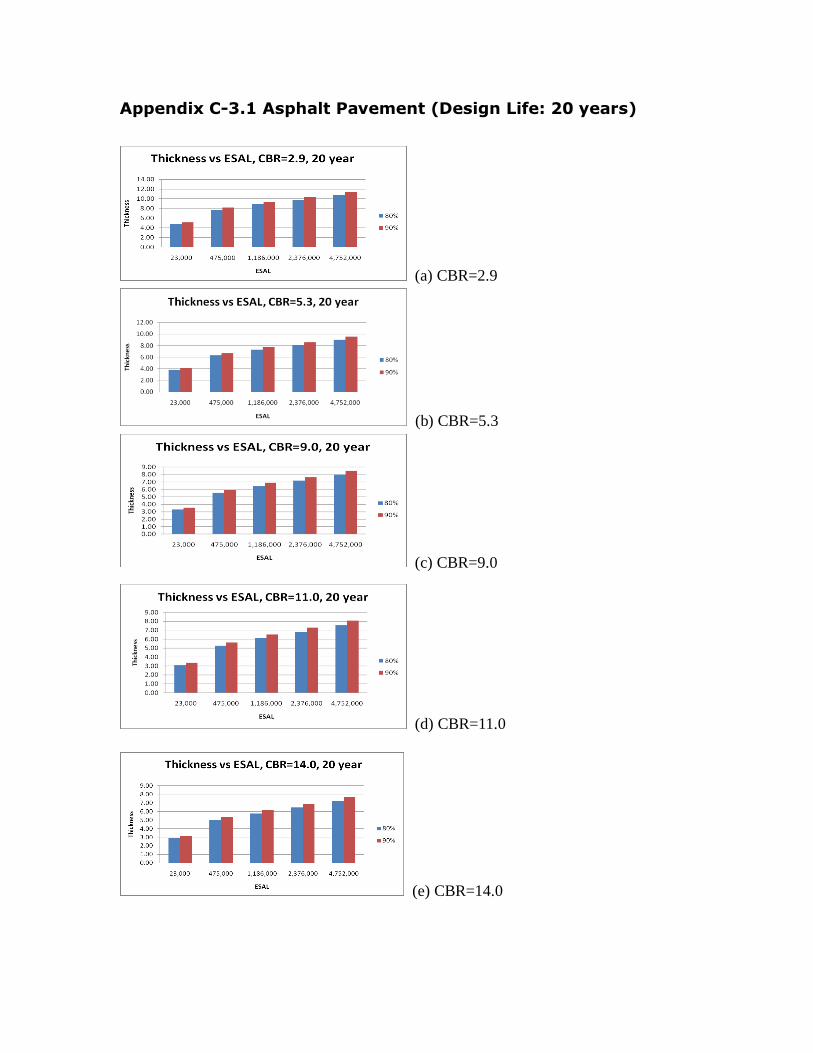
Appendix C-3.1 Asphalt Pavement (Design Life: 20 years)
(a) CBR=2.9
(b) CBR=5.3
(c) CBR=9.0
(d) CBR=11.0
(e) CBR=14.0
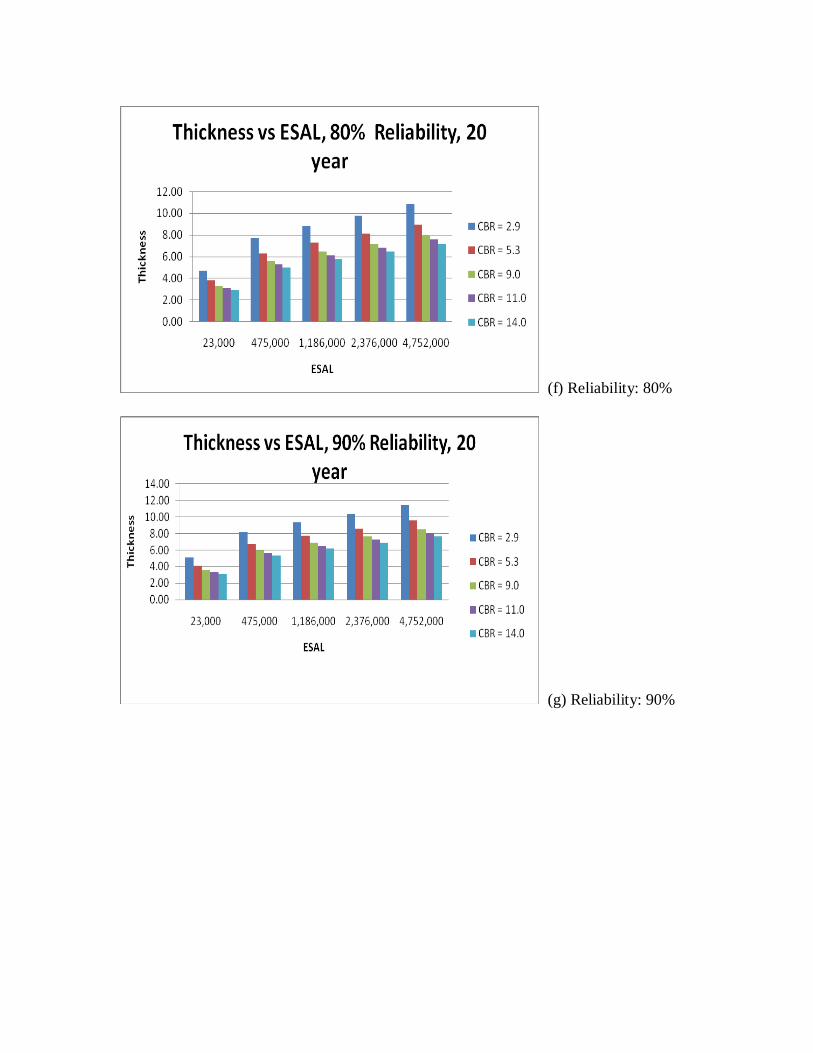
(f) Reliability: 80%
(g) Reliability: 90%
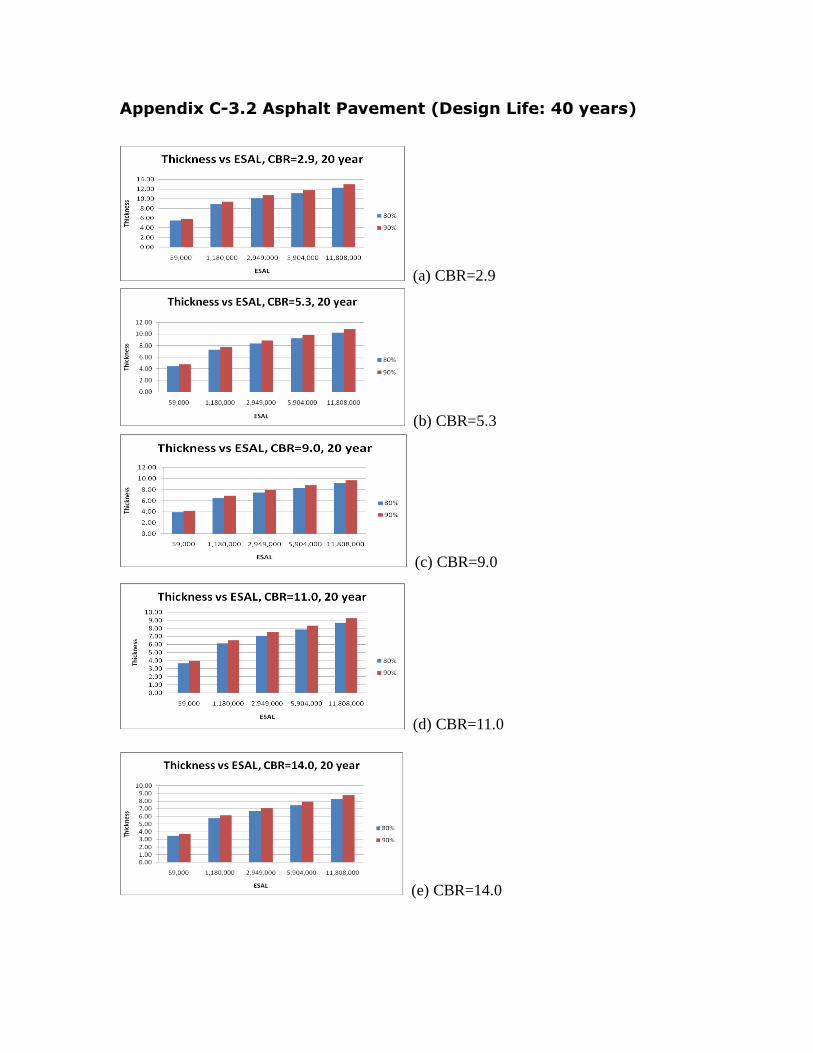
Appendix C-3.2 Asphalt Pavement (Design Life: 40 years)
(a) CBR=2.9
(b) CBR=5.3
(c) CBR=9.0
(d) CBR=11.0
(e) CBR=14.0
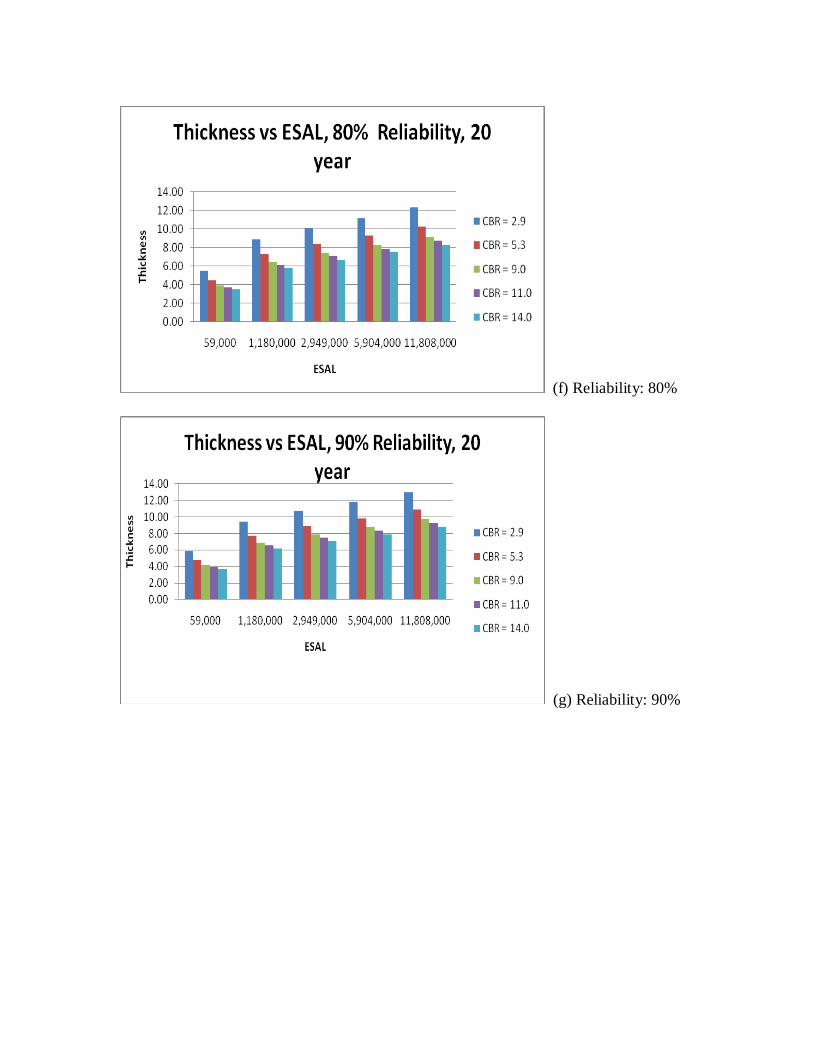
(f) Reliability: 80%
(g) Reliability: 90%
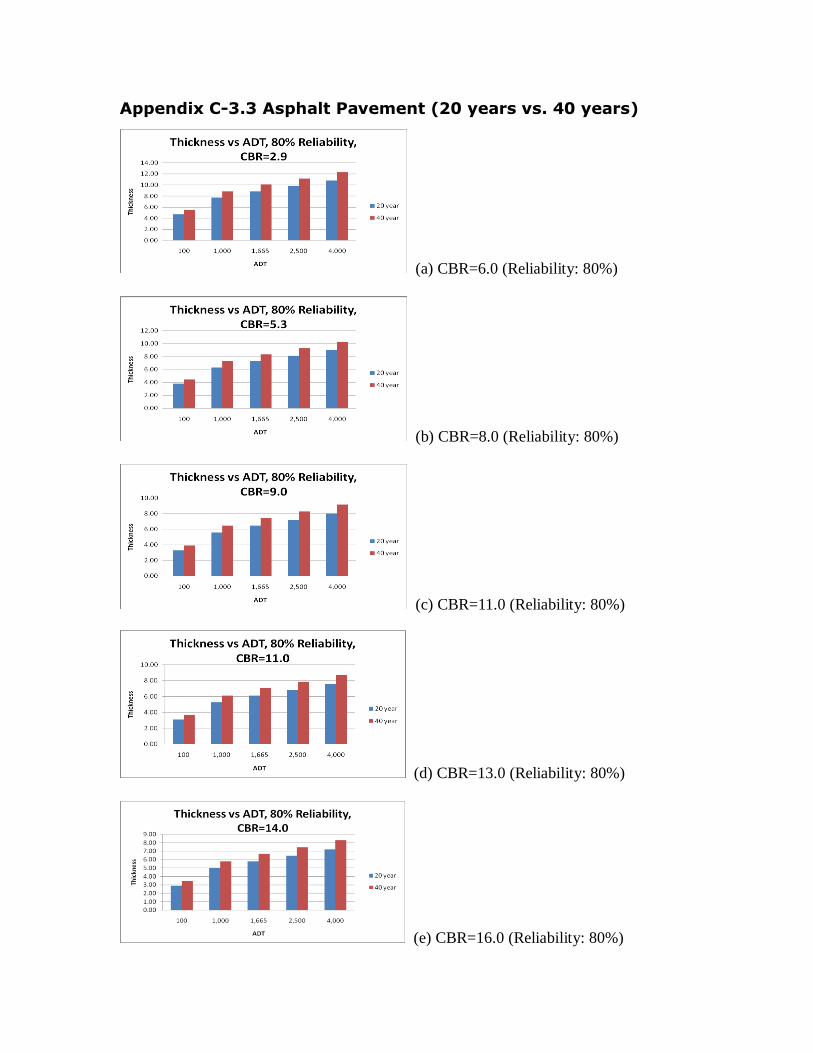
Appendix C-3.3 Asphalt Pavement (20 years vs. 40 years)
(a) CBR=6.0 (Reliability: 80%)
(b) CBR=8.0 (Reliability: 80%)
(c) CBR=11.0 (Reliability: 80%)
(d) CBR=13.0 (Reliability: 80%)
(e) CBR=16.0 (Reliability: 80%)
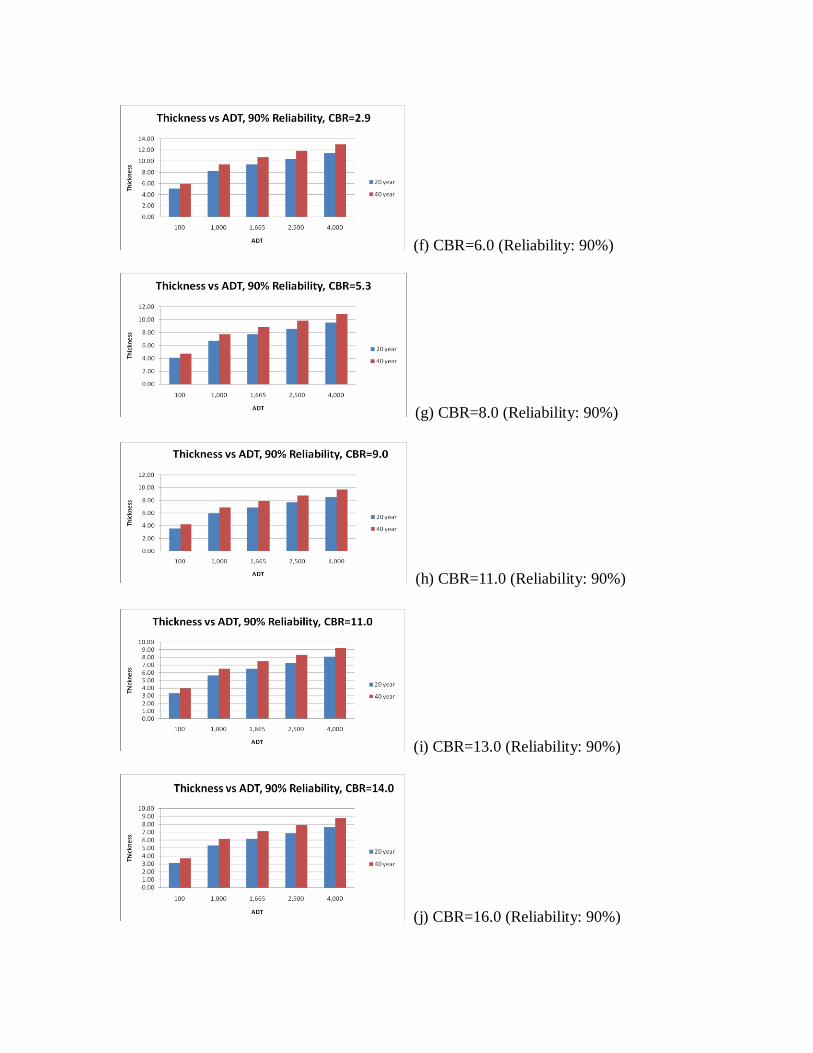
(f) CBR=6.0 (Reliability: 90%)
(g) CBR=8.0 (Reliability: 90%)
(h) CBR=11.0 (Reliability: 90%)
(i) CBR=13.0 (Reliability: 90%)
(j) CBR=16.0 (Reliability: 90%)

C-4 Comparison
C-4.1 Asphalt Pavement (WinPas vs. StreetPave vs. APAI)
C-4.2 Concrete Pavement (WinPas vs. StreetPave)
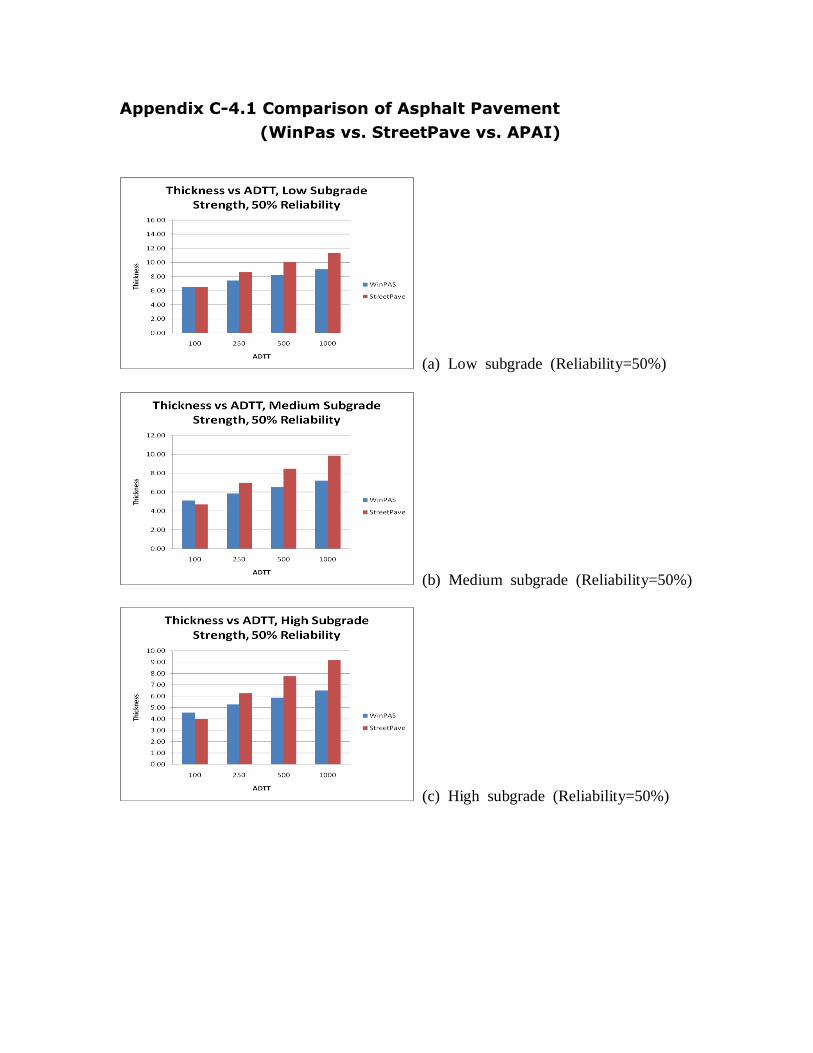
Appendix C-4.1 Comparison of Asphalt Pavement
(WinPas vs. StreetPave vs. APAI)
(a) Low subgrade (Reliability=50%)
(b) Medium subgrade (Reliability=50%)
(c) High subgrade (Reliability=50%)
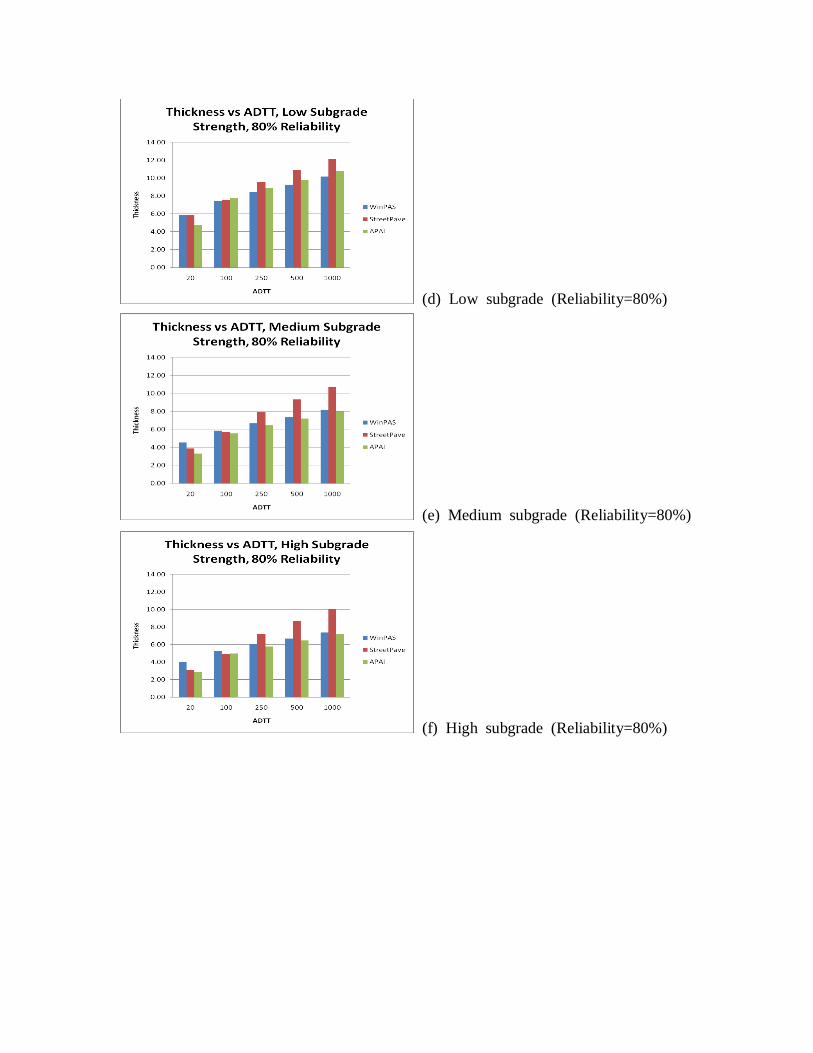
(d) Low subgrade (Reliability=80%)
(e) Medium subgrade (Reliability=80%)
(f) High subgrade (Reliability=80%)
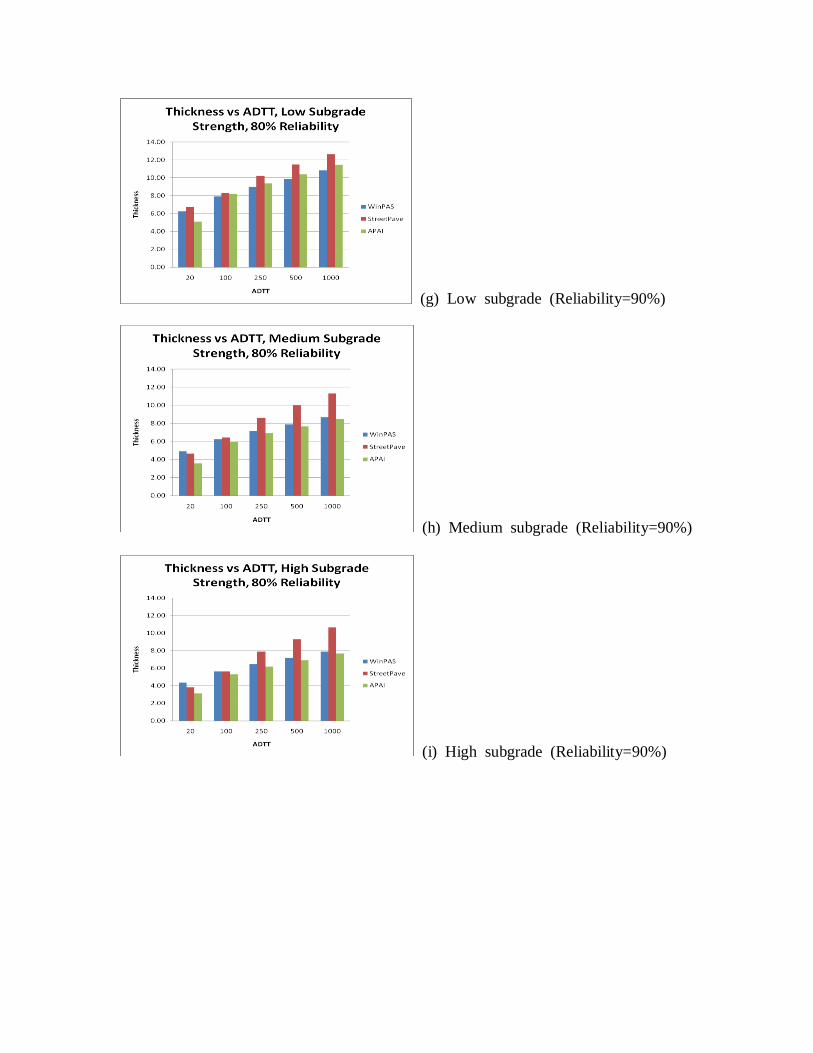
(g) Low subgrade (Reliability=90%)
(h) Medium subgrade (Reliability=90%)
(i) High subgrade (Reliability=90%)
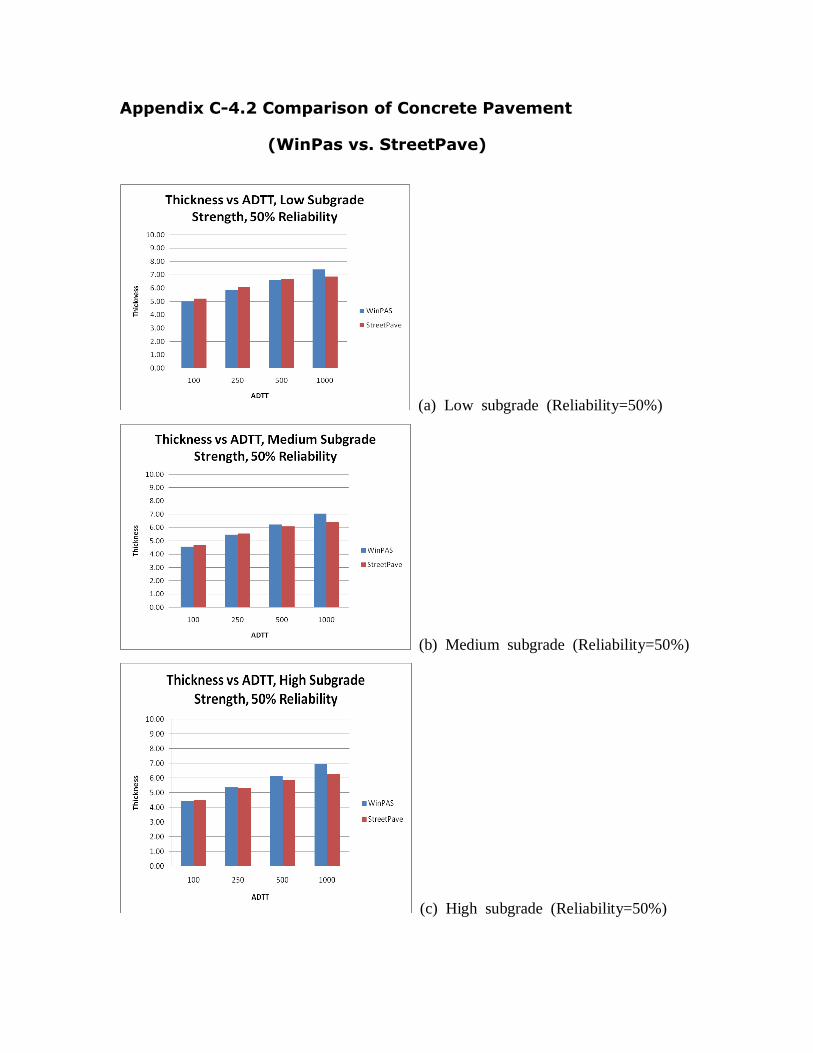
Appendix C-4.2 Comparison of Concrete Pavement
(WinPas vs. StreetPave)
(a) Low subgrade (Reliability=50%)
(b) Medium subgrade (Reliability=50%)
(c) High subgrade (Reliability=50%)
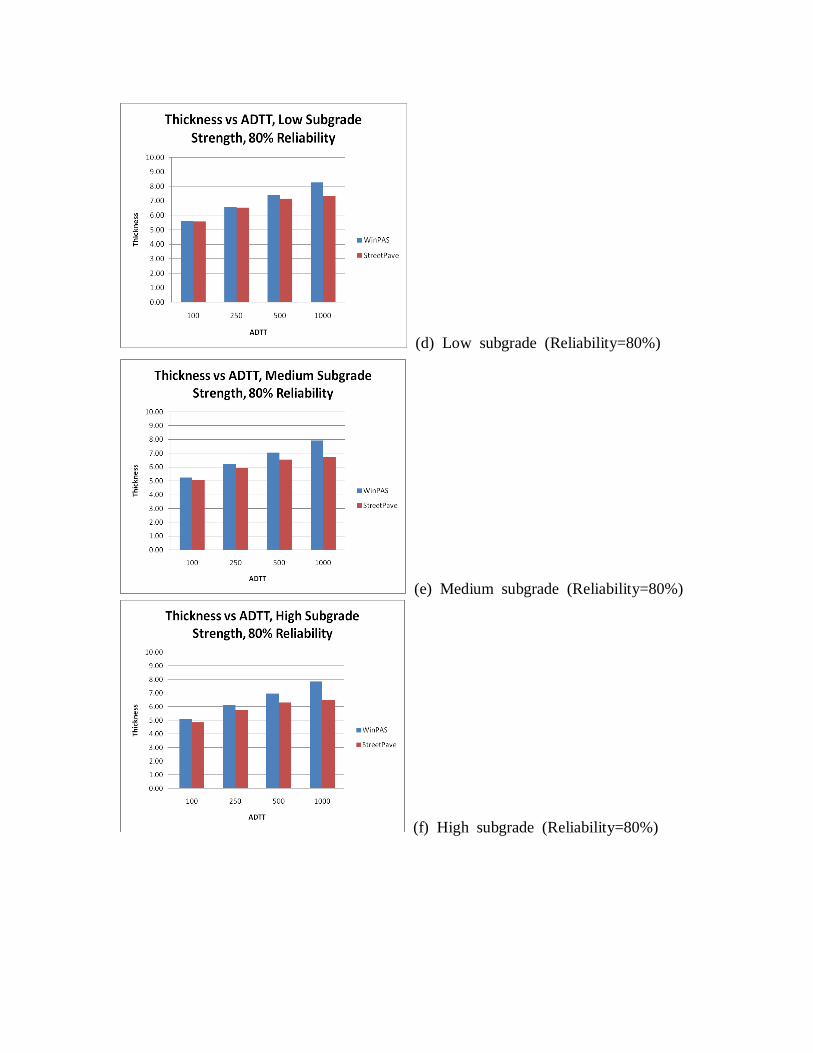
(d) Low subgrade (Reliability=80%)
(e) Medium subgrade (Reliability=80%)
(f) High subgrade (Reliability=80%)
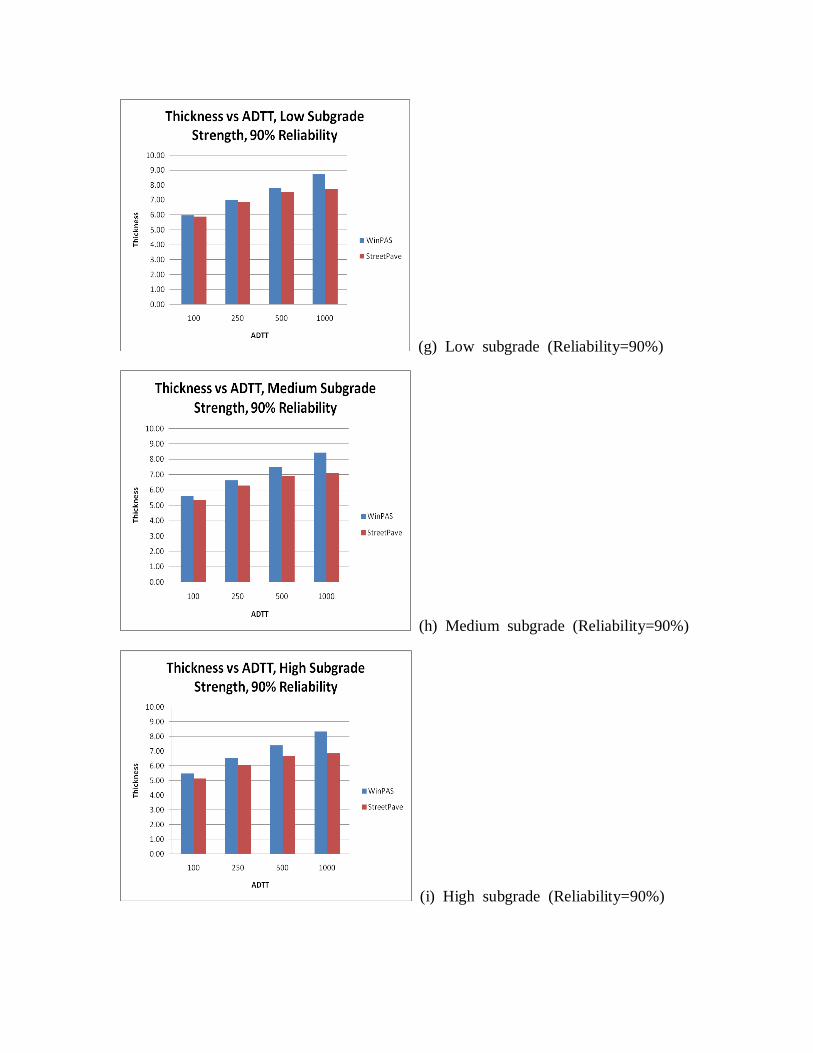
(g) Low subgrade (Reliability=90%)
(h) Medium subgrade (Reliability=90%)
(i) High subgrade (Reliability=90%)