parafield stormwater harvesting water quality data may
TRANSCRIPT
Parafield stormwater harvesting water quality
data May – December 2009 summary report for
Adelaide and Mt Lofty Ranges Natural
Resources Management Board
Karen Barry
Water for a Healthy Country Flagship Report
March 2010
Water for a Healthy Country Flagship Report series ISSN: 1835-095X
Australia is founding its future on science and innovation. Its national science agency, CSIRO, is a
powerhouse of ideas, technologies and skills.
CSIRO initiated the National Research Flagships to address Australia’s major research challenges
and opportunities. They apply large scale, long term, multidisciplinary science and aim for widespread
adoption of solutions. The Flagship Collaboration Fund supports the best and brightest researchers to
address these complex challenges through partnerships between CSIRO, universities, research
agencies and industry.
The Water for a Healthy Country Flagship aims to provide Australia with solutions for water resource
management, creating economic gains of $3 billion per annum by 2030, while protecting or restoring
our major water ecosystems.
For more information about Water for a Healthy Country Flagship or the National Research Flagship
Initiative visit www.csiro.au/org/HealthyCountry.html
Citation: Barry, K ., 2010. Parafield stormwater harvesting water quality data May – December 2009
summary report for Adelaide and Mt Lofty Ranges Natural Resources Management Board. Water for
a Healthy Country National Research Flagship Report
Copyright and Disclaimer
© 2010 CSIRO To the extent permitted by law, all rights are reserved and no part of this publication
covered by copyright may be reproduced or copied in any form or by any means except with the
written permission of CSIRO or Adelaide and Mt Lofty Ranges Natural Resources Management Board.
Important Disclaimer:
CSIRO advises that the information contained in this publication comprises general statements based
on scientific research. The reader is advised and needs to be aware that such information may be
incomplete or unable to be used in any specific situation. No reliance or actions must therefore be
made on that information without seeking prior expert professional, scientific and technical advice. To
the extent permitted by law, CSIRO (including its employees and consultants) excludes all liability to
any person for any consequences, including but not limited to all losses, damages, costs, expenses
and any other compensation, arising directly or indirectly from using this publication (in part or in
whole) and any information or material contained in it.
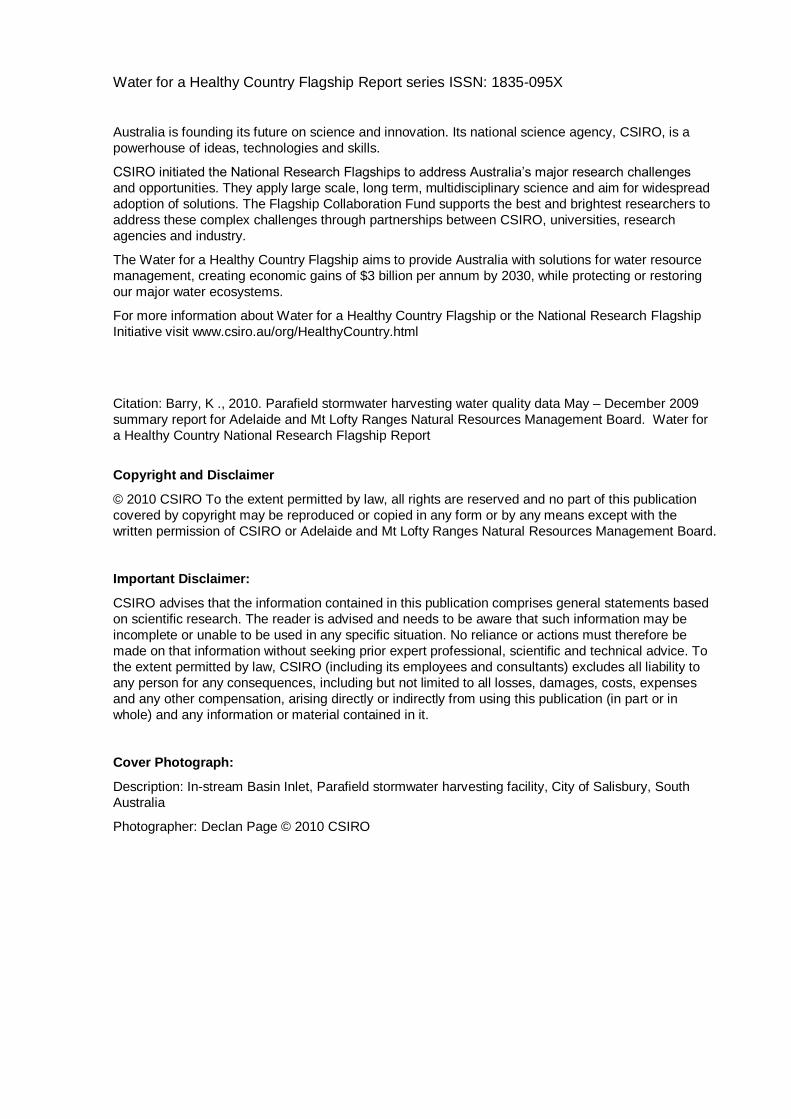
Cover Photograph:
Description: In-stream Basin Inlet, Parafield stormwater harvesting facility, City of Salisbury, South
Australia
Photographer: Declan Page © 2010 CSIRO
i
TABLE OF CONTENTS
Acknowledgements ..................................................................................................... i
1. Introduction ....................................................................................................... 1
2. Monitoring Program .......................................................................................... 1
3. Results and Discussion .................................................................................... 3
4. SUMMARY ....................................................................................................... 10
References ................................................................................................................ 10
APPENDIX A - SUMMARY OF ALL Parameters and Sampling Suites .................. 11
APPENDIX B – Water Quality Data from Field measurements, CSIRO and AWQC laboratories ......................................................................................... 13
APPENDIX C – All Trace organic and pharmaceutical data available data from NMI, QHSS and AWQC labs ............................................................................ 21
ACKNOWLEDGEMENTS
The Parafield stormwater quality monitoring project (May – December 2009) was funded by the Adelaide and Mount Lofty Natural Resource Management Board to allow water quality monitoring to continue between the end of the Aquifer Storage Transfer Recovery (ASTR) project and the proposed squeal project on managed aquifer recharge and urban stormwater use options. The City of Salisbury provided water quality data for the first wetland outlet sample and operated the Parafield stormwater harvesting system. The following CSIRO personnel assisted with the water quality sampling, Kerry Levett, Joanne Vanderzalm and volunteer student Dennis Gonzalas. Data were reviewed by Peter Dillon and Declan Page.
1
1. INTRODUCTION
The Aquifer Storage Transfer and Recovery (ASTR) project aimed to determine whether reedbed-treated stormwater that had been stored in an initially brackish aquifer could be recovered at a quality that met drinking water guidelines. It was shown that on a one off basis recovered water met the Australian Drinking Water Guidelines (Page et al. 2009) based on the water quality monitoring data between
September 2006 and March 2009. A distinguishing feature of that report was that it followed the risk assessment process of the Australian Guidelines for Water Recycling 2C: Managed Aquifer Recharge (NRMMC–EPHC-NHMRC 2009) and also addresses the Australian Guidelines for Water Recycling 2A: Augmentation of Drinking Water Supplies (NRMMC-EPHC–NHMRCC 2008). However, the report
identified that further assessment was necessary to ensure the risks to human health and the environment could be managed on a continuous basis. As such a sequel project ‘MAR and Urban Stormwater Use Options’ has been proposed that will address the remaining concerns about public health, environment, infrastructure and community engagement.
To bridge the data gap between the end of the ASTR project and the beginning of the proposed sequel project, an interim water quality monitoring program commenced in May 2009 for the winter stormwater capture period, funded by the Adelaide and Mt. Lofty Ranges Natural Resources Management Board (AMLR-NRMB). This data will allow a continuous record of water quality to facilitate improved risk assessment for the sequel project. It also gave focus to the quality of water entering the Parafield harvesting system during winter storm events, while continuing to monitor the quality of water leaving the cleansing reedbed before aquifer recharge. The previous monitoring of the ASTR system facilitated the selection of the current monitoring parameters. The highest costs were associated with analysis of micropollutants and pathogens such as viruses. These had been determined to be the hazards with the highest associated risks (Page et al. 2009).
2. MONITORING PROGRAM
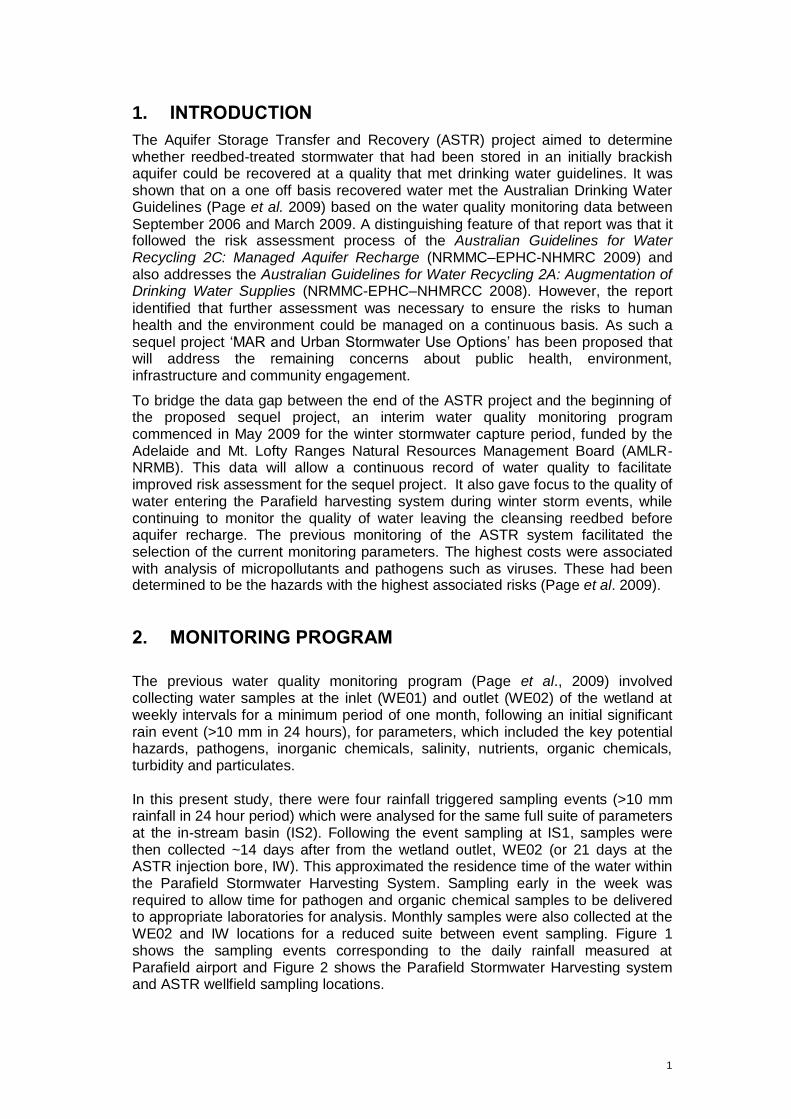
The previous water quality monitoring program (Page et al., 2009) involved collecting water samples at the inlet (WE01) and outlet (WE02) of the wetland at weekly intervals for a minimum period of one month, following an initial significant rain event (>10 mm in 24 hours), for parameters, which included the key potential hazards, pathogens, inorganic chemicals, salinity, nutrients, organic chemicals, turbidity and particulates. In this present study, there were four rainfall triggered sampling events (>10 mm rainfall in 24 hour period) which were analysed for the same full suite of parameters at the in-stream basin (IS2). Following the event sampling at IS1, samples were then collected ~14 days after from the wetland outlet, WE02 (or 21 days at the ASTR injection bore, IW). This approximated the residence time of the water within the Parafield Stormwater Harvesting System. Sampling early in the week was required to allow time for pathogen and organic chemical samples to be delivered to appropriate laboratories for analysis. Monthly samples were also collected at the WE02 and IW locations for a reduced suite between event sampling. Figure 1 shows the sampling events corresponding to the daily rainfall measured at Parafield airport and Figure 2 shows the Parafield Stormwater Harvesting system and ASTR wellfield sampling locations.
2
0
5
10
15
20
25
1/04
/2009
2/05
/2009
2/06
/2009
3/07
/2009
3/08
/2009
3/09
/2009
4/10
/2009
4/11
/2009
5/12
/2009
5/01
/2010
Rain (mm)
IS2
WE02
IW - injB B BD
Suite A
0
5
10
15
20
25
1/04
/2009
2/05
/2009
2/06
/2009
3/07
/2009
3/08
/2009
3/09
/2009
4/10
/2009
4/11
/2009
5/12
/2009
5/01
/2010
Rain (mm)
IS2
WE02
IW - injB B BD
Suite A
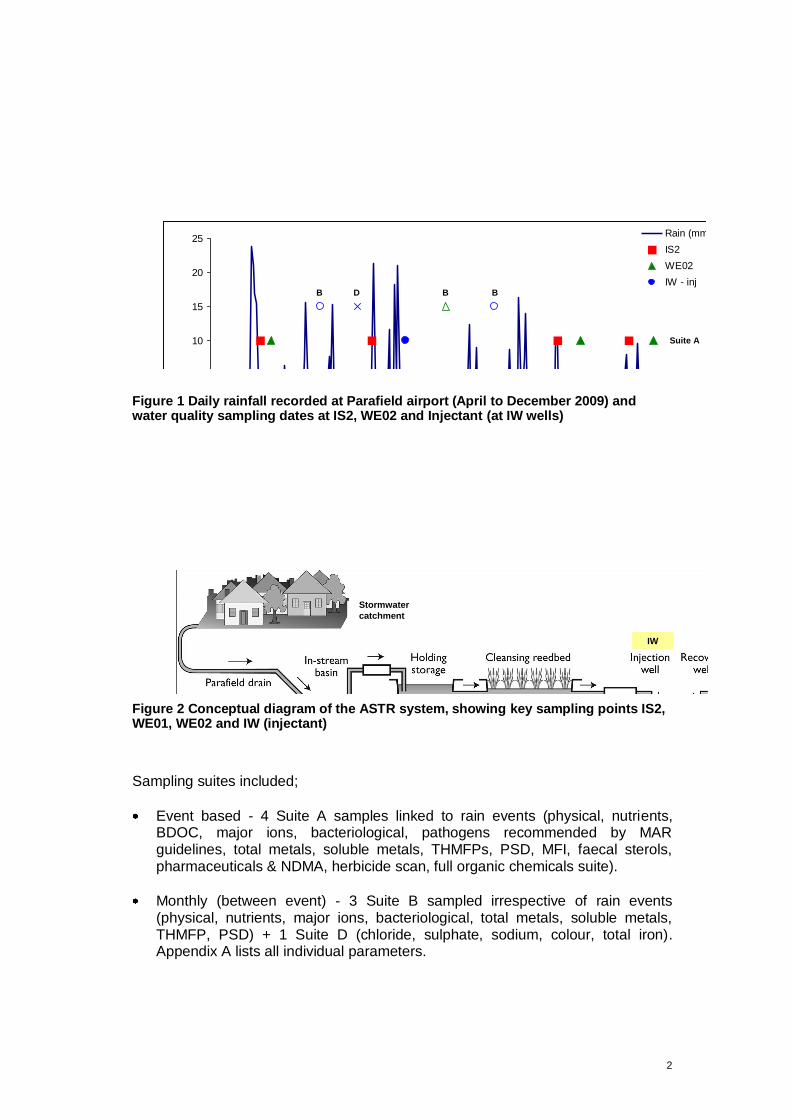
Figure 1 Daily rainfall recorded at Parafield airport (April to December 2009) and water quality sampling dates at IS2, WE02 and Injectant (at IW wells)
IS2
WE02
IW
Stormwater
catchment
WE01
IS2
WE02
IW
Stormwater
catchment
WE01
Figure 2 Conceptual diagram of the ASTR system, showing key sampling points IS2, WE01, WE02 and IW (injectant)
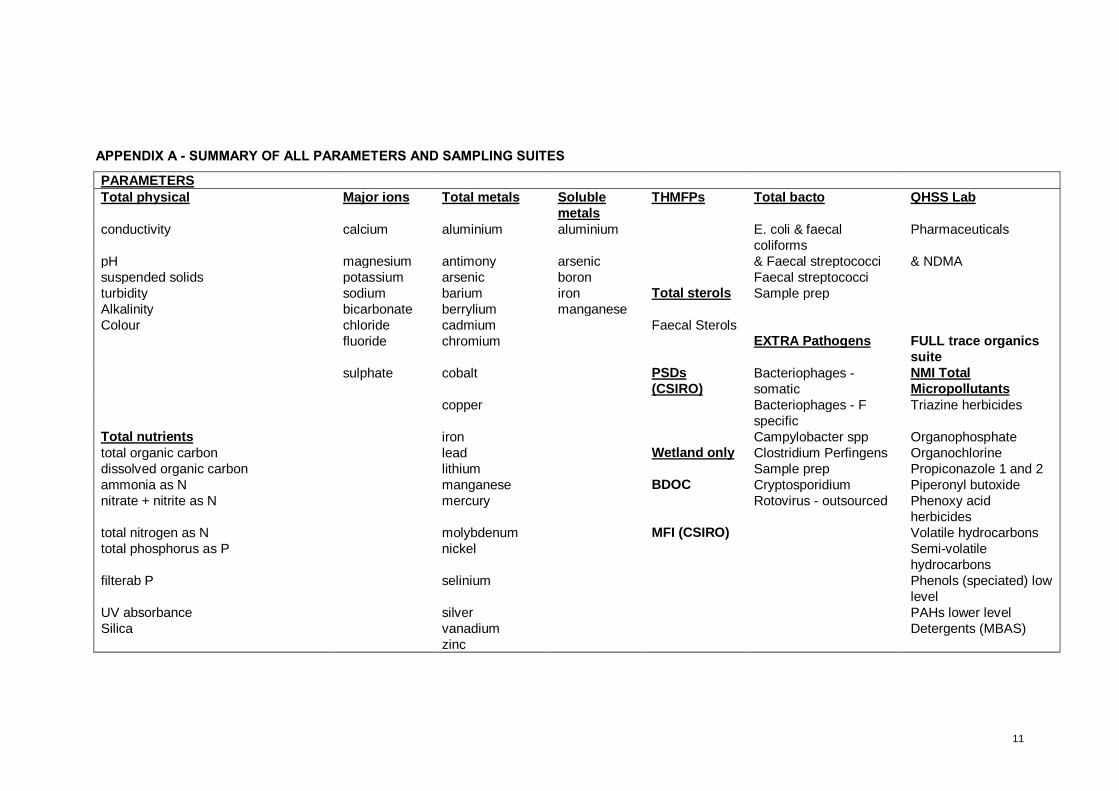
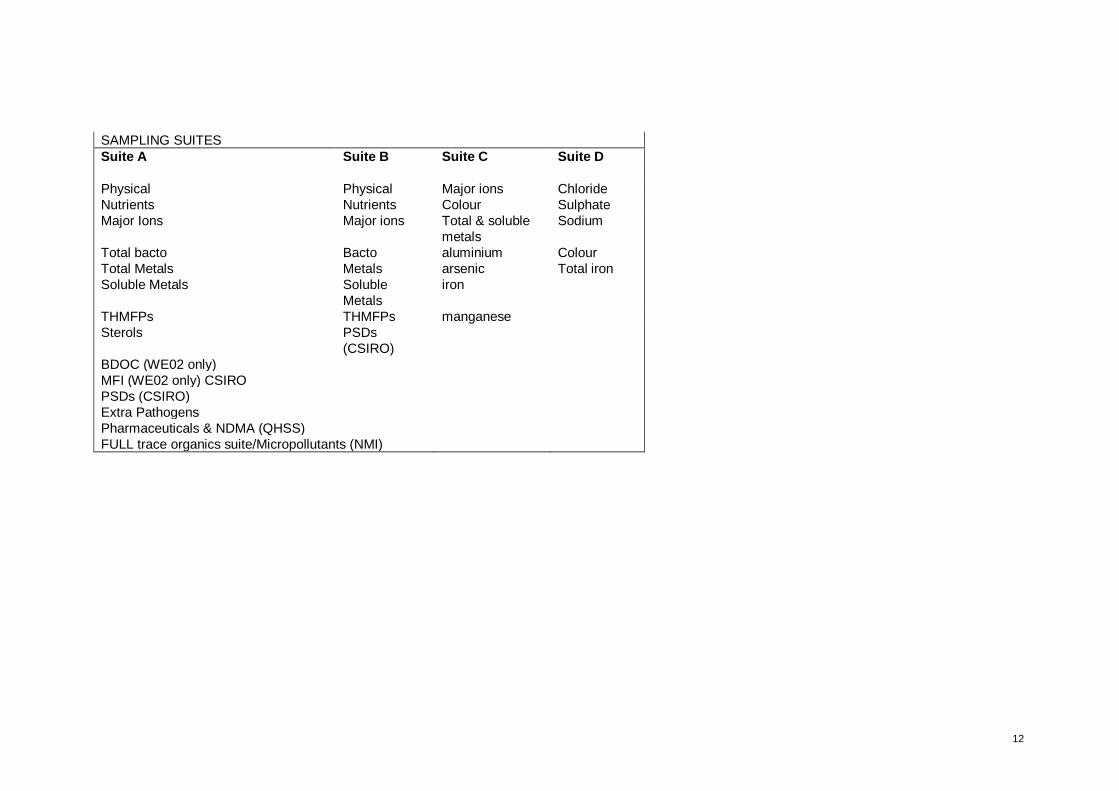
Sampling suites included;
Event based - 4 Suite A samples linked to rain events (physical, nutrients, BDOC, major ions, bacteriological, pathogens recommended by MAR guidelines, total metals, soluble metals, THMFPs, PSD, MFI, faecal sterols, pharmaceuticals & NDMA, herbicide scan, full organic chemicals suite).
Monthly (between event) - 3 Suite B sampled irrespective of rain events (physical, nutrients, major ions, bacteriological, total metals, soluble metals, THMFP, PSD) + 1 Suite D (chloride, sulphate, sodium, colour, total iron). Appendix A lists all individual parameters.
3
3. RESULTS AND DISCUSSION
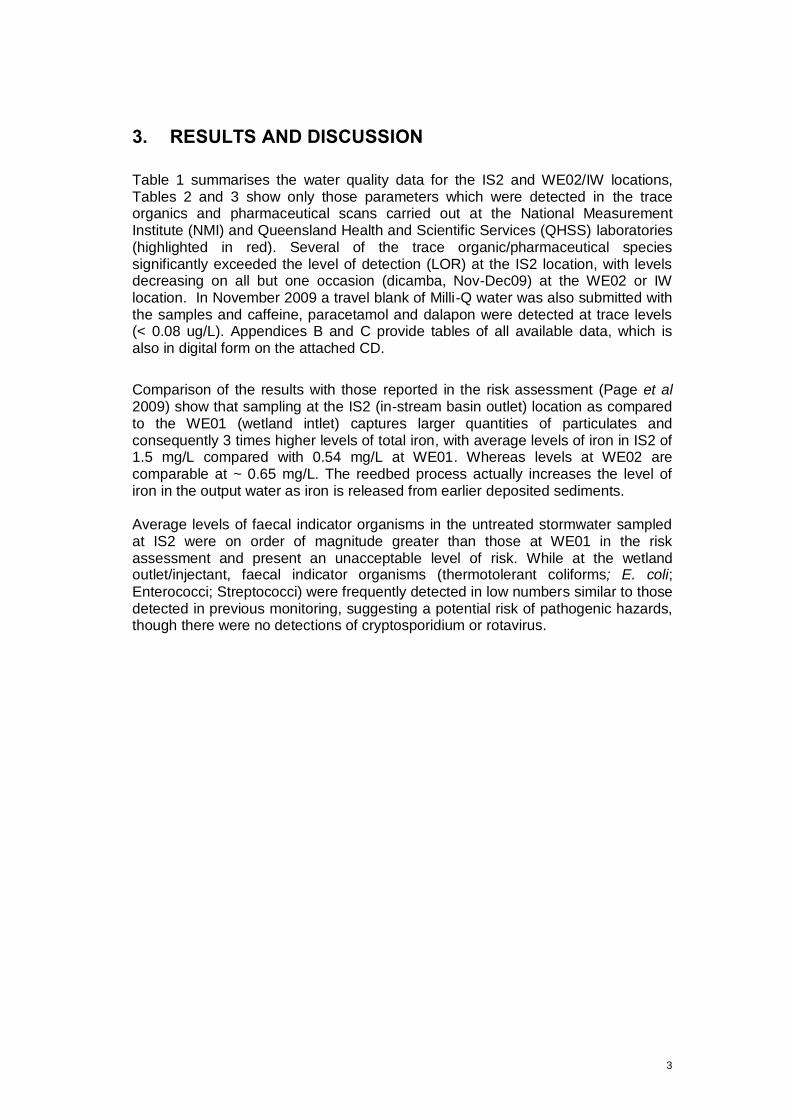
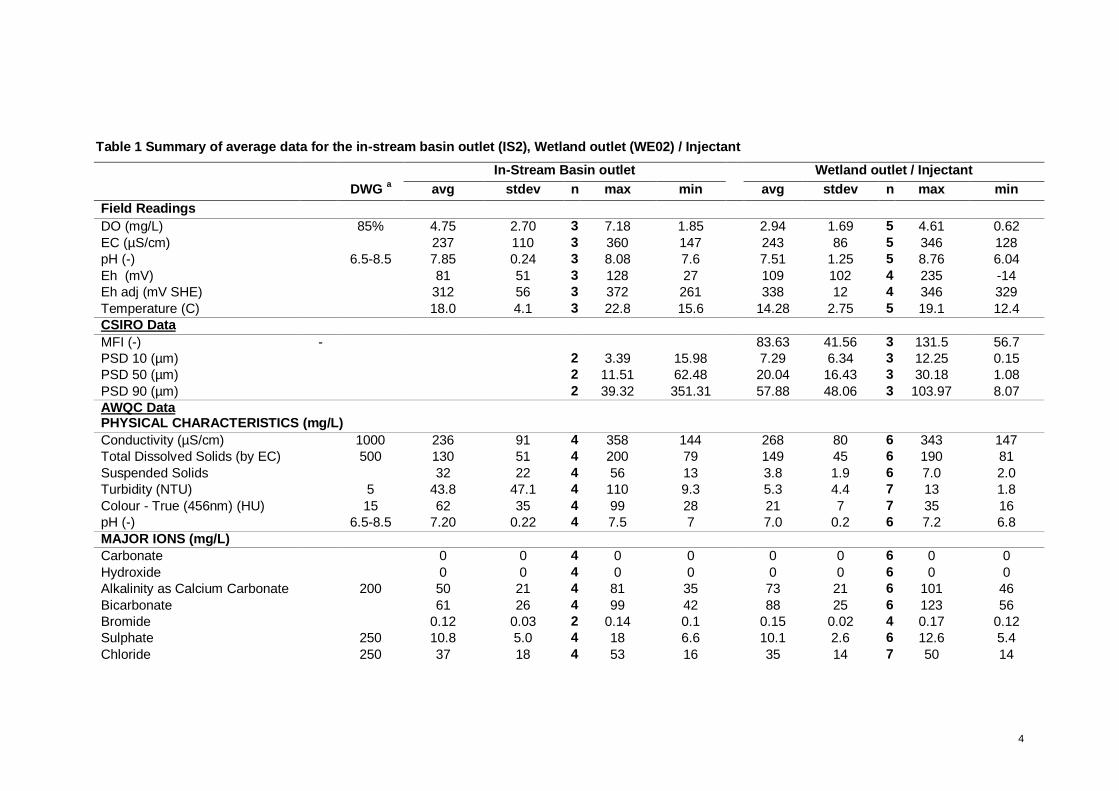
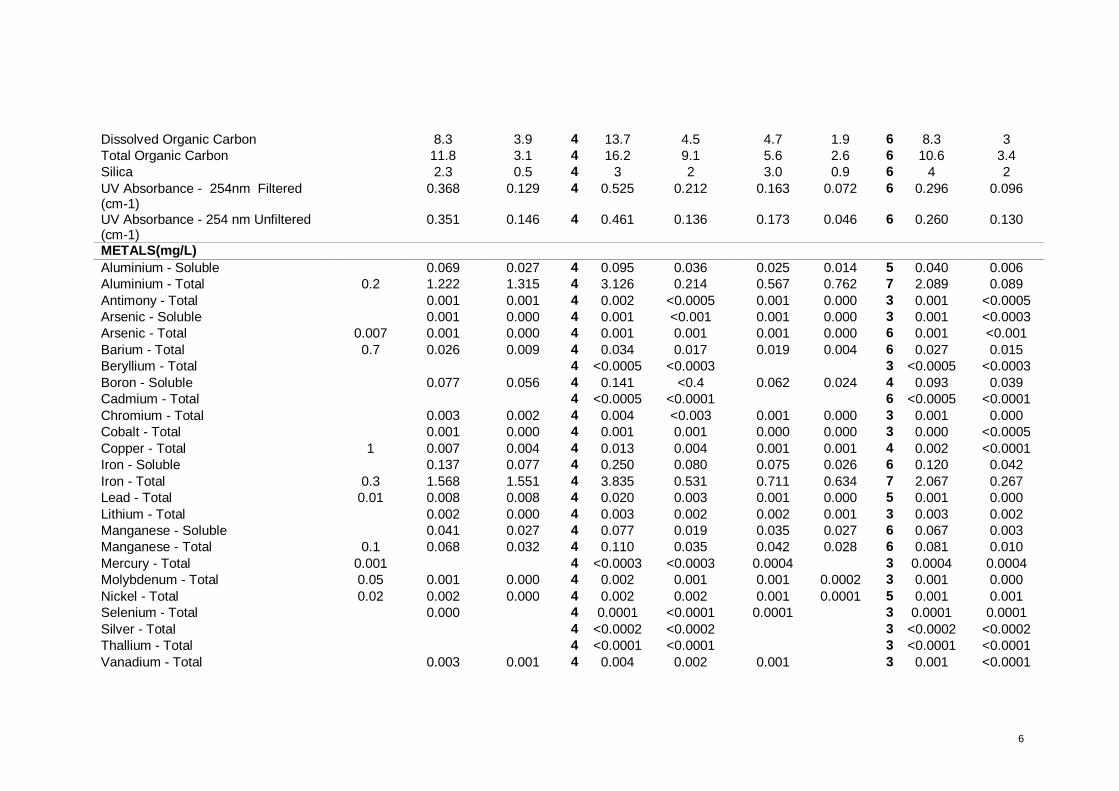
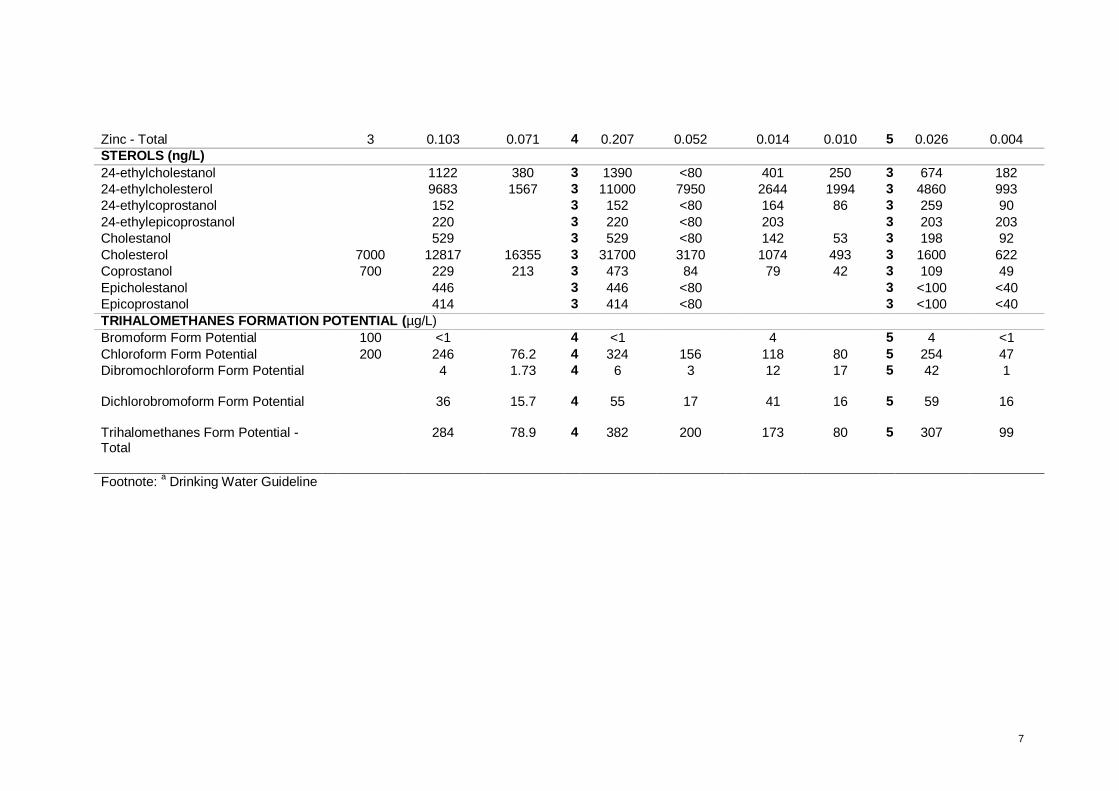
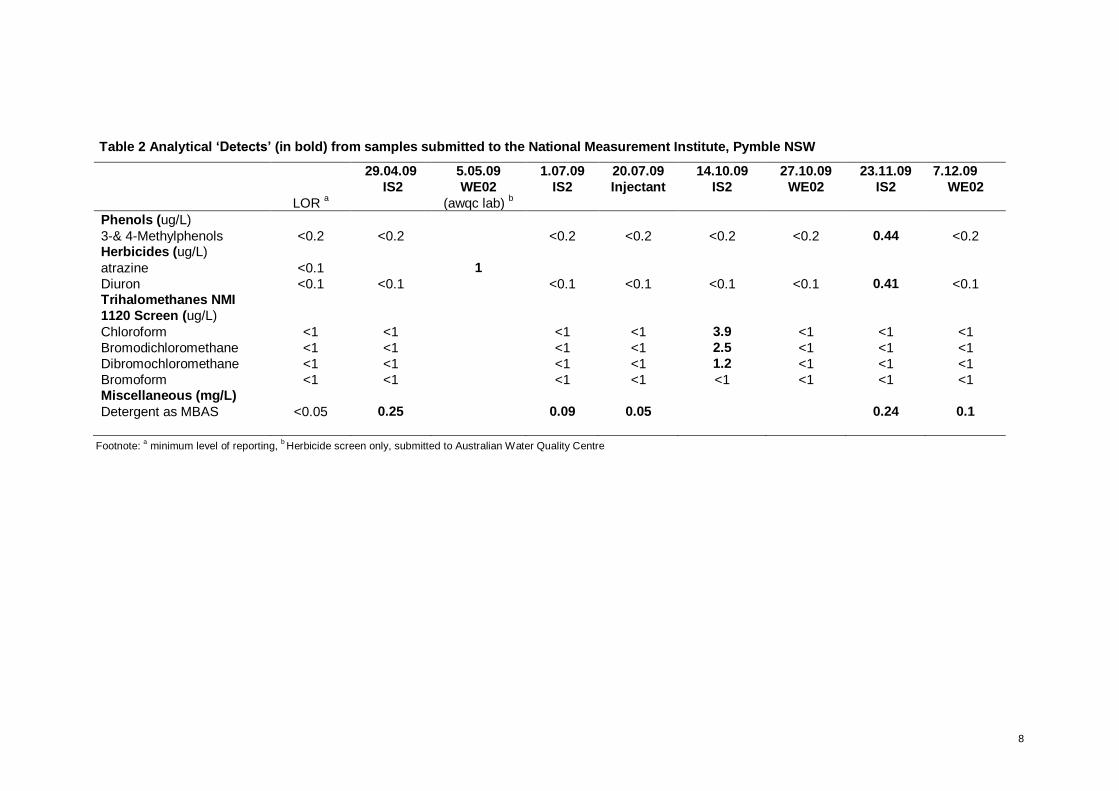
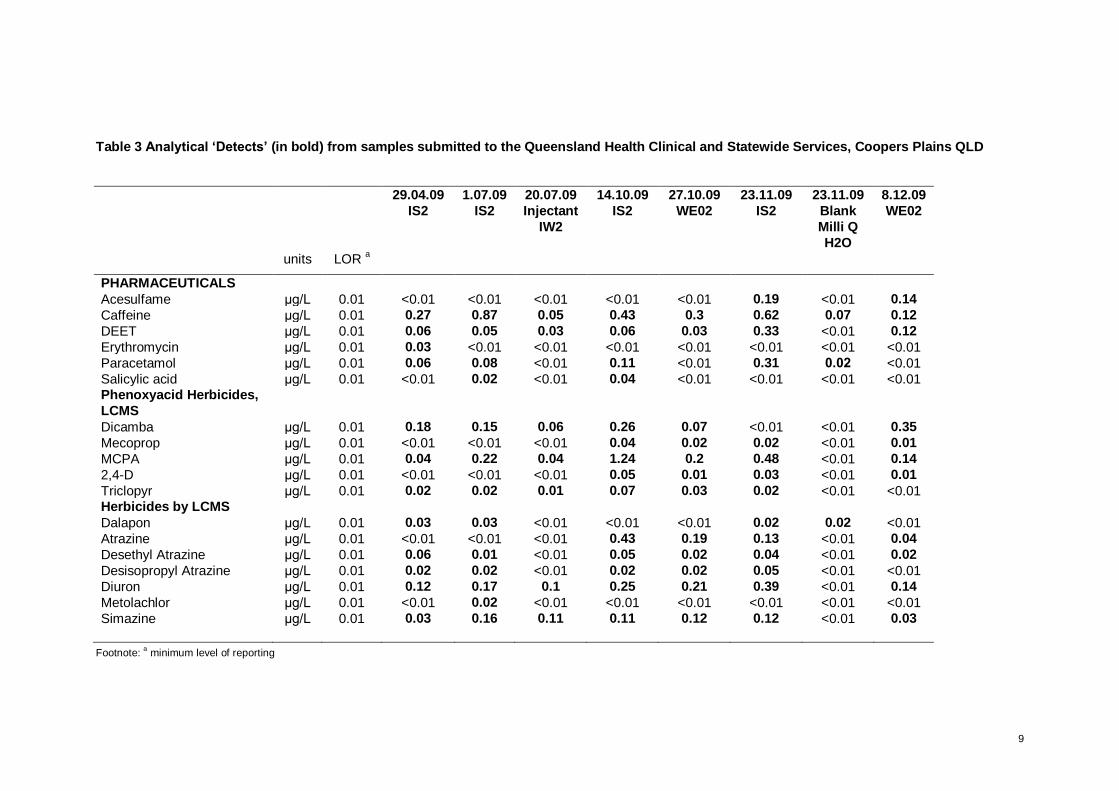
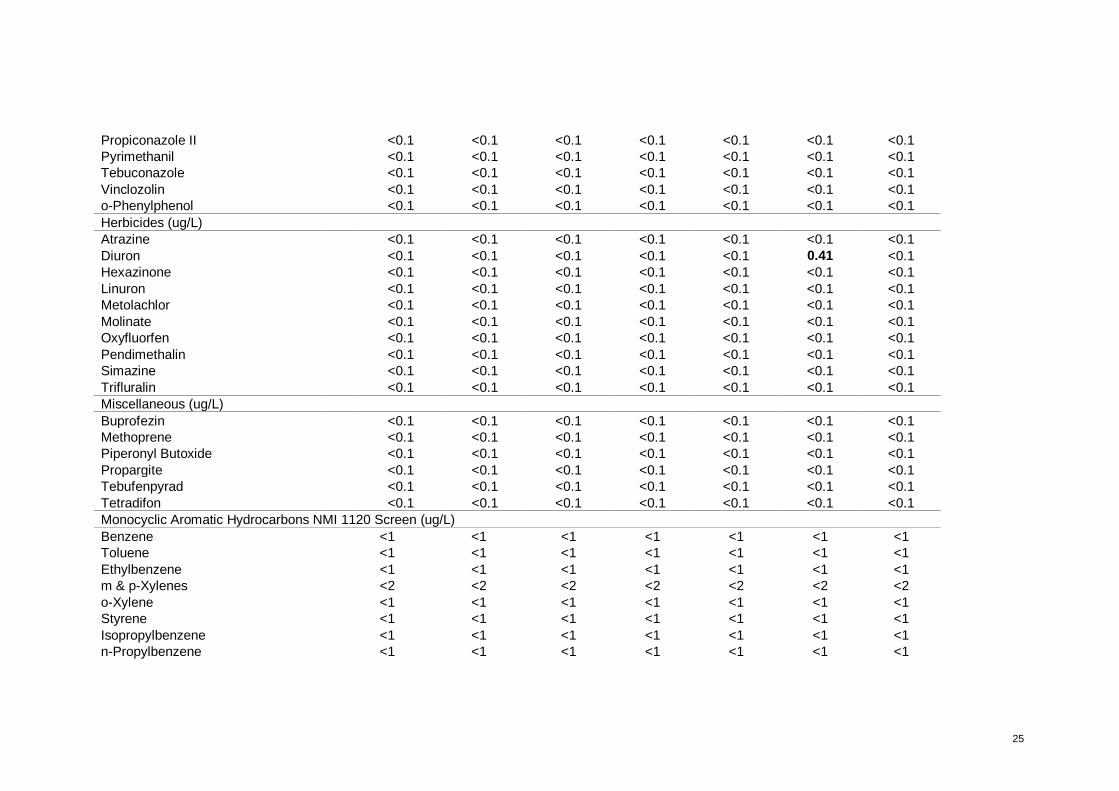
Table 1 summarises the water quality data for the IS2 and WE02/IW locations, Tables 2 and 3 show only those parameters which were detected in the trace organics and pharmaceutical scans carried out at the National Measurement Institute (NMI) and Queensland Health and Scientific Services (QHSS) laboratories (highlighted in red). Several of the trace organic/pharmaceutical species significantly exceeded the level of detection (LOR) at the IS2 location, with levels decreasing on all but one occasion (dicamba, Nov-Dec09) at the WE02 or IW location. In November 2009 a travel blank of Milli-Q water was also submitted with the samples and caffeine, paracetamol and dalapon were detected at trace levels (< 0.08 ug/L). Appendices B and C provide tables of all available data, which is also in digital form on the attached CD.
Comparison of the results with those reported in the risk assessment (Page et al 2009) show that sampling at the IS2 (in-stream basin outlet) location as compared to the WE01 (wetland intlet) captures larger quantities of particulates and consequently 3 times higher levels of total iron, with average levels of iron in IS2 of 1.5 mg/L compared with 0.54 mg/L at WE01. Whereas levels at WE02 are comparable at ~ 0.65 mg/L. The reedbed process actually increases the level of iron in the output water as iron is released from earlier deposited sediments. Average levels of faecal indicator organisms in the untreated stormwater sampled at IS2 were on order of magnitude greater than those at WE01 in the risk assessment and present an unacceptable level of risk. While at the wetland outlet/injectant, faecal indicator organisms (thermotolerant coliforms; E. coli;
Enterococci; Streptococci) were frequently detected in low numbers similar to those detected in previous monitoring, suggesting a potential risk of pathogenic hazards, though there were no detections of cryptosporidium or rotavirus.
4
Table 1 Summary of average data for the in-stream basin outlet (IS2), Wetland outlet (WE02) / Injectant
In-Stream Basin outlet Wetland outlet / Injectant
DWG a
avg stdev n max min avg stdev n max min
Field Readings
DO (mg/L) 85% 4.75 2.70 3 7.18 1.85 2.94 1.69 5 4.61 0.62
EC (µS/cm) 237 110 3 360 147 243 86 5 346 128
pH (-) 6.5-8.5 7.85 0.24 3 8.08 7.6 7.51 1.25 5 8.76 6.04
Eh (mV) 81 51 3 128 27 109 102 4 235 -14
Eh adj (mV SHE) 312 56 3 372 261 338 12 4 346 329
Temperature (C) 18.0 4.1 3 22.8 15.6 14.28 2.75 5 19.1 12.4
CSIRO Data
MFI (-) - 83.63 41.56 3 131.5 56.7
PSD 10 (µm) 2 3.39 15.98 7.29 6.34 3 12.25 0.15
PSD 50 (µm) 2 11.51 62.48 20.04 16.43 3 30.18 1.08
PSD 90 (µm) 2 39.32 351.31 57.88 48.06 3 103.97 8.07
AWQC Data PHYSICAL CHARACTERISTICS (mg/L)
Conductivity (µS/cm) 1000 236 91 4 358 144 268 80 6 343 147
Total Dissolved Solids (by EC) 500 130 51 4 200 79 149 45 6 190 81
Suspended Solids 32 22 4 56 13 3.8 1.9 6 7.0 2.0
Turbidity (NTU) 5 43.8 47.1 4 110 9.3 5.3 4.4 7 13 1.8
Colour - True (456nm) (HU) 15 62 35 4 99 28 21 7 7 35 16
pH (-) 6.5-8.5 7.20 0.22 4 7.5 7 7.0 0.2 6 7.2 6.8
MAJOR IONS (mg/L)
Carbonate 0 0 4 0 0 0 0 6 0 0
Hydroxide 0 0 4 0 0 0 0 6 0 0
Alkalinity as Calcium Carbonate 200 50 21 4 81 35 73 21 6 101 46
Bicarbonate 61 26 4 99 42 88 25 6 123 56
Bromide 0.12 0.03 2 0.14 0.1 0.15 0.02 4 0.17 0.12
Sulphate 250 10.8 5.0 4 18 6.6 10.1 2.6 6 12.6 5.4
Chloride 250 37 18 4 53 16 35 14 7 50 14

5
Fluoride 1.5 0.17 0.08 3 0.26 0.1 0.18 0.05 6 0.26 0.11
Calcium 17.0 4.0 4 22.4 13.1 18.6 4.3 6 23.0 11.1
Magnesium 4.7 2.0 4 7.6 3.1 5.8 2.0 6 8.1 2.6
Potassium 3.7 1.1 4 5.3 2.9 2.8 0.4 6 3.14 2
Sodium 180 21.8 6.5 4 29.9 14.6 23.3 8.2 6 30.8 10.5
MICROBIOLOGICAL (cfu/100 mL)
E.coli/F Coliforms - Presumptive 2.04 x 10⁵
3.84 x 10⁵
4 7.5 x 10⁵
260 30 42 6 110 3
Faecal coliforms 2.04 x 10⁵
3.84 x 10⁵
4 7.5 x 10⁵
260 30 42 6 110 3
E.coli 0 2.04 x 10⁵
3.84 x 10⁵
4 7.5 x 10⁵
260 27 41 6 110 3
Ent/F.Strep - Presumptive 1.73 x 10⁴
2.54 x 10⁴
4 5.4 x 10⁴
33 16 11 6 29 1
Enterococci 0 1.73 x 10⁴
2.54 x 10⁴
4 5.4 x 10⁴
33 16 11 6 29 1
Faecal Streptococci 0 1.73 x 10⁴
2.54 x 10⁴
4 5.4 x 10⁴
33 16 11 6 29 1
Sulphite reducing Clostridia 1.6 x 10³
1.47 X 10³
3 3.3 x 10³
720 162 156 3 340 46
Clostridium - presumptive 1.6 x 10³
1.47 X 10³
3 3.3 x 10³
720 162 156 3 340 46
Clostridium perfringens 0 1.2 x 10³
1.58 x 10³
3 3.3 x 10³
140 10 14 2 20 0
Campylobacter 0 4 1 3 4 <4 14 10 3 23 4
Cryptosporidium - Presumptive (oocycts/10L)
14 12 3 22 <5 2 2 2 2
Cryptosporidium – Confirmed (oocycts/10L)
0 13 3 13 <5 2 0 0
Bacteriophage (/10 mL) 63 1 63 63 7 5 3 12 3
Rotavirus (PDU/L) 0 3 inhibition absent 2 absent absent
NUTRIENTS (mg/L)
Nitrate + Nitrite as N 11.5 0.108 0.100 4 0.208 0.016 0.014 0.010 4 0.028 <0.005
Ammonia as N 0.5 0.276 0.233 4 0.44 0.111 0.011 0.004 6 0.017 0.006
TKN as Nitrogen 1.128 0.437 4 1.56 0.63 0.405 0.226 6 0.850 0.210
Nitrogen - Total 1.238 0.458 4 1.63 0.66 0.418 0.222 6 0.860 0.240
Phosphorus - Filterable Reactive as P 0.154 0.201 4 0.454 0.042 0.016 0.013 6 0.040 0.008
Phosphorus - Total 0.249 0.142 4 0.45 0.135 0.052 0.026 6 0.092 0.031
Biodegradable Dissolved Organic Carbon
2.3 2.1 3 4.7 0.7
6
Dissolved Organic Carbon 8.3 3.9 4 13.7 4.5 4.7 1.9 6 8.3 3
Total Organic Carbon 11.8 3.1 4 16.2 9.1 5.6 2.6 6 10.6 3.4
Silica 2.3 0.5 4 3 2 3.0 0.9 6 4 2
UV Absorbance - 254nm Filtered (cm-1)
0.368 0.129 4 0.525 0.212 0.163 0.072 6 0.296 0.096
UV Absorbance - 254 nm Unfiltered (cm-1)
0.351 0.146 4 0.461 0.136 0.173 0.046 6 0.260 0.130
METALS(mg/L)
Aluminium - Soluble 0.069 0.027 4 0.095 0.036 0.025 0.014 5 0.040 0.006
Aluminium - Total 0.2 1.222 1.315 4 3.126 0.214 0.567 0.762 7 2.089 0.089
Antimony - Total 0.001 0.001 4 0.002 <0.0005 0.001 0.000 3 0.001 <0.0005
Arsenic - Soluble 0.001 0.000 4 0.001 <0.001 0.001 0.000 3 0.001 <0.0003
Arsenic - Total 0.007 0.001 0.000 4 0.001 0.001 0.001 0.000 6 0.001 <0.001
Barium - Total 0.7 0.026 0.009 4 0.034 0.017 0.019 0.004 6 0.027 0.015
Beryllium - Total 4 <0.0005 <0.0003 3 <0.0005 <0.0003
Boron - Soluble 0.077 0.056 4 0.141 <0.4 0.062 0.024 4 0.093 0.039
Cadmium - Total 4 <0.0005 <0.0001 6 <0.0005 <0.0001
Chromium - Total 0.003 0.002 4 0.004 <0.003 0.001 0.000 3 0.001 0.000
Cobalt - Total 0.001 0.000 4 0.001 0.001 0.000 0.000 3 0.000 <0.0005
Copper - Total 1 0.007 0.004 4 0.013 0.004 0.001 0.001 4 0.002 <0.0001
Iron - Soluble 0.137 0.077 4 0.250 0.080 0.075 0.026 6 0.120 0.042
Iron - Total 0.3 1.568 1.551 4 3.835 0.531 0.711 0.634 7 2.067 0.267
Lead - Total 0.01 0.008 0.008 4 0.020 0.003 0.001 0.000 5 0.001 0.000
Lithium - Total 0.002 0.000 4 0.003 0.002 0.002 0.001 3 0.003 0.002
Manganese - Soluble 0.041 0.027 4 0.077 0.019 0.035 0.027 6 0.067 0.003
Manganese - Total 0.1 0.068 0.032 4 0.110 0.035 0.042 0.028 6 0.081 0.010
Mercury - Total 0.001 4 <0.0003 <0.0003 0.0004 3 0.0004 0.0004
Molybdenum - Total 0.05 0.001 0.000 4 0.002 0.001 0.001 0.0002 3 0.001 0.000
Nickel - Total 0.02 0.002 0.000 4 0.002 0.002 0.001 0.0001 5 0.001 0.001
Selenium - Total 0.000 4 0.0001 <0.0001 0.0001 3 0.0001 0.0001
Silver - Total 4 <0.0002 <0.0002 3 <0.0002 <0.0002
Thallium - Total 4 <0.0001 <0.0001 3 <0.0001 <0.0001
Vanadium - Total 0.003 0.001 4 0.004 0.002 0.001 3 0.001 <0.0001
7
Zinc - Total 3 0.103 0.071 4 0.207 0.052 0.014 0.010 5 0.026 0.004
STEROLS (ng/L)
24-ethylcholestanol 1122 380 3 1390 <80 401 250 3 674 182
24-ethylcholesterol 9683 1567 3 11000 7950 2644 1994 3 4860 993
24-ethylcoprostanol 152 3 152 <80 164 86 3 259 90
24-ethylepicoprostanol 220 3 220 <80 203 3 203 203
Cholestanol 529 3 529 <80 142 53 3 198 92
Cholesterol 7000 12817 16355 3 31700 3170 1074 493 3 1600 622
Coprostanol 700 229 213 3 473 84 79 42 3 109 49
Epicholestanol 446 3 446 <80 3 <100 <40
Epicoprostanol 414 3 414 <80 3 <100 <40
TRIHALOMETHANES FORMATION POTENTIAL (µg/L)
Bromoform Form Potential 100 <1 4 <1 4 5 4 <1
Chloroform Form Potential 200 246 76.2 4 324 156 118 80 5 254 47
Dibromochloroform Form Potential 4 1.73 4 6 3 12 17 5 42 1
Dichlorobromoform Form Potential 36 15.7 4 55 17 41 16 5 59 16
Trihalomethanes Form Potential - Total
284 78.9 4 382 200 173 80 5 307 99
Footnote: a Drinking Water Guideline
8
Table 2 Analytical ‘Detects’ (in bold) from samples submitted to the National Measurement Institute, Pymble NSW
29.04.09 5.05.09 1.07.09 20.07.09 14.10.09 27.10.09 23.11.09 7.12.09
IS2 WE02 IS2 Injectant IS2 WE02 IS2 WE02
LOR a (awqc lab)
b
Phenols (ug/L)
3-& 4-Methylphenols <0.2 <0.2 <0.2 <0.2 <0.2 <0.2 0.44 <0.2 Herbicides (ug/L)
atrazine <0.1 1
Diuron <0.1 <0.1 <0.1 <0.1 <0.1 <0.1 0.41 <0.1 Trihalomethanes NMI
1120 Screen (ug/L)
Chloroform <1 <1 <1 <1 3.9 <1 <1 <1
Bromodichloromethane <1 <1 <1 <1 2.5 <1 <1 <1
Dibromochloromethane <1 <1 <1 <1 1.2 <1 <1 <1
Bromoform <1 <1 <1 <1 <1 <1 <1 <1 Miscellaneous (mg/L)
Detergent as MBAS <0.05 0.25 0.09 0.05 0.24 0.1
Footnote: a minimum level of reporting,
b Herbicide screen only, submitted to Australian Water Quality Centre
9
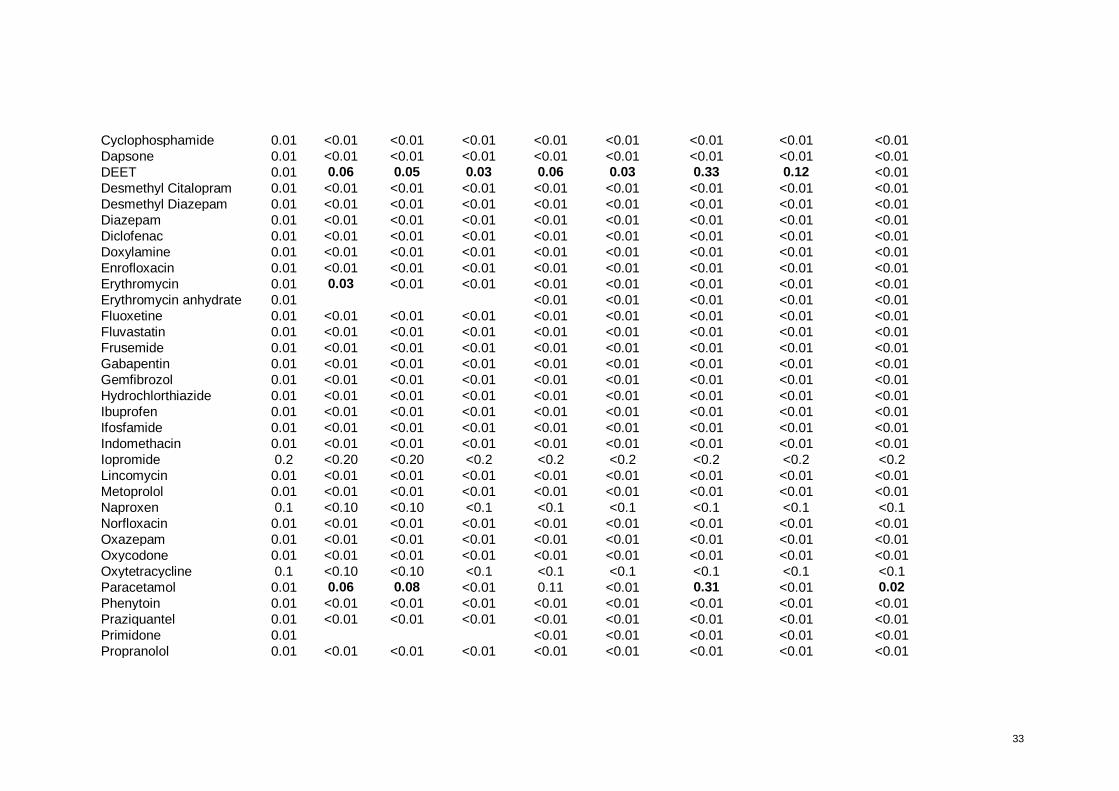
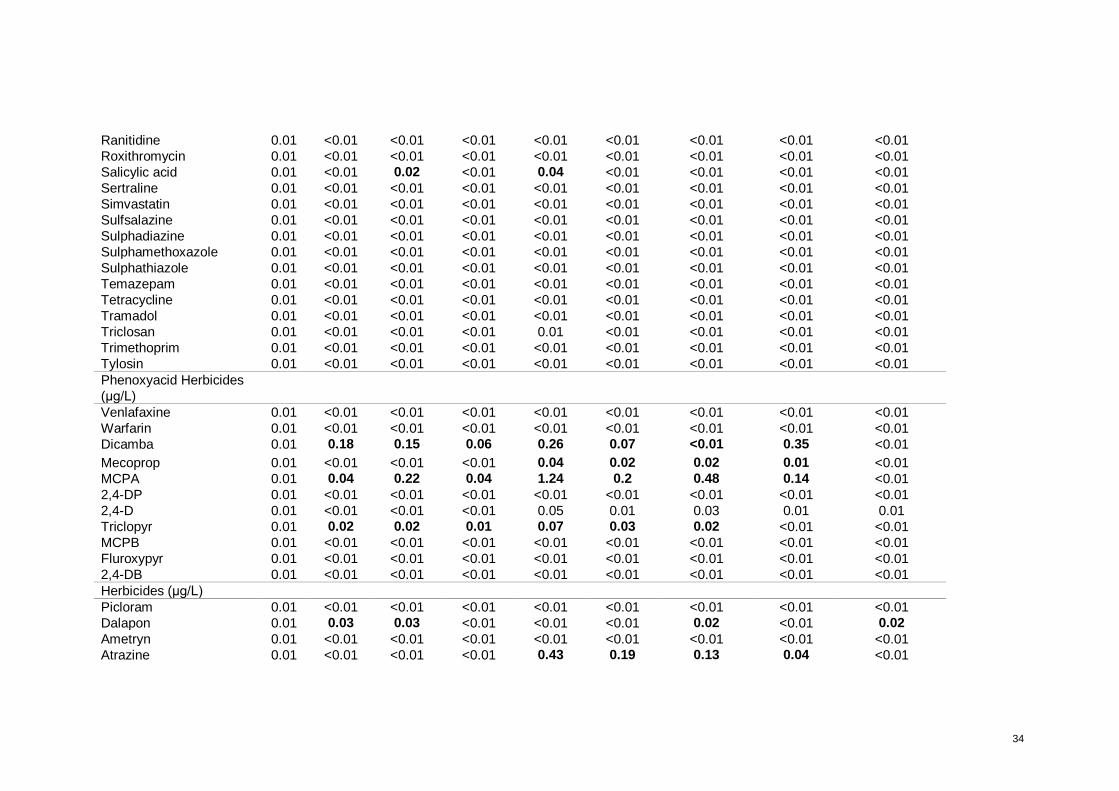
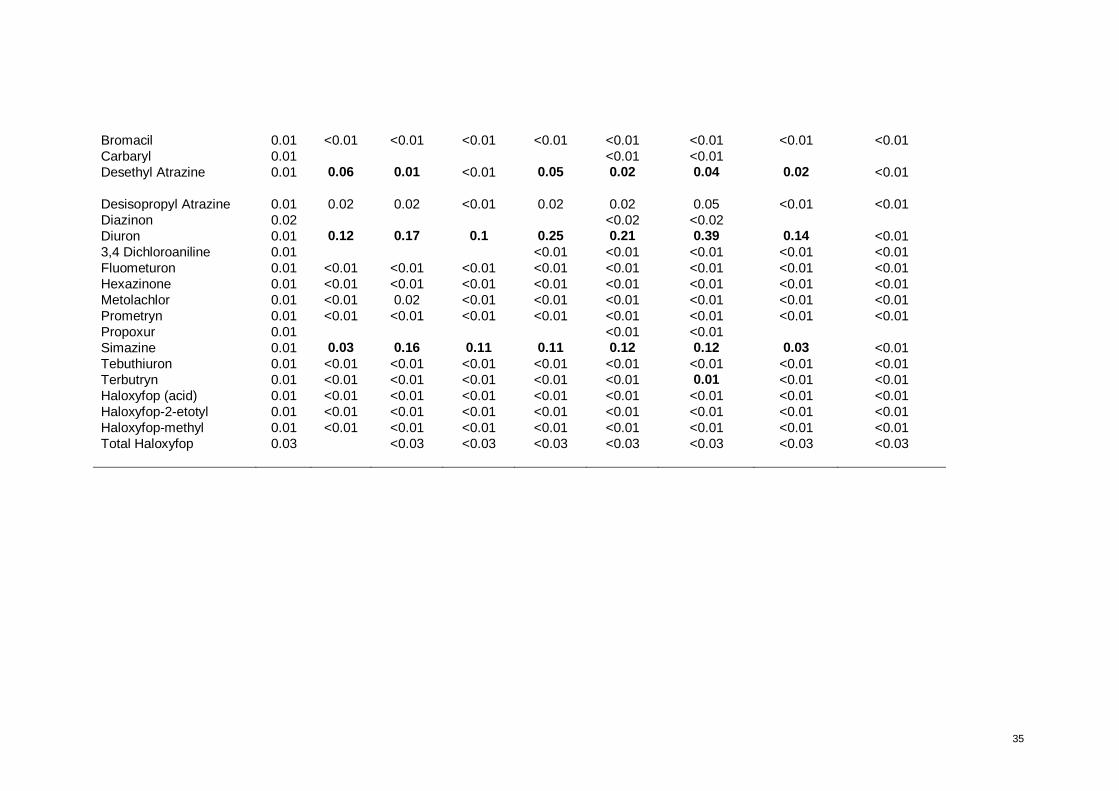
Table 3 Analytical ‘Detects’ (in bold) from samples submitted to the Queensland Health Clinical and Statewide Services, Coopers Plains QLD
29.04.09 1.07.09 20.07.09 14.10.09 27.10.09 23.11.09 23.11.09 8.12.09
IS2 IS2 Injectant
IW2
IS2 WE02 IS2 Blank
Milli Q
H2O
WE02
units LOR a
PHARMACEUTICALS
Acesulfame μg/L 0.01 <0.01 <0.01 <0.01 <0.01 <0.01 0.19 <0.01 0.14
Caffeine μg/L 0.01 0.27 0.87 0.05 0.43 0.3 0.62 0.07 0.12
DEET μg/L 0.01 0.06 0.05 0.03 0.06 0.03 0.33 <0.01 0.12
Erythromycin μg/L 0.01 0.03 <0.01 <0.01 <0.01 <0.01 <0.01 <0.01 <0.01
Paracetamol μg/L 0.01 0.06 0.08 <0.01 0.11 <0.01 0.31 0.02 <0.01
Salicylic acid μg/L 0.01 <0.01 0.02 <0.01 0.04 <0.01 <0.01 <0.01 <0.01 Phenoxyacid Herbicides,
LCMS
Dicamba μg/L 0.01 0.18 0.15 0.06 0.26 0.07 <0.01 <0.01 0.35
Mecoprop μg/L 0.01 <0.01 <0.01 <0.01 0.04 0.02 0.02 <0.01 0.01
MCPA μg/L 0.01 0.04 0.22 0.04 1.24 0.2 0.48 <0.01 0.14
2,4-D μg/L 0.01 <0.01 <0.01 <0.01 0.05 0.01 0.03 <0.01 0.01
Triclopyr μg/L 0.01 0.02 0.02 0.01 0.07 0.03 0.02 <0.01 <0.01 Herbicides by LCMS
Dalapon μg/L 0.01 0.03 0.03 <0.01 <0.01 <0.01 0.02 0.02 <0.01
Atrazine μg/L 0.01 <0.01 <0.01 <0.01 0.43 0.19 0.13 <0.01 0.04
Desethyl Atrazine μg/L 0.01 0.06 0.01 <0.01 0.05 0.02 0.04 <0.01 0.02
Desisopropyl Atrazine μg/L 0.01 0.02 0.02 <0.01 0.02 0.02 0.05 <0.01 <0.01
Diuron μg/L 0.01 0.12 0.17 0.1 0.25 0.21 0.39 <0.01 0.14
Metolachlor μg/L 0.01 <0.01 0.02 <0.01 <0.01 <0.01 <0.01 <0.01 <0.01
Simazine μg/L 0.01 0.03 0.16 0.11 0.11 0.12 0.12 <0.01 0.03
Footnote: a minimum level of reporting
10
4. SUMMARY
Preliminary assessment of the water quality data obtained between May – December 2009 has provided vital information for determining future sampling regimes. Water quality results at the IS2 location support the importance of event based sampling capturing the potential ‘worse case scenario’ water. Future sampling regimes will need to incorporate sampling points going further upstream in the catchment to provide guidance on sources and potential for source control. These data will allow linkage of water quality records from the ASTR project to the sequel project, they inform on the hazard reduction in the holding storage and reedbed, they confirm the presence of hazards at unacceptable concentrations in source water. The information further reinforces the importance of tracking sources of hazards, notably of pathogens, organic chemicals and metals in the catchment to evaluate practical opportunities for catchment and source water protection as a key component in the multi barrier approach to minimise risks to human health and the environment.
REFERENCES
NRMMC–EPHC–NHMRC (2009). Australian Guidelines for Water Recycling: Managing Health and Environmental Risks. Phase 2C: Managed Aquifer Recharge, Environment Protection and Heritage Council, National Health and Medical Research Council, and Natural Resource Management Ministerial Council. www.ephc.gov.au/taxonomy/term/39 NRMMC– EPHC–NHMRC (2008). Australian Guidelines for Water Recycling: Managing Health and Environmental Risks. Phase 2A: Augmentation of Drinking Water Supplies, (Environment Protection and Heritage Council, Natural Resource Management Ministerial Council and National Health and Medical Research Council, www.ephc.gov.au/taxonomy/term/39
Page, D., Vanderzalm, J., Barry, K., Levett, K., Kremer, S., Ayuso-Gabella, M.S.,
Dillon, P., Toze, S., Sidhu, J., Shackleton, M., Purdie, M. and Regel, R. 2009.
Operational residual risk assessment for the Salisbury stormwater ASTR project.
CSIRO: Water for a Healthy Country National Research Flagship
11
APPENDIX A - SUMMARY OF ALL PARAMETERS AND SAMPLING SUITES
PARAMETERS
Total physical Major ions Total metals Soluble
metals
THMFPs Total bacto QHSS Lab
conductivity calcium aluminium aluminium E. coli & faecal
coliforms
Pharmaceuticals
pH magnesium antimony arsenic & Faecal streptococci & NDMA
suspended solids potassium arsenic boron Faecal streptococci
turbidity sodium barium iron Total sterols Sample prep
Alkalinity bicarbonate berrylium manganese
Colour chloride cadmium Faecal Sterols
fluoride chromium EXTRA Pathogens FULL trace organics
suite
sulphate cobalt PSDs
(CSIRO) Bacteriophages -
somatic
NMI Total
Micropollutants
copper Bacteriophages - F
specific
Triazine herbicides
Total nutrients iron Campylobacter spp Organophosphate
total organic carbon lead Wetland only Clostridium Perfingens Organochlorine
dissolved organic carbon lithium Sample prep Propiconazole 1 and 2
ammonia as N manganese BDOC Cryptosporidium Piperonyl butoxide
nitrate + nitrite as N mercury Rotovirus - outsourced Phenoxy acid
herbicides
total nitrogen as N molybdenum MFI (CSIRO) Volatile hydrocarbons
total phosphorus as P nickel Semi-volatile
hydrocarbons
filterab P selinium Phenols (speciated) low
level
UV absorbance silver PAHs lower level
Silica vanadium Detergents (MBAS)
zinc
12
SAMPLING SUITES
Suite A Suite B Suite C Suite D
Physical Physical Major ions Chloride
Nutrients Nutrients Colour Sulphate
Major Ions Major ions Total & soluble
metals
Sodium
Total bacto Bacto aluminium Colour
Total Metals Metals arsenic Total iron
Soluble Metals Soluble
Metals
iron
THMFPs THMFPs manganese
Sterols PSDs
(CSIRO)
BDOC (WE02 only)
MFI (WE02 only) CSIRO
PSDs (CSIRO)
Extra Pathogens
Pharmaceuticals & NDMA (QHSS)
FULL trace organics suite/Micropollutants (NMI)
13
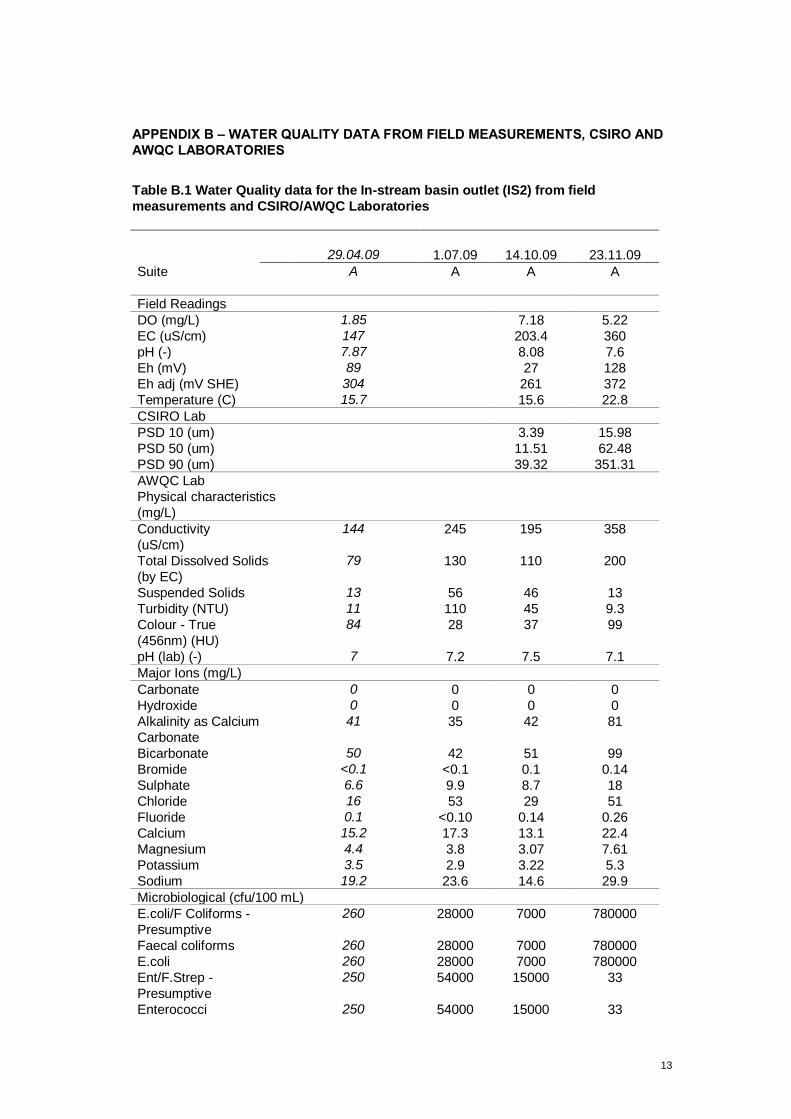
APPENDIX B – WATER QUALITY DATA FROM FIELD MEASUREMENTS, CSIRO AND
AWQC LABORATORIES
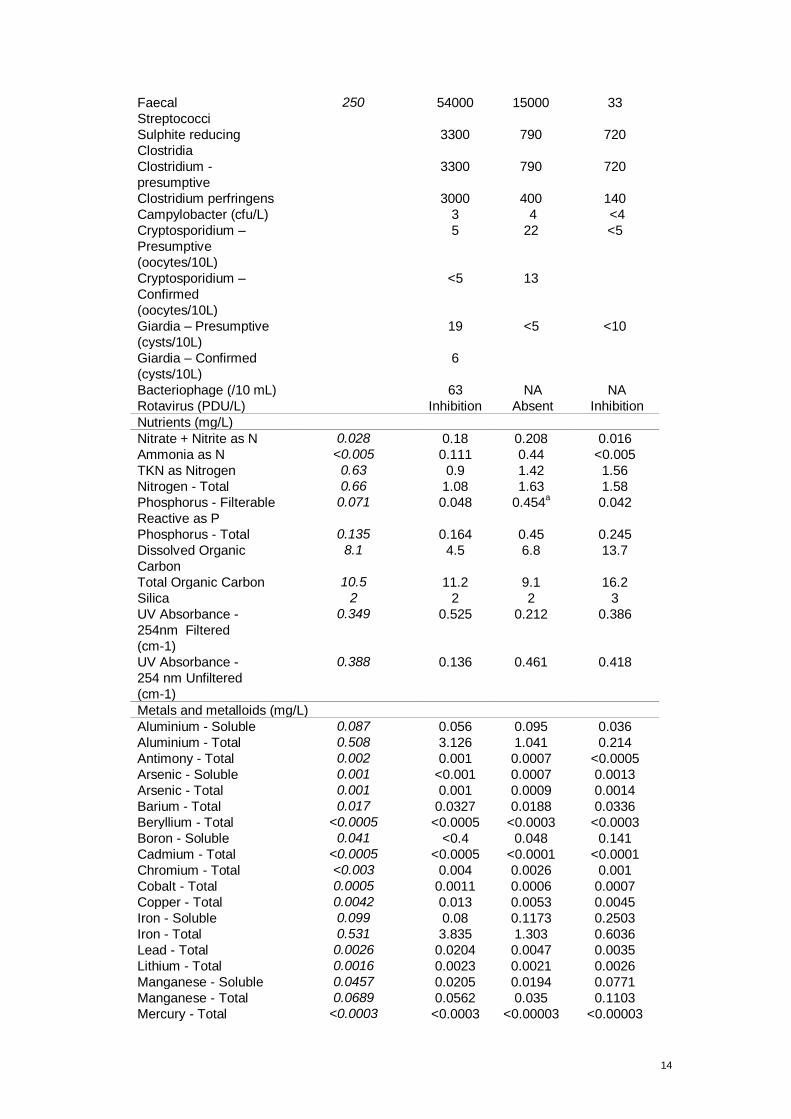
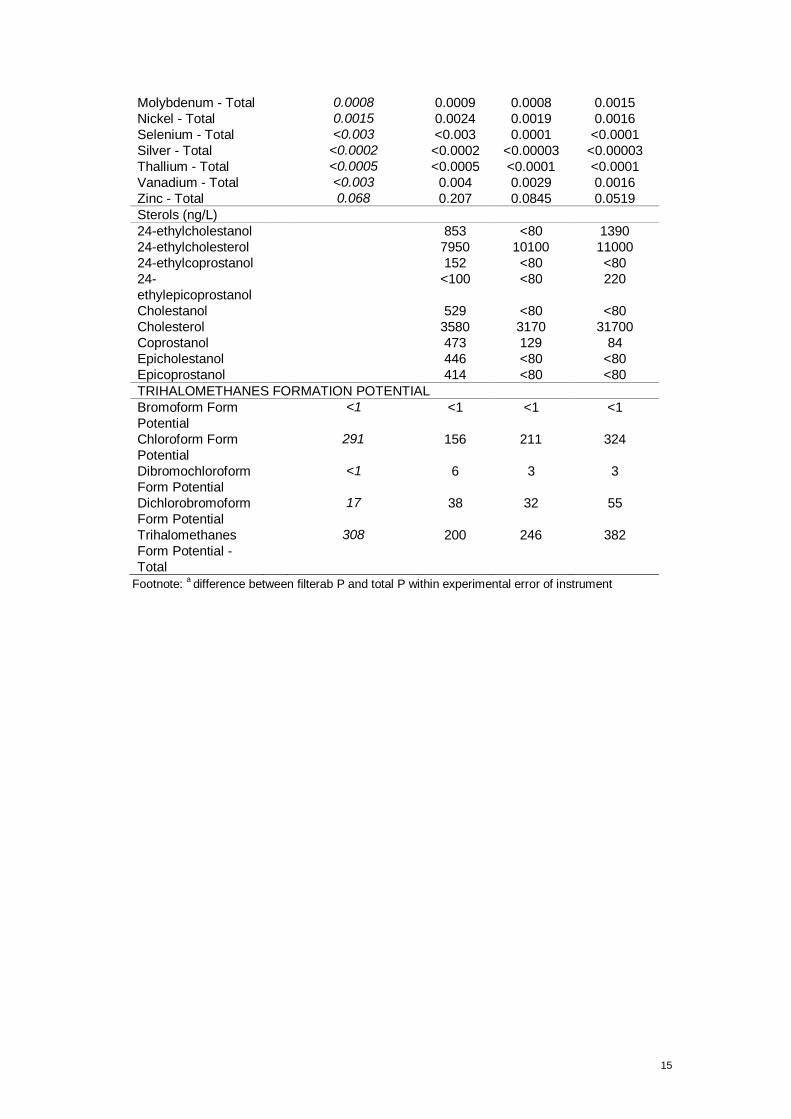
Table B.1 Water Quality data for the In-stream basin outlet (IS2) from field
measurements and CSIRO/AWQC Laboratories
29.04.09 1.07.09 14.10.09 23.11.09
Suite A A A A
Field Readings
DO (mg/L) 1.85 7.18 5.22
EC (uS/cm) 147 203.4 360
pH (-) 7.87 8.08 7.6
Eh (mV) 89 27 128
Eh adj (mV SHE) 304 261 372
Temperature (C) 15.7 15.6 22.8
CSIRO Lab
PSD 10 (um) 3.39 15.98
PSD 50 (um) 11.51 62.48
PSD 90 (um) 39.32 351.31
AWQC Lab
Physical characteristics
(mg/L)
Conductivity
(uS/cm)
144 245 195 358
Total Dissolved Solids
(by EC)
79 130 110 200
Suspended Solids 13 56 46 13
Turbidity (NTU) 11 110 45 9.3
Colour - True
(456nm) (HU)
84 28 37 99
pH (lab) (-) 7 7.2 7.5 7.1
Major Ions (mg/L)
Carbonate 0 0 0 0
Hydroxide 0 0 0 0
Alkalinity as Calcium
Carbonate
41 35 42 81
Bicarbonate 50 42 51 99
Bromide <0.1 <0.1 0.1 0.14
Sulphate 6.6 9.9 8.7 18
Chloride 16 53 29 51
Fluoride 0.1 <0.10 0.14 0.26
Calcium 15.2 17.3 13.1 22.4
Magnesium 4.4 3.8 3.07 7.61
Potassium 3.5 2.9 3.22 5.3
Sodium 19.2 23.6 14.6 29.9
Microbiological (cfu/100 mL)
E.coli/F Coliforms -
Presumptive
260 28000 7000 780000
Faecal coliforms 260 28000 7000 780000
E.coli 260 28000 7000 780000
Ent/F.Strep -
Presumptive
250 54000 15000 33
Enterococci 250 54000 15000 33
14
Faecal
Streptococci
250 54000 15000 33
Sulphite reducing
Clostridia
3300 790 720
Clostridium -
presumptive
3300 790 720
Clostridium perfringens 3000 400 140
Campylobacter (cfu/L) 3 4 <4
Cryptosporidium –
Presumptive
(oocytes/10L)
5 22 <5
Cryptosporidium –
Confirmed
(oocytes/10L)
<5 13
Giardia – Presumptive
(cysts/10L)
19 <5 <10
Giardia – Confirmed
(cysts/10L)
6
Bacteriophage (/10 mL) 63 NA NA
Rotavirus (PDU/L) Inhibition Absent Inhibition
Nutrients (mg/L)
Nitrate + Nitrite as N 0.028 0.18 0.208 0.016
Ammonia as N <0.005 0.111 0.44 <0.005
TKN as Nitrogen 0.63 0.9 1.42 1.56
Nitrogen - Total 0.66 1.08 1.63 1.58
Phosphorus - Filterable
Reactive as P
0.071 0.048 0.454a 0.042
Phosphorus - Total 0.135 0.164 0.45 0.245
Dissolved Organic
Carbon
8.1 4.5 6.8 13.7
Total Organic Carbon 10.5 11.2 9.1 16.2
Silica 2 2 2 3
UV Absorbance -
254nm Filtered
(cm-1)
0.349 0.525 0.212 0.386
UV Absorbance -
254 nm Unfiltered
(cm-1)
0.388 0.136 0.461 0.418
Metals and metalloids (mg/L)
Aluminium - Soluble 0.087 0.056 0.095 0.036
Aluminium - Total 0.508 3.126 1.041 0.214
Antimony - Total 0.002 0.001 0.0007 <0.0005
Arsenic - Soluble 0.001 <0.001 0.0007 0.0013
Arsenic - Total 0.001 0.001 0.0009 0.0014
Barium - Total 0.017 0.0327 0.0188 0.0336
Beryllium - Total <0.0005 <0.0005 <0.0003 <0.0003
Boron - Soluble 0.041 <0.4 0.048 0.141
Cadmium - Total <0.0005 <0.0005 <0.0001 <0.0001
Chromium - Total <0.003 0.004 0.0026 0.001
Cobalt - Total 0.0005 0.0011 0.0006 0.0007
Copper - Total 0.0042 0.013 0.0053 0.0045
Iron - Soluble 0.099 0.08 0.1173 0.2503
Iron - Total 0.531 3.835 1.303 0.6036
Lead - Total 0.0026 0.0204 0.0047 0.0035
Lithium - Total 0.0016 0.0023 0.0021 0.0026
Manganese - Soluble 0.0457 0.0205 0.0194 0.0771
Manganese - Total 0.0689 0.0562 0.035 0.1103
Mercury - Total <0.0003 <0.0003 <0.00003 <0.00003
15
Molybdenum - Total 0.0008 0.0009 0.0008 0.0015
Nickel - Total 0.0015 0.0024 0.0019 0.0016
Selenium - Total <0.003 <0.003 0.0001 <0.0001
Silver - Total <0.0002 <0.0002 <0.00003 <0.00003
Thallium - Total <0.0005 <0.0005 <0.0001 <0.0001
Vanadium - Total <0.003 0.004 0.0029 0.0016
Zinc - Total 0.068 0.207 0.0845 0.0519
Sterols (ng/L)
24-ethylcholestanol 853 <80 1390
24-ethylcholesterol 7950 10100 11000
24-ethylcoprostanol 152 <80 <80
24-
ethylepicoprostanol
<100 <80 220
Cholestanol 529 <80 <80
Cholesterol 3580 3170 31700
Coprostanol 473 129 84
Epicholestanol 446 <80 <80
Epicoprostanol 414 <80 <80
TRIHALOMETHANES FORMATION POTENTIAL
Bromoform Form
Potential
<1 <1 <1 <1
Chloroform Form
Potential
291 156 211 324
Dibromochloroform
Form Potential
<1 6 3 3
Dichlorobromoform
Form Potential
17 38 32 55
Trihalomethanes
Form Potential -
Total
308 200 246 382
Footnote: a difference between filterab P and total P within experimental error of instrument

16
17
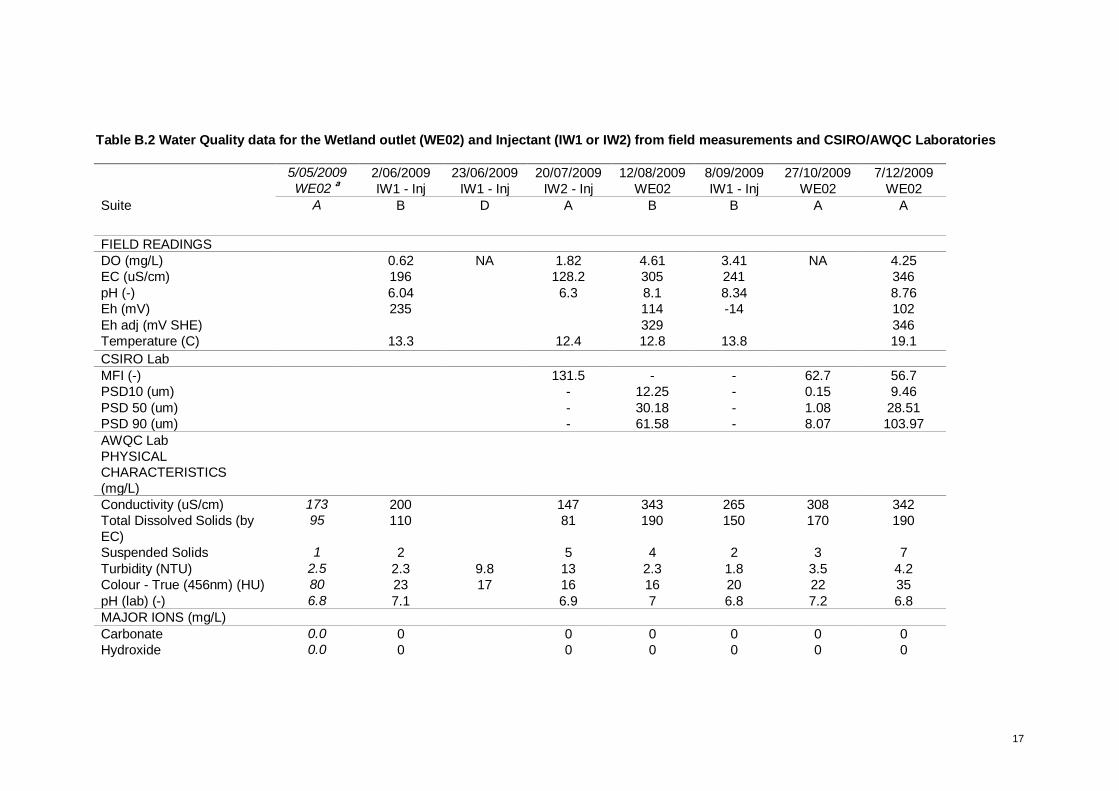
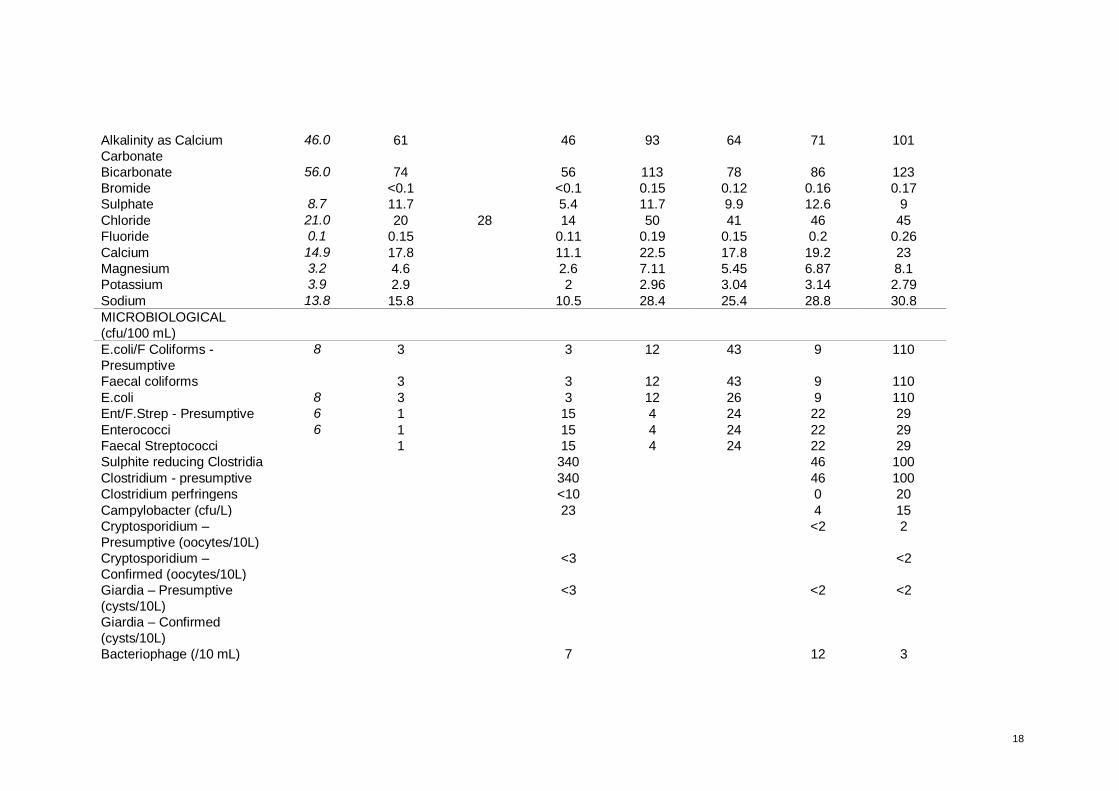
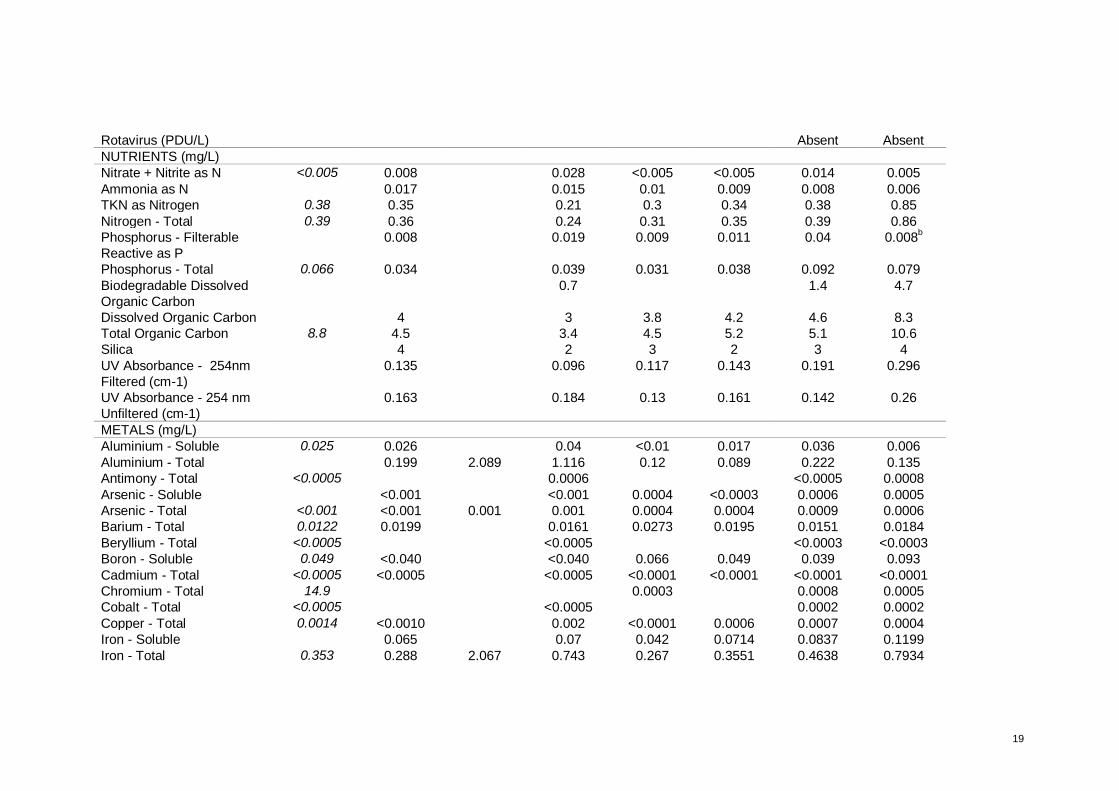
Table B.2 Water Quality data for the Wetland outlet (WE02) and Injectant (IW1 or IW2) from field measurements and CSIRO/AWQC Laboratories
5/05/2009 2/06/2009 23/06/2009 20/07/2009 12/08/2009 8/09/2009 27/10/2009 7/12/2009
WE02 a IW1 - Inj IW1 - Inj IW2 - Inj WE02 IW1 - Inj WE02 WE02
Suite A B D A B B A A
FIELD READINGS
DO (mg/L) 0.62 NA 1.82 4.61 3.41 NA 4.25
EC (uS/cm) 196 128.2 305 241 346
pH (-) 6.04 6.3 8.1 8.34 8.76
Eh (mV) 235 114 -14 102
Eh adj (mV SHE) 329 346
Temperature (C) 13.3 12.4 12.8 13.8 19.1
CSIRO Lab
MFI (-) 131.5 - - 62.7 56.7
PSD10 (um) - 12.25 - 0.15 9.46
PSD 50 (um) - 30.18 - 1.08 28.51
PSD 90 (um) - 61.58 - 8.07 103.97
AWQC Lab
PHYSICAL
CHARACTERISTICS
(mg/L)
Conductivity (uS/cm) 173 200 147 343 265 308 342
Total Dissolved Solids (by
EC)
95 110 81 190 150 170 190
Suspended Solids 1 2 5 4 2 3 7
Turbidity (NTU) 2.5 2.3 9.8 13 2.3 1.8 3.5 4.2
Colour - True (456nm) (HU) 80 23 17 16 16 20 22 35
pH (lab) (-) 6.8 7.1 6.9 7 6.8 7.2 6.8
MAJOR IONS (mg/L)
Carbonate 0.0 0 0 0 0 0 0
Hydroxide 0.0 0 0 0 0 0 0
18
Alkalinity as Calcium
Carbonate
46.0 61 46 93 64 71 101
Bicarbonate 56.0 74 56 113 78 86 123
Bromide <0.1 <0.1 0.15 0.12 0.16 0.17
Sulphate 8.7 11.7 5.4 11.7 9.9 12.6 9
Chloride 21.0 20 28 14 50 41 46 45
Fluoride 0.1 0.15 0.11 0.19 0.15 0.2 0.26
Calcium 14.9 17.8 11.1 22.5 17.8 19.2 23
Magnesium 3.2 4.6 2.6 7.11 5.45 6.87 8.1
Potassium 3.9 2.9 2 2.96 3.04 3.14 2.79
Sodium 13.8 15.8 10.5 28.4 25.4 28.8 30.8
MICROBIOLOGICAL
(cfu/100 mL)
E.coli/F Coliforms -
Presumptive
8 3 3 12 43 9 110
Faecal coliforms 3 3 12 43 9 110
E.coli 8 3 3 12 26 9 110
Ent/F.Strep - Presumptive 6 1 15 4 24 22 29
Enterococci 6 1 15 4 24 22 29
Faecal Streptococci 1 15 4 24 22 29
Sulphite reducing Clostridia 340 46 100
Clostridium - presumptive 340 46 100
Clostridium perfringens <10 0 20
Campylobacter (cfu/L) 23 4 15
Cryptosporidium –
Presumptive (oocytes/10L)
<2 2
Cryptosporidium –
Confirmed (oocytes/10L)
<3 <2
Giardia – Presumptive
(cysts/10L)
<3 <2 <2
Giardia – Confirmed
(cysts/10L)
Bacteriophage (/10 mL) 7 12 3
19
Rotavirus (PDU/L) Absent Absent
NUTRIENTS (mg/L)
Nitrate + Nitrite as N <0.005 0.008 0.028 <0.005 <0.005 0.014 0.005
Ammonia as N 0.017 0.015 0.01 0.009 0.008 0.006
TKN as Nitrogen 0.38 0.35 0.21 0.3 0.34 0.38 0.85
Nitrogen - Total 0.39 0.36 0.24 0.31 0.35 0.39 0.86
Phosphorus - Filterable
Reactive as P
0.008 0.019 0.009 0.011 0.04 0.008b
Phosphorus - Total 0.066 0.034 0.039 0.031 0.038 0.092 0.079
Biodegradable Dissolved
Organic Carbon
0.7 1.4 4.7
Dissolved Organic Carbon 4 3 3.8 4.2 4.6 8.3
Total Organic Carbon 8.8 4.5 3.4 4.5 5.2 5.1 10.6
Silica 4 2 3 2 3 4
UV Absorbance - 254nm
Filtered (cm-1)
0.135 0.096 0.117 0.143 0.191 0.296
UV Absorbance - 254 nm
Unfiltered (cm-1)
0.163 0.184 0.13 0.161 0.142 0.26
METALS (mg/L)
Aluminium - Soluble 0.025 0.026 0.04 <0.01 0.017 0.036 0.006
Aluminium - Total 0.199 2.089 1.116 0.12 0.089 0.222 0.135
Antimony - Total <0.0005 0.0006 <0.0005 0.0008
Arsenic - Soluble <0.001 <0.001 0.0004 <0.0003 0.0006 0.0005
Arsenic - Total <0.001 <0.001 0.001 0.001 0.0004 0.0004 0.0009 0.0006
Barium - Total 0.0122 0.0199 0.0161 0.0273 0.0195 0.0151 0.0184
Beryllium - Total <0.0005 <0.0005 <0.0003 <0.0003
Boron - Soluble 0.049 <0.040 <0.040 0.066 0.049 0.039 0.093
Cadmium - Total <0.0005 <0.0005 <0.0005 <0.0001 <0.0001 <0.0001 <0.0001
Chromium - Total 14.9 0.0003 0.0008 0.0005
Cobalt - Total <0.0005 <0.0005 0.0002 0.0002
Copper - Total 0.0014 <0.0010 0.002 <0.0001 0.0006 0.0007 0.0004
Iron - Soluble 0.065 0.07 0.042 0.0714 0.0837 0.1199
Iron - Total 0.353 0.288 2.067 0.743 0.267 0.3551 0.4638 0.7934
20
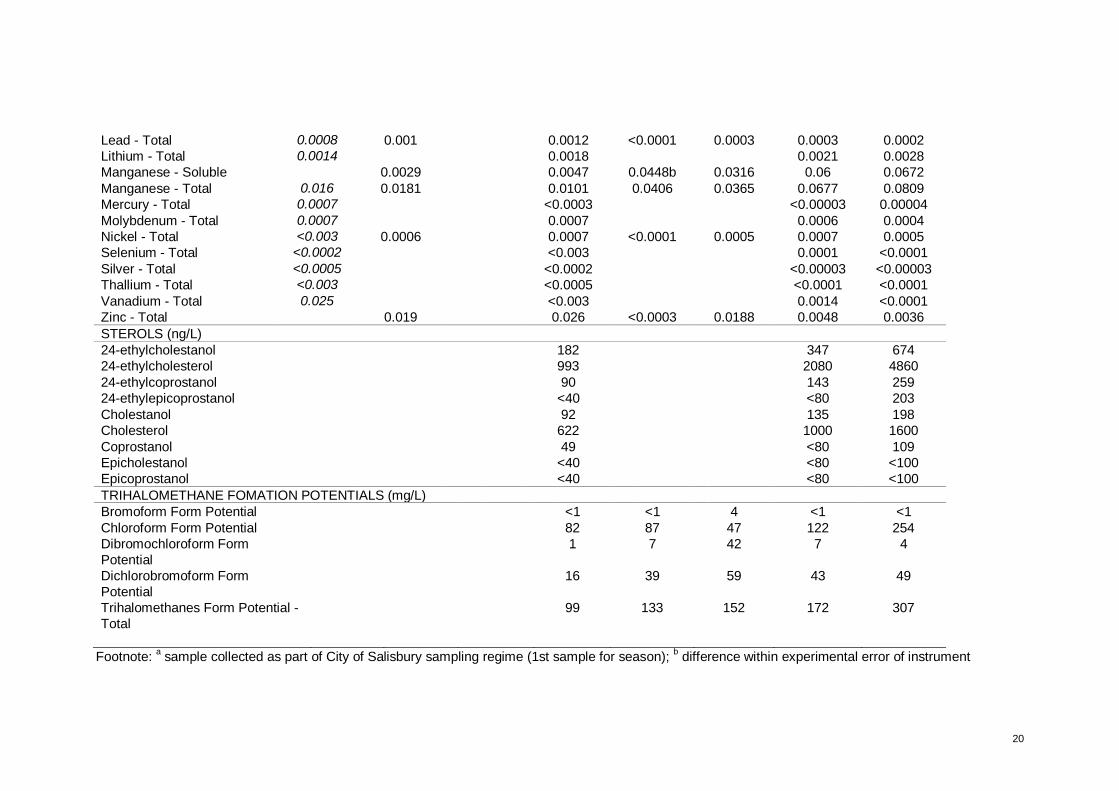
Lead - Total 0.0008 0.001 0.0012 <0.0001 0.0003 0.0003 0.0002
Lithium - Total 0.0014 0.0018 0.0021 0.0028
Manganese - Soluble 0.0029 0.0047 0.0448b 0.0316 0.06 0.0672
Manganese - Total 0.016 0.0181 0.0101 0.0406 0.0365 0.0677 0.0809
Mercury - Total 0.0007 <0.0003 <0.00003 0.00004
Molybdenum - Total 0.0007 0.0007 0.0006 0.0004
Nickel - Total <0.003 0.0006 0.0007 <0.0001 0.0005 0.0007 0.0005
Selenium - Total <0.0002 <0.003 0.0001 <0.0001
Silver - Total <0.0005 <0.0002 <0.00003 <0.00003
Thallium - Total <0.003 <0.0005 <0.0001 <0.0001
Vanadium - Total 0.025 <0.003 0.0014 <0.0001
Zinc - Total 0.019 0.026 <0.0003 0.0188 0.0048 0.0036
STEROLS (ng/L)
24-ethylcholestanol 182 347 674
24-ethylcholesterol 993 2080 4860
24-ethylcoprostanol 90 143 259
24-ethylepicoprostanol <40 <80 203
Cholestanol 92 135 198
Cholesterol 622 1000 1600
Coprostanol 49 <80 109
Epicholestanol <40 <80 <100
Epicoprostanol <40 <80 <100
TRIHALOMETHANE FOMATION POTENTIALS (mg/L)
Bromoform Form Potential <1 <1 4 <1 <1
Chloroform Form Potential 82 87 47 122 254
Dibromochloroform Form
Potential
1 7 42 7 4
Dichlorobromoform Form
Potential
16 39 59 43 49
Trihalomethanes Form Potential -
Total
99 133 152 172 307
Footnote: a sample collected as part of City of Salisbury sampling regime (1st sample for season);
b difference within experimental error of instrument
21
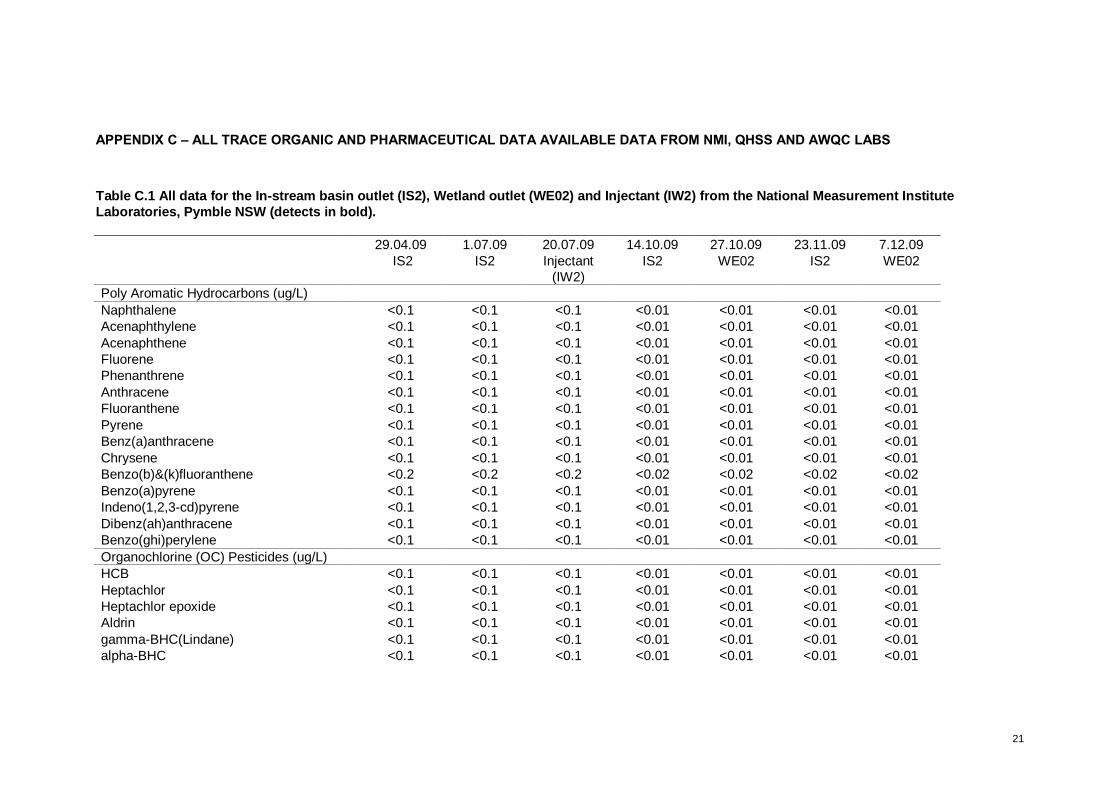
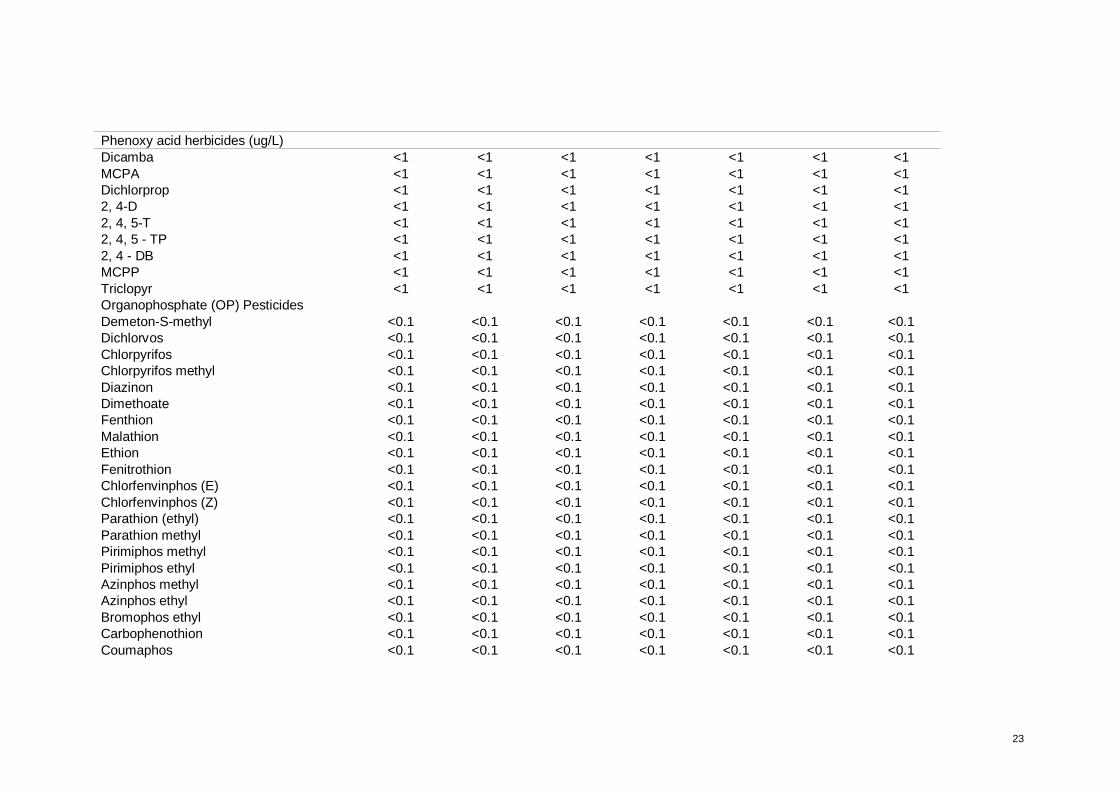
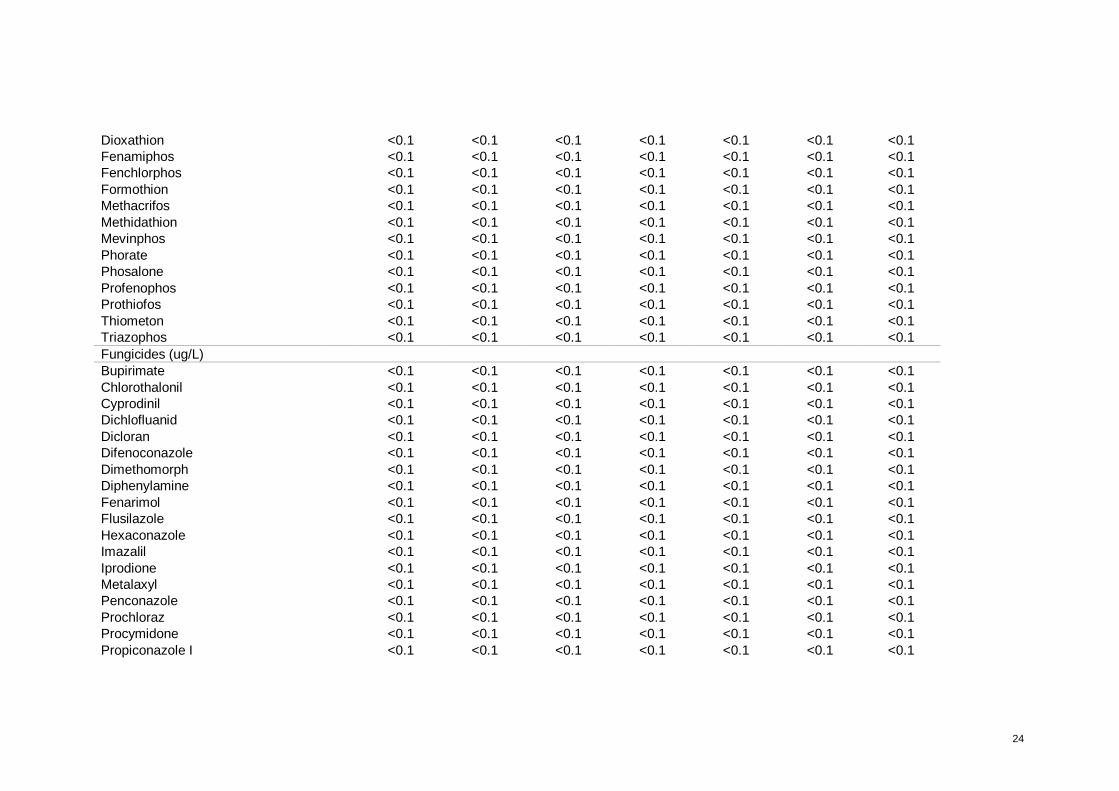
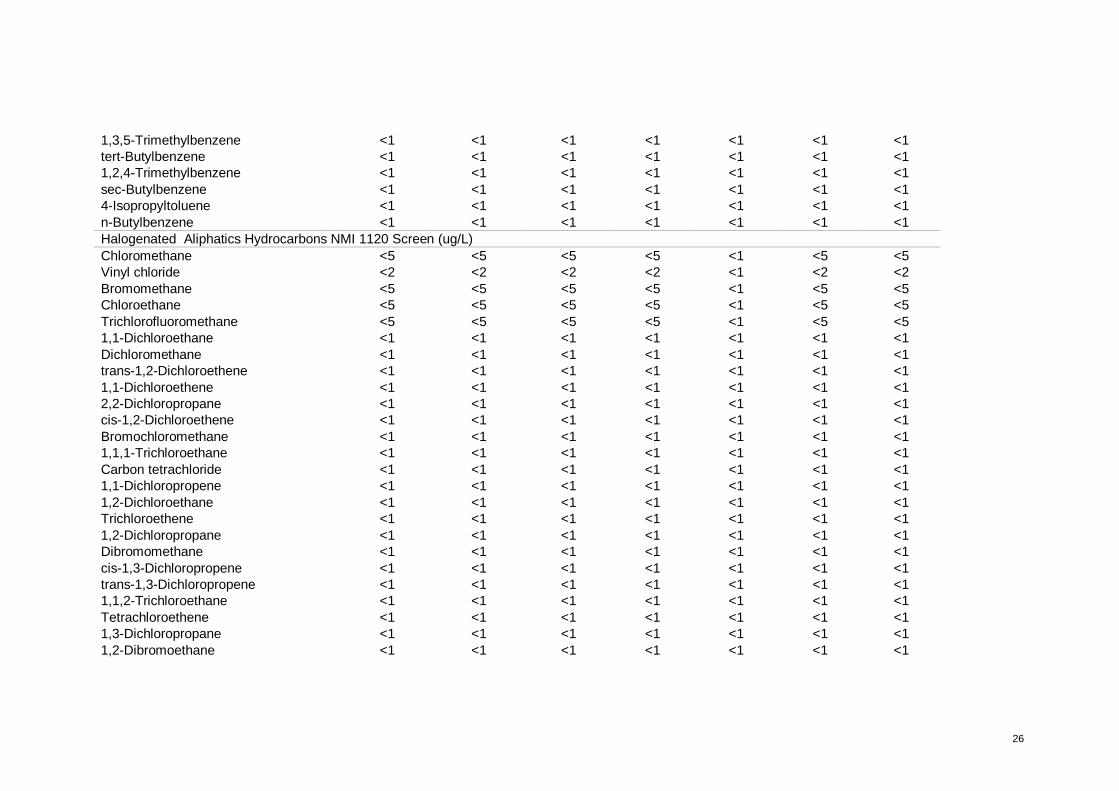
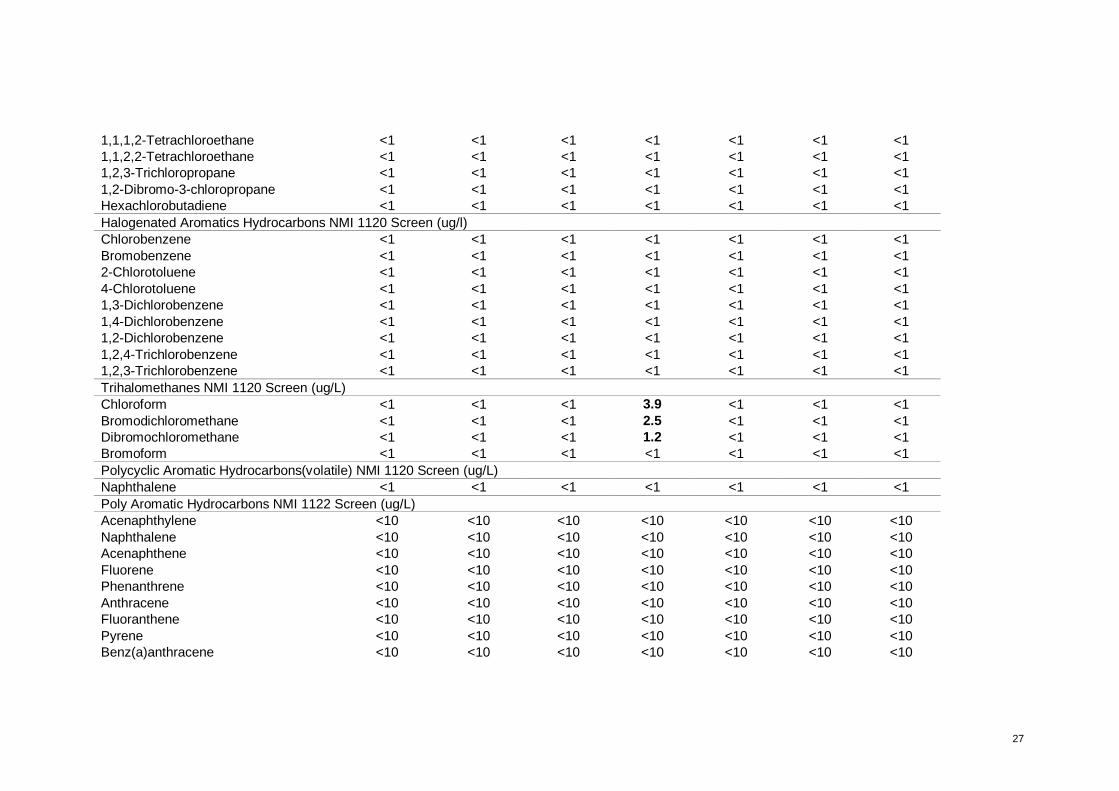
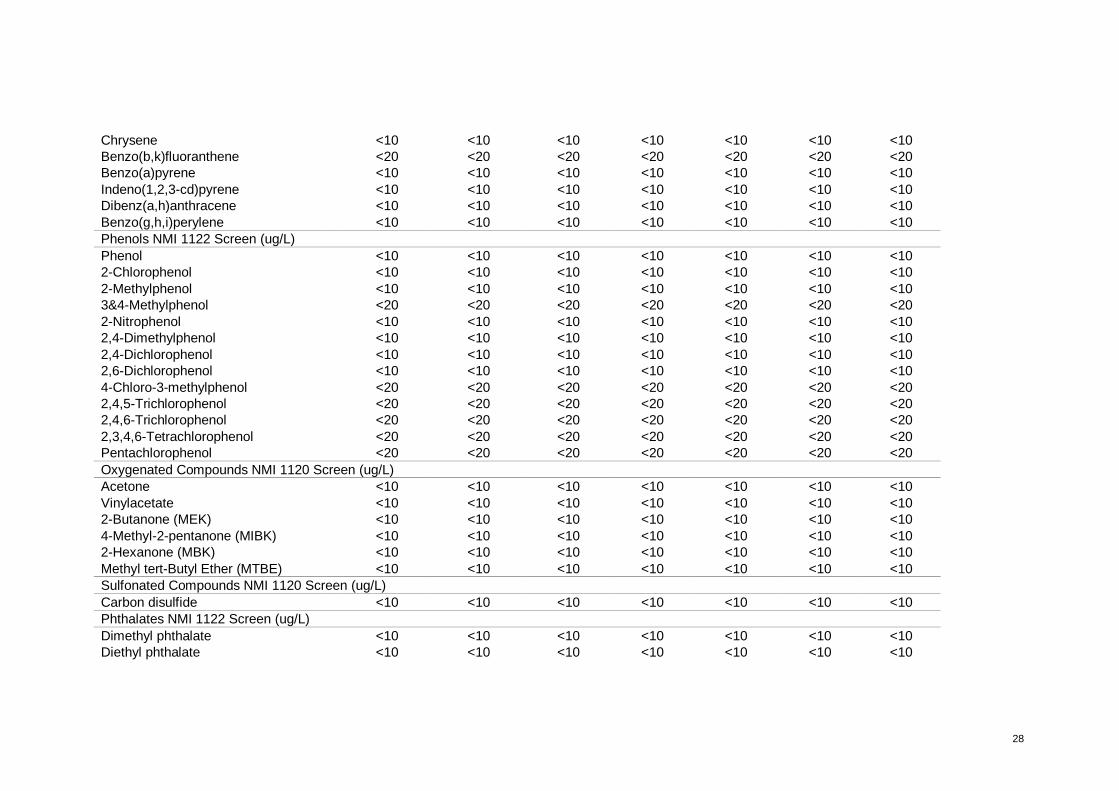
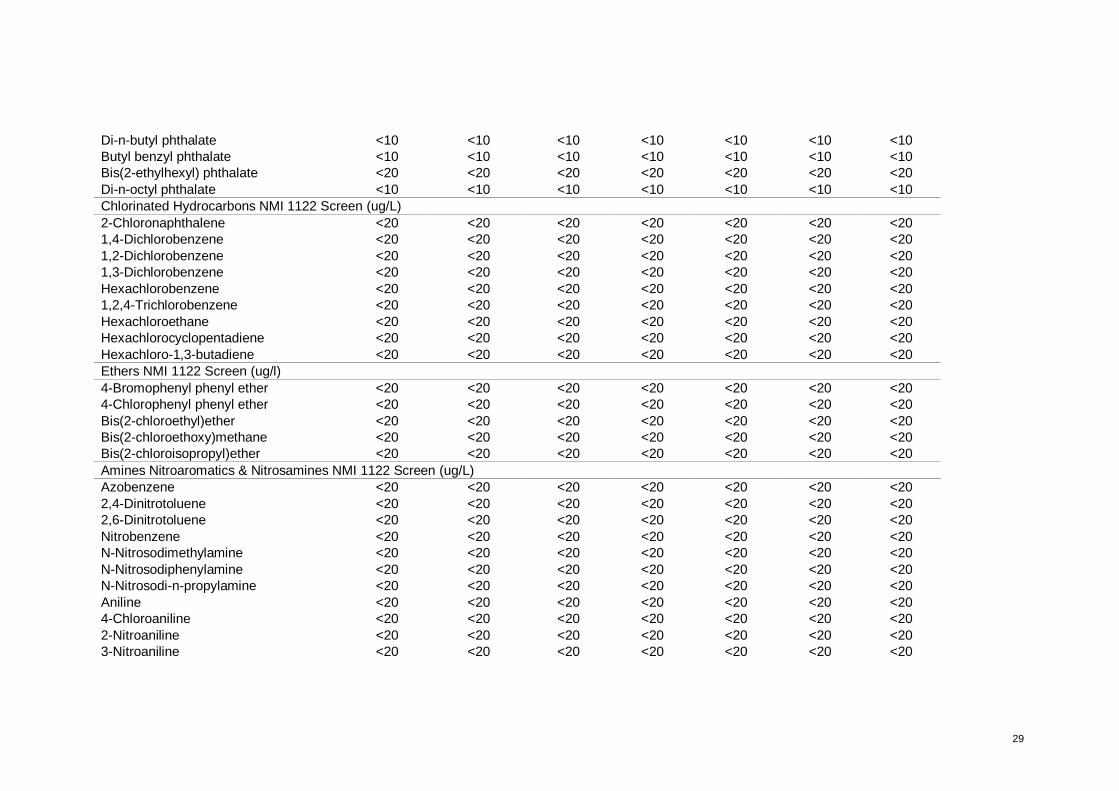
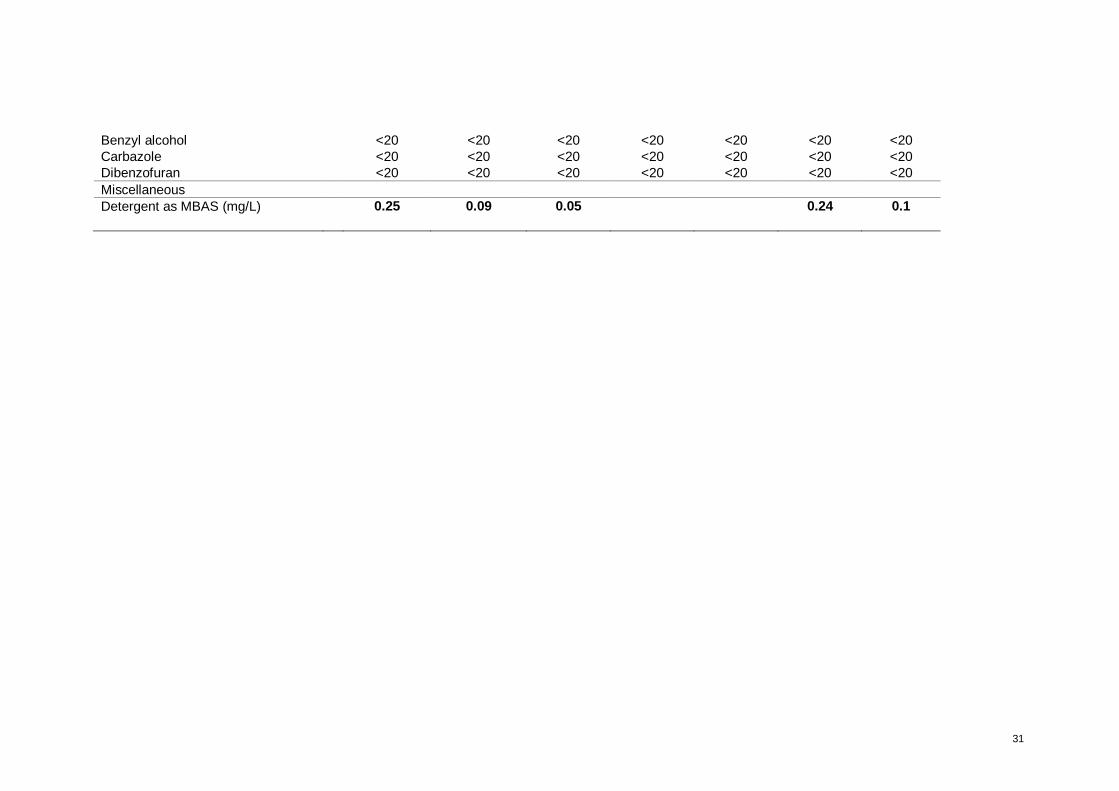
APPENDIX C – ALL TRACE ORGANIC AND PHARMACEUTICAL DATA AVAILABLE DATA FROM NMI, QHSS AND AWQC LABS
Table C.1 All data for the In-stream basin outlet (IS2), Wetland outlet (WE02) and Injectant (IW2) from the National Measurement Institute
Laboratories, Pymble NSW (detects in bold).
29.04.09 1.07.09 20.07.09 14.10.09 27.10.09 23.11.09 7.12.09
IS2 IS2 Injectant
(IW2)
IS2 WE02 IS2 WE02
Poly Aromatic Hydrocarbons (ug/L)
Naphthalene <0.1 <0.1 <0.1 <0.01 <0.01 <0.01 <0.01
Acenaphthylene <0.1 <0.1 <0.1 <0.01 <0.01 <0.01 <0.01
Acenaphthene <0.1 <0.1 <0.1 <0.01 <0.01 <0.01 <0.01
Fluorene <0.1 <0.1 <0.1 <0.01 <0.01 <0.01 <0.01
Phenanthrene <0.1 <0.1 <0.1 <0.01 <0.01 <0.01 <0.01
Anthracene <0.1 <0.1 <0.1 <0.01 <0.01 <0.01 <0.01
Fluoranthene <0.1 <0.1 <0.1 <0.01 <0.01 <0.01 <0.01
Pyrene <0.1 <0.1 <0.1 <0.01 <0.01 <0.01 <0.01
Benz(a)anthracene <0.1 <0.1 <0.1 <0.01 <0.01 <0.01 <0.01
Chrysene <0.1 <0.1 <0.1 <0.01 <0.01 <0.01 <0.01
Benzo(b)&(k)fluoranthene <0.2 <0.2 <0.2 <0.02 <0.02 <0.02 <0.02
Benzo(a)pyrene <0.1 <0.1 <0.1 <0.01 <0.01 <0.01 <0.01
Indeno(1,2,3-cd)pyrene <0.1 <0.1 <0.1 <0.01 <0.01 <0.01 <0.01
Dibenz(ah)anthracene <0.1 <0.1 <0.1 <0.01 <0.01 <0.01 <0.01
Benzo(ghi)perylene <0.1 <0.1 <0.1 <0.01 <0.01 <0.01 <0.01
Organochlorine (OC) Pesticides (ug/L)
HCB <0.1 <0.1 <0.1 <0.01 <0.01 <0.01 <0.01
Heptachlor <0.1 <0.1 <0.1 <0.01 <0.01 <0.01 <0.01
Heptachlor epoxide <0.1 <0.1 <0.1 <0.01 <0.01 <0.01 <0.01
Aldrin <0.1 <0.1 <0.1 <0.01 <0.01 <0.01 <0.01
gamma-BHC(Lindane) <0.1 <0.1 <0.1 <0.01 <0.01 <0.01 <0.01
alpha-BHC <0.1 <0.1 <0.1 <0.01 <0.01 <0.01 <0.01
22
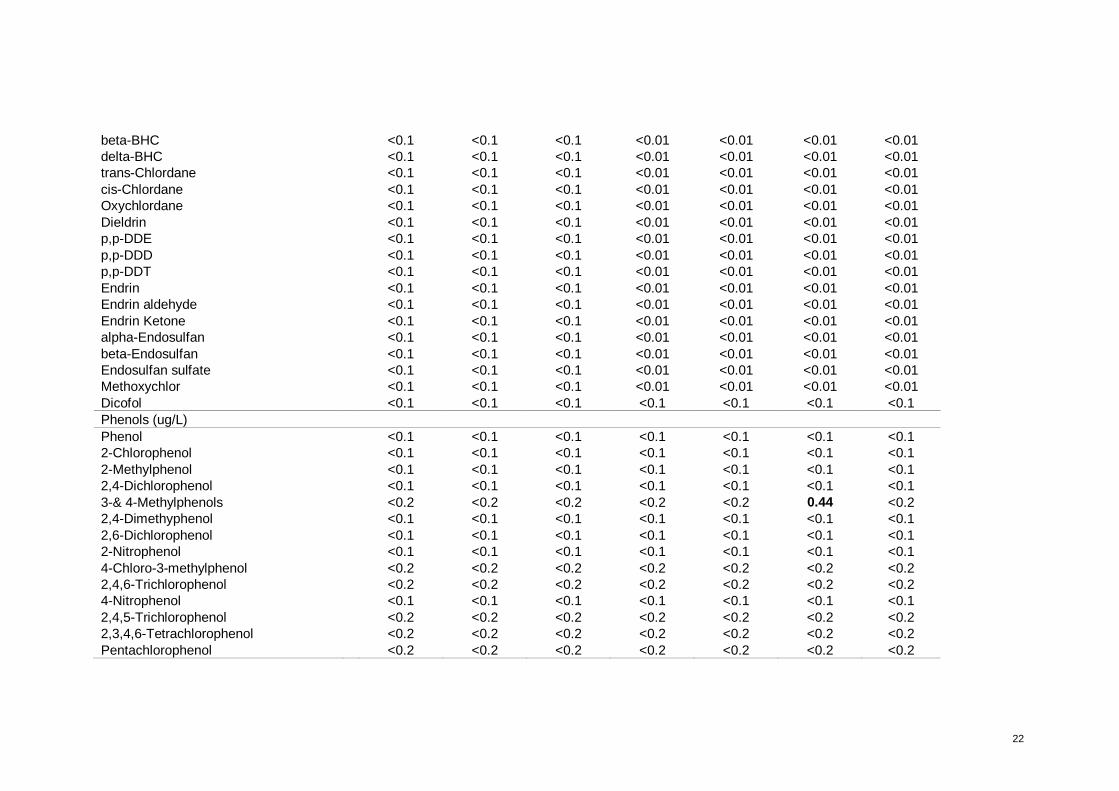
beta-BHC <0.1 <0.1 <0.1 <0.01 <0.01 <0.01 <0.01
delta-BHC <0.1 <0.1 <0.1 <0.01 <0.01 <0.01 <0.01
trans-Chlordane <0.1 <0.1 <0.1 <0.01 <0.01 <0.01 <0.01
cis-Chlordane <0.1 <0.1 <0.1 <0.01 <0.01 <0.01 <0.01
Oxychlordane <0.1 <0.1 <0.1 <0.01 <0.01 <0.01 <0.01
Dieldrin <0.1 <0.1 <0.1 <0.01 <0.01 <0.01 <0.01
p,p-DDE <0.1 <0.1 <0.1 <0.01 <0.01 <0.01 <0.01
p,p-DDD <0.1 <0.1 <0.1 <0.01 <0.01 <0.01 <0.01
p,p-DDT <0.1 <0.1 <0.1 <0.01 <0.01 <0.01 <0.01
Endrin <0.1 <0.1 <0.1 <0.01 <0.01 <0.01 <0.01
Endrin aldehyde <0.1 <0.1 <0.1 <0.01 <0.01 <0.01 <0.01
Endrin Ketone <0.1 <0.1 <0.1 <0.01 <0.01 <0.01 <0.01
alpha-Endosulfan <0.1 <0.1 <0.1 <0.01 <0.01 <0.01 <0.01
beta-Endosulfan <0.1 <0.1 <0.1 <0.01 <0.01 <0.01 <0.01
Endosulfan sulfate <0.1 <0.1 <0.1 <0.01 <0.01 <0.01 <0.01
Methoxychlor <0.1 <0.1 <0.1 <0.01 <0.01 <0.01 <0.01
Dicofol <0.1 <0.1 <0.1 <0.1 <0.1 <0.1 <0.1
Phenols (ug/L)
Phenol <0.1 <0.1 <0.1 <0.1 <0.1 <0.1 <0.1
2-Chlorophenol <0.1 <0.1 <0.1 <0.1 <0.1 <0.1 <0.1
2-Methylphenol <0.1 <0.1 <0.1 <0.1 <0.1 <0.1 <0.1
2,4-Dichlorophenol <0.1 <0.1 <0.1 <0.1 <0.1 <0.1 <0.1
3-& 4-Methylphenols <0.2 <0.2 <0.2 <0.2 <0.2 0.44 <0.2
2,4-Dimethyphenol <0.1 <0.1 <0.1 <0.1 <0.1 <0.1 <0.1
2,6-Dichlorophenol <0.1 <0.1 <0.1 <0.1 <0.1 <0.1 <0.1
2-Nitrophenol <0.1 <0.1 <0.1 <0.1 <0.1 <0.1 <0.1
4-Chloro-3-methylphenol <0.2 <0.2 <0.2 <0.2 <0.2 <0.2 <0.2
2,4,6-Trichlorophenol <0.2 <0.2 <0.2 <0.2 <0.2 <0.2 <0.2
4-Nitrophenol <0.1 <0.1 <0.1 <0.1 <0.1 <0.1 <0.1
2,4,5-Trichlorophenol <0.2 <0.2 <0.2 <0.2 <0.2 <0.2 <0.2
2,3,4,6-Tetrachlorophenol <0.2 <0.2 <0.2 <0.2 <0.2 <0.2 <0.2
Pentachlorophenol <0.2 <0.2 <0.2 <0.2 <0.2 <0.2 <0.2
23
Phenoxy acid herbicides (ug/L)
Dicamba <1 <1 <1 <1 <1 <1 <1
MCPA <1 <1 <1 <1 <1 <1 <1
Dichlorprop <1 <1 <1 <1 <1 <1 <1
2, 4-D <1 <1 <1 <1 <1 <1 <1
2, 4, 5-T <1 <1 <1 <1 <1 <1 <1
2, 4, 5 - TP <1 <1 <1 <1 <1 <1 <1
2, 4 - DB <1 <1 <1 <1 <1 <1 <1
MCPP <1 <1 <1 <1 <1 <1 <1
Triclopyr <1 <1 <1 <1 <1 <1 <1
Organophosphate (OP) Pesticides
Demeton-S-methyl <0.1 <0.1 <0.1 <0.1 <0.1 <0.1 <0.1
Dichlorvos <0.1 <0.1 <0.1 <0.1 <0.1 <0.1 <0.1
Chlorpyrifos <0.1 <0.1 <0.1 <0.1 <0.1 <0.1 <0.1
Chlorpyrifos methyl <0.1 <0.1 <0.1 <0.1 <0.1 <0.1 <0.1
Diazinon <0.1 <0.1 <0.1 <0.1 <0.1 <0.1 <0.1
Dimethoate <0.1 <0.1 <0.1 <0.1 <0.1 <0.1 <0.1
Fenthion <0.1 <0.1 <0.1 <0.1 <0.1 <0.1 <0.1
Malathion <0.1 <0.1 <0.1 <0.1 <0.1 <0.1 <0.1
Ethion <0.1 <0.1 <0.1 <0.1 <0.1 <0.1 <0.1
Fenitrothion <0.1 <0.1 <0.1 <0.1 <0.1 <0.1 <0.1
Chlorfenvinphos (E) <0.1 <0.1 <0.1 <0.1 <0.1 <0.1 <0.1
Chlorfenvinphos (Z) <0.1 <0.1 <0.1 <0.1 <0.1 <0.1 <0.1
Parathion (ethyl) <0.1 <0.1 <0.1 <0.1 <0.1 <0.1 <0.1
Parathion methyl <0.1 <0.1 <0.1 <0.1 <0.1 <0.1 <0.1
Pirimiphos methyl <0.1 <0.1 <0.1 <0.1 <0.1 <0.1 <0.1
Pirimiphos ethyl <0.1 <0.1 <0.1 <0.1 <0.1 <0.1 <0.1
Azinphos methyl <0.1 <0.1 <0.1 <0.1 <0.1 <0.1 <0.1
Azinphos ethyl <0.1 <0.1 <0.1 <0.1 <0.1 <0.1 <0.1
Bromophos ethyl <0.1 <0.1 <0.1 <0.1 <0.1 <0.1 <0.1
Carbophenothion <0.1 <0.1 <0.1 <0.1 <0.1 <0.1 <0.1
Coumaphos <0.1 <0.1 <0.1 <0.1 <0.1 <0.1 <0.1
24
Dioxathion <0.1 <0.1 <0.1 <0.1 <0.1 <0.1 <0.1
Fenamiphos <0.1 <0.1 <0.1 <0.1 <0.1 <0.1 <0.1
Fenchlorphos <0.1 <0.1 <0.1 <0.1 <0.1 <0.1 <0.1
Formothion <0.1 <0.1 <0.1 <0.1 <0.1 <0.1 <0.1
Methacrifos <0.1 <0.1 <0.1 <0.1 <0.1 <0.1 <0.1
Methidathion <0.1 <0.1 <0.1 <0.1 <0.1 <0.1 <0.1
Mevinphos <0.1 <0.1 <0.1 <0.1 <0.1 <0.1 <0.1
Phorate <0.1 <0.1 <0.1 <0.1 <0.1 <0.1 <0.1
Phosalone <0.1 <0.1 <0.1 <0.1 <0.1 <0.1 <0.1
Profenophos <0.1 <0.1 <0.1 <0.1 <0.1 <0.1 <0.1
Prothiofos <0.1 <0.1 <0.1 <0.1 <0.1 <0.1 <0.1
Thiometon <0.1 <0.1 <0.1 <0.1 <0.1 <0.1 <0.1
Triazophos <0.1 <0.1 <0.1 <0.1 <0.1 <0.1 <0.1
Fungicides (ug/L)
Bupirimate <0.1 <0.1 <0.1 <0.1 <0.1 <0.1 <0.1
Chlorothalonil <0.1 <0.1 <0.1 <0.1 <0.1 <0.1 <0.1
Cyprodinil <0.1 <0.1 <0.1 <0.1 <0.1 <0.1 <0.1
Dichlofluanid <0.1 <0.1 <0.1 <0.1 <0.1 <0.1 <0.1
Dicloran <0.1 <0.1 <0.1 <0.1 <0.1 <0.1 <0.1
Difenoconazole <0.1 <0.1 <0.1 <0.1 <0.1 <0.1 <0.1
Dimethomorph <0.1 <0.1 <0.1 <0.1 <0.1 <0.1 <0.1
Diphenylamine <0.1 <0.1 <0.1 <0.1 <0.1 <0.1 <0.1
Fenarimol <0.1 <0.1 <0.1 <0.1 <0.1 <0.1 <0.1
Flusilazole <0.1 <0.1 <0.1 <0.1 <0.1 <0.1 <0.1
Hexaconazole <0.1 <0.1 <0.1 <0.1 <0.1 <0.1 <0.1
Imazalil <0.1 <0.1 <0.1 <0.1 <0.1 <0.1 <0.1
Iprodione <0.1 <0.1 <0.1 <0.1 <0.1 <0.1 <0.1
Metalaxyl <0.1 <0.1 <0.1 <0.1 <0.1 <0.1 <0.1
Penconazole <0.1 <0.1 <0.1 <0.1 <0.1 <0.1 <0.1
Prochloraz <0.1 <0.1 <0.1 <0.1 <0.1 <0.1 <0.1
Procymidone <0.1 <0.1 <0.1 <0.1 <0.1 <0.1 <0.1
Propiconazole I <0.1 <0.1 <0.1 <0.1 <0.1 <0.1 <0.1
25
Propiconazole II <0.1 <0.1 <0.1 <0.1 <0.1 <0.1 <0.1
Pyrimethanil <0.1 <0.1 <0.1 <0.1 <0.1 <0.1 <0.1
Tebuconazole <0.1 <0.1 <0.1 <0.1 <0.1 <0.1 <0.1
Vinclozolin <0.1 <0.1 <0.1 <0.1 <0.1 <0.1 <0.1
o-Phenylphenol <0.1 <0.1 <0.1 <0.1 <0.1 <0.1 <0.1
Herbicides (ug/L)
Atrazine <0.1 <0.1 <0.1 <0.1 <0.1 <0.1 <0.1
Diuron <0.1 <0.1 <0.1 <0.1 <0.1 0.41 <0.1
Hexazinone <0.1 <0.1 <0.1 <0.1 <0.1 <0.1 <0.1
Linuron <0.1 <0.1 <0.1 <0.1 <0.1 <0.1 <0.1
Metolachlor <0.1 <0.1 <0.1 <0.1 <0.1 <0.1 <0.1
Molinate <0.1 <0.1 <0.1 <0.1 <0.1 <0.1 <0.1
Oxyfluorfen <0.1 <0.1 <0.1 <0.1 <0.1 <0.1 <0.1
Pendimethalin <0.1 <0.1 <0.1 <0.1 <0.1 <0.1 <0.1
Simazine <0.1 <0.1 <0.1 <0.1 <0.1 <0.1 <0.1
Trifluralin <0.1 <0.1 <0.1 <0.1 <0.1 <0.1 <0.1
Miscellaneous (ug/L)
Buprofezin <0.1 <0.1 <0.1 <0.1 <0.1 <0.1 <0.1
Methoprene <0.1 <0.1 <0.1 <0.1 <0.1 <0.1 <0.1
Piperonyl Butoxide <0.1 <0.1 <0.1 <0.1 <0.1 <0.1 <0.1
Propargite <0.1 <0.1 <0.1 <0.1 <0.1 <0.1 <0.1
Tebufenpyrad <0.1 <0.1 <0.1 <0.1 <0.1 <0.1 <0.1
Tetradifon <0.1 <0.1 <0.1 <0.1 <0.1 <0.1 <0.1
Monocyclic Aromatic Hydrocarbons NMI 1120 Screen (ug/L)
Benzene <1 <1 <1 <1 <1 <1 <1
Toluene <1 <1 <1 <1 <1 <1 <1
Ethylbenzene <1 <1 <1 <1 <1 <1 <1
m & p-Xylenes <2 <2 <2 <2 <2 <2 <2
o-Xylene <1 <1 <1 <1 <1 <1 <1
Styrene <1 <1 <1 <1 <1 <1 <1
Isopropylbenzene <1 <1 <1 <1 <1 <1 <1
n-Propylbenzene <1 <1 <1 <1 <1 <1 <1
26
1,3,5-Trimethylbenzene <1 <1 <1 <1 <1 <1 <1
tert-Butylbenzene <1 <1 <1 <1 <1 <1 <1
1,2,4-Trimethylbenzene <1 <1 <1 <1 <1 <1 <1
sec-Butylbenzene <1 <1 <1 <1 <1 <1 <1
4-Isopropyltoluene <1 <1 <1 <1 <1 <1 <1
n-Butylbenzene <1 <1 <1 <1 <1 <1 <1
Halogenated Aliphatics Hydrocarbons NMI 1120 Screen (ug/L)
Chloromethane <5 <5 <5 <5 <1 <5 <5
Vinyl chloride <2 <2 <2 <2 <1 <2 <2
Bromomethane <5 <5 <5 <5 <1 <5 <5
Chloroethane <5 <5 <5 <5 <1 <5 <5
Trichlorofluoromethane <5 <5 <5 <5 <1 <5 <5
1,1-Dichloroethane <1 <1 <1 <1 <1 <1 <1
Dichloromethane <1 <1 <1 <1 <1 <1 <1
trans-1,2-Dichloroethene <1 <1 <1 <1 <1 <1 <1
1,1-Dichloroethene <1 <1 <1 <1 <1 <1 <1
2,2-Dichloropropane <1 <1 <1 <1 <1 <1 <1
cis-1,2-Dichloroethene <1 <1 <1 <1 <1 <1 <1
Bromochloromethane <1 <1 <1 <1 <1 <1 <1
1,1,1-Trichloroethane <1 <1 <1 <1 <1 <1 <1
Carbon tetrachloride <1 <1 <1 <1 <1 <1 <1
1,1-Dichloropropene <1 <1 <1 <1 <1 <1 <1
1,2-Dichloroethane <1 <1 <1 <1 <1 <1 <1
Trichloroethene <1 <1 <1 <1 <1 <1 <1
1,2-Dichloropropane <1 <1 <1 <1 <1 <1 <1
Dibromomethane <1 <1 <1 <1 <1 <1 <1
cis-1,3-Dichloropropene <1 <1 <1 <1 <1 <1 <1
trans-1,3-Dichloropropene <1 <1 <1 <1 <1 <1 <1
1,1,2-Trichloroethane <1 <1 <1 <1 <1 <1 <1
Tetrachloroethene <1 <1 <1 <1 <1 <1 <1
1,3-Dichloropropane <1 <1 <1 <1 <1 <1 <1
1,2-Dibromoethane <1 <1 <1 <1 <1 <1 <1
27
1,1,1,2-Tetrachloroethane <1 <1 <1 <1 <1 <1 <1
1,1,2,2-Tetrachloroethane <1 <1 <1 <1 <1 <1 <1
1,2,3-Trichloropropane <1 <1 <1 <1 <1 <1 <1
1,2-Dibromo-3-chloropropane <1 <1 <1 <1 <1 <1 <1
Hexachlorobutadiene <1 <1 <1 <1 <1 <1 <1
Halogenated Aromatics Hydrocarbons NMI 1120 Screen (ug/l)
Chlorobenzene <1 <1 <1 <1 <1 <1 <1
Bromobenzene <1 <1 <1 <1 <1 <1 <1
2-Chlorotoluene <1 <1 <1 <1 <1 <1 <1
4-Chlorotoluene <1 <1 <1 <1 <1 <1 <1
1,3-Dichlorobenzene <1 <1 <1 <1 <1 <1 <1
1,4-Dichlorobenzene <1 <1 <1 <1 <1 <1 <1
1,2-Dichlorobenzene <1 <1 <1 <1 <1 <1 <1
1,2,4-Trichlorobenzene <1 <1 <1 <1 <1 <1 <1
1,2,3-Trichlorobenzene <1 <1 <1 <1 <1 <1 <1
Trihalomethanes NMI 1120 Screen (ug/L)
Chloroform <1 <1 <1 3.9 <1 <1 <1
Bromodichloromethane <1 <1 <1 2.5 <1 <1 <1
Dibromochloromethane <1 <1 <1 1.2 <1 <1 <1
Bromoform <1 <1 <1 <1 <1 <1 <1
Polycyclic Aromatic Hydrocarbons(volatile) NMI 1120 Screen (ug/L)
Naphthalene <1 <1 <1 <1 <1 <1 <1
Poly Aromatic Hydrocarbons NMI 1122 Screen (ug/L)
Acenaphthylene <10 <10 <10 <10 <10 <10 <10
Naphthalene <10 <10 <10 <10 <10 <10 <10
Acenaphthene <10 <10 <10 <10 <10 <10 <10
Fluorene <10 <10 <10 <10 <10 <10 <10
Phenanthrene <10 <10 <10 <10 <10 <10 <10
Anthracene <10 <10 <10 <10 <10 <10 <10
Fluoranthene <10 <10 <10 <10 <10 <10 <10
Pyrene <10 <10 <10 <10 <10 <10 <10
Benz(a)anthracene <10 <10 <10 <10 <10 <10 <10
28
Chrysene <10 <10 <10 <10 <10 <10 <10
Benzo(b,k)fluoranthene <20 <20 <20 <20 <20 <20 <20
Benzo(a)pyrene <10 <10 <10 <10 <10 <10 <10
Indeno(1,2,3-cd)pyrene <10 <10 <10 <10 <10 <10 <10
Dibenz(a,h)anthracene <10 <10 <10 <10 <10 <10 <10
Benzo(g,h,i)perylene <10 <10 <10 <10 <10 <10 <10
Phenols NMI 1122 Screen (ug/L)
Phenol <10 <10 <10 <10 <10 <10 <10
2-Chlorophenol <10 <10 <10 <10 <10 <10 <10
2-Methylphenol <10 <10 <10 <10 <10 <10 <10
3&4-Methylphenol <20 <20 <20 <20 <20 <20 <20
2-Nitrophenol <10 <10 <10 <10 <10 <10 <10
2,4-Dimethylphenol <10 <10 <10 <10 <10 <10 <10
2,4-Dichlorophenol <10 <10 <10 <10 <10 <10 <10
2,6-Dichlorophenol <10 <10 <10 <10 <10 <10 <10
4-Chloro-3-methylphenol <20 <20 <20 <20 <20 <20 <20
2,4,5-Trichlorophenol <20 <20 <20 <20 <20 <20 <20
2,4,6-Trichlorophenol <20 <20 <20 <20 <20 <20 <20
2,3,4,6-Tetrachlorophenol <20 <20 <20 <20 <20 <20 <20
Pentachlorophenol <20 <20 <20 <20 <20 <20 <20
Oxygenated Compounds NMI 1120 Screen (ug/L)
Acetone <10 <10 <10 <10 <10 <10 <10
Vinylacetate <10 <10 <10 <10 <10 <10 <10
2-Butanone (MEK) <10 <10 <10 <10 <10 <10 <10
4-Methyl-2-pentanone (MIBK) <10 <10 <10 <10 <10 <10 <10
2-Hexanone (MBK) <10 <10 <10 <10 <10 <10 <10
Methyl tert-Butyl Ether (MTBE) <10 <10 <10 <10 <10 <10 <10
Sulfonated Compounds NMI 1120 Screen (ug/L)
Carbon disulfide <10 <10 <10 <10 <10 <10 <10
Phthalates NMI 1122 Screen (ug/L)
Dimethyl phthalate <10 <10 <10 <10 <10 <10 <10
Diethyl phthalate <10 <10 <10 <10 <10 <10 <10
29
Di-n-butyl phthalate <10 <10 <10 <10 <10 <10 <10
Butyl benzyl phthalate <10 <10 <10 <10 <10 <10 <10
Bis(2-ethylhexyl) phthalate <20 <20 <20 <20 <20 <20 <20
Di-n-octyl phthalate <10 <10 <10 <10 <10 <10 <10
Chlorinated Hydrocarbons NMI 1122 Screen (ug/L)
2-Chloronaphthalene <20 <20 <20 <20 <20 <20 <20
1,4-Dichlorobenzene <20 <20 <20 <20 <20 <20 <20
1,2-Dichlorobenzene <20 <20 <20 <20 <20 <20 <20
1,3-Dichlorobenzene <20 <20 <20 <20 <20 <20 <20
Hexachlorobenzene <20 <20 <20 <20 <20 <20 <20
1,2,4-Trichlorobenzene <20 <20 <20 <20 <20 <20 <20
Hexachloroethane <20 <20 <20 <20 <20 <20 <20
Hexachlorocyclopentadiene <20 <20 <20 <20 <20 <20 <20
Hexachloro-1,3-butadiene <20 <20 <20 <20 <20 <20 <20
Ethers NMI 1122 Screen (ug/l)
4-Bromophenyl phenyl ether <20 <20 <20 <20 <20 <20 <20
4-Chlorophenyl phenyl ether <20 <20 <20 <20 <20 <20 <20
Bis(2-chloroethyl)ether <20 <20 <20 <20 <20 <20 <20
Bis(2-chloroethoxy)methane <20 <20 <20 <20 <20 <20 <20
Bis(2-chloroisopropyl)ether <20 <20 <20 <20 <20 <20 <20
Amines Nitroaromatics & Nitrosamines NMI 1122 Screen (ug/L)
Azobenzene <20 <20 <20 <20 <20 <20 <20
2,4-Dinitrotoluene <20 <20 <20 <20 <20 <20 <20
2,6-Dinitrotoluene <20 <20 <20 <20 <20 <20 <20
Nitrobenzene <20 <20 <20 <20 <20 <20 <20
N-Nitrosodimethylamine <20 <20 <20 <20 <20 <20 <20
N-Nitrosodiphenylamine <20 <20 <20 <20 <20 <20 <20
N-Nitrosodi-n-propylamine <20 <20 <20 <20 <20 <20 <20
Aniline <20 <20 <20 <20 <20 <20 <20
4-Chloroaniline <20 <20 <20 <20 <20 <20 <20
2-Nitroaniline <20 <20 <20 <20 <20 <20 <20
3-Nitroaniline <20 <20 <20 <20 <20 <20 <20

30
4-Nitroaniline <20 <20 <20 <20 <20 <20 <20
Organochlorine Pesticides NMI 1122 Screen (ug/L)
Aldrin <20 <20 <20 <20 <20 <20 <20
a-BHC <20 <20 <20 <20 <20 <20 <20
b-BHC <20 <20 <20 <20 <20 <20 <20
g-BHC (Lindane) <20 <20 <20 <20 <20 <20 <20
d-BHC <20 <20 <20 <20 <20 <20 <20
4,4,'-DDD <20 <20 <20 <20 <20 <20 <20
4,4,'-DDE <20 <20 <20 <20 <20 <20 <20
4,4,'-DDT <20 <20 <20 <20 <20 <20 <20
Dieldrin <20 <20 <20 <20 <20 <20 <20
Endosulphan I <20 <20 <20 <20 <20 <20 <20
Endosulphan II <20 <20 <20 <20 <20 <20 <20
Endosulfan sulphate <20 <20 <20 <20 <20 <20 <20
Endrin <20 <20 <20 <20 <20 <20 <20
Endrin Aldehyde <20 <20 <20 <20 <20 <20 <20
Heptachlor <20 <20 <20 <20 <20 <20 <20
Heptachlorepoxide <20 <20 <20 <20 <20 <20 <20
Organophosphate Pesticides NMI 1122 Screen (ug/L)
Dimethoate <20 <20 <20 <20 <20 <20 <20
Diazinon <20 <20 <20 <20 <20 <20 <20
Fenitrothion <20 <20 <20 <20 <20 <20 <20
Malathion <20 <20 <20 <20 <20 <20 <20
Chlorpyrifos <20 <20 <20 <20 <20 <20 <20
Ethion <20 <20 <20 <20 <20 <20 <20
Surrogate
Surrogate semivolatile Rec. (%) 117 80 80 116 83 53 72
Surrogate volatile Rec (%) 96 112 112 111 85 118 89
Others
Dichlorobenzidine <20 <20 <20 <20 <20 <20 <20
2-Methylnaphthalene <20 <10 <10 <10 <10 <10 <10
Isophorone <20 <20 <20 <20 <20 <20 <20
31
Benzyl alcohol <20 <20 <20 <20 <20 <20 <20
Carbazole <20 <20 <20 <20 <20 <20 <20
Dibenzofuran <20 <20 <20 <20 <20 <20 <20
Miscellaneous
Detergent as MBAS (mg/L) 0.25 0.09 0.05 0.24 0.1

32
Table C.2 All data for the In-stream basin outlet (IS2), Wetland outlet (WE02) and Injectant (IW2) from the Queensland Health Scientific Sevices
Laboratories, Coopers Plains, QLD (detects in bold).
29.04.0
9
1.07.09 20.07.09 14.10.09 27.10.09 23.11.09 8.12.09 23.11.09
IS2 IS2 Injectant
IW2
IS2 WE02 IS2 WE02 Blank Milli Q
H2O
LOR
NITROSAMINES (ng/L)
NDMA‡
5 <5 <5 <5 <5 <5 <5 <5 <5
NDEA 10 <10 <10 <10 <10 <10 <10 <10 <10
Nitroso-piperidine 20 <10 NA NA <10 <20 <20 NA <20
Nitroso-pyrrolidine 10 <20 <10 <10 <20 NA <10 <20 <10
NDBA 20 <20 <20 <20 <20 <20 <20 <20 <20
Nitroso-morpholine
(NMOR)
10 <20 <20 <10 NA NA NA NA
%surrogate recovery 80 76 86 52 78 70 79.2 70
(Deuterated NDMA) 16 16
PHARMACEUTICALS (μg/L)
Acesulfame 0.01 0.19 0.14 <0.01
Acetylsalicylic acid 0.01 <0.01 <0.01 <0.01 <0.01 <0.01 <0.01 <0.01 <0.01
Atenolol 0.01 <0.01 <0.01 <0.01 <0.01 <0.01 <0.01 <0.01 <0.01
Atorvastatin 0.01 <0.01 <0.01 <0.01 <0.01 <0.01 <0.01 <0.01 <0.01
Caffeine 0.01 0.27 0.87 0.05 0.43 0.3 0.62 0.12 0.07
Carbamazepine 0.01 <0.01 <0.01 <0.01 <0.01 <0.01 <0.01 <0.01 <0.01
Cephalexin 0.01 <0.01 <0.01 <0.01 <0.01 <0.01 <0.01 <0.01 <0.01
Chloramphenicol 0.1 <0.10 <0.10 <0.10 <0.1 <0.1 <0.1 <0.1 <0.1
Chlortetracycline 0.1 <0.10 <0.10 <0.10 <0.1 <0.1 <0.1 <0.1 <0.1
Ciprofloxacin 0.01 <0.01 <0.01 <0.01 <0.01 <0.01 <0.01 <0.01 <0.01
Citalopram 0.01 <0.01 <0.01 <0.01 <0.01 <0.01 <0.01 <0.01 <0.01
Codeine 0.1 <0.10 <0.10 <0.1 <0.1 <0.1 <0.1 <0.1 <0.1
33
Cyclophosphamide 0.01 <0.01 <0.01 <0.01 <0.01 <0.01 <0.01 <0.01 <0.01
Dapsone 0.01 <0.01 <0.01 <0.01 <0.01 <0.01 <0.01 <0.01 <0.01
DEET 0.01 0.06 0.05 0.03 0.06 0.03 0.33 0.12 <0.01
Desmethyl Citalopram 0.01 <0.01 <0.01 <0.01 <0.01 <0.01 <0.01 <0.01 <0.01
Desmethyl Diazepam 0.01 <0.01 <0.01 <0.01 <0.01 <0.01 <0.01 <0.01 <0.01
Diazepam 0.01 <0.01 <0.01 <0.01 <0.01 <0.01 <0.01 <0.01 <0.01
Diclofenac 0.01 <0.01 <0.01 <0.01 <0.01 <0.01 <0.01 <0.01 <0.01
Doxylamine 0.01 <0.01 <0.01 <0.01 <0.01 <0.01 <0.01 <0.01 <0.01
Enrofloxacin 0.01 <0.01 <0.01 <0.01 <0.01 <0.01 <0.01 <0.01 <0.01
Erythromycin 0.01 0.03 <0.01 <0.01 <0.01 <0.01 <0.01 <0.01 <0.01
Erythromycin anhydrate 0.01 <0.01 <0.01 <0.01 <0.01 <0.01
Fluoxetine 0.01 <0.01 <0.01 <0.01 <0.01 <0.01 <0.01 <0.01 <0.01
Fluvastatin 0.01 <0.01 <0.01 <0.01 <0.01 <0.01 <0.01 <0.01 <0.01
Frusemide 0.01 <0.01 <0.01 <0.01 <0.01 <0.01 <0.01 <0.01 <0.01
Gabapentin 0.01 <0.01 <0.01 <0.01 <0.01 <0.01 <0.01 <0.01 <0.01
Gemfibrozol 0.01 <0.01 <0.01 <0.01 <0.01 <0.01 <0.01 <0.01 <0.01
Hydrochlorthiazide 0.01 <0.01 <0.01 <0.01 <0.01 <0.01 <0.01 <0.01 <0.01
Ibuprofen 0.01 <0.01 <0.01 <0.01 <0.01 <0.01 <0.01 <0.01 <0.01
Ifosfamide 0.01 <0.01 <0.01 <0.01 <0.01 <0.01 <0.01 <0.01 <0.01
Indomethacin 0.01 <0.01 <0.01 <0.01 <0.01 <0.01 <0.01 <0.01 <0.01
Iopromide 0.2 <0.20 <0.20 <0.2 <0.2 <0.2 <0.2 <0.2 <0.2
Lincomycin 0.01 <0.01 <0.01 <0.01 <0.01 <0.01 <0.01 <0.01 <0.01
Metoprolol 0.01 <0.01 <0.01 <0.01 <0.01 <0.01 <0.01 <0.01 <0.01
Naproxen 0.1 <0.10 <0.10 <0.1 <0.1 <0.1 <0.1 <0.1 <0.1
Norfloxacin 0.01 <0.01 <0.01 <0.01 <0.01 <0.01 <0.01 <0.01 <0.01
Oxazepam 0.01 <0.01 <0.01 <0.01 <0.01 <0.01 <0.01 <0.01 <0.01
Oxycodone 0.01 <0.01 <0.01 <0.01 <0.01 <0.01 <0.01 <0.01 <0.01
Oxytetracycline 0.1 <0.10 <0.10 <0.1 <0.1 <0.1 <0.1 <0.1 <0.1
Paracetamol 0.01 0.06 0.08 <0.01 0.11 <0.01 0.31 <0.01 0.02
Phenytoin 0.01 <0.01 <0.01 <0.01 <0.01 <0.01 <0.01 <0.01 <0.01
Praziquantel 0.01 <0.01 <0.01 <0.01 <0.01 <0.01 <0.01 <0.01 <0.01
Primidone 0.01 <0.01 <0.01 <0.01 <0.01 <0.01
Propranolol 0.01 <0.01 <0.01 <0.01 <0.01 <0.01 <0.01 <0.01 <0.01
34
Ranitidine 0.01 <0.01 <0.01 <0.01 <0.01 <0.01 <0.01 <0.01 <0.01
Roxithromycin 0.01 <0.01 <0.01 <0.01 <0.01 <0.01 <0.01 <0.01 <0.01
Salicylic acid 0.01 <0.01 0.02 <0.01 0.04 <0.01 <0.01 <0.01 <0.01
Sertraline 0.01 <0.01 <0.01 <0.01 <0.01 <0.01 <0.01 <0.01 <0.01
Simvastatin 0.01 <0.01 <0.01 <0.01 <0.01 <0.01 <0.01 <0.01 <0.01
Sulfsalazine 0.01 <0.01 <0.01 <0.01 <0.01 <0.01 <0.01 <0.01 <0.01
Sulphadiazine 0.01 <0.01 <0.01 <0.01 <0.01 <0.01 <0.01 <0.01 <0.01
Sulphamethoxazole 0.01 <0.01 <0.01 <0.01 <0.01 <0.01 <0.01 <0.01 <0.01
Sulphathiazole 0.01 <0.01 <0.01 <0.01 <0.01 <0.01 <0.01 <0.01 <0.01
Temazepam 0.01 <0.01 <0.01 <0.01 <0.01 <0.01 <0.01 <0.01 <0.01
Tetracycline 0.01 <0.01 <0.01 <0.01 <0.01 <0.01 <0.01 <0.01 <0.01
Tramadol 0.01 <0.01 <0.01 <0.01 <0.01 <0.01 <0.01 <0.01 <0.01
Triclosan 0.01 <0.01 <0.01 <0.01 0.01 <0.01 <0.01 <0.01 <0.01
Trimethoprim 0.01 <0.01 <0.01 <0.01 <0.01 <0.01 <0.01 <0.01 <0.01
Tylosin 0.01 <0.01 <0.01 <0.01 <0.01 <0.01 <0.01 <0.01 <0.01
Phenoxyacid Herbicides
(μg/L)
Venlafaxine 0.01 <0.01 <0.01 <0.01 <0.01 <0.01 <0.01 <0.01 <0.01
Warfarin 0.01 <0.01 <0.01 <0.01 <0.01 <0.01 <0.01 <0.01 <0.01
Dicamba 0.01 0.18 0.15 0.06 0.26 0.07 <0.01 0.35 <0.01
Mecoprop 0.01 <0.01 <0.01 <0.01 0.04 0.02 0.02 0.01 <0.01
MCPA 0.01 0.04 0.22 0.04 1.24 0.2 0.48 0.14 <0.01
2,4-DP 0.01 <0.01 <0.01 <0.01 <0.01 <0.01 <0.01 <0.01 <0.01
2,4-D 0.01 <0.01 <0.01 <0.01 0.05 0.01 0.03 0.01 0.01
Triclopyr 0.01 0.02 0.02 0.01 0.07 0.03 0.02 <0.01 <0.01
MCPB 0.01 <0.01 <0.01 <0.01 <0.01 <0.01 <0.01 <0.01 <0.01
Fluroxypyr 0.01 <0.01 <0.01 <0.01 <0.01 <0.01 <0.01 <0.01 <0.01
2,4-DB 0.01 <0.01 <0.01 <0.01 <0.01 <0.01 <0.01 <0.01 <0.01
Herbicides (μg/L)
Picloram 0.01 <0.01 <0.01 <0.01 <0.01 <0.01 <0.01 <0.01 <0.01
Dalapon 0.01 0.03 0.03 <0.01 <0.01 <0.01 0.02 <0.01 0.02
Ametryn 0.01 <0.01 <0.01 <0.01 <0.01 <0.01 <0.01 <0.01 <0.01
Atrazine 0.01 <0.01 <0.01 <0.01 0.43 0.19 0.13 0.04 <0.01
35
Bromacil 0.01 <0.01 <0.01 <0.01 <0.01 <0.01 <0.01 <0.01 <0.01
Carbaryl 0.01 <0.01 <0.01
Desethyl Atrazine 0.01 0.06 0.01 <0.01 0.05 0.02 0.04 0.02 <0.01
Desisopropyl Atrazine 0.01 0.02 0.02 <0.01 0.02 0.02 0.05 <0.01 <0.01
Diazinon 0.02 <0.02 <0.02
Diuron 0.01 0.12 0.17 0.1 0.25 0.21 0.39 0.14 <0.01
3,4 Dichloroaniline 0.01 <0.01 <0.01 <0.01 <0.01 <0.01
Fluometuron 0.01 <0.01 <0.01 <0.01 <0.01 <0.01 <0.01 <0.01 <0.01
Hexazinone 0.01 <0.01 <0.01 <0.01 <0.01 <0.01 <0.01 <0.01 <0.01
Metolachlor 0.01 <0.01 0.02 <0.01 <0.01 <0.01 <0.01 <0.01 <0.01
Prometryn 0.01 <0.01 <0.01 <0.01 <0.01 <0.01 <0.01 <0.01 <0.01
Propoxur 0.01 <0.01 <0.01
Simazine 0.01 0.03 0.16 0.11 0.11 0.12 0.12 0.03 <0.01
Tebuthiuron 0.01 <0.01 <0.01 <0.01 <0.01 <0.01 <0.01 <0.01 <0.01
Terbutryn 0.01 <0.01 <0.01 <0.01 <0.01 <0.01 0.01 <0.01 <0.01
Haloxyfop (acid) 0.01 <0.01 <0.01 <0.01 <0.01 <0.01 <0.01 <0.01 <0.01
Haloxyfop-2-etotyl 0.01 <0.01 <0.01 <0.01 <0.01 <0.01 <0.01 <0.01 <0.01
Haloxyfop-methyl 0.01 <0.01 <0.01 <0.01 <0.01 <0.01 <0.01 <0.01 <0.01
Total Haloxyfop 0.03 <0.03 <0.03 <0.03 <0.03 <0.03 <0.03 <0.03
36
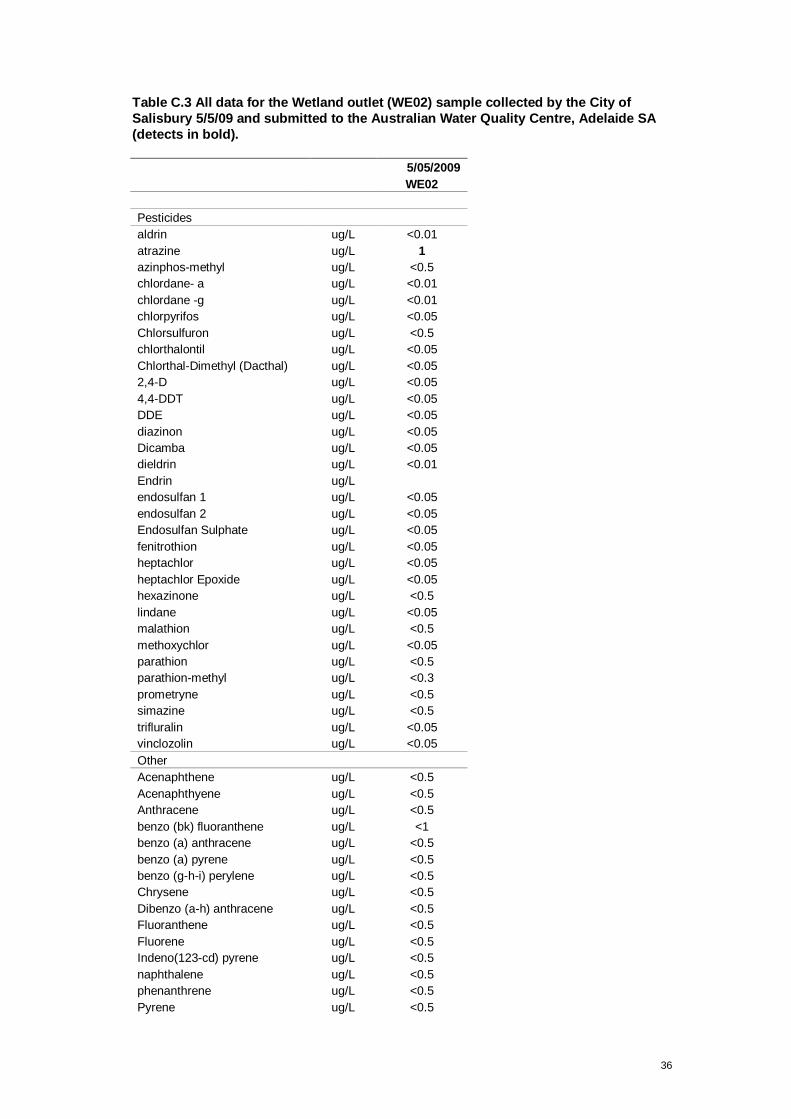
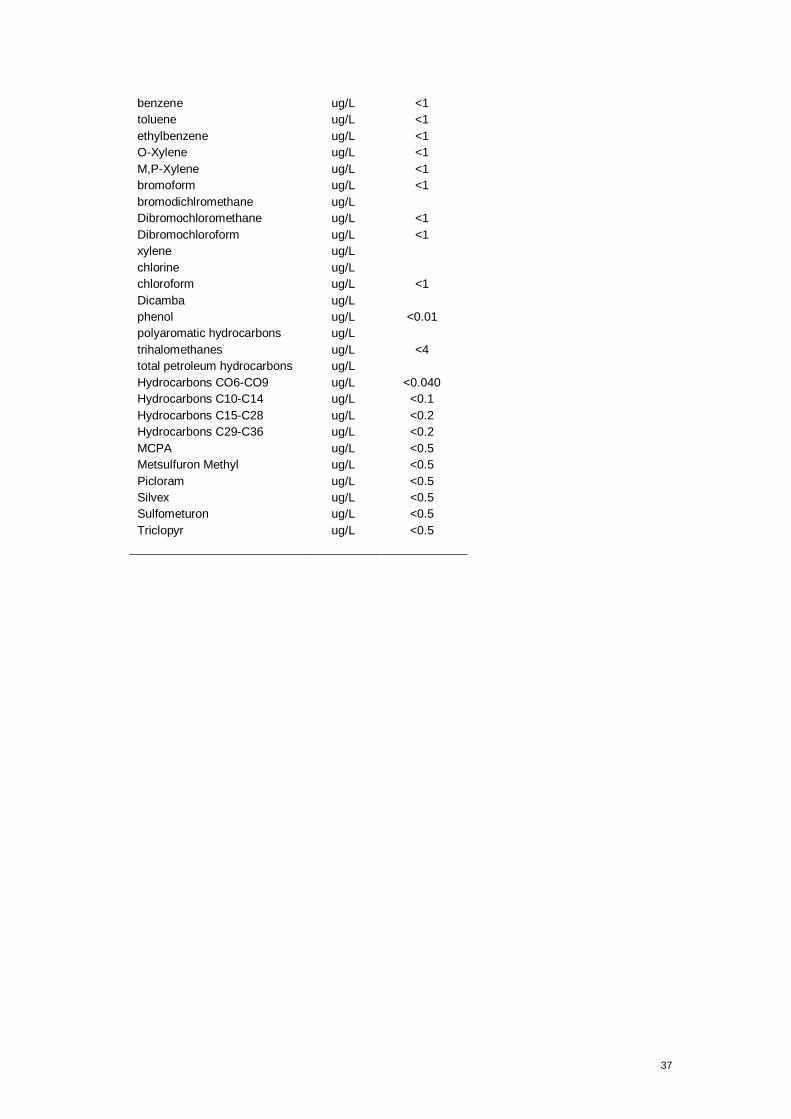
Table C.3 All data for the Wetland outlet (WE02) sample collected by the City of
Salisbury 5/5/09 and submitted to the Australian Water Quality Centre, Adelaide SA
(detects in bold).
5/05/2009
WE02
Pesticides
aldrin ug/L <0.01
atrazine ug/L 1
azinphos-methyl ug/L <0.5
chlordane- a ug/L <0.01
chlordane -g ug/L <0.01
chlorpyrifos ug/L <0.05
Chlorsulfuron ug/L <0.5
chlorthalontil ug/L <0.05
Chlorthal-Dimethyl (Dacthal) ug/L <0.05
2,4-D ug/L <0.05
4,4-DDT ug/L <0.05
DDE ug/L <0.05
diazinon ug/L <0.05
Dicamba ug/L <0.05
dieldrin ug/L <0.01
Endrin ug/L
endosulfan 1 ug/L <0.05
endosulfan 2 ug/L <0.05
Endosulfan Sulphate ug/L <0.05
fenitrothion ug/L <0.05
heptachlor ug/L <0.05
heptachlor Epoxide ug/L <0.05
hexazinone ug/L <0.5
lindane ug/L <0.05
malathion ug/L <0.5
methoxychlor ug/L <0.05
parathion ug/L <0.5
parathion-methyl ug/L <0.3
prometryne ug/L <0.5
simazine ug/L <0.5
trifluralin ug/L <0.05
vinclozolin ug/L <0.05
Other
Acenaphthene ug/L <0.5
Acenaphthyene ug/L <0.5
Anthracene ug/L <0.5
benzo (bk) fluoranthene ug/L <1
benzo (a) anthracene ug/L <0.5
benzo (a) pyrene ug/L <0.5
benzo (g-h-i) perylene ug/L <0.5
Chrysene ug/L <0.5
Dibenzo (a-h) anthracene ug/L <0.5
Fluoranthene ug/L <0.5
Fluorene ug/L <0.5
Indeno(123-cd) pyrene ug/L <0.5
naphthalene ug/L <0.5
phenanthrene ug/L <0.5
Pyrene ug/L <0.5
37
benzene ug/L <1
toluene ug/L <1
ethylbenzene ug/L <1
O-Xylene ug/L <1
M,P-Xylene ug/L <1
bromoform ug/L <1
bromodichlromethane ug/L
Dibromochloromethane ug/L <1
Dibromochloroform ug/L <1
xylene ug/L
chlorine ug/L
chloroform ug/L <1
Dicamba ug/L
phenol ug/L <0.01
polyaromatic hydrocarbons ug/L
trihalomethanes ug/L <4
total petroleum hydrocarbons ug/L
Hydrocarbons CO6-CO9 ug/L <0.040
Hydrocarbons C10-C14 ug/L <0.1
Hydrocarbons C15-C28 ug/L <0.2
Hydrocarbons C29-C36 ug/L <0.2
MCPA ug/L <0.5
Metsulfuron Methyl ug/L <0.5
Picloram ug/L <0.5
Silvex ug/L <0.5
Sulfometuron ug/L <0.5
Triclopyr ug/L <0.5