stormwater management using rainwater harvesting. testing
TRANSCRIPT

SR 7
36
Stormwater Management using Rainwater HarvestingTesting the Kellagher / Gerolin methodology on a pilot study
Report SR 736Release 2.0January 2012
R Kellagher

Stormwater Management using Rainwater Harvesting Testing the Kellagher / Gerolin methodology on a pilot study
SR 736 ii R. 2.0
Document information Project Stormwater Management using Rainwater Harvesting Report title Testing the Kellagher / Gerolin methodology on a pilot study Client HR Wallingford Client Representative I Townend Project No. MAY0405 Report No. SR 736 Project Manager R Kellagher Project Director S D Wade
Document history
Date Release Prepared Approved Authorised Notes 15/07/11 1.0 RBBK SDW RBBK 19/01/12 2.0 RBBK SDW RBBK
Prepared
Approved
Authorised
© HR Wallingford Limited This report is a contribution to research generally and it would be imprudent for third parties to rely on it in specific applications without first checking its suitability. Various sections of this report rely on data supplied by or drawn from third party sources. HR Wallingford accepts no liability for loss or damage suffered by the client or third parties as a result of errors or inaccuracies in such third party data. HR Wallingford will only accept responsibility for the use of its material in specific projects where it has been engaged to advise upon a specific commission and given the opportunity to express a view on the reliability of the material for the particular applications.

Stormwater Management using Rainwater Harvesting Testing the Kellagher / Gerolin methodology on a pilot study
SR 736 iii R. 2.0
Summary Stormwater Management using Rainwater Harvesting Testing the Kellagher / Gerolin methodology on a pilot study R Kellagher Report SR 736 January 2012 This project is aimed specifically at demonstrating the effectiveness of a new methodology for designing rainwater harvesting systems for controlling stormwater run-off. At present the perception held by most people is that the uncertainty associated with the availability of storage within a rainwater harvesting tank at the time of a large storm is too great to be able to rely upon it being sufficiently empty to store a specific (large) volume of water associated with an extreme rainfall event. This project demonstrates that, subject to a simple criterion being met, stormwater runoff can be managed using rainwater harvesting systems. This has major implications for the sizing and use of rainwater harvesting in the urban environment. This project has applied the new procedure developed by Gerolin and Kellagher (2009) [8] which has been developed specifically for rainwater harvesting systems to provide effective stormwater management. A pilot study based on a new residential development at Banbury (UK) has been used to measure the effectiveness of the procedure. This work has not only applied to the procedure, but also: based the demand on the water usage of modern appliances; investigated occupancy rates for the different property categories; measured roof sizes of residential properties; developed design assumptions based upon the number of bedrooms in a property; and tested the performance of the rainwater harvesting systems for both the theoretical
occupancy and the actual occupancy in the properties. This work was ably assisted by David Inch (2010) [12] who carried out the field work and data collection for his MSc thesis at Coventry University. Acknowledgement is also given to Juan Gutierrez Andres for all the modelling and analysis that has been carried out. This project is the culmination of research carried out and funded over the last 3 years by HR Wallingford. This extended summary provides a complete overview of the study; the principles of the rainwater harvesting design methodology are outlined, the pilot study is described, and the results and conclusions are provided. Related issues on the use of rainwater harvesting are also briefly mentioned. Rainwater harvesting: Demand & Yield The tank sizing methodology is a simple function of Demand and supply (Yield); where demand for water is greater than the supply, this enables rainwater harvesting to be used for stormwater control.

Stormwater Management using Rainwater Harvesting Testing the Kellagher / Gerolin methodology on a pilot study
SR 736 iv R. 2.0
Summary continued The premise of the study is that the systems operate in a passive manner; in other words that water demand is on the basis of daily need, while supply is a function of the rainfall on the collecting surface. However RTC (real time control) or active control of the system is possible. This would manage the storage using decision rules and ensure sufficient storage is available at all times or when large events are likely. Active control, although rarely applied at present, is being used in a few cases. This report therefore also discusses the issues and opportunities associated with the use of rainwater harvesting in this way in Appendix E. Demand Rainwater, after being collected off roofs and stored, is contaminated to some degree. Although it has the advantage of being soft water, it can only be used for toilet flushing and clothes washing. Modern dual flush toilets use far less water than they did even in the recent past. However it is considered unlikely that best practice will continue to significantly reduce water use much further. The assumptions used in this study (based on an extensive literature review) for both toilets and washing machines are that daily consumptions are 21 litres per person are used for modern toilets and 19 litres per person for washing machines. A key outcome of this element of the research is that toilet flushing on its own with normal property occupancy provides insufficient demand on the collected rainwater from modern standard sized house roofs in UK to provide stormwater control capability. Total demand is based upon the individual consumption rate times the house occupancy. Unfortunately house occupancy within any one property varies with time. Although occupancy cannot be known for any one house, statistical information is available with regards to occupancy of the various categories of houses. Therefore as the number of bedrooms in any property rarely changes and as this is known at the time of construction or when a rainwater harvesting system is designed, the only basis for sizing of the rainwater harvesting tank is to use assumptions of occupancy related to easily measured characteristics of each category of property. This pilot study used local Oxfordshire data on demand and household occupancy, but comparisons with national information indicates that these average occupancy values are very similar across the country. Unfortunately these average occupancy values are not a real (whole) numbers and clearly actually occupancy is always an integer number. Other design assumptions could be made for estimating; for instance the statistical occupancy might be rounded down to the nearest whole number and this would provide a more conservative assumption on water demand. However as Table S1 illustrates, this would result in a significant reduction in assumed occupancy and therefore in assumed water consumption across an estate. Table S1 gives the statistical occupancy rates that have been used in this study. Table S1 Statistical occupancy rates by property type
House type Two-bedroom Three-bedroom Four-bedroom Occupancy rate 1.74 2.41 3.02
It should be noted that one-bedroom occupancy always provided insufficient consumption to enable the design procedure to be applied. As there are relatively few one-bedroom dwellings built (other than in the form of flats), this is not seen as a particularly important constraint in the value that rainwater harvesting can bring for stormwater control. Information on houses with more than 4 bedrooms also exists, but as over 90% of properties are covered by two, three and four-bedroom houses, (with roughly half of any estate being three bedroom houses) these properties are clearly the important ones to assess the performance of rainwater harvesting systems.

Stormwater Management using Rainwater Harvesting Testing the Kellagher / Gerolin methodology on a pilot study
SR 736 v R. 2.0
Summary continued Yield The methodology on yield uses average annual rainfall. An analysis of rainfall shows that mean monthly depths are actually not significantly different through the year across much of the UK. In addition, the largest urban flood events (1 to 6 hours) tend to be in the summer months. This means that in the months where there is on average slightly less rainfall (see Figure S1), which is in spring and summer, there should normally be slightly more storage available to address these large events. The Gerolin and Kellagher procedure is therefore based on the very simple assessment of evaluating the ratio of Yield divided by Demand (Y/D) using annual rainfall which is a commonly available measure.
0
20
40
60
80
100
120
Jan Feb Mar Apr May Jun Jul Aug Sep Oct Nov Dec
Mea
n m
on
thly
ra
infa
ll (m
m)
Oxford 1984-2010
Oxford 1853-2010
TSR rainfall
Drop bars are + /- 1 standard deviation
Figure S1 Monthly rainfall for the Oxford region - mean and 1 standard deviation The research did investigate whether the methodology should be based upon seasonal characteristics, but this showed little benefit in estimating the tank storage volume required. However with the predictions of climate change indicating that winters will be wetter and summers drier, the procedure may need to be modified in due course. Application of this method in other countries where wet and dry seasons take place is also possible, but a seasonal measure of Y/D would be necessary. Much of England has an annual rainfall of less than 750mm. This is made up of more than 150 rainfall events a year, with many of them being very small depths. Table S2 summarises the time series rainfall data that has been used in this study. This data set is a 100 year series and was generated using the tool TSRsim and trained against a ten-year data set from the Elmdon gauge at Birmingham. The average annual rainfall depth of this series is 713mm. Table S2 Number of rainfall events per year in depth bands from the 100 year series
Depth range
0 – 5 mm
5 – 10 mm
10 – 20 mm
20 – 30 mm
30 – 40 mm
40 – 50 mm
50 – 60 mm
60 – 70 mm
70+ mm
No. of events/ yr
125 28 13 3 0.8 0.3 0.09 0.06 0.09

Stormwater Management using Rainwater Harvesting Testing the Kellagher / Gerolin methodology on a pilot study
SR 736 vi R. 2.0
Summary continued If one assumes that the 125 events less than 5mm have an average rainfall depth of 2mm, this actually represents around 35% of the total annual rainfall. This draws attention to the fact that even for tiled pitched roofs, initial losses are likely to be a significant component in the assessment of run-off. The runoff assumptions made in this study were that every event had an initial wetting loss of 0.5mm (an annual depth of 75mm) with a subsequent run-off proportion of 0.81. This value comprises an assumed 10% loss for subsequent run-off after wetting and another 10% loss for the rainwater filter. These assumptions result in a net run-off depth of 517mm/pa. This illustrates that, even on surfaces which have small wetting losses, total annual runoff losses can have a significant impact on the estimate of net rainfall run-off and that an allowance for losses is important. This has very significant implications when this approach is extended to green roofs. In addition to evaluating net rainfall through the year, assumptions have to also be made with regards to the run-off proportion for design events (the stormwater rainfall depth to be stored). For events of the order of 60mm (the storm event depth used on this study) clearly the wetting loss element is trivial, but what is less clear is whether the assumption of 81% of the rainfall depth is suitable. Losses in the filter system during short periods of very high intensity are likely to be very different to low intensity, longer duration events. Similarly the assumption of 10% losses, once the roof is thoroughly wetted, may be an overestimate. This study has assumed the same assumptions as for ‘normal’ event runoff and used 81%. The design method for rainwater harvesting tank sizing Appendix A of this document details the rainwater harvesting storage design methodology for stormwater management. The principal features of the method are explained here. The key parameter is the ratio Y/D, where the criterion for stormwater management requires this ratio to be less than 0.95. What this means is that the demand, on average, must be more than the yield and that this ensures that there is storage normally available in the tank. From the previous work by Gerolin and Kellagher (2009) [8], it was shown that where this ratio is less than around 0.7, there is usually considerable storage available. However as the ratio tends towards unity, the availability of storage is much less certain. When the ratio exceeds 1.0 the tank is often full though there are also frequent periods when some storage volume is available. However as the ratio rises above 1.2, the storage available becomes significantly less and also more infrequent. The procedure therefore provides a method for sizing the tank storage for any specific design rainfall depth, (and in this case the study used 60mm as this is approximately the 100 year 6 hour event and relates to a drainage design criterion used in UK), and a specific allowance is made to take into account the increasing uncertainty of storage availability as the ratio tends towards 0.95. As a rule of thumb, the storage volume needed per person ranges from 1 to 3m3 depending on the Y/D ratio. This is approximately between two and six times more storage than is usually provided when sizing tanks for water supply purposes only (see BS8515). It is recognised that this is a considerable volume and implies both cost and space issues. Pilot study results The pilot study selected a modern residential development, in the town of Banbury in England. It is typical of many such developments being built in the UK at present.

Stormwater Management using Rainwater Harvesting Testing the Kellagher / Gerolin methodology on a pilot study
SR 736 vii R. 2.0
Summary continued The study made detailed investigations into the size of properties and the number of bedrooms and explicitly modelled all the properties individually. Of the 66 properties of the study area, there were 11 that did not comply with the Y/D ratio limit of 0.95 based upon the statistical (theoretical) occupancy. 55 properties were therefore assumed to have rainwater harvesting systems which were sized in accordance with the procedure to store a 60mm rainfall event. Information on the actual occupancy of the houses was obtained by questionnaire for 34 of the properties, of which 30 would have been provided with rainwater harvesting systems based upon the statistical occupancy complying with the Y/D ratio. Of these 30 properties, 7 had actual occupancy levels which did not comply with the 0.95 ratio limit. A check was made as to whether the proportion of non-compliance of real occupancy houses would have reduced if the ratio limit for providing rainwater harvesting systems was dropped to 0.8. In this instance this would have meant that only 38 of the 66 properties would have received rainwater harvesting systems (as opposed to 55), and of this smaller group of houses, only 22 properties had known occupancy information. Although one would expect a proportional reduction in non-compliance, in fact this resulted in 5 of the 22 properties being non-compliant, which is actually a slightly greater proportion. This implies that the Y/D ratio is not sensitive factor, and it is largely a function of occupancy variability. This aspect (occupancy distribution and its impact) can be explicitly addressed in the methodology for designing drainage systems and is detailed in appendix D. The result of the analysis for real occupancy is shown in Figure S2. This figure shows that for all events larger than 60mm that the average volume of runoff stored is 58mm – slightly under the design value of 60mm. However this includes the “failed” properties. The figure shows that the non-compliant houses (in terms of Y/D ratio) always “fail” to store the majority of the rainfall runoff. This can be seen by the fairly constant proportion of runoff from each event.
Figure S3 54 events larger than 40mm: retained and stored depth for each event for actual occupancy of 31 properties

Stormwater Management using Rainwater Harvesting Testing the Kellagher / Gerolin methodology on a pilot study
SR 736 viii R. 2.0
Summary continued Detailed discussion of the actual compliance to the Y/D ratio achieved by the rainwater harvesting systems is left to the main report including the performance of the non-compliant houses, but, in principle, the results indicate that storage was only effective for those properties where the Y/D ratio complies with the limit of 0.95. Therefore for any group of houses provided with rainwater harvesting to store a specific design storm depth, an estimate of the proportion of non-compliant properties needs to be made when calculating the effective storage provided towards the total stormwater storage required for the whole site in providing runoff control. However where rainwater harvesting systems are provided on a communal basis with all houses served by a central tank, the study has shown that the statistically designed basis for sizing the tank successfully meets the requirements for storing the design extreme event. Calculations have not been made to establish the number of properties that need to be served communally in order to minimise the risk of the average occupancy being significantly different to the statistical mean, It is suggested, for now, that 10 properties that are served by a communal system would probably reflect average occupancy characteristics sufficiently and would therefore reliably achieve 100% contribution to the storage requirements for an extreme design event. Figure S3 shows that storage generally exceeds design rainfall depths for al events greater than 60mm, though one or two events fail to meet design requirements.
Figure S3 54 events larger than 40mm: retained and stored depth for each event for a communal tank designed to retain 60mm rainfall

Stormwater Management using Rainwater Harvesting Testing the Kellagher / Gerolin methodology on a pilot study
SR 736 ix R. 2.0
Summary continued Conclusions The three main conclusions from this study are: 1. The design methodology for sizing rainwater harvesting storage tanks for stormwater
control is effective in being able to store stormwater runoff for a specific design event, but properties must comply with the rule Y/D<0.95.
2. Where properties are provided with individual tanks, that a proportion of properties will “fail” to control the runoff and that this number can be estimated statistically. This therefore still allows design of storage on a site to take account of storage provided by the rainwater harvesting systems.
3. A communal approach to rainwater harvesting removes the uncertainty associated with occupancy rates and effectively removes the non-compliant property element. The minimum number of properties that need to be served communally to avoid having to consider occupancy uncertainty has not been evaluated in this research.
Overcoming barriers to the general use of rainwater harvesting for stormwater control Although the procedure and the principal of using rainwater harvesting systems for stormwater control has been effectively demonstrated here, there are still a number of technical, management and health risk obstacles which will limit widespread implementation. Technical risks are: space availability for storage tanks; the cost of their construction; and carbon - principally the embedded carbon of such systems. Space Modern housing developments are generally high density with very limited space between the road and the property. This has serious implications for finding room to place a storage tank. The larger volume required could result in a deeper tank design (shaped more like a traditional soakaway), but this may have implications for floatation in locations with high groundwater levels. Cost The cost of rainwater harvesting systems is quite significant, and in designing for stormwater control, the storage volume has to be significantly increased which has implications for increasing the cost. The additional cost may actually be relatively small as much of the cost of rainwater harvesting is in the cost of installation and also the extra storage could be in the form of geo-cellular storage units. Carbon A recent Environment Agency report (Environment Agency, 2010) found that both the operational carbon cost and the embedded materials and construction carbon cost of rainwater harvesting system were greater than the carbon cost of providing potable water. Upon reviewing the report, the conclusion that operational carbon of rainwater harvesting systems is greater than potable water seems open to challenge, but it is clear that the embedded carbon is significant and that, even looking at total lifetime carbon, this aspect is heavily weighted in favour of potable water. It is worth noting that carbon associated with treatment of potable water did not appear to be included in the Environment Agency study, nor the implications of providing an additional 30% supply of water, which rainwater harvesting effectively achieves.

Stormwater Management using Rainwater Harvesting Testing the Kellagher / Gerolin methodology on a pilot study
SR 736 x R. 2.0
Summary continued Management risks are associated with proper operation and maintenance of these units by private owners. If they are decommissioned, any benefit regarding their water saving or stormwater control capability is lost. An issue which is seen as being a big problem is the number of instances of cross-connection of non-potable water supply systems with the potable reticulation in private properties. This problem is receiving considerable attention at present. Although these obstacles are a considerable barrier to the take up of rainwater harvesting, it is important to provide a balanced picture and consider the significant benefits that are provided. The first of the two principal advantages of rainwater harvesting systems is the issue of water scarcity and resource minimisation. The fact that a significant proportion of the water consumed in dwellings that needs to be abstracted, treated and delivered to people, can be significantly reduced (which in certain parts of the UK is an important aspect) along with a similar reduction of chemicals and energy costs associated with treating the water. The second main advantage is the range of benefits associated with reducing the volume of run-off during storm events which will help in reducing pollution as well as flooding downstream. Further research There are areas where further research would usefully be carried out to assist in refining and promoting the procedure. Confirmation of the method using additional pilot studies would be helpful in demonstrating universal (or at least in UK) application of the procedure. There are a couple of specific research activities which are needed to assist in refining some of the technical assumptions made in the design method. Appliance water demand The assumptions made with regards to water demand toilet (flushing and washing machine use) are based upon a competent literature review, but it is important to recognise that the consumption rates used vary from person to person and property to property. Further investigation on getting a detailed understanding of the average consumption and variability of individual water use (for both appliances) for actual occupancy, and by house type and other demographic characteristics would be very useful to collect and analyse. This work would also look into the effect of holiday patterns and week-end behaviour affecting demand, and whether this makes a significant difference to the current assumption of a standard daily demand. It is worth noting the myth busting results of in-depth research on shower usage which has shown that people stay in showers for much longer than had been assumed. Communal rainwater harvesting systems This research would look at the whole issue of Communal versus Individual rainwater harvesting systems. This would address the statistical issues of house occupancy uncertainty, construction and operational costs and management issues. Rainfall yield The net rainfall run-off from standard pitched roofs warrants further investigation. The effectiveness of the filter system at different rates of run-off in particular needs to be understood. This applies equally to the extreme event performance and very small rainfall depths to evaluate wetting losses.

Stormwater Management using Rainwater Harvesting Testing the Kellagher / Gerolin methodology on a pilot study
SR 736 xi R. 2.0
Summary continued Green roofs Although runoff losses are needed to be understood for standard tiled pitched roofs, it could also be usefully extended to metal roofs, flat roofs and green roofs. The last clearly requires in-depth investigation due to the seasonal variation in hydraulic characteristics along with the variability in terms of media depth and explicit water storage provision. The benefit of green roofs in assisting with compliance with meeting the Y/D ratio are very significant and would allow stormwater control to be applied much more effectively across the UK in higher rainfall areas, though the implications for reductions in yield for non-potable water will also need to be understood. Other methods for ensuring adequate tank storage As mentioned earlier, this methodology assumes no other mechanisms other than demand for reducing the volume of water stored in the tank to provide sufficient storage for an extreme event. Other options include using infiltration (even where the soils are clayey), or positive action to partially empty the tank into the stormwater drainage system during dry periods. There is scope for a number of different approaches to be explored for active system control. Application of the procedure in commercial and industrial properties Research needs to be carried out to investigate application of the method for non-residential use.

Stormwater Management using Rainwater Harvesting Testing the Kellagher / Gerolin methodology on a pilot study
SR 736 xii R. 2.0

Stormwater Management using Rainwater Harvesting Testing the Kellagher / Gerolin methodology on a pilot study
SR 736 xiii R. 2.0
Glossary and abbreviations Attenuation A reduction of the rate of flow with a consequent increase in
duration of flow.
Depression storage The depth of water retained on a surface prior to runoff taking place.
Discharge Flow emanating from a site.
Extreme event (Rainfall) that occurs infrequently and is large and / or of high intensity.
Greenfield development Development that takes place on land which either is farmland or in its natural vegetated state and has never previously been built on.
Greenfield runoff rate The maximum rate of runoff from a greenfield area that is expected to occur due to rainfall of a specific return period and duration.
Groundwater Water in the saturated zone below the surface of the land.
Non-potable water Water that is untreated or has had limited treatment but does not meet potable water standards.
Potable water Water that has received treatment and is fit for consumption.
Rainwater harvesting Collected rainwater runoff for subsequent use, usually from roof surfaces.
Receiving waters A general term for all streams, rivers, lakes and other water bodies into which drainage is discharged.
Regulator A legal organisation (such as the Environment Agency) with responsibility for controlling and permitting certain actions.
Return period The frequency with which an event occurs. A 100 year storm is one that occurs on average once every one hundred years.
Runoff coefficient The proportion of water that runs off from a surface (from rainfall).
Sewerage system A piped drainage system which serves either stormwater or foul water.
Soakaway A sub-surface structure into which surface water is passed to infiltrate into the ground.
Stochastic rainfall Generated rainfall series using a computer package to replicate the characteristics of rainfall for a continuous period, usually for a number of years, for a specific location.
Sustainable Drainage systems A drainage system which is designed to manage stormwater by reducing surface water runoff volume, partially treating it and maximise environmental benefits which generally involves the use of vegetated storage and conveyance systems.

Stormwater Management using Rainwater Harvesting Testing the Kellagher / Gerolin methodology on a pilot study
SR 736 xiv R. 2.0
Glossary and abbreviations continued
CSO Combined Sewer Overflow.
Defra Department of Environment Food and Rural Affairs.
FSR Flood Studies Report (produced in 1975).
FEH Flood Estimation Handbook (produced in 1999 to replace FSR).
Rainclim Stochastic rainfall generator produced by Newcastle University.
SAAR Standard Average Annual Rainfall (mm)
SuDS Sustainable Drainage systems
TSRrain Stochastic rainfall generator produced by HR Wallingford – now referred to as TSRsim

Stormwater Management using Rainwater Harvesting Testing the Kellagher / Gerolin methodology on a pilot study
SR 736 xv R. 2.0
Contents Title page i Document information ii Summary iii Glossary and abbreviations xiii Contents xv
1. Objectives......................................................................................................................... 1
2. Project context.................................................................................................................. 1 2.1 Why is rainfall harvesting potentially so useful?................................................. 1 2.2 The current research situation.............................................................................. 3 2.3 The uncertainties associated with designing rainwater harvesting tanks for
stormwater control ............................................................................................... 3
3. The Kellagher/ Gerolin methodology .............................................................................. 5
4. Project overview............................................................................................................... 8
5. Demand related data......................................................................................................... 9 5.1 House occupancy – county and national.............................................................. 9 5.2 House occupancy – Hanwell pilot study............................................................ 12 5.3 Appliance water consumption ........................................................................... 12 5.4 Discussion on Demand for RWH design........................................................... 15
6. Yield related data – roof areas........................................................................................ 16 6.1 Data collection roof size .................................................................................... 16
7. Yield related data - rainfall............................................................................................. 18 7.1 Rainfall analysis................................................................................................. 18 7.2 Event extreme value analysis............................................................................. 19 7.3 Monthly rainfall analysis ................................................................................... 23 7.4 Variability of annual and seasonal rainfall depth .............................................. 25 7.5 Rainfall runoff assumptions............................................................................... 30
8. Pilot study – Y/D analysis.............................................................................................. 31
9. Pilot study rainwater harvesting options ........................................................................ 33 9.1 Design tank sizes for each property................................................................... 34 9.2 Tank sizes for actual occupancy for each property............................................ 35 9.3 A communal rainwater harvesting tank for all properties with Y/D less than
0.95 .................................................................................................................... 35 9.4 A model of the base condition ........................................................................... 36
10. Results ............................................................................................................................ 36 10.1 Performance of rainwater harvesting system for tanks sized for 60mm
rainfall for each property ................................................................................... 37 10.1.1 Seasonal analysis of tank performance for extreme events.................. 41 10.1.2 Detailed examination of event spill performance................................. 41
10.2 Performance of rainwater harvesting system for tanks sized for 60mm rainfall with the actual occupancy in each property .......................................... 44
Stormwater Management using Rainwater Harvesting Testing the Kellagher / Gerolin methodology on a pilot study
SR 736 xvi R. 2.0
Contents continued
10.3 Performance of rainwater harvesting system for an aggregated tank to serve all properties with Y/D less than 0.95 sized for 60mm rainfall ......................... 47
11. A methodology for assessing uncertainty of property occupancy.................................. 49
12. Conclusions on stormwater control management using rainwater harvesting systems.. 51
13. Recommendations for application of rainwater harvesting for hydraulic design........... 53
14. The future take-up of rainwater harvesting for stormwater control ............................... 54 14.1 Regulatory approval........................................................................................... 54 14.2 Space for rainwater harvesting systems ............................................................. 54 14.3 Costs of rainwater harvesting systems ............................................................... 55 14.4 Carbon use ......................................................................................................... 55
14.4.1 Operational carbon ............................................................................... 55 14.4.2 Reducing operating energy costs.......................................................... 56 14.4.3 Embedded carbon................................................................................. 56
14.5 Benefits associated with rainwater harvesting ................................................... 57
15. The future ....................................................................................................................... 58 15.1 Confirmation pilots ............................................................................................ 58 15.2 Commercial and industrial buildings ................................................................. 58 15.3 Green roofs with rainwater harvesting............................................................... 59 15.4 Carbon and sustainability assessment ................................................................ 59 15.5 active management of rainwater harvesting systems ......................................... 59
16. References ...................................................................................................................... 60 Tables Table 5.1 Summary of occupancy rates for new market housing in Cherwell District,
Oxfordshire. Source: OCC (2009) ...................................................................... 10 Table 5.2 Summary of occupancy rates for new market housing in (i) Cherwell District
and (ii) Oxfordshire County. Source: OCC (2009)............................................. 10 Table 5.3 Occupancy by accommodation type and number of bedrooms, England
2004-2007. Source: DCLG (2007) [24] ............................................................... 12 Table 5.4 Summary of occupancy rates for housing in Hanwell ......................................... 12 Table 5.5 Daily consumption estimates from Thames Water and others. (Ofwat, 2010) ... 14 Table 5.6 Daily non-potable water consumption estimated from appliance use.................. 15 Table 6.1 Roof areas by house model (excluding houses with garages attached) ............... 16 Table 6.2 Roof areas by number of bedrooms (houses with garages attached and single
floor dwellings have been excluded) ................................................................... 17 Table 6.3 Roof areas by house format (houses with garages attached) ............................... 17 Table 7.1 Rainfall parameter comparison for validating the seasonal analysis – FSR
maps ..................................................................................................................... 23 Table 7.2 Proportion of annual rainfall depth by month and season for the stochastic
series compared to Oxford ................................................................................... 24 Table 7.3 Elmdon: mean and 95% ranges of rainfall series - annual and seasonal
depths ................................................................................................................... 27

Stormwater Management using Rainwater Harvesting Testing the Kellagher / Gerolin methodology on a pilot study
SR 736 xvii R. 2.0
Contents continued Table 8.1 Y/D ratios for properties in the pilot study area based on statistical and
actual occupancy rates ......................................................................................... 32 Table 8.2 Y/D ratios for properties by number of bedrooms based on statistical and
actual occupancy rates – excluding 1 bedroom properties. ................................. 33 Table 9.1 Storage volume by number of bedrooms per property ........................................ 34 Table 10.1 Extreme events by season and their spill performance greater than 1mm for
“common pipe” for all properties with Y/D <0.95 .............................................. 41 Table 11.1 Statistical values used for assessing non-compliance of properties provided
with rainwater harvesting tanks at the pilot site................................................... 50 Figures Figure 2.1 The benefits of rainwater harvesting...................................................................... 2 Figure 2.2 The storage available (shown as depth of rainfall) for 4 rainwater harvesting
systems with Y/D ratio ranging from 0.4 to 1.9 .................................................... 4 Figure 3.1 Flow chart for sizing of rainwater harvesting tanks for stormwater control.......... 6 Figure 3.2 Storage tank sizes as a function of Y/D for both Gerolin and Kellagher and
BS8515 (2009)....................................................................................................... 7 Figure 5.1 Number of occupants by number of households; Cherwell, SE England,
England ................................................................................................................ 11 Figure 5.2 breakdown of domestic consumption by water use (Waterwise 2010) [20]........ 13 Figure 7.1 Stochastic series event analysis by season – 6 hours ........................................... 20 Figure 7.2 Stochastic series event analysis by season – 24 hours ......................................... 20 Figure 7.3 Observed event analysis by season – 6 hours ...................................................... 21 Figure 7.4 Observed event analysis by season – 24 hours .................................................... 21 Figure 7.5 Annual Series event analysis comparisons (Observed / stochastic / FEH /
FSR) – 6 hours ..................................................................................................... 22 Figure 7.6 Annual Series event analysis comparisons (Observed / stochastic / FEH /
FSR) – 24 hours ................................................................................................... 22 Figure 7.7 Events by depth bands in the 100 year series ...................................................... 23 Figure 7.8 Comparison of stochastic series with Oxford for monthly data series for
mean and 1 Standard Deviation ........................................................................... 24 Figure 7.9 Rainfall exceedence – annual and seasonal and impact on Y/D ratio.................. 25 Figure 7.10 Elmdon: Mean Annual rainfall and 95%ile ranges for stochastic series and
observed data ....................................................................................................... 28 Figure 7.11 Elmdon: Mean Seasonal rainfall and 95%ile ranges for stochastic series and
observed data - Spring ......................................................................................... 28 Figure 7.12 Elmdon: Mean Seasonal rainfall and 95%ile ranges for stochastic series and
observed data - Summer ...................................................................................... 29 Figure 7.13 Elmdon: Mean Seasonal rainfall and 95%ile ranges for stochastic series and
observed data - Autumn....................................................................................... 29 Figure 7.14 Elmdon: Mean Seasonal rainfall and 95%ile ranges for stochastic series and
observed data - Winter ......................................................................................... 30 Figure 8.1 Pilot study area for rainwater harvesting analysis – Hanwell Fields ................... 31 Figure 9.1 Storage tank sizes as a function of Y/D for both Gerolin and Kellagher and
BS8515 ................................................................................................................ 35 Figure 10.1 Proportion of events with 1mm or more of rainfall spilling from each tank in
rainfall depth bands and by Y/D ratio.................................................................. 37 Figure 10.2 Proportion of events with an average of more than 1mm of rainfall spilling
from all tanks, also showing number of events by rainfall depth ranges............. 38

Stormwater Management using Rainwater Harvesting Testing the Kellagher / Gerolin methodology on a pilot study
SR 736 xviii R. 2.0
Contents continued Figure 10.3 54 events larger than 40mm: retained and stored depth for each event ............... 39 Figure 10.4 Proportion of events with an average of more than 1mm of rainfall spilling
from all tanks with Y/D ratio less than 0.8 .......................................................... 40 Figure 10.5 54 events larger than 40mm: retained and stored depth for each event –
properties with Y/D less than 0.8......................................................................... 40 Figure 10.6 Spill performance for 100 year rainfall series for Y/D 0.65 ................................ 42 Figure 10.7 Spill performance for 100 year rainfall series for Y/D 0.91 ................................ 43 Figure 10.8 Spill performance for 100 year rainfall series for Y/D 0.65, 0.73, 0.81, 0.91 ..... 43 Figure 10.9 Proportion of events with 1mm or more of rainfall spilling from the
“common pipe” for actual occupancy of 30 properties........................................ 44 Figure 10.10 54 events larger than 40mm: retained and stored depth for each event for
actual occupancy of 31 properties........................................................................ 45 Figure 10.11 Actual occupancy of 7 properties, with Y/D >0.95 for 54 events larger than
40mm: retained and stored depth for each event ................................................. 46 Figure 10.12 Actual occupancy of 24 properties, with Y/D <0.95 for 54 events larger than
40mm: retained and stored depth for each event ................................................. 46 Figure 10.13 Proportion of events with 1mm or more of rainfall spilling from the
aggregate tank serving all properties with Y/D ratio <0.95 ................................. 48 Figure 10.14 54 events larger than 40mm: retained and stored depth for each event for
aggregate tank designed to retain 60mm rainfall ................................................. 48 Figure 11.1 Results of the statistical analysis for assessing non-compliance of properties
provided with rainwater harvesting tanks at the pilot site for 2, 3 and 4 bedroom properties .............................................................................................. 50
Appendices Appendix A Gerolin and Kellagher methodology Appendix B Discussion on design considerations Appendix C Rainfall maps Appendix D Yield over Demand probability calculation Appendix E Active management of rainwater harvesting systems – an overview
Contents continued

Stormwater Management using Rainwater Harvesting Testing the Kellagher / Gerolin methodology on a pilot study
SR 736 1 R. 2.0
1. Objectives
The aim of this research project is to: Demonstrate that rainwater harvesting systems have stormwater control capability; Test a proposed method for sizing of tanks to achieve a specific level of
stormwater control; and To select the most appropriate design parameters to be used and examine the
uncertainties associated with them. The work is based on a pilot study catchment of a typical modern residential development in Banbury. This study takes place in the context of the current ambivalent position where there is an interim methodology proposed in BS8515 (2009) [3] for using rainwater harvesting for stormwater control, but with the Environment Agency currently taking the position that rainwater harvesting cannot be presumed to provide stormwater management benefits when designing drainage systems. This work is particularly relevant at this time in the light of current developments on the production of the SuDS Standards [29] and revisions to the Code for Sustainable Homes (2010) [2]. This study aims to resolve the current uncertainty in the water industry with regards to the ability of rainwater harvesting to be designed to control runoff from flood events. This project tests the proposed methodology developed by Gerolin and Kellagher (2009) [8] for sizing rainwater harvesting tanks designed to control stormwater runoff. This report draws heavily on an MSc report from a study carried out at Coventry University by David Inch (2010) [12] which was carried out in close cooperation with, and assistance from, HR Wallingford. Future investigations in this topic area are needed to progress aspects such as the use of green roofs with rainwater harvesting, designing for industrial and commercial buildings, and quantifying benefits in reducing CSO spills for improving the quality of receiving waters.
2. Project context
This section is provided to give an over-view of the potential role rainwater harvesting can play in drainage systems, and the issues associated with trying to design rainwater harvesting to meet specific stormwater control objectives.
2.1 WHY IS RAINFALL HARVESTING POTENTIALLY SO USEFUL?
Rainwater harvesting has been used by mankind throughout history until dependency on this method of collecting water was removed by the development of reliable potable water supply systems. Its current use is largely based on the opportunity for minimising demand on the water supply system where fresh water is a scarce resource.

Stormwater Management using Rainwater Harvesting Testing the Kellagher / Gerolin methodology on a pilot study
SR 736 2 R. 2.0
Benefits associated with stormwater runoff control are thought to exist, but there is no agreed basis for estimating or designing for this. However the growing emphasis on reducing the volume of stormwater runoff to protect those downstream from flooding as a result of extreme rainfall has focused greater attention on the potential for rainwater harvesting to assist in providing this benefit. In addition, the reduction in volume of polluted runoff and reduction in spills from CSOs from many rainfall events will have significant benefits in reducing stress on receiving streams and rivers.
Figure 2.1 The benefits of rainwater harvesting
Current rules on stormwater management include two principal hydraulic criteria; the control of the peak flow rate of discharge from a site, and control of the runoff volume. Any reduction in runoff volume into a peak flow control system will result in a reduction in the size of the attenuation system. However it is the volume control criterion that is often the most onerous to achieve, as it is difficult to reduce the runoff volume from a site unless extensive use of infiltration is possible. Rainwater harvesting is effectively the only other method of reducing runoff volume. Proving that rainwater harvesting will retain sufficient stormwater during an extreme event is therefore the critical and unanswered question which this study addresses. The volume of runoff to be stored depends on the benefits being sought. However as house roof areas are generally only around a third or less of the paved surface area in an urban conurbation, the amount of runoff stored should be reasonably large to make a significant impact on total volumes of runoff from a drainage system.

Stormwater Management using Rainwater Harvesting Testing the Kellagher / Gerolin methodology on a pilot study
SR 736 3 R. 2.0
An important distinction to note is that rainwater harvesting design depths is not a function of return period. As demand is small but continuous, the concept of critical duration does not apply. Therefore a 60mm storm (which is the design event depth chosen by this study) is equivalent to a 100 year 6 hour storm, but only of the order of a 20 year return period for a 24 hour event. It is probably also worth noting that in the context of urban flooding, critical duration flooding events are of the order of 1 hour to 3 hours for the 100 year event, and therefore smaller design event depths could still provide effective reduction of flooding risk if retrofit rainwater harvesting was applied widely in cities.
2.2 THE CURRENT RESEARCH SITUATION
Work on sizing of rainwater harvesting storage systems for water supply reasons has been addressed as long ago as the 70’s. More recently, investigations by researchers world-wide on the stormwater management benefits of rainwater harvesting have resulted in mixed conclusions. However Kellagher has carried out work under the WaND EPSRC research study, Kellagher and Udale Clarke, (2008) [9], Kellagher and Maniero (2005) [10] and research by HR Wallingford Gerolin and Kellagher (2009) [1] [8] has demonstrated that benefits can be achieved by suitably designed rainwater harvesting systems. There seems to be minimal guidance internationally on designing rainwater harvesting tanks for purposes other than water saving. This report is aimed at providing the necessary proof to show the water industry the benefits of rainwater harvesting and that it can be designed to provide a specific level of stormwater management for an extreme event of a specific depth.
2.3 THE UNCERTAINTIES ASSOCIATED WITH DESIGNING RAINWATER HARVESTING TANKS FOR STORMWATER CONTROL
The water retained in the tank of a rainwater harvesting system is a function of the recharge rate, which is a function of the rainfall events through the year and the contributing surface area, and the demand for the water, which is a function of the water based appliances and the frequency of their use. This is illustrated in the Figure 2.2 with storage tanks ranging from a low Y/D ratio which shows significant spare storage available for most of the time, to a high Y/D value where there is virtually no storage at any time.

Stormwater Management using Rainwater Harvesting Testing the Kellagher / Gerolin methodology on a pilot study
SR 736 4 R. 2.0
Figure 2.2 The storage available (shown as depth of rainfall) for 4 rainwater harvesting systems with Y/D ratio ranging from 0.4 to 1.9
Where Y/D is lower than 1.0, the spare storage in a rainwater harvesting tank is a function of the volume of stored water and the total volume of the tank. The general characteristic of tanks in being able to store water has been established before this study, (Gerolin and Kellagher 2010) and others. (For the observant reader who has noted that the available storage is greater in July for the Y/D ratio of 0.9, than lower ratios, this is because the tank size designed for a high Y/D ratio is larger to take into account the increased uncertainty of available storage). Where Demand is much greater than the Yield, the water level in the tank tends to be consistently low, and conversely the tank is nearly always full. Where Demand and Yield are very similar rates, the storage ranges widely from nearly full to empty and is more sensitive to the variability in the weather (wet periods and season characteristics) than where Y and D are very dissimilar. This variability in available storage is the reason why it is difficult to design a tank to retain a specific storm depth. In terms of uncertainty in Yield, other than the random nature of rainfall events in size and frequency, unless the collection surface is unusual (say a green roof) the amount of runoff can be calculated relatively accurately as the roof area, or the proportion used for collection, is easily established. However there is generally much greater uncertainty associated with Demand. The use of rainwater for internal domestic application is normally limited to toilet flushing and washing machines to limit health risks. The water use is therefore a function of the number of people in a property and their habits along with the hydraulic characteristics of the appliances used. Unfortunately appliance water use varies significantly with products and standards are changing all the time. Similarly the number of people in a house will also vary. At the time of the design of a house (or when retrofitting a house with a rainwater harvesting system), the only long term near-certainty is the number of rooms that might be considered to be bedrooms.

Stormwater Management using Rainwater Harvesting Testing the Kellagher / Gerolin methodology on a pilot study
SR 736 5 R. 2.0
This study has made considerable efforts to understand the uncertainties associated with both population characteristics associated with house occupancy and also the use of water by appliances. This is covered in some detail later in the report. It has not however looked into the effects of holidays, week-ends and other issues which also affect demand for short periods of time. It should be noted that two main presumptions have been made; firstly that Demand does not take into account external use such as gardening and car washing, and secondly that the tank is not emptied by any other mechanism than the domestic demands made on the water in the tank. The first assumption is clearly a very conservative one in that any use of water in the garden and for the car would increase the demand considerably thus providing more space for storing an extreme event. However there is no logical basis for estimating these volumes and taking them into consideration as the demand will be both intermittent and vary greatly depending on people’s habits. The second assumption is needed as the storage management of a tank emptied by some decision rule (pumping out onto the ground, surface water system or foul system during or after an event) is yet to be used widely. This is briefly explored in appendix E, but there is obviously considerable potential merit in using active control systems. What would need to be achieved is an emptying process which takes place in dry weather, at least 24 hours before or after rainfall. This would ensure storage would be available for a specific design event and have no additional impact on any flooding that might be occurring downstream. This approach could probably be applied relatively simply though it would be useful to carry out a study to test the details of this approach. If Y/D is greater than 1.0 then the emptying process would occur quite frequently, but the tanks could still be used for managing stormwater runoff.
3. The Kellagher/ Gerolin methodology
The design methodology proposed and tested in this study is appended in full in appendix A of this report. Figure 3.1 provides an overview of the design process. A comparison of typical tank storage volumes between this methodology and the interim method in BS8515 (2009) [3] is also provided in this section. In general the results are similar, though for Y/D values greater than 0.75, the BS8515 methodology calculates significantly less storage.

Stormwater Management using Rainwater Harvesting Testing the Kellagher / Gerolin methodology on a pilot study
SR 736 6 R. 2.0
Figure 3.1 Flow chart for sizing of rainwater harvesting tanks for stormwater control
Stage 1 of the procedure is to carry out a calculation of the annual Demand and annual Yield of the rainwater harvesting system. This is relatively simple as information on annual rainfall, contributing roof area and number of bedrooms is easily established. A decision is required as to whether only toilet flushing is to be used or also to include washing machines. However it should be noted that a conclusion of this report is that the use of washing machines is likely to be essential if the Y/D ratio is to be less than 0.95 for most properties. If the calculation does not achieve this criterion, then the use of rainwater harvesting for stormwater control is not viable and should not be considered. The information for assessing annual Yield and Demand is detailed later in this report. Stage 2 is to decide on a design rainfall depth which is to be retained in the tank. At present a drainage design criterion on volume control is that runoff from the site after development should be no greater than the 100 year 6 hour event prior to development. This is therefore a function of the rainfall depth and soil characteristics and the extent of the paved area being positively drained. The 100 year 6 hour rainfall depth across much of the UK is of the order of 60mm. If all the runoff is retained from roof runoff, and around 30% of hard surfaces in a development are roofs, this would, in some cases, probably result in total site runoff complying with this criterion, or go a long way to

Stormwater Management using Rainwater Harvesting Testing the Kellagher / Gerolin methodology on a pilot study
SR 736 7 R. 2.0
meeting it. In addition, any attenuation storage volume required on the site will be significantly reduced. Appendix B provides a figure of the rainfall depths for UK for the 100 year 6 hour rainfall event along with annual rainfall depths across the country. Stage 3 is calculation of the parameter values the storage volume equation. These are all related to the Y/D ratio. There are three parameters which need to be obtained. These are: CS Ad CP50 CS: is the coefficient related to the proportion of effective storage volume of a 1m3 tank CP50: is the proportion of effective storage for additional tank storage provided Ad: is an additional storage allowance to address the uncertainty associated with the variability of the available storage volume. Each of these parameters result in more storage being required as the ratio of Y/D tends towards 0.95. Figure 3.2 provides a summary of storage volumes of tanks comparing this method with BS8515 for a range of Y/D factors. This information shows that BS8515 does not provide sufficient storage for high Y/D ratios though at around 0.6 the provision is the same.
Tank Volumes by Different Methods
0
2
4
6
8
10
12
0.55 0.65 0.75 0.85 0.95
Y/D
Ta
nk
Vo
lum
e (
m3
)
2 Bedrooms_Gerolin Kellagher
3 Bedrooms_Gerolin Kellagher
4 Bedrooms_Gerolin Kellagher
2 Bedrooms_BS8515 Stormw ater
3 Bedrooms_BS8515 Stormw ater
4 Bedrooms_BS8515 Stormw ater
2 Bedrooms_BS8515 Water Saving
3 Bedrooms_BS8515 Water Saving
4 Bedrooms_BS8515 Water Saving
Figure 3.2 Storage tank sizes as a function of Y/D for both Gerolin and Kellagher and BS8515 (2009)

Stormwater Management using Rainwater Harvesting Testing the Kellagher / Gerolin methodology on a pilot study
SR 736 8 R. 2.0
4. Project overview
The study was scoped to address a number of issues for which there is no information currently. These were: 1. Does rainwater harvesting provide an opportunity to reduce stormwater runoff
volume from extreme storm events? 2. Is the proposed tank sizing methodology effective in storing the design storm
runoff volume? 3. If this is shown to be possible, how should the size of the rainwater harvesting
tanks be taken into account in the design of drainage systems? To answer these questions a pilot study based on a real site using a realistic continuous rainfall series is necessary. The project therefore involved: Investigation of the uncertainties associated with estimating the Demand (non-
potable water consumption). This needed to address both house occupancy and water consumption of appliances (toilets and washing machines).
Building a detailed drainage model of the pilot site to test the formula developed by Gerolin. This needed to include information on roof area, occupancy and numbers of bedrooms.
Development of a suitable rainfall series and demonstration of its adequacy in reflecting real rainfall characteristics for the pilot site.
The MSc on rainwater harvesting which was carried out by David Inch (2009) [12] to support HR Wallingford’s investigations into stormwater control included: Data collection from Waterwise [20] and Ofwat [21] and others to obtain statistics
on water consumption figures, and in particular water use by the two types of appliances.
The selection of a suitable pilot site (part of a new housing estate) in Banbury and obtaining information on the properties from the developer as well as carrying out surveys on the estate to collect house occupancy information.
Collection of statistical data on housing occupancy from census information, local authority and other data.
The InfoWorks CS models of the drainage systems represented every house and road explicitly. The sizing of the storage and their representation based on the method derived by Gerolin was carried out for every property, with roof areas and other paved surfaces estimated by area take-off using a GIS tool and Google Earth. The design rainfall depth was selected as being 60mm. This is probably as high a value as would be realistically stored on domestic property curtilages. It also probably provides the most demanding test of the procedure. Smaller rainfall depths could have been chosen, but to make a significant difference on the volume of runoff from sites, it is felt that storage of this magnitude would often be required.

Stormwater Management using Rainwater Harvesting Testing the Kellagher / Gerolin methodology on a pilot study
SR 736 9 R. 2.0
5. Demand related data
This chapter details information on data associated with the calculation of demand. More information can be obtained from Inch (2010) [12]. Demand is a function of house occupancy and usage of toilets and washing machines. This chapter summarises this information.
5.1 HOUSE OCCUPANCY – COUNTY AND NATIONAL
Individual house occupancy varies all the time and therefore the reasonable presumption that water usage is closely linked to occupancy clearly poses a difficulty in assessing the demand. As rainwater harvesting tanks cannot be modified in size every time there is a change in the tenancy of a house, and at the time of construction the number of people in a dwelling is usually not known. Design rules therefore need to be linked to surrogate parameters and the implications of the variation in occupancy needs to be taken into account. Therefore although there is probably a close relationship between water consumed by a household and the occupancy level, using an approach based on knowing household occupancy is not suitable for designing rainwater harvesting tanks. This means that occupancy levels need to be estimated using a surrogate measure. The parameter which is unlikely to change significantly and which has a measured relationship with occupancy is the number of bedrooms in a house. This study has therefore collected regional information on occupancy as a function of dwelling type. Although this parameter will therefore not provide the actual occupancy in any one house, it does provide a useful way of establishing the average consumption from a number of dwellings. As every house will actually not have this average population in it (as it is not a whole number), the demand will either be less or more, resulting in a different system performance than designed for; either better or worse in terms of stormwater retention. Measuring the consequences of using the mean occupancy rate (by comparing with actual dwelling occupancy) was therefore a crucial element of this study. Oxfordshire County Council commissioned a survey of housing occupancy across the County and its District Council regions (OCC, 2009) [22], which provided information on occupancy as a function of the number of bedrooms in the property. This information was broken down into a number of categories, but these could be subdivided into two main groups: those in the private sector (owned outright, owned with mortgage or loan, rented
out by a private landlord); and the public sector (rented from local authorities, housing associations, registered
landlords). This latter category tends to have significantly higher occupancy, but constitutes a relatively small fraction of the housing stock (OCC, 2009) [22]. Ignoring this public sector element is “safe” in that their higher occupancy rates will result in greater demand (and therefore more storage being available) and it was felt that design of rainwater harvesting should be aimed at the larger private sector. Table 5.1 summarises the occupancy rates for the private market housing within Cherwell District, which includes the study location at Hanwell (the pilot study site at Banbury).

Stormwater Management using Rainwater Harvesting Testing the Kellagher / Gerolin methodology on a pilot study
SR 736 10 R. 2.0
Table 5.1 Summary of occupancy rates for new market housing in Cherwell District, Oxfordshire. Source: OCC (2009)
Number of bedrooms in the property
0 1 2 3 4 5 6 7 8 Overall
Cherwell District Properties sample size 2 70 192 217 128 67 14 0 0 690 Number of occupants 2 99 334 523 386 207 65 - - 1616 mean occupancy 1.00 1.41 1.74 2.41 3.02 3.09 4.64 - - 2.34
The mean occupancy values for Cherwell were selected for the tank sizing calculations for the pilot study. Data was also obtained from supplementary information the same source (OCC 2009) [22], and used to calculate both the mean and standard deviations for each category. Analysis of these values is reported in Table 5.2, for Cherwell District and for the whole of Oxfordshire. The supplementary data was not supplied in the same format as the data shown in Table 5.1.
Table 5.2 Summary of occupancy rates for new market housing in (i) Cherwell District and (ii) Oxfordshire County. Source: OCC (2009)
Number of bedrooms in the property
0 1 2 3 4 ≥5 Overall
Cherwell District Properties sample size
3 84 210 243 145 87 772
Number of occupants 3 118 362 579 431 295 1788 Mean occupancy 1.00 1.40 1.72 2.38 2.97 3.39 2.32 Standard deviation 0.00 0.58 0.66 0.97 1.12 1.24 0.92 Oxfordshire Properties sample size 28 514 1191 1044 809 311 3897 Number of occupants 31 716 2069 2453 2443 1138 8850 Mean occupancy 1.11 1.39 1.74 2.35 3.02 3.66 2.27 Standard deviation 0.42 0.56 0.73 1.02 1.17 1.32 0.95
Comparison of the mean and standard deviation for each dwelling size indicates that the Cherwell characteristics are virtually replicated across the County. Occupancy data in terms of occupants per household which is also available by the number of bedrooms at the national scale has been obtained ONS (2004) [23] and Figure 5.1 shows that the pattern of the proportion of occupants by household size is very similar when comparing Cherwell with South East England and England as a whole.

Stormwater Management using Rainwater Harvesting Testing the Kellagher / Gerolin methodology on a pilot study
SR 736 11 R. 2.0
Figure 5.1 Number of occupants by number of households; Cherwell, SE England, England

Stormwater Management using Rainwater Harvesting Testing the Kellagher / Gerolin methodology on a pilot study
SR 736 12 R. 2.0
Table 5.3 summarises occupancy by bedrooms for England. This provides further comparison with the Cherwell and Oxfordshire data. It can be seen that occupancy at each of the three scales have similar mean values. This suggests that using this measure for assessing occupancy is fairly robust.
Table 5.3 Occupancy by accommodation type and number of bedrooms, England 2004-2007. Source: DCLG (2007) [24]
Type of accommodation and number of bedrooms Mean household size
All types of accommodation One bedroom 1.3 Two bedrooms 1.9 Three bedrooms 2.6 Four or more bedrooms 3.2
Overall mean 2.4
5.2 HOUSE OCCUPANCY – HANWELL PILOT STUDY
An occupancy survey was conducted at the Hanwell study estate. This was carried out to check on the statistical information obtained, and also to produce an actual occupancy model to assess the implications of designing rainwater harvesting systems to the regional average occupancy levels. All 66 houses were supplied with a brief questionnaire asking for the number of people normally living at the address. The response rate was good, with 34 houses supplying data (over 50% return rate), but sample sizes for some house types were small and some property categories were not represented at all. Table 5.4 summarises the survey results.
Table 5.4 Summary of occupancy rates for housing in Hanwell
Number of bedrooms in the property
1 2 3 4 Overall
Hanwell Fields Phase 2a survey Properties sample size 0 9 21 4 34 Number of occupants - 16 53 13 82
mean occupancy - 1.78 2.52 3.25 2.41 Standard deviation - 0.44 1.12 1.26 0.98
Comparing this data with Table 5.1 shows surprisingly good similarity between the survey population data and the published values for Cherwell and Oxfordshire in spite of the small sample.
5.3 APPLIANCE WATER CONSUMPTION
Water consumption is the other half of the demand equation. The per capita consumption varies a little across the country and this is often broken down by category as shown in Figure 5.2.

Stormwater Management using Rainwater Harvesting Testing the Kellagher / Gerolin methodology on a pilot study
SR 736 13 R. 2.0
Figure 5.2 breakdown of domestic consumption by water use (Waterwise 2010) [20]
However it is important to take into account the current trends in water consumption that are taking place. From pressure being exerted by the Environment Agency, water consumption is being squeezed resulting in this distribution of water use changing as well as the total overall demand being reduced. The traditional distribution of water use for toilets and washing machines in Figure 5.2 is significantly different from what was established in this study. Ofwat collects annual industry statistics from each UK Water Company including estimates of daily water usage per person (Ofwat, 2010) [21]. Table 5.5 shows the results reported by Thames Water, the authority covering the Hanwell location, and other UK Water Authorities.

Stormwater Management using Rainwater Harvesting Testing the Kellagher / Gerolin methodology on a pilot study
SR 736 14 R. 2.0
Table 5.5 Daily consumption estimates from Thames Water and others. (Ofwat, 2010)
Consumption unmetered households litres/person/day
Consumption metered households litres/person/day Supplier
2002 2006 2007 2008 Mean 2002 2006 2007 2008 MeanB’mouth Hants 167 155 156 156 159 137 150 153 154 149 Bristol 154 161 158 159 158 134 129 125 123 128 Cambridge 149 149 143 146 147 133 134 130 128 131 Dee Valley 155 165 155 157 158 119 115 111 114 115 Essex & Suffolk 159 160 163 163 161 142 145 143 147 144 Folk’stn Dover 160 150 162 169 160 154 131 140 135 140 Northumbrian 146 151 147 142 147 128 140 129 129 132 Portsmouth 157 163 162 165 161 177 136 132 128 143 Severn Trent 129 146 141 135 138 132 117 115 112 119 South East 167 157 172 177 168 165 143 143 158 152 South Staffs 147 151 148 141 147 138 126 127 125 129 South West 159 164 154 152 157 138 139 131 127 134 Southern 162 149 154 149 154 148 136 138 137 140 Sutton E Surrey 176 166 164 170 169 145 130 139 137 138 TendringHun’d 140 131 128 132 133 116 114 111 113 113 Thames 165 157 158 163 160 149 143 144 142 144 Three Valleys 178 177 175 175 176 156 143 153 142 149 United Utilities 149 144 144 143 145 128 122 116 112 119 Welsh 151 157 156 160 156 140 127 123 124 129 Wessex 147 154 149 148 149 129 138 136 136 135 Yorkshire 146 152 150 148 149 137 136 133 114 130 Mean all suppliers 155 155 154 155 140 133 132 130
Industry Mean(all unmetered data)
155 Industry Mean
(all metered data) 134
Standard deviation 11.0 Standard deviation 13.1 The data shows a lower consumption where customers are supplied with a water meter. However it is interesting to note that in spite of pressure to reduce water consumption, this is yet to be reflected strongly in the annual statistics, though the metered volumes are, on average, slowly reducing. The traditional proportion of water consumed in a residential property that is attributed to toilet flushing is 30% and figures of around 15% or slightly less for washing machine use (Waterwise, 2010). However there has been a dramatic change in the design of toilets in the last decade with flushes of around 9 litres used in the past now reduced to around 4 litres in the major flush of dual flush toilets with the minor flush being even less at around 2.6 litres. As rainwater harvesting use is likely to be dominated by new build developments, the assumption of using 30% of existing consumption rates for toilets cannot be used for assessing the size of rainwater harvesting tanks. Although the volumes used in washing machines are also reducing, it is also apparent that their usage is increasing. Therefore the proportion of water consumed has slightly increased.

Stormwater Management using Rainwater Harvesting Testing the Kellagher / Gerolin methodology on a pilot study
SR 736 15 R. 2.0
Therefore an alternative estimate of consumption derived using a bottom-up approach totalling individual appliance operations is required. Rates of use were obtained from the Water Efficiency Calculator (DCLG, 2009) [25]. Volumes per use were established from the Waterwise website (Waterwise, 2010) [20] assuming: Dual-flush WCs Washing machine consumption (based on 278 products available for UK retail in
2007). Table 5.6 shows the derivation of this estimate. This conveniently comes to an approximate figure of 40 litres/person/day for the two appliances, and this has been used in the tank sizing calculations for this project. It is important to recognise that this is a key assumption. A 20% increase or decrease in demand would often make a significant difference in properties to be served with rainwater harvesting systems, and their tank sizes would also be affected.
Table 5.6 Daily non-potable water consumption estimated from appliance use
Per capita consumption Appliance
Consumption rate Mean use per day Consumption per
day l/c/d Toilets (dual flush)
6 litres/full flush 4 litres/part flush
1.46 flushes 2.96 flushes
20.6 litres
Washing machines (mean of 2007 products)
8.5 litre/kg 2.1 kg per day 17.9 litres
Total 38.5 litres Adopted consumption of non-potable water 40 litres/person/day
These consumption figures and usage is based on the most recent appliance data available (frequency of use – Code for Sustainable Homes, and volumes – Waterwise). These documents aim to minimise consumption and hence can be considered as the best estimate for modern houses (and the likely least demand) in terms of assessing the use of rainwater harvesting systems for stormwater runoff management.
5.4 DISCUSSION ON DEMAND FOR RWH DESIGN
From the preceding sections it is clear that each property has a variable population and their water use is also dependent on people’s habits and the design of the appliances in the property. As the only easily measureable parameter is the number of bedrooms, the sizing of tanks, if linked to this, will result in the rainwater harvesting systems actually performing differently to the assumptions that are used in the design. This pilot study had to therefore take into account this uncertainty and measure the implications of this uncertainty.
Stormwater Management using Rainwater Harvesting Testing the Kellagher / Gerolin methodology on a pilot study
SR 736 16 R. 2.0
6. Yield related data – roof areas
As with issues associated with Demand, Yield (from rainfall runoff) related data is equally important. Fortunately the issues are less uncertain, but there are a number of aspects which still add uncertainty. The following sections discuss roof area and related aspects of rainfall runoff, and also rainfall data.
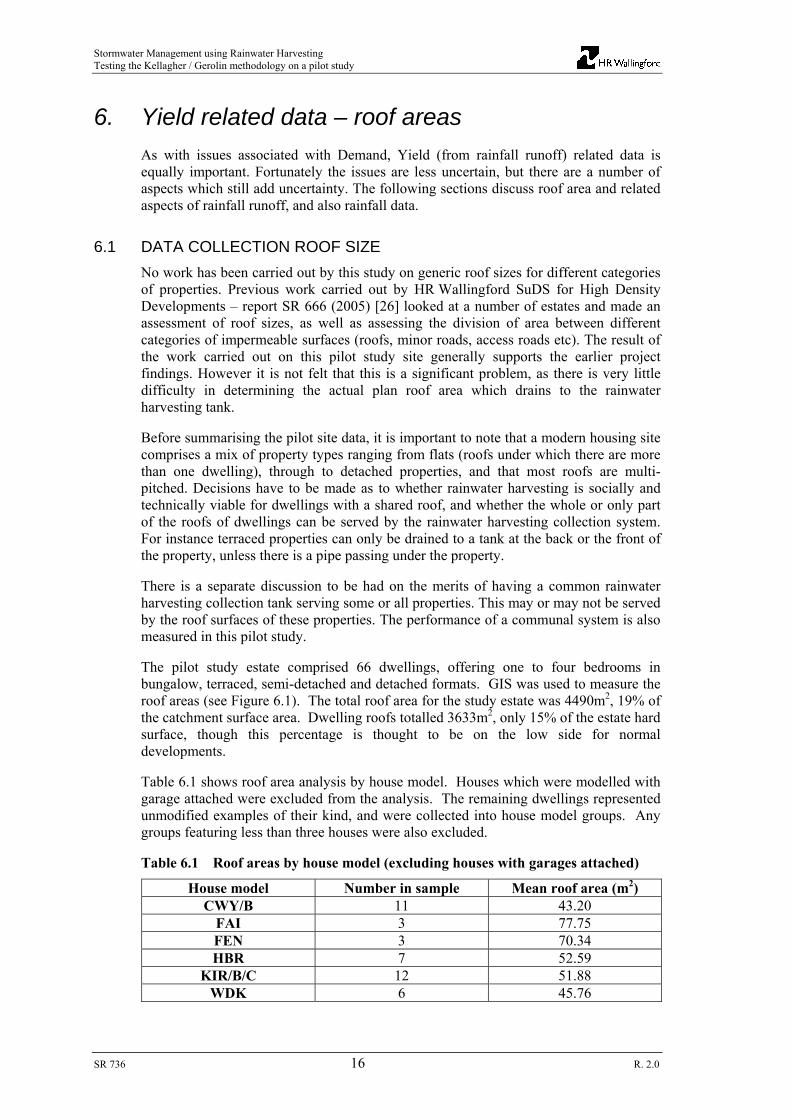
6.1 DATA COLLECTION ROOF SIZE
No work has been carried out by this study on generic roof sizes for different categories of properties. Previous work carried out by HR Wallingford SuDS for High Density Developments – report SR 666 (2005) [26] looked at a number of estates and made an assessment of roof sizes, as well as assessing the division of area between different categories of impermeable surfaces (roofs, minor roads, access roads etc). The result of the work carried out on this pilot study site generally supports the earlier project findings. However it is not felt that this is a significant problem, as there is very little difficulty in determining the actual plan roof area which drains to the rainwater harvesting tank. Before summarising the pilot site data, it is important to note that a modern housing site comprises a mix of property types ranging from flats (roofs under which there are more than one dwelling), through to detached properties, and that most roofs are multi-pitched. Decisions have to be made as to whether rainwater harvesting is socially and technically viable for dwellings with a shared roof, and whether the whole or only part of the roofs of dwellings can be served by the rainwater harvesting collection system. For instance terraced properties can only be drained to a tank at the back or the front of the property, unless there is a pipe passing under the property. There is a separate discussion to be had on the merits of having a common rainwater harvesting collection tank serving some or all properties. This may or may not be served by the roof surfaces of these properties. The performance of a communal system is also measured in this pilot study. The pilot study estate comprised 66 dwellings, offering one to four bedrooms in bungalow, terraced, semi-detached and detached formats. GIS was used to measure the roof areas (see Figure 6.1). The total roof area for the study estate was 4490m2, 19% of the catchment surface area. Dwelling roofs totalled 3633m2, only 15% of the estate hard surface, though this percentage is thought to be on the low side for normal developments. Table 6.1 shows roof area analysis by house model. Houses which were modelled with garage attached were excluded from the analysis. The remaining dwellings represented unmodified examples of their kind, and were collected into house model groups. Any groups featuring less than three houses were also excluded. Table 6.1 Roof areas by house model (excluding houses with garages attached)
House model Number in sample Mean roof area (m2) CWY/B 11 43.20
FAI 3 77.75 FEN 3 70.34 HBR 7 52.59
KIR/B/C 12 51.88 WDK 6 45.76

Stormwater Management using Rainwater Harvesting Testing the Kellagher / Gerolin methodology on a pilot study
SR 736 17 R. 2.0
A similar approach was used to analyse the properties by number of bedrooms, to examine the reliability of this parameter as a predictor of roof area. However this is rather academic as the actual roof area is easily determined and therefore this information is more important in evaluating which types of properties are most likely to be suited to the use of rainwater harvesting based on the Y/D ratio. Five 1- and 2-bedroom dwellings were unusual because they occupied only one floor (bungalow or flat-over-garage formats) which led to disproportionately large roof areas. The data with single floor dwellings were therefore excluded from the analysis. Large standard deviations indicated that the roof areas within each bedroom group were highly varied. The standard deviation decreased with increasing numbers of bedrooms.
Table 6.2 Roof areas by number of bedrooms (houses with garages attached and single floor dwellings have been excluded)
House bed
rooms
Number in sample
Mean roof area (m2)
Mean roof area /
bedroom (m2)
Mean roof area /
person* (m2)
Roof area standard
deviation SD 1 bed 0 2 bed 8 42.04 21.0 24.2 6.91 3 bed 32 49.70 16.6 20.6 6.19 4 bed 6 74.04 18.5 24.5 4.10
* The occupancy rate is based on Table 5.1 – Cherwell District data Although there is no trend, this result is not unexpected with 3 bedroom properties having the least roof area per person, suggesting that these provide the lowest Y/D ratio. Fortunately three bedroom dwellings tend to be the most common type built in residential estates. Finally, the approach was applied to houses grouped by house category, to test whether roof area could be reliably estimated by style of house (Table 6.3). The correlation between house category and roof area was poor. However from the figures it can be seen that detached houses tend to be 4 bedrooms or more, and that semi-detached houses were usually three bedrooms.
Table 6.3 Roof areas by house format (houses with garages attached)
House format No. in sample
Mean roof area (m2)
Roof area standard deviation SD
95% confidence interval ±1.96SD
(m2) % of mean Flat-over-garages 3 71.98 11.95 ±23.42 ±32.5%
Terraced 8 41.74 6.72 ±13.17 ±31.6% Semi-detached 31 48.33 4.36 ±8.54 ±17.7%
Detached 10 67.43 11.05 ±21.66 ±32.1% A degree of caution needs to be taken in assuming these results provide good generic information as it is only a small sample from one estate. However it is worth noting that economic pressures along with government rules on housing density and technical rules on various aspects of residential development (roads, drainage, etc) will tend to result in many estates being fairly similar in their characteristics.

Stormwater Management using Rainwater Harvesting Testing the Kellagher / Gerolin methodology on a pilot study
SR 736 18 R. 2.0
7. Yield related data - rainfall
Five minute rainfall data for 10 years for Elmdon (Birmingham) was obtained from the Met Office. This is around 30 miles from Banbury, but is likely to be fairly representative of the local weather. A stochastic 100 year series was generated from this data using the tool TSRsim produced by Imperial College and HR Wallingford. Production and analysis of this 100 year series was carried out in the Audacious project (HR 2005) [14]. This analysis is necessary to demonstrate that the stochastic rainfall series is representative of the real rainfall at the pilot site area.
7.1 RAINFALL ANALYSIS
The uncertainty of the Yield is less of an issue than assessing the Demand. The roof areas are known and the characteristics of the rainfall have been analysed for their accuracy against FEH and long term rainfall data. It is important to note that the extreme rainfall characteristics are important at both the daily scale (as these reflect the design criterion), but also the seasonal characteristics, as the state of the storage is related to the size of tank and the continuous demand. The monthly rainfall mean depth and its variability is therefore an important aspect to consider. The rainfall series used is a stochastically generated series and therefore its characteristics needs to be evaluated against FEH predictions at the site and also the observed data from which it was generated and other local sources to check that it is representative of rainfall for that area. Its annual and seasonal variability is also important to evaluate to check the variability of rainfall through the year. The data resolution was 5 minutes intervals. For the analysis, events were defined by selecting all rainfall events of any depth which were separated by a dry period of more than 6 hours. A detailed analysis of the capability of the tool (TSRsim) and the series accuracy was carried out HR Wallingford (2005) [14]. This showed that it was very effective in producing an extreme series from only a 10 year data set. Relevant abstracts from this report are included here along with some additional analysis. In summary this section on rainfall analysis looks at: The number of events for a range of rainfall depths; The season in which extreme rainfall events tend to occur; Extreme value analysis based on 6 and 24 hour duration; Comparison of extreme value analysis with FEH and FSR and the observed data
set; The variability of annual, seasonal and monthly rainfall depths. The first 3 bullets are associated with showing the accuracy of the tool in producing extreme rainfall which is the critical feature for proving the methodology’s effectiveness. The last two bullets are associated with showing that longer term rainfall characteristics (rather than the individual events) are in accordance with observed rainfall, as the performance of rainwater harvesting tanks is related to periods measured in weeks due to the continuous nature of domestic water use.

Stormwater Management using Rainwater Harvesting Testing the Kellagher / Gerolin methodology on a pilot study
SR 736 19 R. 2.0
7.2 EVENT EXTREME VALUE ANALYSIS
An analysis was carried out of 6 and 24 hour rainfall events for this series. These events were found and ranked and then assessed using a Gringorten extreme value analysis.
120
440
.N
.r)X(P
(1)
where r is the rank of X and N is the total number of data values. To do so, the maximum values for each year (or season) and each storm duration were found and ranked. Having P(X) the return period T(X) was calculated as follows:
)(
1)(
XPXT (2)
Figure 7.1 provides a plot of events for the 6 hour series and Figure 7.2 gives the same information for the 24 hour depth. These figures from SR475 (HR 2005) [14] provide this information both annually and seasonally. The seasons are not the same as the standard Met Office seasons, in that this analysis has been based on winter being January through to March, rather than December to February. Figures 7.3 and 7.4 provide the same information for the observed data. Figures 7.5 and 7.6 provide the same annual information along with a comparison with both FSR and FEH for the gauge location. (The additional data on RainClim and future climate plots should be ignored). The following points can be seen from this information. 1. Annual Series accuracy: The stochastic series predicts slightly greater rainfall
depths compared to FEH and FSR rainfall depths (Figures 7.5 and 7.6), but it should also be noted that the observed data also gives greater depths and that the generated series is representative of the observed series.
2. Seasonal rainfall accuracy: It can be seen (Figures 7.1 – 7.4) that the series based on 6 hour events is dominated by summer events and this is still the case, but less so, for the 24 hour events. This does reflect the same characteristics of the observed data and indicates that the series can be assumed to reflect the characteristics of the observed data well.
These results have implications for the analysis of the pilot study results. Firstly there are slightly bigger storms in the series than might be expected in practice over a given period; a conservative basis for the analysis. This means that there are more events that are larger than the design depth being catered for (60mm) than might be expected in the 100 year series. Figure 7.7 provides a summary of the large events in the series – see section 7.3 for more information on this.

Stormwater Management using Rainwater Harvesting Testing the Kellagher / Gerolin methodology on a pilot study
SR 736 20 R. 2.0
Elmdon Present, TSRrain, 6 hour storms
0
20
40
60
80
100
120
1 10 100 1000
T(X) = 1 / P(X)
rain
fall
dep
th (
mm
)
annualspringsummerautumnwinter
Figure 7.1 Stochastic series event analysis by season – 6 hours
Elmdon, TSRrain, 24 hour storms
0
20
40
60
80
100
120
140
1 10 100 1000
T(X) = 1 / P(X)
rain
fall
dep
th (
mm
)
annualspringsummerautumnwinter
Figure 7.2 Stochastic series event analysis by season – 24 hours

Stormwater Management using Rainwater Harvesting Testing the Kellagher / Gerolin methodology on a pilot study
SR 736 21 R. 2.0
Elmdon, observed data, 6 hour storms
0
10
20
30
40
50
60
1 10 100
T(X) = 1 / P(X)
rain
fall
dep
th (
mm
)
annualspringsummerautumnwinter
Figure 7.3 Observed event analysis by season – 6 hours
Elmdon, observed data, 24 hour storms
0
10
20
30
40
50
60
1 10 100
T(X) = 1 / P(X)
rain
fall
dep
th (
mm
)
annualspringsummerautumnwinter
Figure 7.4 Observed event analysis by season – 24 hours

Stormwater Management using Rainwater Harvesting Testing the Kellagher / Gerolin methodology on a pilot study
SR 736 22 R. 2.0
Elmdon, 6 hour storms
0
20
40
60
80
100
120
1 10 100 1000
T(X)
rain
fall
dep
th (
mm
) TSRrain PresentTSRrain FutureRainClim PresentRainClim FutureFEHFSRobserved data
Figure 7.5 Annual Series event analysis comparisons (Observed / stochastic / FEH / FSR) – 6 hours
Elmdon, 24 hour storms
0
20
40
60
80
100
120
140
1 10 100 1000
T(X)
rain
fall
dep
th (
mm
) TSRrain PresentTSRrain FutureRainClim PresentRainClim FutureFEHFSRobserved data
Figure 7.6 Annual Series event analysis comparisons (Observed / stochastic / FEH / FSR) – 24 hours
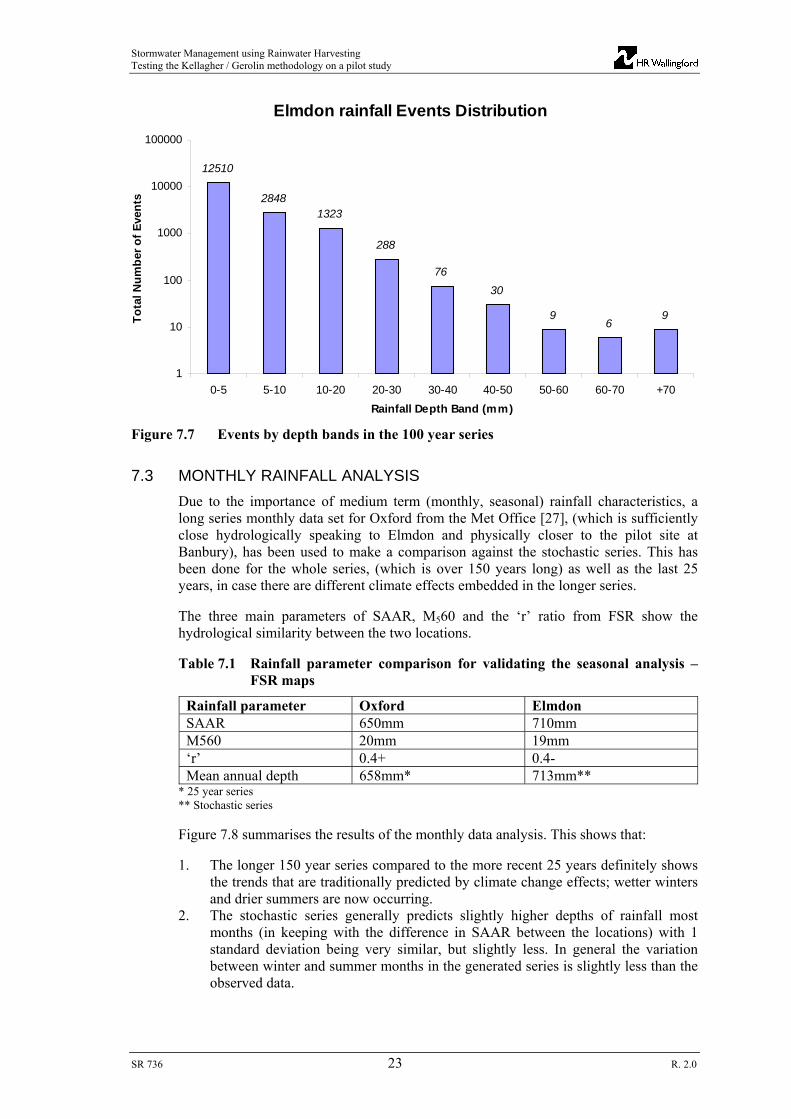
Stormwater Management using Rainwater Harvesting Testing the Kellagher / Gerolin methodology on a pilot study
SR 736 23 R. 2.0
Elmdon rainfall Events Distribution
12510
28481323
288
76
30
96
9
1
10
100
1000
10000
100000
0-5 5-10 10-20 20-30 30-40 40-50 50-60 60-70 +70
Rainfall Depth Band (mm)
To
tal N
um
ber
of
Eve
nts
Figure 7.7 Events by depth bands in the 100 year series
7.3 MONTHLY RAINFALL ANALYSIS
Due to the importance of medium term (monthly, seasonal) rainfall characteristics, a long series monthly data set for Oxford from the Met Office [27], (which is sufficiently close hydrologically speaking to Elmdon and physically closer to the pilot site at Banbury), has been used to make a comparison against the stochastic series. This has been done for the whole series, (which is over 150 years long) as well as the last 25 years, in case there are different climate effects embedded in the longer series. The three main parameters of SAAR, M560 and the ‘r’ ratio from FSR show the hydrological similarity between the two locations. Table 7.1 Rainfall parameter comparison for validating the seasonal analysis –
FSR maps
Rainfall parameter Oxford Elmdon SAAR 650mm 710mm M560 20mm 19mm ‘r’ 0.4+ 0.4- Mean annual depth 658mm* 713mm**
* 25 year series ** Stochastic series Figure 7.8 summarises the results of the monthly data analysis. This shows that: 1. The longer 150 year series compared to the more recent 25 years definitely shows
the trends that are traditionally predicted by climate change effects; wetter winters and drier summers are now occurring.
2. The stochastic series generally predicts slightly higher depths of rainfall most months (in keeping with the difference in SAAR between the locations) with 1 standard deviation being very similar, but slightly less. In general the variation between winter and summer months in the generated series is slightly less than the observed data.

Stormwater Management using Rainwater Harvesting Testing the Kellagher / Gerolin methodology on a pilot study
SR 736 24 R. 2.0
Table 7.2 compares the values of the monthly rainfall depths and the proportion of rain in each month through the year. This last aspect is interesting in that it shows how relatively little variation there is in rainfall depth between months.
Table 7.2 Proportion of annual rainfall depth by month and season for the stochastic series compared to Oxford
Month Observed data
depth (25 years) (mm)
Observed data (25 years) (% proportion of the annual depth)
Series data depth (mm)
Series data (% proportion of the
annual depth) January 56 9 65 9 February 43 6 54 8 March 45 7 48 7 April 45 7 60 8 May 52 8 53 7 June 54 8 58 8 July 59 9 55 8 August 60 9 59 8 September 57 9 53 7 October 67 10 68 10 November 61 9 68 10 December 60 9 71 10 TOTAL 658mm 713mm
0
20
40
60
80
100
120
Jan Feb Mar Apr May Jun Jul Aug Sep Oct Nov Dec
Mea
n m
on
thly
rai
nfa
ll (m
m)
Oxford 1984-2010
Oxford 1853-2010
TSR rainfall
Drop bars are + /- 1 standard deviation
Figure 7.8 Comparison of stochastic series with Oxford for monthly data series for mean and 1 Standard Deviation

Stormwater Management using Rainwater Harvesting Testing the Kellagher / Gerolin methodology on a pilot study
SR 736 25 R. 2.0
7.4 VARIABILITY OF ANNUAL AND SEASONAL RAINFALL DEPTH
To provide more information on the number of years and seasons that would result in potential failure (non-compliance with the Y/D ratio), Figure 7.9 has been produced based on the Oxford monthly series [27]. Each line represents the ratio of rainfall against the mean annual depth or 25% of annual depth for the season curves. First it is interesting to note that the annual rainfall exceedence curve is “flatter” than the seasonal rainfall which reflects that the range of rainfall depths in a season can be much greater than throughout a whole year. Secondly that Summer and Autumn curves are worse (more years when the season rainfall depth is greater than 25% of the annual rainfall depth) than the Annual curve or for Spring and Winter. The figure shows two lines; one for a house based on a Y/D ratio of 0.95 and the other a ratio of 0.7. In the case of 0.95 the annual risk of exceedence is 40% for any year but increases to 50% and 55% for Summer and Autumn respectively. Unfortunately these are the times when river flows are lower and stormwater runoff has greater impact. However in the case of a Y/D ratio of 0.7 the Summer and Autumn only 15% and 20% of years respectively are likely to produce too great a yield for effective stormwater control. The final point to make is that no specific allowance (other than what is already in the methodology) should be made for an unusual season or year. This would effectively mean that one is designing for a more extreme event.
Y/D = 0.95
Y/D = 0.7
0
0.5
1
1.5
2
2.5
0 0.2 0.4 0.6 0.8 1
Proportion of record
Ra
infa
ll e
xce
ed
en
ce r
atio
(n
th y
ea
r / m
ea
n y
ea
r)
DJF
JJA
MAM
SON
Annual
Figure 7.9 Rainfall exceedence – annual and seasonal and impact on Y/D ratio

Stormwater Management using Rainwater Harvesting Testing the Kellagher / Gerolin methodology on a pilot study
SR 736 26 R. 2.0
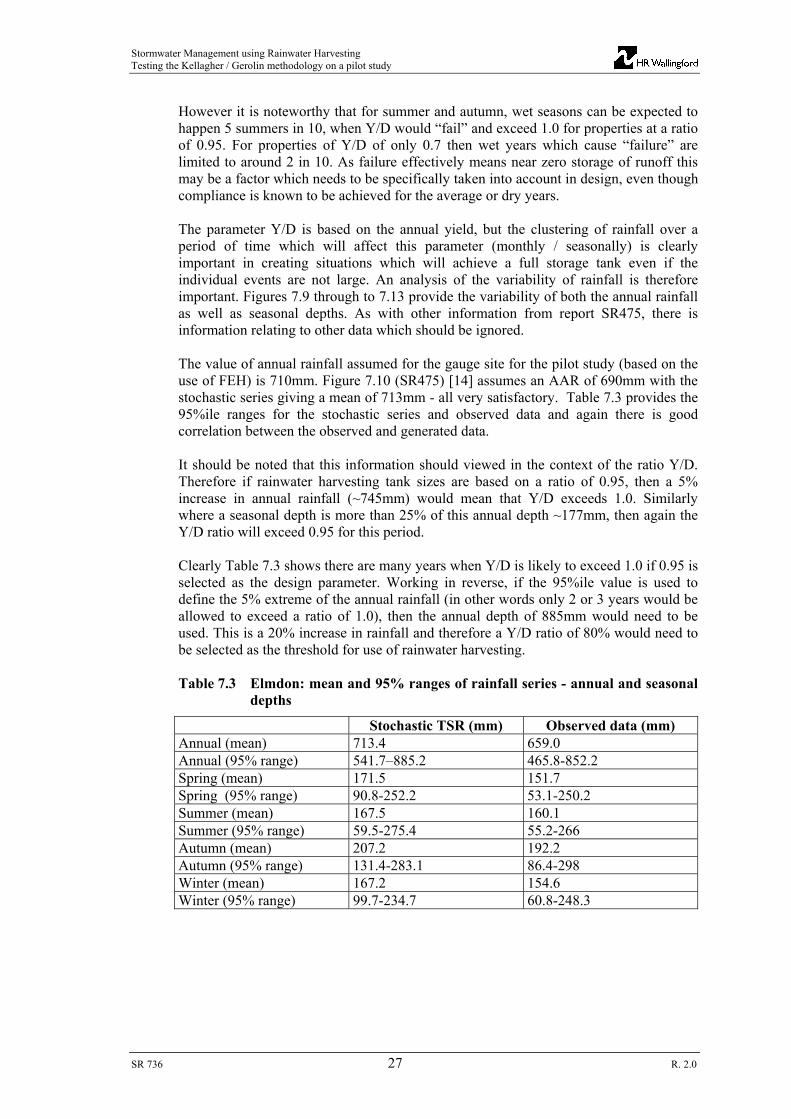
Stormwater Management using Rainwater Harvesting Testing the Kellagher / Gerolin methodology on a pilot study
SR 736 27 R. 2.0
However it is noteworthy that for summer and autumn, wet seasons can be expected to happen 5 summers in 10, when Y/D would “fail” and exceed 1.0 for properties at a ratio of 0.95. For properties of Y/D of only 0.7 then wet years which cause “failure” are limited to around 2 in 10. As failure effectively means near zero storage of runoff this may be a factor which needs to be specifically taken into account in design, even though compliance is known to be achieved for the average or dry years. The parameter Y/D is based on the annual yield, but the clustering of rainfall over a period of time which will affect this parameter (monthly / seasonally) is clearly important in creating situations which will achieve a full storage tank even if the individual events are not large. An analysis of the variability of rainfall is therefore important. Figures 7.9 through to 7.13 provide the variability of both the annual rainfall as well as seasonal depths. As with other information from report SR475, there is information relating to other data which should be ignored. The value of annual rainfall assumed for the gauge site for the pilot study (based on the use of FEH) is 710mm. Figure 7.10 (SR475) [14] assumes an AAR of 690mm with the stochastic series giving a mean of 713mm - all very satisfactory. Table 7.3 provides the 95%ile ranges for the stochastic series and observed data and again there is good correlation between the observed and generated data. It should be noted that this information should viewed in the context of the ratio Y/D. Therefore if rainwater harvesting tank sizes are based on a ratio of 0.95, then a 5% increase in annual rainfall (~745mm) would mean that Y/D exceeds 1.0. Similarly where a seasonal depth is more than 25% of this annual depth ~177mm, then again the Y/D ratio will exceed 0.95 for this period. Clearly Table 7.3 shows there are many years when Y/D is likely to exceed 1.0 if 0.95 is selected as the design parameter. Working in reverse, if the 95%ile value is used to define the 5% extreme of the annual rainfall (in other words only 2 or 3 years would be allowed to exceed a ratio of 1.0), then the annual depth of 885mm would need to be used. This is a 20% increase in rainfall and therefore a Y/D ratio of 80% would need to be selected as the threshold for use of rainwater harvesting. Table 7.3 Elmdon: mean and 95% ranges of rainfall series - annual and seasonal
depths
Stochastic TSR (mm) Observed data (mm) Annual (mean) 713.4 659.0 Annual (95% range) 541.7–885.2 465.8-852.2 Spring (mean) 171.5 151.7 Spring (95% range) 90.8-252.2 53.1-250.2 Summer (mean) 167.5 160.1 Summer (95% range) 59.5-275.4 55.2-266 Autumn (mean) 207.2 192.2 Autumn (95% range) 131.4-283.1 86.4-298 Winter (mean) 167.2 154.6 Winter (95% range) 99.7-234.7 60.8-248.3

Stormwater Management using Rainwater Harvesting Testing the Kellagher / Gerolin methodology on a pilot study
SR 736 28 R. 2.0
Elmdon
0
0.001
0.002
0.003
0.004
0.005
0.006
0 500 1000 1500
annual rainfall (mm)
n-d
istr
ibu
tio
n TSRrain PresentTSRrain FutureRainClim PresentRainClim Futureobserved data
704mm
713mm616mm
661mm
AAR 690mm
659mm
Figure 7.10 Elmdon: Mean Annual rainfall and 95%ile ranges for stochastic series and observed data
Elmdon
0
0.002
0.004
0.006
0.008
0.01
0.012
0 100 200 300
spring rainfall (mm), apr-jun
n-d
istr
ibu
tio
n TSRrain PresentTSRrain FutureRainClim PresentRainClim Futureobserved data
147mm
172mm117mm
150mm 152mm
Figure 7.11 Elmdon: Mean Seasonal rainfall and 95%ile ranges for stochastic series and observed data - Spring
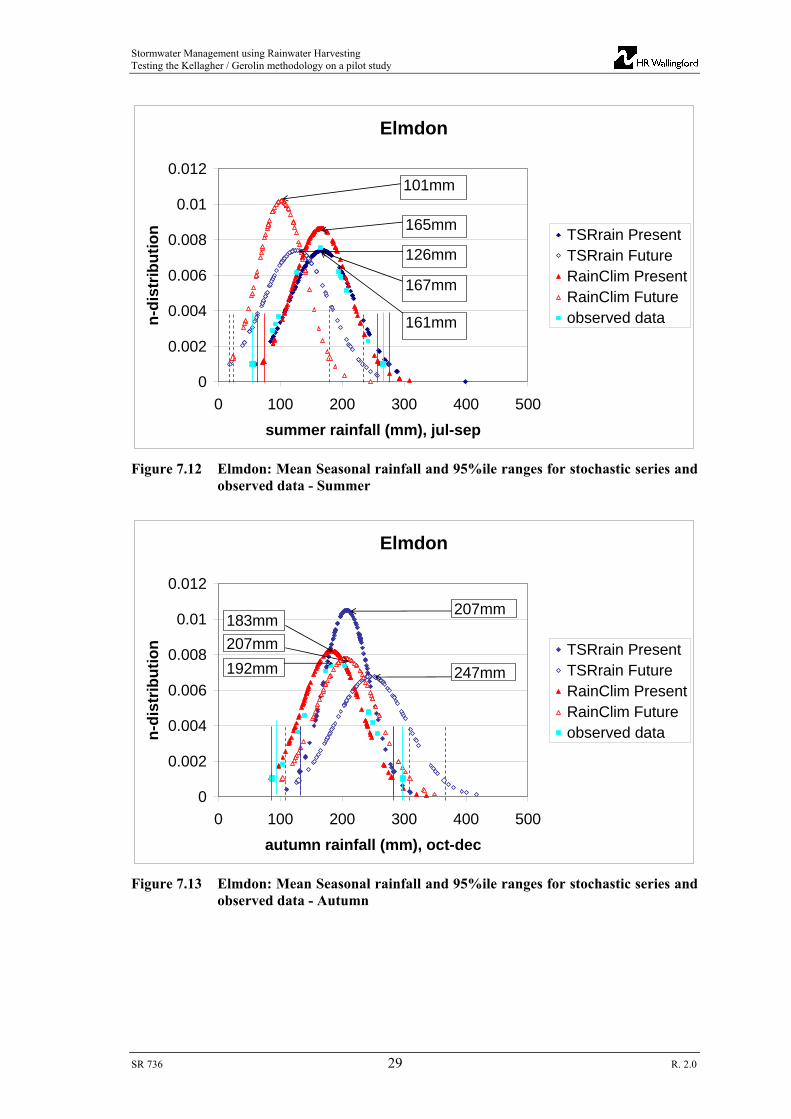
Stormwater Management using Rainwater Harvesting Testing the Kellagher / Gerolin methodology on a pilot study
SR 736 29 R. 2.0
Elmdon
0
0.002
0.004
0.006
0.008
0.01
0.012
0 100 200 300 400 500
summer rainfall (mm), jul-sep
n-d
istr
ibu
tio
n TSRrain PresentTSRrain FutureRainClim PresentRainClim Futureobserved data
165mm
101mm
167mm
126mm
161mm
Figure 7.12 Elmdon: Mean Seasonal rainfall and 95%ile ranges for stochastic series and observed data - Summer
Elmdon
0
0.002
0.004
0.006
0.008
0.01
0.012
0 100 200 300 400 500
autumn rainfall (mm), oct-dec
n-d
istr
ibu
tio
n TSRrain PresentTSRrain FutureRainClim PresentRainClim Futureobserved data
247mm
207mm183mm
207mm
192mm
Figure 7.13 Elmdon: Mean Seasonal rainfall and 95%ile ranges for stochastic series and observed data - Autumn

Stormwater Management using Rainwater Harvesting Testing the Kellagher / Gerolin methodology on a pilot study
SR 736 30 R. 2.0
Elmdon
0
0.002
0.004
0.006
0.008
0.01
0.012
0.014
0 100 200 300 400
winter rainfall (mm), jan-mar
n-d
istr
ibu
tio
n TSRrain PresentTSRrain FutureRainClim PresentRainClim Futureobserved data
184mm
167mm163mm
189mm
155mm
Figure 7.14 Elmdon: Mean Seasonal rainfall and 95%ile ranges for stochastic series and observed data - Winter
7.5 RAINFALL RUNOFF ASSUMPTIONS
In addition to a detailed understanding of rainfall, assumptions of the runoff characteristics also have to be made. In calculating an adjusted annual rainfall depth to take account of initial losses, the following assumptions have been made. The number of rainfall events in a year is of the order of 150, and it is assumed that up to 0.5mm is lost from each event in terms of wetting and evaporation. Therefore of the average 713mm only 638mm is available as runoff before other losses. In addition it is assumed that between the filter losses (10%) and other runoff losses (evaporation / splashing / wind effect – 10%) only 81% of the net rainfall after evaporation is available for storage. Therefore the net annual rainfall is assumed to be only 516mm per year. As for depression storage, the error effect on the runoff fraction for larger events will also have an impact. If one assumes a 10% error on the assumption of 81% this amounts to a total depth of around 60mm. This assumption would appear to be slightly less sensitive than the issue of depression storage, but is still very important for properties which Y/D ratios close to the limit of 0.95.

Stormwater Management using Rainwater Harvesting Testing the Kellagher / Gerolin methodology on a pilot study
SR 736 31 R. 2.0
8. Pilot study – Y/D analysis
Figure 8.1 shows a plan of the pilot study site selected for the project by Inch (2009) [12].
Figure 8.1 Pilot study area for rainwater harvesting analysis – Hanwell Fields
House roofs Garage roofs Roads Gardens etc

Stormwater Management using Rainwater Harvesting Testing the Kellagher / Gerolin methodology on a pilot study
SR 736 32 R. 2.0
The pilot study site comprises 66 properties ranging in roof area size and numbers of bedrooms. Based on the demand characteristics of 40l/c/d (both toilet and washing machine use), and the loss model as described in section 6.3, these properties can be grouped in ranges of Y/D ratios. Table 8.1 provides a summary of the number of properties in suitable range bands of Y/D. The Table is in two parts; firstly Y/D based on the statistical population (as defined in Table 5.1), and secondly based on the actual residential occupancy, though this is based on only a subset of the data for 34 houses. These are useful to use when evaluating the results of the pilot study system performance and also the variability in annual and seasonal rainfall. The use of average occupancy in a bedroom (for example 1.74 people in a 2 bedroom house) requires greater storage than using 2 people (as Y/D is a larger ratio) – which is the most common real occupancy rate. However there will be circumstances where there will only be one person in the property and Y/D will almost certainly be greater than 1.0, resulting in minimal storage for any large storm. The consequence of using average population figures is therefore not obvious, which is why this pilot test is so important to do with both real occupancy data and applying a design method which cannot be based on actual occupancy information. Table 8.1 Y/D ratios for properties in the pilot study area based on statistical and
actual occupancy rates
Properties with statistical population occupancy
(nr)
Properties with actual population occupancy*
(nr) Total number of properties 66 34 (31) Properties with Y/D <0.75 19 13 (12) Properties with Y/D <0.80 38 15 (21) Properties with Y/D <0.85 41 21 (23) Properties with Y/D <0.90 45 22 (25) Properties with Y/D <0.95 55 24 (31)
* The number of properties in brackets is the number of properties with rainwater harvesting provided to the 55 properties based on the statistical selection. This therefore shows that 7 of the 31 properties modelled with rainwater harvesting tanks had a Y/D ratio above 0.95 when calculated using the real population. From this it can be seen that, in spite of the relatively low rainfall, only around half of the properties have a Y/D ratio of 0.8 or less. It also shows that, even in an area of relatively low rainfall, that 10 of the 34 properties surveyed had a Y/D ratio greater than 0.95 (3 of which would not have been provided with tanks based on the design rule using the statistical occupancy rates). Table 8.2 breaks down the information in Table 8.1 in terms of the numbers of bedrooms in a property. The three 1 bedroom properties all had Y/D ratios greater than 1.0.

Stormwater Management using Rainwater Harvesting Testing the Kellagher / Gerolin methodology on a pilot study
SR 736 33 R. 2.0
Table 8.2 Y/D ratios for properties by number of bedrooms based on statistical and actual occupancy rates – excluding 1 bedroom properties.
Properties with statistical population occupancy (nr)
Properties with actual population occupancy (nr)
2 bed 2.5 bed 3 bed 4 bed 2 bed 2.5 bed 3 bed 4 bedTotal number of properties 13 3 40 7 9 0 21 4 Properties with Y/D <0.75 2 0 16 0 1 0 11 1 Properties with Y/D 0.75 - 0.80 0 3 17 0 0 0 2 1 Properties with Y/D 0.80 - 0.85 0 0 0 3 4 0 1 0 Properties with Y/D 0.85 - 0.90 0 0 3 1 1 0 0 1 Properties with Y/D 0.90 - 0.95 6 0 1 3 0 0 2 0
Table 8.2 shows that 3 bedroom properties, which are nearly all semi-detached, have lower values of Y/D, which confirms the roof area per property in Table 6.2. In general the higher values of Y/D of detached properties with 4 or more bedroom properties and 2 bedroom properties, show that they have more roof area per person. Fortunately 3 bedroom properties are by far the most common house type in residential estates. Of the 34 properties with known occupancy, 31 were provided with rainwater harvesting systems based on the design selection for properties with Y/D <0.95 based on the statistical occupancy. Of these 31, only 24 have an actual Y/D value of less than 0.95, while 7 have ratios >0.95. The properties with these higher ratios will dominate any results associated with spills of more than 1mm on average from all properties. Therefore there is potential “failure” for 7 of the 31 properties (23%) with rainwater harvesting. This needs to be taken into account when carrying out an analysis on site stormwater control. The average Y/D ratio for the 31 properties is 0.76, which is virtually identical to the mean value of all 55 properties served with rainwater harvesting tanks. This indicates that on a communal basis, the statistical approach is the right method to use. What has still to be determined is how small a population (number of properties) can this assumption be assumed to remain valid. This is a relatively simple statistical test.
9. Pilot study rainwater harvesting options
There are a two principle options available for applying rainwater harvesting for a site; individual tanks per property, or a communal / centralised tank. However it is not the theoretical performance of the design population which needs to be established, so much as to show the actual performance of the system under the real occupancy. This has resulted in 3 models for evaluation of measuring the effectiveness to control stormwater runoff: A design system model with a tank for each house sized for a 60mm event with
Y/D <0.95; A real occupancy model with the statistically sized tank for each house; A design system model for a single tank for all 55 houses for a 60mm event with
Y/D <0.95. Note that the third model can be assessed using the statistical design approach based on the appropriate Y/D ratio for the site if sufficient properties are served such that the total population is equal to the mean occupancy based on statistical data.

Stormwater Management using Rainwater Harvesting Testing the Kellagher / Gerolin methodology on a pilot study
SR 736 34 R. 2.0
A further option was run designing the tanks to serve a smaller storm (40mm). This was built to see whether the system performance varied compared to the 60mm event, because the formula is non-linear. These results have not been analysed. Every model not only represented the houses with rainwater harvesting tanks, but also modelled the houses with no tanks (with Y/D >0.95) and also the roads. The model used a fixed percentage runoff model assuming 75% runoff from the roads and directly drained houses with default (minimal) depression storage. The rainwater harvesting houses assumed 81% runoff with a depression storage of 0.5mm. All outfalls were drained through an attenuation pond with a limit of discharge of 7l/s/ha which was 16l/s. Each of these options is discussed and the tank sizes summarised.
9.1 DESIGN TANK SIZES FOR EACH PROPERTY
The formula for tank sizes was applied for a design depth rainfall event of 60mm with a tank on each property. Any rainfall depth figure could have been chosen, but this is closely associated with the 100 year 6 hour depth which is used as a criterion in drainage related to volume control for extreme rainfall. The assumption was made that the extreme event runoff characteristics were similar to that made in the assessment of Y/D in that each event had only 81% effective runoff due to various losses (filter / splash / wind etc). Clearly the 0.5mm per event wetting is irrelevant for a single large event. It is important that the runoff fraction for a large event (the assumption on the performance of filter losses and net runoff from the roof) is followed up with both suppliers and researchers, as the proportion of an extreme event that is captured is an important assumption. Table 9.1 and Figure 9.1 provide a summary of tank sizes for each property based on the number of bedrooms. The information is provided in the form of Y/D because both Y and D are variables. Table 9.1 Storage volume by number of bedrooms per property
Y/D ratio 2 bedroom @1.74 Persons / house
(m3)
3 bedroom @2.41 Persons / house
(m3)
4 bedroom @3.02 Persons / house
(m3) Y/D = 0.60 1.8 2.5 3.2 Y/D = 0.70 2.4 3.3 4.1 Y/D = 0.80 3.2 4.4 5.5 Y/D = 0.90 4.5 6.2 7.8 Y/D = 0.95 5.5 7.7 9.6

Stormwater Management using Rainwater Harvesting Testing the Kellagher / Gerolin methodology on a pilot study
SR 736 35 R. 2.0
Tank Volumes by Different Methods
0
2
4
6
8
10
12
0.55 0.65 0.75 0.85 0.95
Y/D
Ta
nk
Vo
lum
e (
m3
)2 Bedrooms_Gerolin Kellagher
3 Bedrooms_Gerolin Kellagher
4 Bedrooms_Gerolin Kellagher
2 Bedrooms_BS8515 Stormw ater
3 Bedrooms_BS8515 Stormw ater
4 Bedrooms_BS8515 Stormw ater
2 Bedrooms_BS8515 Water Saving
3 Bedrooms_BS8515 Water Saving
4 Bedrooms_BS8515 Water Saving
Figure 9.1 Storage tank sizes as a function of Y/D for both Gerolin and Kellagher and BS8515
Examining these results shows that storage volumes range from roughly 1m3/bedroom for low Y/D ratio values through to 3m3/bedroom for Y/D of around 0.95. Although the 1bedroom property is included for completeness, typical parameter values of consumption and runoff yield is unlikely to provide Y/D ratios below 1.0. From examination of the results of the model output, it appears that properties with Y/D values greater than 0.8 have significantly more events which have spills, even though they have significantly larger tanks. It should be noted that the spills are generally small and this is detailed later in the report. Although these spills are likely to be due to unusually wet periods, (as discussed in the section on rainfall), this fact, together with the additional cost of the larger tanks needed, may indicate that cost effective use of rainwater harvesting would focus on the need to use a Y/D ratio less than say 0.8 rather than 0.95.
9.2 TANK SIZES FOR ACTUAL OCCUPANCY FOR EACH PROPERTY
The tank sizes in this model are based on the statistical population for a property. The demand element is modified to reflect the actual occupancy.
9.3 A COMMUNAL RAINWATER HARVESTING TANK FOR ALL PROPERTIES WITH Y/D LESS THAN 0.95
There are situations where a single rainwater harvesting tank has been used to collect water from a group of properties and then the water is used by returning it or using it elsewhere. A model was built to serve the same set of properties with Y/D ratios less than 0.95 for the same level of service (60mm event) served by a single tank. The alternative of serving the whole estate was also a possibility, as the Y/D ratio for all the houses on the estate is also less then 0.95. The average Y/D ratio for the 55 houses served was 0.77, resulting in a storage tank size of 234.5m3. This compares to a cumulative storage of individual property tanks of 256.2m3 - around 10% less storage.

Stormwater Management using Rainwater Harvesting Testing the Kellagher / Gerolin methodology on a pilot study
SR 736 36 R. 2.0
9.4 A MODEL OF THE BASE CONDITION
To enable comparisons to be made between these options and not using rainwater harvesting, a base condition model was built with no rainwater harvesting. For each of these models an attenuation pond was added downstream with a throttle size which assumed a discharge limit of 7l/s/ha. This reflects the greenfield site runoff rate for the 100 year return period. This base model can provide an assessment of the total runoff retained by the rainwater harvesting options for individual events or the year as a whole, along with an assessment of the difference in size of pond needed to provide a specific level of service. No analysis has been carried out on the pond size savings. As the roof areas in this pilot represent less than 30% of all hard surfaces, and the 100 year critical duration storm for 7l/s/ha is probably of the order of 100mm (based on experience), the pond size reduction is estimated to be of the order of 20 to 30%. This would be greater where a larger proportion of hard-surfaced areas is served by rainwater harvesting. Analysis on water savings achieved is relatively simple. It is obvious that with a Y/D ratio less than 1.0 with oversized tanks, that virtually all the rainfall runoff is utilised. Thus nearly 40l/c/d is saved where Y/D is close to 1.0 and for a Y/D of say 0.7, the saving in water supply is around 28l/c/d (0.7 x 40).
10. Results
This section is divided into three sections; first the performance of the system as designed (to evaluate the performance of the design methodology), then the performance for the actual occupancy of the properties (where tanks are designed without knowing their occupancy), and finally looking at the results of a communal provision of rainwater harvesting. Assessment of the performance of the effectiveness of the rainwater harvesting tanks is not straight forward. For example a tank may be full or virtually full and then spill due to a small event. However whether it registers a spill from a big or a small event, the key issue is not the “failure” to retain runoff, but the amount of rainfall that was not retained. For each model system results are provided on individual and the whole site performance for: The proportion of events in each rainfall depth band which had a spill equivalent of
more than 1mm (of gross rainfall) for each property; The proportion of events in each depth band which had a spill equivalent of more
than 1mm (of gross rainfall) on average for all the properties; An assessment of the spill depth and depth retained for each extreme event (24 in
number over 50mm, and 54 over 40mm).

Stormwater Management using Rainwater Harvesting Testing the Kellagher / Gerolin methodology on a pilot study
SR 736 37 R. 2.0
10.1 PERFORMANCE OF RAINWATER HARVESTING SYSTEM FOR TANKS SIZED FOR 60MM RAINFALL FOR EACH PROPERTY
An analysis of all events was made by grouping events into 10mm rainfall depth bands and recording a “failure” for any property which had a spill equivalent of more than 1mm of gross rainfall. Figure 10.1 shows the proportion of events for which there was spill from every tank (ranked in terms of Y/D) and Figure 10.2 shows the same information, but for the “common pipe” serving all the properties with rainwater harvesting tanks. This second graph also shows the number of events in each rainfall depth band.
Figure 10.1 Proportion of events with 1mm or more of rainfall spilling from each tank in rainfall depth bands and by Y/D ratio

Stormwater Management using Rainwater Harvesting Testing the Kellagher / Gerolin methodology on a pilot study
SR 736 38 R. 2.0
Figure 10.2 Proportion of events with an average of more than 1mm of rainfall spilling from all tanks, also showing number of events by rainfall depth ranges
As 55 properties are plotted in rank order based on Y/D it is difficult to see individual results in Figure 10.1, but the trend of low values of Y/D (below 0.8) shows that only a very small proportion of events which fail right up to the design rainfall depth of 60mm, with around 25% having some spill for the 9 events with depths between 50mm to 60mm. It can be seen that even for small events higher Y/D ratios have more spills, in spite of a specific tank sizing allowance which is larger to try and compensate for the increased variability of storage available in tanks with high Y/D ratios. However it is also worth noting that even for events greater than 70mm that around 50% of events still don’t spill from the majority of the tanks. It is also evident that there is less distinction between Y/D ratios. This is because there is relatively little additional allowance for extra storage for low Y/D ratios, thus having tank capacities that are not much greater than the design rainfall depth. The spill result from the “common pipe” for all properties shows the cumulative effect and gives a “failure” of around 67% of events in the range of 50 to 70mm. Although this seems quite serious, it is explained by the fact that only a few houses need to have a spill to achieve “failure”. Thus this graph is dominated by the houses with high values of Y/D (greater than 0.85). Figure 10.3 is needed to see the degree of failure of these events, including those that did not spill, and shows the retained and spilled equivalent rainfall depths. This shows that, on average, the spilled depth for the 50 – 60mm group of events, although quite variable, is only 4mm. It also shows that for events that are larger than design depth of 60mm the tanks also retain most of the event with only 3.3mm spilling for the 60-70mm group and on average retains 64mm of rainfall.

Stormwater Management using Rainwater Harvesting Testing the Kellagher / Gerolin methodology on a pilot study
SR 736 39 R. 2.0
Figure 10.3 54 events larger than 40mm: retained and stored depth for each event
As this set of results is dominated by the performance of houses with high Y/D ratios, the performance of the system at the ‘common pipe’ has also been evaluated for houses with Y/D ratios which are less than 0.8. Figure 10.4 shows that the proportion of failed events reduces to 22% for the 50 – 60mm range of events and 33% for the 60 – 70mm events band. Figure 10.5 shows the retained and spilled equivalent rainfall depths for events greater than 40mm, showing that only 11 of the 54 events “failed”. Ignoring the 9 events greater than 70mm, only 1 event of the 45 had a spill depth greater than 10mm. The average spill for all events in the 50-70mm band for properties with Y/D < 0.8 is less than 1mm. It can be seen from these two figures that spills are rare and when these occur, the equivalent gross rainfall depth that runs off is nearly always very small.

Stormwater Management using Rainwater Harvesting Testing the Kellagher / Gerolin methodology on a pilot study
SR 736 40 R. 2.0
Figure 10.4 Proportion of events with an average of more than 1mm of rainfall spilling from all tanks with Y/D ratio less than 0.8
Figure 10.5 54 events larger than 40mm: retained and stored depth for each event – properties with Y/D less than 0.8
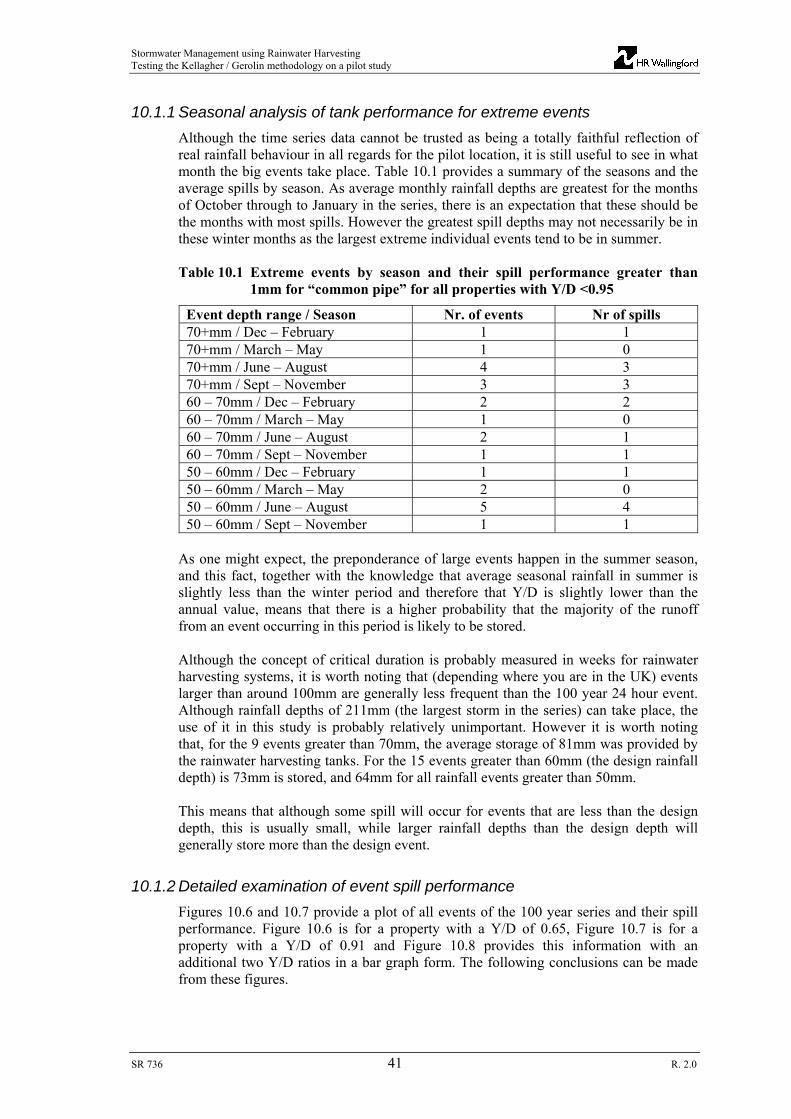
Stormwater Management using Rainwater Harvesting Testing the Kellagher / Gerolin methodology on a pilot study
SR 736 41 R. 2.0
10.1.1 Seasonal analysis of tank performance for extreme events
Although the time series data cannot be trusted as being a totally faithful reflection of real rainfall behaviour in all regards for the pilot location, it is still useful to see in what month the big events take place. Table 10.1 provides a summary of the seasons and the average spills by season. As average monthly rainfall depths are greatest for the months of October through to January in the series, there is an expectation that these should be the months with most spills. However the greatest spill depths may not necessarily be in these winter months as the largest extreme individual events tend to be in summer. Table 10.1 Extreme events by season and their spill performance greater than
1mm for “common pipe” for all properties with Y/D <0.95
Event depth range / Season Nr. of events Nr of spills 70+mm / Dec – February 1 1 70+mm / March – May 1 0 70+mm / June – August 4 3 70+mm / Sept – November 3 3 60 – 70mm / Dec – February 2 2 60 – 70mm / March – May 1 0 60 – 70mm / June – August 2 1 60 – 70mm / Sept – November 1 1 50 – 60mm / Dec – February 1 1 50 – 60mm / March – May 2 0 50 – 60mm / June – August 5 4 50 – 60mm / Sept – November 1 1
As one might expect, the preponderance of large events happen in the summer season, and this fact, together with the knowledge that average seasonal rainfall in summer is slightly less than the winter period and therefore that Y/D is slightly lower than the annual value, means that there is a higher probability that the majority of the runoff from an event occurring in this period is likely to be stored. Although the concept of critical duration is probably measured in weeks for rainwater harvesting systems, it is worth noting that (depending where you are in the UK) events larger than around 100mm are generally less frequent than the 100 year 24 hour event. Although rainfall depths of 211mm (the largest storm in the series) can take place, the use of it in this study is probably relatively unimportant. However it is worth noting that, for the 9 events greater than 70mm, the average storage of 81mm was provided by the rainwater harvesting tanks. For the 15 events greater than 60mm (the design rainfall depth) is 73mm is stored, and 64mm for all rainfall events greater than 50mm. This means that although some spill will occur for events that are less than the design depth, this is usually small, while larger rainfall depths than the design depth will generally store more than the design event.
10.1.2 Detailed examination of event spill performance
Figures 10.6 and 10.7 provide a plot of all events of the 100 year series and their spill performance. Figure 10.6 is for a property with a Y/D of 0.65, Figure 10.7 is for a property with a Y/D of 0.91 and Figure 10.8 provides this information with an additional two Y/D ratios in a bar graph form. The following conclusions can be made from these figures.

Stormwater Management using Rainwater Harvesting Testing the Kellagher / Gerolin methodology on a pilot study
SR 736 42 R. 2.0
1. The vast majority of events are retained by the tanks; between 99% and 97% for the two tanks respectively.
2. The number of spills in the failure zone for events less than 60mm is small (less than 1%) but must be acknowledged.
3. There is only 1 event (Y/D = 0.65) and 5 events (Y/D = 0.91) in 100 years which do not store the design depth of 60mm for events larger than 60mm. In the case of the latter, most of these spills are quite small.
4. There are a number of events which are greater than the design depth, but which have at least 60mm retained before spilling.
5. Although the tank for higher ratio Y/D is slightly the poorer of the two for the number of events which can be constituted as failures, it stores more water for extreme events larger than the design event and has fewer spills for these events.
Tank 1000002494000939 - Y/D = 0.65
-150
-100
-50
0
50
100
150
0 50 100 150 200 250
Total rainfall depth (mm)
Sp
are
cap
acit
y (m
m r
ain
fall
)
S
pil
l vo
lum
e (a
s m
m o
f ra
infa
ll)
Spill level
Limit line(Spill volume = Rainfall Depth)
Spare Capacity zone
Nonfailure zone
Small event failurezone
Design Rainfall Depth 60mm
Extreme event failure
zone
Design performance target(Spill volume = Rainfall Depth-60mm)
Y/D = 0.65 - Tank Capacity = 89.2mm
Figure 10.6 Spill performance for 100 year rainfall series for Y/D 0.65

Stormwater Management using Rainwater Harvesting Testing the Kellagher / Gerolin methodology on a pilot study
SR 736 43 R. 2.0
Tank 1000002494005102 - Y/D = 0.91
-150
-100
-50
0
50
100
150
0 50 100 150 200 250
Total rainfall depth (mm)
Sp
are
cap
acit
y (m
m r
ain
fall
)
S
pil
l vo
lum
e (a
s m
m o
f ra
infa
ll)
Spill level
Limit line(Spill volume = Rainfall Depth)
Spare Capacity zone
Nonfailure zone
Small event failurezone
Design Rainfall Depth 60mm
Extreme event failure
zone
Design performance target(Spill volume = Rainfall Depth-60mm)
Y/D = 0.91 - Tank Capacity = 142.3mm
Figure 10.7 Spill performance for 100 year rainfall series for Y/D 0.91
0.1
1
10
100
1000
An
nu
al f
req
un
cy Extreme event failure
Small event failure
Spare capacity
Non failure spill
Figure 10.8 Spill performance for 100 year rainfall series for Y/D 0.65, 0.73, 0.81, 0.91
This result indicates that the design methodology devised is correct for situations where the actual population is known. The next section therefore looks at the performance based on where the population has a degree of uncertainty, and where the variability is assumed.
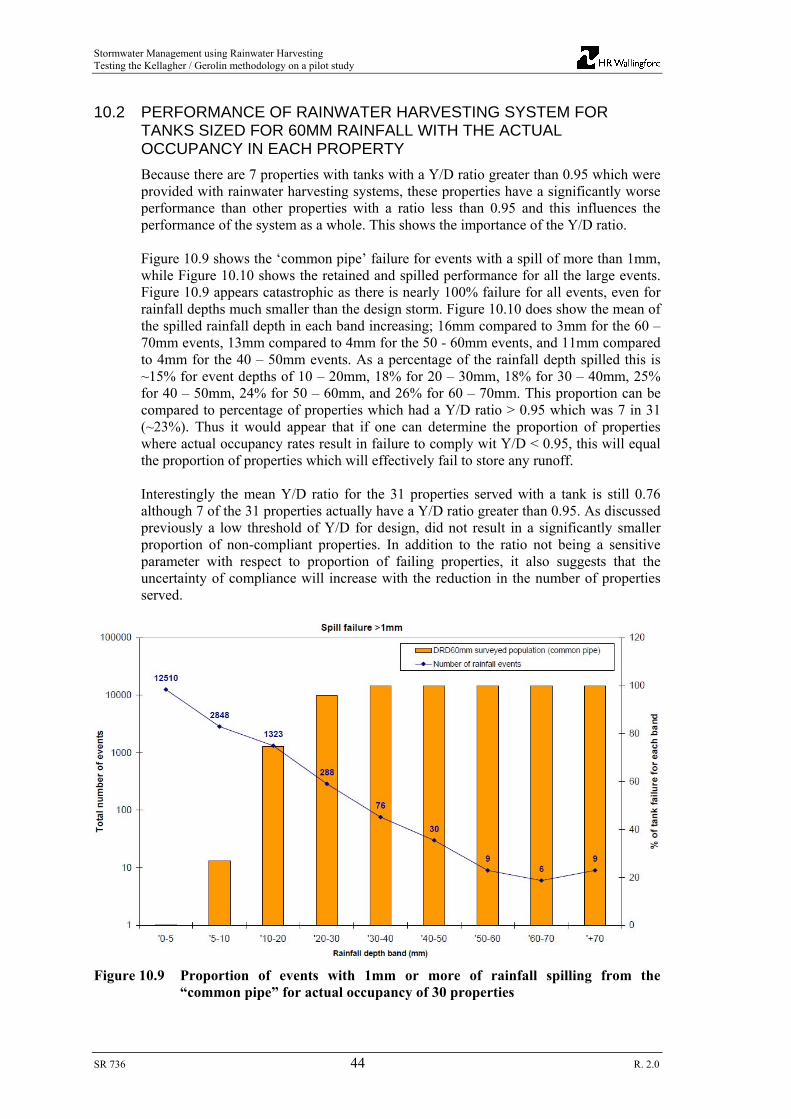
Stormwater Management using Rainwater Harvesting Testing the Kellagher / Gerolin methodology on a pilot study
SR 736 44 R. 2.0
10.2 PERFORMANCE OF RAINWATER HARVESTING SYSTEM FOR TANKS SIZED FOR 60MM RAINFALL WITH THE ACTUAL OCCUPANCY IN EACH PROPERTY
Because there are 7 properties with tanks with a Y/D ratio greater than 0.95 which were provided with rainwater harvesting systems, these properties have a significantly worse performance than other properties with a ratio less than 0.95 and this influences the performance of the system as a whole. This shows the importance of the Y/D ratio. Figure 10.9 shows the ‘common pipe’ failure for events with a spill of more than 1mm, while Figure 10.10 shows the retained and spilled performance for all the large events. Figure 10.9 appears catastrophic as there is nearly 100% failure for all events, even for rainfall depths much smaller than the design storm. Figure 10.10 does show the mean of the spilled rainfall depth in each band increasing; 16mm compared to 3mm for the 60 – 70mm events, 13mm compared to 4mm for the 50 - 60mm events, and 11mm compared to 4mm for the 40 – 50mm events. As a percentage of the rainfall depth spilled this is ~15% for event depths of 10 – 20mm, 18% for 20 – 30mm, 18% for 30 – 40mm, 25% for 40 – 50mm, 24% for 50 – 60mm, and 26% for 60 – 70mm. This proportion can be compared to percentage of properties which had a Y/D ratio > 0.95 which was 7 in 31 (~23%). Thus it would appear that if one can determine the proportion of properties where actual occupancy rates result in failure to comply wit Y/D < 0.95, this will equal the proportion of properties which will effectively fail to store any runoff. Interestingly the mean Y/D ratio for the 31 properties served with a tank is still 0.76 although 7 of the 31 properties actually have a Y/D ratio greater than 0.95. As discussed previously a low threshold of Y/D for design, did not result in a significantly smaller proportion of non-compliant properties. In addition to the ratio not being a sensitive parameter with respect to proportion of failing properties, it also suggests that the uncertainty of compliance will increase with the reduction in the number of properties served.
Figure 10.9 Proportion of events with 1mm or more of rainfall spilling from the “common pipe” for actual occupancy of 30 properties

Stormwater Management using Rainwater Harvesting Testing the Kellagher / Gerolin methodology on a pilot study
SR 736 45 R. 2.0
Figure 10.10 54 events larger than 40mm: retained and stored depth for each event for actual occupancy of 31 properties
The mean spill for the two groups of events spanning 60mm (50 – 60mm and 60 – 70mm) is an important result for designing drainage systems for the site as a whole. These values are 13mm and 16mm respectively. However looking at the mean storage volume achieved for all events greater than 50mm and 60mm respectively, gives results of mean storage depths of 52mm and 58mm. To demonstrate the effect of the Y/D ratio and the threshold set at 0.95, Figures 10.11 and 10.12 show the “common pipe” performance for extreme events for the 7 properties with Y/D >0.95, and the 24 properties with Y/D <0.95.

Stormwater Management using Rainwater Harvesting Testing the Kellagher / Gerolin methodology on a pilot study
SR 736 46 R. 2.0
Figure 10.11 Actual occupancy of 7 properties, with Y/D >0.95 for 54 events larger than 40mm: retained and stored depth for each event
Figure 10.12 Actual occupancy of 24 properties, with Y/D <0.95 for 54 events larger than 40mm: retained and stored depth for each event

Stormwater Management using Rainwater Harvesting Testing the Kellagher / Gerolin methodology on a pilot study
SR 736 47 R. 2.0
This shows that for properties with a Y/D ratio <0.95 produces very similar (slightly better) results to that obtained from the statistical population, while the 7 properties which fail provide a fairly consistent amount of storage of, on average, 8mm in each event depth range from 20mm and greater. These results are therefore very clear; the properties with Y/D > 0.95 are effectively useless in providing storage against virtually any rainfall runoff for events of significant depth. (However for other reasons where zero runoff might be needed for small events, such as pollution reduction, these results do show some promise as well). Thus the methodology needs to determine an approach for assessing the proportion of likely non-compliant properties to be able to carry out site analysis of stormwater control storage requirements. This happens to be 23% for this study, indicating that around 1 in 4 houses are not effective in providing stormwater control. However it is still worth repeating that for larger events than the design event, the volume of water stored against runoff largely compensates for these properties. Therefore it is likely that the where the critical duration event of the site is based on a design storm of the order of 100mm or more, then the average retained volume will be greater than the design storage of 60mm and compensate for some or possibly all of the “failures” of the non-compliant properties. If the design depth is considered as being applied to all events of the design event size and above, in this case the conclusion is far more satisfactory in that the mean depth stored is 58mm for all events larger than 60mm. However it should be noted this assumption of compliance is only true if there is a secondary storage attenuation structure; direct discharge from the site direct to a small stream would still effectively result in no attenuation of runoff from the non-compliant proportion of properties. As with all engineering, a simple rule is no substitute for understanding the processes and the reasons for a system’s behaviour.
10.3 PERFORMANCE OF RAINWATER HARVESTING SYSTEM FOR AN AGGREGATED TANK TO SERVE ALL PROPERTIES WITH Y/D LESS THAN 0.95 SIZED FOR 60MM RAINFALL
The storage tank volume for using a common tank to serve all 55 properties is 235m3 based on the Y/D ratio of 0.77. This compares to the 256m3 of storage provided for the sum of all individual property systems. The performance of the aggregated tank, even though in aggregation the storage volume is 10% smaller than the total volume of the individual tanks, can be compared to the performance of an individual tank with a Y/D ratio of 0.77 which has around 22% failure with a spill of more than 1mm. Figure 10.13 shows the system spill performance.

Stormwater Management using Rainwater Harvesting Testing the Kellagher / Gerolin methodology on a pilot study
SR 736 48 R. 2.0
Figure 10.13 Proportion of events with 1mm or more of rainfall spilling from the aggregate tank serving all properties with Y/D ratio <0.95
As for the previous analyses, the spill depth and retained depth of extreme events is shown (Figure 10.14). This shows that of the 53 events (excluding the 211mm event) only 11 events have any spill, and the mean spill volume per event is 2mm for events 60 – 70mm. The mean volume retained for rainfall events greater than 60mm is 71mm (significantly greater than the design event).
Figure 10.14 54 events larger than 40mm: retained and stored depth for each event for aggregate tank designed to retain 60mm rainfall

Stormwater Management using Rainwater Harvesting Testing the Kellagher / Gerolin methodology on a pilot study
SR 736 49 R. 2.0
These results clearly show that there is advantage (from the hydraulic point of view) in providing common storage of rainfall runoff in a single system with significantly fewer spills taking place due to the Y/D ratio for the site being significantly less than 0.8 and no non-compliant properties to consider. Thus the uncertainty associated with the variability of house occupancy will disappear as an issue if a significant number of properties are served. The minimum number of houses needed to sufficiently address this uncertainty requires more analysis, but it is possible that around 10 properties would be sufficient to assume the population approximates to the statistical mean.
11. A methodology for assessing uncertainty of property occupancy
An estimate of non-compliant properties (those that cannot be presumed to control extreme event runoff) can be made subject to some assumptions. A probabilistic approach can be taken if one knows the statistical distribution (mean and standard deviation) of roof areas for property types and also the property occupancy. Where the roof area is specifically known for each property type, this can be simplified by only considering the uncertainty associated with occupancy. A detailed explanation of the approach taken is provided in appendix C. This analytical approach is based on storage tanks only being provided to properties where Y/D < 0.95 based on the mean of the statistical population for houses of a specific number of bedrooms where the roof area achieves a Y/D ratio of 0.95 or less. This means that part of the distribution for roofs is excluded (the larger properties), thus increasing the chance of compliance. Alternatively, where rainwater harvesting tanks might be provided to all properties irrespective of the estimated Y/D ratio, this can also be calculated. The method makes the assumption that the roof area of each category of house (number of bedrooms) is a normal distribution. In practice the standard deviation of roof areas would probably not be needed as roof areas of each property type would probably be known and used individually for assessment of compliance. The assumption is made that occupancy of a property is distributed using a binomial distribution with a minimum occupancy of 1 person. Of the two remaining unknowns, the constraint on an upper-bound occupancy could be set to 2 times the number of bedrooms though even with this not assumed, occupancy seemed to be predicted sensibly. This is an area which requires further investigation to confirm that these assumptions are reasonable. The assumption of a binomial distribution applying to property occupancy may be able to be checked using the wealth of national statistical information on property occupancy. It may even be possible to use this statistical information on occupancy distribution directly. Table 11.1 provides a summary of the statistical data and Figure 11.1 illustrates this probabilistic approach using the actual statistical information on for the pilot catchment (roof areas - mean and standard deviation assuming normal distribution, and population mean with binomial distribution). This shows the compliance for each of the categories of houses in terms of number of bedrooms.

Stormwater Management using Rainwater Harvesting Testing the Kellagher / Gerolin methodology on a pilot study
SR 736 50 R. 2.0
The results seem to confirm the applicability of the approach. Where 23% was obtained in practice 28% is obtained for the 3 bedroom properties (the dominant property type) and reduced compliance for the 2 and 4 bedroom houses at 43% and 35% respectively. As the roof area was actually known and used in determining Y/D ratios, this probably explains the non-compliant proportion percentage being slightly less than that calculated.
Table 11.1 Statistical values used for assessing non-compliance of properties provided with rainwater harvesting tanks at the pilot site
Number of bedrooms N 2 3 4 Number of occupants P: mean (sd) 1.72 (0.73) 2.38 (0.97) 2.97 (1.12)
Roof area A: mean (sd) 42 (6.9) 49.7 (6.9) 74 (8) Critical roof area u (using cu = 0.95) 46.35 64.14 80.04
P(Y/D > 0.95 | A ≤ u) 0.430 0.284 0.345
Figure 11.1 Results of the statistical analysis for assessing non-compliance of properties provided with rainwater harvesting tanks at the pilot site for 2, 3 and 4 bedroom properties

Stormwater Management using Rainwater Harvesting Testing the Kellagher / Gerolin methodology on a pilot study
SR 736 51 R. 2.0
12. Conclusions on stormwater control management using rainwater harvesting systems
1. The headline result of this study is that the design methodology for sizing rainwater harvesting storage tanks for stormwater control is effective in being able to store stormwater runoff for a specific design event, but properties must comply with the rule Y/D<0.95.
2. The second main conclusion is that where properties are provided with individual tanks, that a proportion of properties will “fail” to control the runoff and that this number can be estimated statistically. This therefore still allows design of storage on a site to take account of storage provided by the rainwater harvesting systems.
3. The third main conclusion is that a communal approach to rainwater harvesting removes the uncertainty associated with occupancy rates and effectively removes the non-compliant property element. The minimum number of properties that need to be served communally to avoid having to consider occupancy uncertainty has not been evaluated in this research.
Other conclusions are (roughly in order of importance): 4. Achieving design rainfall depth storage retention
As there is, on average, some spill that is likely to occur from a proportion of all rainfall events, due to both the stochastic nature of tank storage volume available and also the houses with low occupancy rates, the following conclusions can be made: Where the actual design event depth is the critical measure of compliance,
then the proportion of non-compliance needs to be estimated and used; but When designing the site storage requirements, where the design depth for the
critical duration of the site design event for stormwater control is at least 50% greater than the design event for rainwater harvesting tanks, then all the rainwater harvesting tanks can be assumed to cumulatively comply with providing the tank design storage volume due to the additional volume of runoff stored by the compliant systems.
5. Tank sizing using statistical population based on the number of bedrooms Tank sizing for individual residential houses based on statistically based population information related to the number of bedrooms has been shown to be a viable method of approach for stormwater control design for sizing rainwater harvesting tanks.
6. Proportion of non-compliant properties Due to the issue of the variability of property occupancy, specific calculation of the proportion of properties, that will be non-compliant (to Y/D <0.95), needs to be made and allowed for when designing site storage requirements.
7. Annual rainfall depth This methodology is based on research which indicates that refinement of Y/D based on annual rainfall to seasonal characteristics has been shown [8] not to improve significantly on the results. This is thought to be due to UK’s rainfall characteristics where monthly rainfall through the year is fairly even.
8. Seasonal rainfall variability As with occupancy variability, seasons occur which are wetter than the norm. In these situations properties with Y/D ratios close to 0.95 are likely to “fail” in storing any significant rainfall depth. At present it is felt that this should not be allowed for as a wetter year or season is effectively designing for a more extreme event. However this effectively means that properties with Y/D ratios around 0.95

Stormwater Management using Rainwater Harvesting Testing the Kellagher / Gerolin methodology on a pilot study
SR 736 52 R. 2.0
will only be effective every other year on average (and those with lower Y/D ratios will “fail” less frequently). As this relationship is very non-linear, consideration of this aspect probably needs to be explicitly included in the design methodology. This may not be a simple function of using a lower design Y/D ratio, as it is the actual occupancy which is the important measure of performance.
9. Y/D design threshold value impact on rainwater harvesting storage design Less spills occur and less storage per property is needed, the lower the value of Y/D. However unless houses are built with significantly smaller roofs, the proportion of properties which would give a value less than 0.8 in standard residential developments is likely to be limited, even for the drier areas in the UK.
10. The use of a communal tank compared to individual tanks for each property The variability of the number of people in occupied properties is of no relevance where a communal approach on rainwater harvesting tank storage is applied (assuming a minimum number of properties). In this case there is much greater certainty in the system achieving the performance requirement for the design depth of rainfall. No allowance is therefore needed for non-compliant properties as is the case for individual property storage tanks due to variability of occupancy. The lower limit of the number of houses where it can be assumed that the population occupancy will effectively converge to the mean of the statistical average has not been investigated.
11. The effectiveness of rainwater harvesting systems in reducing attenuation storage Although no analysis has been carried out on this aspect of the study, the effect of providing rainwater harvesting for preventing a proportion of runoff being discharged from the site is likely to be relatively small as roofs only represent around 30 percent of all hard surfaces. As the design rainfall depths for attenuation ponds are generally are generally of the order of 100mm, the reduction in the pond size is unlikely to be much greater than 20%. However the retention of runoff volume is very important where there are criteria on runoff volume and not just discharge flow rate.
There are also a number of related issues which are not conclusions of this study, but which have become obvious as a result of the work and are worth highlighting. 12. Green roofs
As water demand has been significantly reduced with the reduction in toilet flush volume, the application of rainwater harvesting for stormwater control for residential properties is limited to areas of the country where rainfall is 800mm or less. This means that the majority of the population in the UK can use rainwater harvesting for stormwater control (based on typical residential property characteristics, and use of the water for washing machines) though Y/D ratios will normally be quite high, but it is unlikely that areas in the north-west such as Glasgow and Manchester would be able to achieve compliant values of Y/D. In these high rainfall areas and other situations where yield is higher than demand (large properties), green roofs would address this issue in reducing net yield significantly. However work is needed to quantify this and develop suitable design rules. In particular it is thought that the annual basis for Y/D would probably need to be replaced with a seasonally based assessment due to the significant difference in yield between summer and winter for such roofs.
13. Water usage in residential properties There are various aspects which are worth noting. As with Yield, the estimation of Demand and its variability is equally important. 13.1. Actual consumption rates of water through toilets and washing machines
could be re-visited to confirm mean usage and variability of use.

Stormwater Management using Rainwater Harvesting Testing the Kellagher / Gerolin methodology on a pilot study
SR 736 53 R. 2.0
13.2. The emphasis on water use reduction is important, but in this situation there are arguments for using larger volumes, particularly for toilet cisterns. However the manufacturers of toilets probably do not produce such units.
13.3. The more detailed issues of holidays and week-end behaviour have not been explored in this study. It is thought that the proportion of non-compliant properties might rise significantly in July and August in the UK.
14. Active emptying of storage tanks This study has presumed a passive approach to emptying and filling of the rainwater harvesting tank. There are other options for ensuring sufficient storage volume is available at all times by using active management of the water stored. (This is investigated in outline in Appendix E). This has the advantage of removing the uncertainty on the tank size needed and its performance and also minimises the tank storage volume.
15. Industrial and Commercial buildings The use of rainwater harvesting for stormwater control for commercial and industrial buildings has yet to be explored in detail, but the water consumption aspect of these buildings is relatively well known and the variability in occupancy rate is likely to be less of an issue, but would still need consideration.
13. Recommendations for application of rainwater harvesting for hydraulic design
In summary the following recommendations are made with regards to the application of rainwater harvesting for stormwater control: 1. The Y/D ratio of 0.95 limit based on annual yield and demand should be used for
stormwater control of runoff using rainwater harvesting. 2. The use of rainwater harvesting for stormwater control requires between 2 and 5
times more storage than sizing tanks for water supply only, largely depending on the Y/D ratio.
3. The design of rainwater harvesting for stormwater control for residential properties can be based on the number of bedrooms using national or regional information on house occupancy per bedroom for each property type.
4. It is likely that for houses with plan areas as they are designed at present, will only be able to use rainwater harvesting for stormwater control in regions where rainfall is less than around 800mm.
5. Where rainwater harvesting is provided for individual properties, a calculation of the proportion of properties which will be non-compliant will need to be made for designing the downstream drainage system.
6. For a communal storage tank it can be assumed that the design rainfall depth is stored where sufficient numbers of properties are catered for (to remove uncertainty with respect to occupancy).
7. For non-compliant properties, these should be assumed to fail in terms of storing any significant rainfall event. However the analysis suggests that nearly all events less than 5mm are captured, thus providing benefits with respect to pollution control.
8. The current procedure does not take into account wet months and seasons. Due to the non-linearity of the performance of rainwater harvesting systems in storing runoff, it is probable that this aspect should be taken into consideration and incorporated in a revision of the procedure.

Stormwater Management using Rainwater Harvesting Testing the Kellagher / Gerolin methodology on a pilot study
SR 736 54 R. 2.0
14. The future take-up of rainwater harvesting for stormwater control
This section looks at the barriers that still have to be overcome for greater use of rainwater harvesting systems, and in particular, their acceptance for use for stormwater control. The use of rainwater harvesting for saving water has been recognised for some time and with pressure being exerted to reduce water use, rainwater harvesting is being taken up, though not extensively. There are significant barriers associated with cost, reluctance to using non-potable water and concerns about an appropriate level of operational and maintenance management. However the potential for rainwater harvesting also being used for stormwater control adds weight to these systems being used more widely as they serve the dual purpose of stormwater control and reducing the usage of a scarce resource. The issues that will affect the future take-up of rainwater harvesting for stormwater control are: Regulatory approval; Space available for rainwater harvesting systems; Costs: Both new build and retro-fit to existing properties; Benefits associated the surface water drainage design; Carbon use; and Other benefits; water conservation, CSO spill reduction. These topics will be reviewed briefly and then a final recommendation on the way forwards is proposed.
14.1 REGULATORY APPROVAL
It is hoped that this study will remove the Environment Agency’s current position which is that tanks cannot be assumed to be empty at the time of a large storm. Although this study should allay these fears, it is important to build on this work to confirm and refine the procedure. However it is hoped that this work provides sufficient proof that the Environment Agency will now support the use of rainwater harvesting for stormwater control and provisionally agree this methodology and design guidance for its application in producing site drainage systems. To facilitate its take up, a web site has been provided (www.uksuds.com) which provides a tool for calculating storage tank sizes. It may also be useful to produce nomographs or tables for each house category to enable developers to select the correct tank size for a rainwater harvesting system.
14.2 SPACE FOR RAINWATER HARVESTING SYSTEMS
Modern housing developments are generally high density with very limited space between the road and the property. This has serious implications for finding room to place a storage tank. The larger volume required could result in a deeper tank design (shaped more like a traditional soakaway), but this may have implications for floatation in locations with high groundwater levels.
Stormwater Management using Rainwater Harvesting Testing the Kellagher / Gerolin methodology on a pilot study
SR 736 55 R. 2.0
14.3 COSTS OF RAINWATER HARVESTING SYSTEMS
The cost of rainwater harvesting for both new build and retrofit to existing buildings is more expensive than most other forms of drainage. This is particularly the case for stormwater control where additional storage is needed, though this may be provided by a low cost geo-cellular storage extension to a standard tank. Therefore the take-up of these systems is related to two key issues: Firstly, the scarcity of resource pressures along with meeting targets for reducing
water consumption; Secondly, drainage design criterion which requires the volume of runoff
discharged from a site to be controlled. The second aspect is critical in meeting current standards for flood prevention, though in the near future the WFD may focus attention on spill volumes from CSOs. Reduction in runoff volume of surface water can only be achieved by infiltration and rainwater harvesting, and in many instances the option of infiltration is not available. It is this aspect of volume control of runoff which is likely to be a significant driver for using these systems.
14.4 CARBON USE
This is perhaps the issue which currently raises the greatest obstacle to the argument that rainwater harvesting systems are a sustainable approach. The Environment Agency have produced an Evidence report Environment Agency Energy and Carbon implications of Rainwater Harvesting and Greywater Recycling, SC090018, (2010) [28]. The key results found were that: 1. Potable water uses less carbon per litre of water supplied even discounting
embedded carbon. 2. Carbon costs of rainwater harvesting are approximately 20% in embedded carbon
in materials and the construction process and 80% in terms of pump operation lifting water to a header tank.
The report recognised that rainwater harvesting provide other unquantified benefits which might save on carbon expenditure such as reduced water quality problems in rivers, and also the reduced environmental stress due to reductions in demand on water resources. What the report does not consider is the environmental cost associated with generating another 20% to 30% more water, which effectively rainwater harvesting can achieve. It is clear that finding this extra water would place a very large environmental cost on the environment. The following section provides an over-view from first principles of energy consumption in moving water, and then goes on to consider other aspects associated with energy.
14.4.1 Operational carbon
The context of the following analysis is the comparison of the delivery energy of potable water to a house compared to the performance of small pump systems to lift and use the rainwater. It should be noted that the potential saving of around 20% to 30% of the water treatment costs in terms of chemicals, local pumping and disposal of solids is

Stormwater Management using Rainwater Harvesting Testing the Kellagher / Gerolin methodology on a pilot study
SR 736 56 R. 2.0
not included in the Environment Agency report. It is not known whether this is a significant additional component in terms of energy. The report states that the median energy use for potable water delivery is 400 kg CO2/Ml, but that this does not allow for leakage costs. Presumably therefore the energy cost might be considered as being at least 30% higher. Working from first principles 2.8 kWh lifts 1 Ml of water through 1m. Working with a conversion factor of 0.55 kgCO2/kWh to get energy in terms of kg of CO2, this results in approximately 1.5kg of CO2 for a Ml.m of water. Therefore taking the water company median value of around 400 kg/Ml, this computes (ignoring efficiency losses) to ~270m total head. This figure can be broken down into component parts of total head from abstraction to delivery at the property, friction head of delivering the water through pipes and one or more pump efficiency loss effects. In terms of total head the result seems consistent with what might be expected. Table 3 in the report gives a range of data on local energy consumption using small pumps within a house as ranging from 0.6 – 3.0kWh/m3. Again from first principles, assuming the total head of water for a rainwater harvesting system requires a total lift of 10m to a header tank for a standard house, ignoring pump efficiency this would require 15kg / Ml. This is only 0.028 kWh/m3. This suggests that pump efficiency is only of the order of 1 to 4% which seems extraordinarily low. This brief analysis shows that there is definitely a need to investigate this claim further. Firstly to see whether these facts are true and these assumptions correct, and secondly to see what might be done to reduce this operating energy cost.
14.4.2 Reducing operating energy costs
There are two obvious possible ways in which operating energy costs can be reduced. The first is the use of photovoltaic pumps (because the delivery rate to a header tank can be at a minimal rate), and the second is to capture a proportion of the runoff directly into a header tank from the roof. It is likely that even if the header tank was less than 0.5m3, and if it could be arranged to collect virtually all the runoff from the roof surface before the excess passes to the main tank, this would probably reduce total pumping costs by more than 50% depending on the property characteristics of occupancy and roof area.
14.4.3 Embedded carbon
The Environment Agency report provides information on embedded carbon. The tank is around 500kg of CO2 (depending on its size and materials used) and other materials needed account for a further 330kg of CO2. Of this 330kg, 180kg is associated with the pump which is assumed to need replacing every 15years. In terms of comparative magnitude with operational energy use, if the pump is rated at 0.5kg/m3 the operational carbon, for 2.5 people at 40l/c/d for a year would be of the order of 18kg/pa. Therefore even over a life time of say 50 years, more than 50% of the carbon is associated with the materials and construction costs. This indicates that the embedded carbon associated with rainwater harvesting tanks is undeniably high. As embedded carbon annualised over 50 years is of the order of 25kg /residence this on its own exceeds the potable water direct carbon operating cost of around 15kg/pa.

Stormwater Management using Rainwater Harvesting Testing the Kellagher / Gerolin methodology on a pilot study
SR 736 57 R. 2.0
Although this comparison is not complete without acknowledging that the materials used in the rainwater harvesting system can be recycled, this of itself also has carbon implications. However this calculation needs to be seen in context of the construction and operational carbon of running a house or a car, or increasing the capability of expanding the capability of the existing water supply to provide a further 30% more water. Clearly carbon costs need to be considered in the context of the environmental benefits they produce and resources used.
14.5 BENEFITS ASSOCIATED WITH RAINWATER HARVESTING
The carbon analysis is always going to be a problem if selection is primarily based on this fact as analysed and presented in the Environment Agency report [28]. This is based on the premise that all of the infrastructure associated with the potable water system is needed anyway to deliver treated safe water to every property. The choice of using rainwater harvesting therefore lies with other arguments. In the UK, even where potable water is reliably available and cheap to provide, there are a number of benefits in using rainwater harvesting. These are: Flooding due to stormwater runoff is known to be an issue of both volume as well as rate of runoff. Criteria for stormwater system now include volumetric control and rainwater harvesting is one of the few methods of reducing the volume of stormwater runoff. A related benefit is that downstream attenuation structures are therefore reduced in size and compliance with limiting discharges more easily achieved. The concept of Interception (prevention of the first 5mm of runoff from leaving the site) can probably be deemed to be complied with if rainwater harvesting is used. This appears to be certain for all systems where Y/D <0.95, but has yet to be properly assessed and confirmed. However results gained in this study suggest that even systems designed just for water saving would probably meet this criterion as well, as long as Y/D is not too great. An obvious benefit is that of reducing the demand on a scarce resource. This has the related benefit of protecting the environment more generally maintaining river flows. This is a particularly significant feature for much of the south and East of the UK. Other benefits already proven by research shows that the number of CSO spills and volumes discharged to water courses are reduced. This also applies to separate stormwater systems. Improving receiving water conditions will become a much greater issue as the requirements of WFD becomes more important to meet. An area being researched in Wales in the last few years is the ability for rainwater harvesting systems to reduce flooding from existing drainage systems if they are retro-fitted widely across the urban environment. This also provides benefits in terms of reduced pumping and treatment costs at the WwTW. It is important to note that in capturing rainwater for use it is not reducing the potential yield to the environment by passing into the ground. This is only true where rainwater harvesting replaces the use of infiltration. In most cases, infiltration would always be

Stormwater Management using Rainwater Harvesting Testing the Kellagher / Gerolin methodology on a pilot study
SR 736 58 R. 2.0
preferred, where it can be used, on the grounds of cost. In the case where runoff passed directly to the watercourse, the morphological impact on the river is generally negative and volumes are only very temporarily increased. This report does not attempt to quantify these benefits and weigh them against the carbon cost, but it is clear that a holistic approach needs to be applied to consideration of all resources used and pressures placed on the environment.
15. The future
Assuming that rainwater harvesting has been demonstrated by this study to be a viable way of controlling stormwater for large events, and that it is seen as playing a significant role in the design of drainage systems and potentially useful for addressing some of the existing problems in cities, then there is a need to carry out a further pilot study to confirm these findings and refine one or two of the assumptions.
15.1 CONFIRMATION PILOTS
It is felt that at least two modern residential developments are selected to test the procedure further. These sites, although new, should be as dissimilar as possible in terms of population category and architectural approach, but still conform to good modern practice. The rainfall should be based on an extreme rainfall series which can be shown to be representative within the area where SAAR is less than 800mm (which covers the majority of south and east of England). If this is based on a selection of a large number of specific events, at least 3 months of antecedent daily rainfall record prior to each selected events should be obtained to be used with the event information. The objectives of these studies would therefore be to: Demonstrate that performance of rainwater harvesting tanks in these sites
replicates the results gained in this study; Evaluate in more detail the uncertainty associated with the effects of population
occupancy variability; Assess the design assumptions needed when rainwater harvesting is used on fewer
than 10 properties; and Develop a strategy which considers years with seasonal wet periods. The issue of domestic water use along with the implications of holidays and week-end behaviour is a separate, but equally important study. These studies should hopefully result in approval of the findings and build on the recommendations made in this report. It will also help refine some of the assumptions that need to be made when designing site drainage systems.
15.2 COMMERCIAL AND INDUSTRIAL BUILDINGS
A similar study looking at the applicability of rainwater harvesting to non-residential buildings needs to be made. This will establish what proportion of buildings could be used in this way and what their characteristics need to be to ensure that stormwater control can be used by rainwater harvesting techniques.

Stormwater Management using Rainwater Harvesting Testing the Kellagher / Gerolin methodology on a pilot study
SR 736 59 R. 2.0
15.3 GREEN ROOFS WITH RAINWATER HARVESTING
The possibility of using green roofs together with rainwater harvesting should be studied. This will require in-depth consideration of the types of green roof systems as well as their varying hydraulic performance through the seasons. This will enable the procedure to be extended to all (wet) areas of the UK.
15.4 CARBON AND SUSTAINABILITY ASSESSMENT
Although the embedded carbon of rainwater harvesting dominates this issue, this aspect could be re-examined in the context of these larger systems for stormwater control and assessing the options for minimising the embedded carbon element. Secondly, the topic of operational carbon cost requires evaluating again and this should also consider the options available for minimising carbon consumption. This analysis should be holistic in considering environmental benefits and relative carbon costs.
15.5 ACTIVE MANAGEMENT OF RAINWATER HARVESTING SYSTEMS
Although this study presumes that rainwater harvesting systems are operated a passive system, active management of rainwater harvesting to protect against downstream flooding is now taking place in some places. This topic (which is briefly outlined in appendix E) should be examined to assess the implications associated with its use.

Stormwater Management using Rainwater Harvesting Testing the Kellagher / Gerolin methodology on a pilot study
SR 736 60 R. 2.0
16. References
[1] Gerolin A, Kellagher R B, Faram M G. Rainwater harvesting systems for stormwater management: Feasibility and sizing considerations for the UK, proceedings of Novatech 2010, Lyon, France, 10 p.
[2] DCLG, (2009) Code for Sustainable Homes: technical guide. Department for Communities and Local Government, London UK.
[3] BSI (2009) BS8515:2009. Rainwater harvesting systems: code of practice. British Standards Institute, London UK.
[4] Jensen, M.A., Steffen, J., Burian, S.J., Pomeroy, C. (2010). Do rainwater harvesting objectives of water supply and stormwater management conflict? Low Impact Development 2010: Redefining Water in the City, ASCE, 10 p.
[5] Forasté, J.A., Hirschman, D. (2010). A Methodology for using Rainwater Harvesting as a Stormwater Management BMP, Low Impact Development 2010: Redefining Water in the City, ASCE, 14 p.
[6] Burns, M., Fletcher, T., Hatt, B., Ladson, A., Walsh, C. (2010). Can allotment-scale rainwater harvesting manage urban flood risk and project stream health? Novatech 2010, Lyon, France, 10 p.
[7] Petrucci, G.; Deroubaix, J.F.; Bompard, P.; Deutsch, J.C.; De Gouvello, B.; Laffréchine, K.; Tassin, B. (2010). Efficiency of distributed water harvesting on runoff reduction. Case-study of “Village Parisien” district, Champigny-sur-Marne, Ile de France, Novatech 2010, Lyon, France, 10 p.
[8] Gerolin A. Rainwater Harvesting Systems for Stormwater Management – An investigation of the benefits provided by domestic rainwater tanks during extreme rainfall events: factorisation into design guidelines (MSc dissertation). Centre d’Etudes Techniques de l’Equipment de l’Est, University of Grenoble, France, 2009.
[9] Kellagher R B, Udale-Clarke H. Sustainability Criteria for the Design of Stormwater Drainage Systems for the 21st Century. 11th International Conference on Urban Drainage, Edinburgh, Scotland, UK, 2008.
[10] Kellagher R B, Maneiro Franco E. Rainwater collection and use in developments, benefits for yield and stormwater control. Report SR 677 and EPSRC WaND Briefing Note 19 2005, HR Wallingford, Wallingford, UK.
[11] HR Wallingford. Stormwater management using Rainwater harvesting use for stormwater control – Design methodology and pilot study. 2011.
[12] Inch D. Rainwater Harvesting as a potential control for Urban Storm Flooding, Sept 2010, MSc Thesis, Coventry University. 2010.
[13] HR Wallingford. Climate change and the design of sewerage systems, vols IIA & IIB 03/cl10/4 & 5 UKWIR 2003.
[14] HR Wallingford. SR475 Audacious - Adaptable Urban Drainage: Comparison on RainSim and TSRsim stochastic rainfall generators benchmarked against observed data. 2005.
[15] NERC. Flood Studies Report. 1975.

Stormwater Management using Rainwater Harvesting Testing the Kellagher / Gerolin methodology on a pilot study
SR 736 61 R. 2.0
[16] CEH. Flood Estimation Handbook (FEH). Centre for Ecology and Hydrology, Wallingford UK. 1999.
[17] DCLG (2007) Table 810: Household characteristics: mean household size by type of accommodation and by number of bedrooms, 2004-07.
[18] Oxfordshire County Council. Survey of New Housing 2008: Summary of results. Oxfordshire County Council Policy Unit, Oxford UK. 2009.
[19] Defra Floods and Water management Act: SuDS Standards http://www.defra.gov.uk/environment/flooding/legislation/
[20] Waterwise (2010) Saving water at home [online] available from http://www.waterwise.org.uk/reducing_water_wastage_in_the_uk/house_and_garden/save_water_at_home.html
[21] Ofwat (2010) Data Table 10: UK Water Authorities June Return [online] available from http://www.ofwat.gov.uk/regulating/junereturn/
[22] OCC (2009) Survey of New Housing 2008: Summary of results. Oxfordshire County Council Policy Unit, Oxford UK.
[23] ONS (2004) Number of People Living in Households (UV51). Office for National Statistics [online] available from <http://www.neighbourhood.statistics.gov.uk/ dissemination/LeadTableView.do?a=3&b=277085&c=Cherwell&d=13&e=7&g=479953&i=1001x1003x1004&m=0&r=1&s=1281100205272&enc=1&dsFamilyId=143>
[24] DCLG (2007) Table 810: Household characteristics: mean household size by type of accommodation and by number of bedrooms, 2004-07 [online] available from <http://www.communities.gov.uk/housing/housingresearch/housingstatistics/housingstatisticsby/householdcharacteristics/livetables/>
[25] DCLG, (2009) The Water Efficiency Calculator for new dwellings. Department for Communities and Local Government, London UK.
[26] Kellagher and Laughlin, SuDS for High Density Developments, Guidance Manual HR Wallingford SR666 (2005).
[27] Met Office monthly data for Oxford 2011 http://www.metoffice.gov.uk/climate/uk/stationdata/
[28] Environment Agency, NHBC and the Energy Saving Trust (2010) Energy and Carbon implications of Rainwater Harvesting and Greywater Recycling, SC090018, August 2010.
[29] Defra. National Standards for Sustainable Drainage Systems – Design, Construction, Operating and Maintaining drainage for surface runoff. (2011).
[30] WERF 2011 Webinar series. Real time control of green infrastructure: Applications and test site opportunities (2011).


Stormwater Management using Rainwater Harvesting Testing the Kellagher / Gerolin methodology on a pilot study
SR 736 R. 2.0
Appendices

Stormwater Management using Rainwater Harvesting Testing the Kellagher / Gerolin methodology on a pilot study
SR 736 R. 2.0

Stormwater Management using Rainwater Harvesting Testing the Kellagher / Gerolin methodology on a pilot study
SR 736 R. 2.0
Appendix A Gerolin and Kellagher methodology
A1 Sizing rainwater harvesting tanks for stormwater control – (Gerolin & Kellagher approach) The following tank sizing approach has been developed from an analysis of several continuous 100 year rainfall series. The flow chart in Figure A1 defines the process for sizing a rainwater harvesting system for stormwater management. This methodology allows the estimation of the tank storage volume which is applicable across the whole of UK without having to carry out a detailed time series rainfall analysis.
No Yes
Rainwater harvesting storage tanksizing for stormwater control
Calculate Y/D ratio(Y = SAAR x loss coeffs x Roof area)
(D = Pop x l/c/day x 365)
Is Y/D <0.95?
Is Demand based on regular daily
consumption?
Rainwater harvesting cannot be used for
stormwater control unless Active control of tank
storage is used
Calculate sP50sP50 = CSx1000
A
Calculate tank size using 100 years of rainfall time series or similar method
Obtain CoefficientsCS = f(Y/D)Ad = f(Y/D)CP50 = f(Y/D)
Solve for V(tank size) or RD (design rainfall depth)RD = sP50 - Ad + (V-1) x CP50 x 103
A
No Yes
No
Figure A1 Flow chart for sizing of rainwater harvesting tanks for stormwater control

Stormwater Management using Rainwater Harvesting Testing the Kellagher / Gerolin methodology on a pilot study
SR 736 R. 2.0
A2 Parameter assessment for sizing of stormwater storage The following formula is used for either assessing the tank size or for estimating the rainfall depth which is served by the tank. RDnet = sP50 – Ad + (V-1)/A x CP50x1000 RDnet is the net rainfall runoff from the design storm sP50 is the coefficient of storage for 1m3 tank. Ad is the additional allowance to cater for the uncertainty of storage availability for
the design storm event (a function of Y/D) A is the roof area CP50 is the effective proportion of storage available for increasing the tank size
from 1m3 V is the stormwater control tank size. Each element of the formula and coefficient values are detailed below.
A2.1 COMPUTATION OF RDNET
The calculation of RDnet should take into consideration all of the loss elements which have been discussed in section 6.1. However care would need to be taken on assuming a significant loss from depression storage from a green roof, in that the ‘soil moisture’ state would influence the design value used. Although one might not assume the driest condition of the roof, as the largest storms up to 12 hours long occur in the summer, a relatively high value for depression storage could be assumed.
A2.2 COMPUTATION OF THE STANDARD PERCENTILE SP50
sP50 is the average amount of storage available in a storage tank for 50% of the time. This is measured in terms of millimetres of rainfall depth. This value for sP50 provides an estimate of the rainfall depth that could be catered for by providing a tank of 1m3. The value of sP50 can be calculated as follows: sP50 = (1/A) x Cs x 1000 Where: sP50 is the storage depth in terms of mm of rainfall for a tank of 1m3 A is the collection area (m2) - normally roof plan area Cs is a coefficient (0 – 1.0) which is a function of Y/D Cs is a function of Y/D and also varies slightly regionally. This regional variation is a function of rainfall characteristics. At present the methodology divides the UK into 2 regions. Table A1 provides the value of Cs.
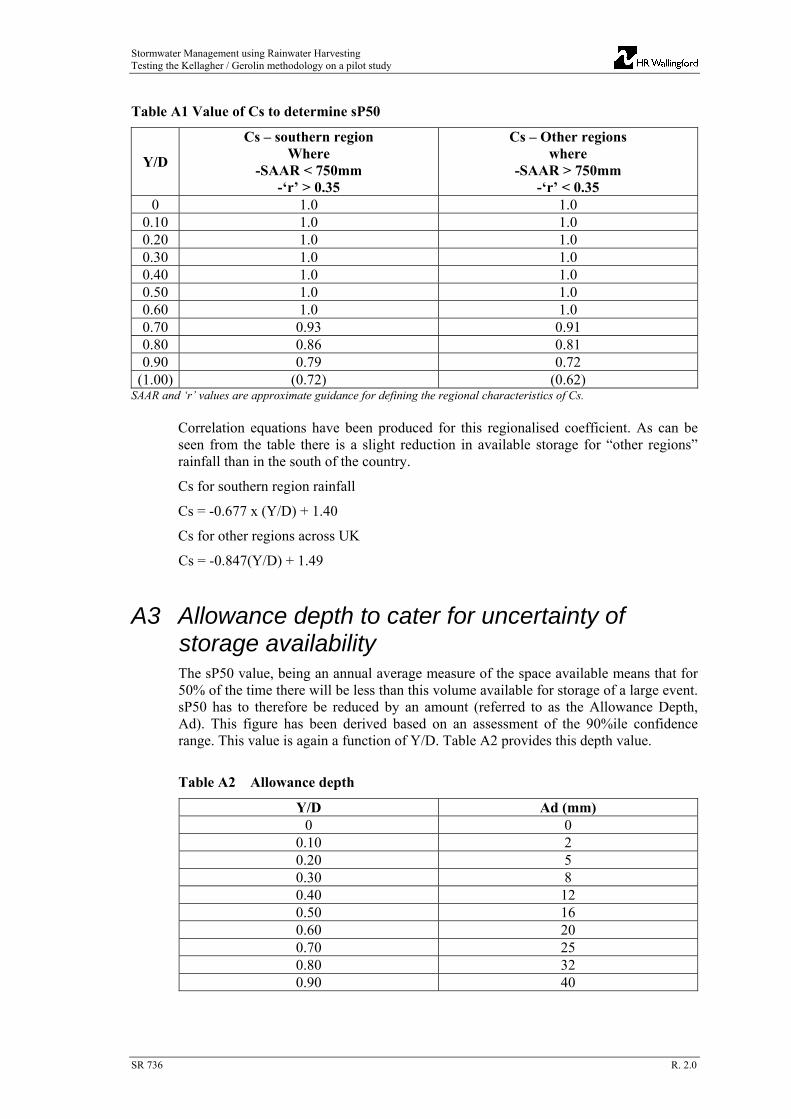
Stormwater Management using Rainwater Harvesting Testing the Kellagher / Gerolin methodology on a pilot study
SR 736 R. 2.0
Table A1 Value of Cs to determine sP50
Y/D
Cs – southern region Where
-SAAR < 750mm -‘r’ > 0.35
Cs – Other regions where
-SAAR > 750mm -‘r’ < 0.35
0 1.0 1.0 0.10 1.0 1.0 0.20 1.0 1.0 0.30 1.0 1.0 0.40 1.0 1.0 0.50 1.0 1.0 0.60 1.0 1.0 0.70 0.93 0.91 0.80 0.86 0.81 0.90 0.79 0.72
(1.00) (0.72) (0.62) SAAR and ‘r’ values are approximate guidance for defining the regional characteristics of Cs.
Correlation equations have been produced for this regionalised coefficient. As can be seen from the table there is a slight reduction in available storage for “other regions” rainfall than in the south of the country.
Cs for southern region rainfall
Cs = -0.677 x (Y/D) + 1.40
Cs for other regions across UK
Cs = -0.847(Y/D) + 1.49
A3 Allowance depth to cater for uncertainty of storage availability The sP50 value, being an annual average measure of the space available means that for 50% of the time there will be less than this volume available for storage of a large event. sP50 has to therefore be reduced by an amount (referred to as the Allowance Depth, Ad). This figure has been derived based on an assessment of the 90%ile confidence range. This value is again a function of Y/D. Table A2 provides this depth value.
Table A2 Allowance depth
Y/D Ad (mm) 0 0
0.10 2 0.20 5 0.30 8 0.40 12 0.50 16 0.60 20 0.70 25 0.80 32 0.90 40

Stormwater Management using Rainwater Harvesting Testing the Kellagher / Gerolin methodology on a pilot study
SR 736 R. 2.0
The correlation equation for Ad is: Ad = 31.06(Y/D)2 + 15.08(Y/D) + 0.36 Where Y/D is around 1.0 the uncertainty for this allowance is greatest and although an Allowance Depth of 40mm has not been found to be exceeded, it must recognised that the uncertainty of storage availability is at its greatest where Y/D is between 0.9 and 1.0. It also means that sizing of stormwater tanks is extremely cautious by effectively adding 40mm to the design rainfall depth being catered for. Therefore the storage depth available in a 1m3 tank for absorbing a rainfall event is: sP50 = (1/A) x Cs x 1000 – Ad This value is likely to be negative if Y/D is above 0.6, depending on the size of the roof area.
A4 Coefficient CP50 for additional storage To ensure a specific flood event can be catered for it is therefore necessary to increase the size of the tank. However increasing the tank size does not increase the available storage by the same amount. Where Y/D > 0.6, the effective storage volume provided is less than the increase in tank size. This relationship is linear for any specific value of Y/D > 0.6 up until Y/D = 1.0, but with the proportion of effective storage becoming less as Y/D increases. (Beyond this point the relationship is not linear, and eventually where Y/D is significantly greater than 1.0, any additional storage has virtually no benefit). Table A3 details the effective additional storage provided when increasing the tank size. As with CS, this coefficient has a slight regional variation.
Table A3 Increase in effective storage per unit increase in the size of the tank
Y/D
CP50 – southern region Where
-SAAR < 750mm -‘r’ > 0.35
CP50 – Other regions where
-SAAR > 750mm -‘r’ < 0.35
0.0–0.6 1.00 1.00 0.7 1.00 0.97 0.8 0.92 0.85 0.9 0.78 0.66 1.0 0.57 0.38
SAAR and ‘r’ values are approximate guidance for defining the regional characteristics of Cs. Correlation equations have been produced for this regionalised coefficient. As can be seen from the table there is a slight reduction in available storage for “other regions” rainfall than in the south of the country.
CP50 for southern region rainfall
CP50 = -3.29(Y/D)2 + 4.16(Y/D) – 0.3
CP50 for other regions rainfall
CP50 = -4.06(Y/D)2 + 4.94(Y/D) – 0.5

Stormwater Management using Rainwater Harvesting Testing the Kellagher / Gerolin methodology on a pilot study
SR 736 R. 2.0
Appendix B Discussion on design considerations
B1 Design rainfall depth The depth of rainfall to be controlled by any rainwater harvesting system need not meet any specific criterion because it is the development as a whole which will need to comply with the various discharge limits. It is suggested that designing to provide storage for a 100 year 6 hour event (which is of the order of 60mm) would not require an overflow to the positive drainage system and that roof areas served would be assumed to have met the 100 year requirements. This proposal is based on the assumption that any excess flows would be stored as local flooding and not pass to the site drainage system. However a conservative alternative position would be to assume that rainfall depths greater than 60mm are picked up by the drainage system. If storage is provided for a smaller event, then it is probably more appropriate to assume that excess rainfall runoff is specifically catered for in the site drainage calculations. The logic for using the 100 year 6 hour event is linked to current drainage design criteria associated with controlling excess runoff from the site. Appendix C provides a map of the UK showing rainfall depths for the 100 year 6 hour event. It also includes the Annual rainfall map of the UK.
B2 Collection area This is the plan area of the roof or other collection area which is to be drained to the rain water harvesting unit. Modification of this value to allow for pitch and alignment to the prevailing wind is not usually made. It should be noted that it is often not possible to drain the whole roof of a property to the rainwater harvesting tank. An example is a terraced house where runoff can only collected either at the front or the back of the property. It is important to take into account the actual surfaces drained to the tank when calculating the rainfall yield. Collection from surfaces other than roofs has implications in terms of higher levels of pollutants which are a function of the use of the surface. It should be noted that roof runoff is not ‘clean’. In particular TV aerials and similar objects are often a focus for resting birds. This and other aspects of roof characteristics should be considered to minimise the amount of pollution in the rainwater collected. Green roofs, although uncommon to date, can be used for collection of rainwater. Although they appear to be mutually exclusive, in fact there is good reason for using them together. Where a collection surface has Y/D >1.0 which would be the case in many situations, this can be addressed by using a green roof to make use of the storage and the evapotranspiration losses and significantly reduce the net rainfall runoff. The current methodology requires modifying for green roofs because the variability of the depression storage through the year requires explicit consideration. With regard to the debate on water quality implications of green roofs, there is little consensus on this point, but experience from Sweden indicates that this is unlikely to be an issue.

Stormwater Management using Rainwater Harvesting Testing the Kellagher / Gerolin methodology on a pilot study
SR 736 R. 2.0
B3 Demand from irregular usage and commercial/ industrial buildings Where non-residential properties are being assessed for demand, or where other uses for the rainwater are being considered, it is more difficult to assess the demand and the effect this has on residual storage available. However it is still possible to use the design method by carrying out a time series rainfall analysis using a series of 3 to 5 years. The only difference is that, depending on the relative infrequency of various demands, the variability of the storage available may be significantly greater and an allowance should be made for this in some way. Therefore the coefficient Ad may be inadequate for this type of application. This is relatively easily catered for by analysing the continuous analysis results by using a more conservative assessment of available storage by taking the 80th or even 90th percentile value of storage depth availability. As the analysis would probably be carried out using the likely tank size, the use of CP50 would no longer be needed. It is suggested that the increased uncertainty is not only associated with the irregularity of demand, but also the demand quantity. It is therefore recommended that the limit of Y/D would be reduced from 0.95 to a value appropriate for the uncertainty of the demand if the rainwater harvesting system was to be used for stormwater control. Calculation using a time series is recommended for all situations where: All commercial and industrial buildings unless only standard toilet usage is used
and assuming the occupancy levels are likely to be relatively constant; the demand is irregular (external use, non-residential use, tourism, irrigation, etc); where the yield is more uncertain (use of green roofs, permeable pavements etc); where the seasonality of the rainfall is more skewed (overseas or possibly the
future climate rainfall in the south east of UK); where costly, large or complex rainwater harvesting systems are proposed.

Stormwater Management using Rainwater Harvesting Testing the Kellagher / Gerolin methodology on a pilot study
SR 736 R. 2.0
Appendix C Rainfall maps
SAAR (annual rainfall depths)

Stormwater Management using Rainwater Harvesting Testing the Kellagher / Gerolin methodology on a pilot study
SR 736 R. 2.0
6
4
5
6
2
3
10
1
1 2 3 4 5
8
7
9
4
3
3
2
2
Irish grid
1
National grid
1007525
kilometers
500
M 6 hr - Rainfall depth100
61 mm
55 mm
60 mm
51 mm
82 mm
70 mm
63 mm
71 mm
100 year 6 hour rainfall depths (based on FSR)

Stormwater Management using Rainwater Harvesting Testing the Kellagher / Gerolin methodology on a pilot study
SR 736 R. 2.0
Appendix D Yield over Demand probability calculation
This statement summarises the mathematical basis for assessing the proportion of non-compliant properties which do not meet the limiting ratio of Y/D by taking into account the variability of household occupancy. For a house with N bedrooms, the number P of people living in the house and potentially also the roof area A are unknown but have known population means and standard deviations. The demand D is a function of the number of people P:
D(P) = d P, where d is the demand per person. Similarly yield Y is a function of the roof area A:
Y(A) = y A, where y is the yield per unit area. We are interested in the yield over demand, Y/D, and in particular whether this value exceeds a fixed constant c = 0.95. We focus only on N bedroom houses a roof area A below a threshold u. This threshold is selected so that houses with this roof area and an average number of people will have a Y/D ratio equal to another constant cu, which may or may not equal the fixed value c = 0.95. That is:
Pd
yu
PD
uYcu
)(
)(,
which gives
y
Pdcu u
where P is the average number of people living in a N bedroom house. We wish to calculate the probability that the yield over demand ratio exceeds the fixed constant c = 0.95 when the roof area is below the threshold u. This is:
P(Y/D > c | A ≤ u). Assumptions: To calculate this conditional probability, we need to assume probability distributions for the number of occupants P and the roof area A of a house with N bedrooms. We must also define the dependence between these variables, if any. Firstly, we assume that P and A are independent, i.e. that the number of occupants and the roof area of a house with N bedrooms are unrelated. For the unknown roof area A, we assume a Normal distribution which has parameters μ and σ that equal the known mean and standard deviation respectively.

Stormwater Management using Rainwater Harvesting Testing the Kellagher / Gerolin methodology on a pilot study
SR 736 R. 2.0
For the number of occupants P, we assume there is at least one occupant and propose a discrete distribution for K = P – 1 to match the known mean and standard deviation of
P. That is, K should have mean value P – 1 and standard deviation ν where P is the mean and ν the standard deviation of P. There are many discrete distributions with two unknowns that could be selected for K but we have selected the Binomial distribution with unknown parameters n and q since it has a variance less than the mean as observed
in the known values of P – 1 and ν. Formula 1: Roof area known: If the roof area A has a known value a, we know whether or not the value lies below the threshold u. Assuming this to be true, the above assumptions give: P(Y/D > c | A ≤ u) = P(P < ya / (cd))
= P(P ≤ ⌈ya / (cd)⌉ – 1),
where ⌈ya / (cd)⌉ denotes the smallest whole number greater or equal to ya / (cd). This probability depends upon the distribution selected for random number of occupants P. If we assume P = K + 1 where K is Binomial, these probabilities are found using:
P(P ≤ p) = P(K ≤ p – 1) Where the probabilities P(K ≤ k) are found using the distribution K ~ Binomial(n, q) where
n =2
2
1
)1(
P
Prounded to nearest integer and q =
n
P 1
for P and ν the known mean and standard deviation of P respectively. Formula 2: Roof area unknown: With the roof area also unknown, the above assumptions give:
P(Y/D > c | A ≤ u) =
)()(
)/(1
/
1
pPPuAP
ycdpAPccP
p
u
,
where ccP u / denotes the largest whole number less or equal to the average number of
occupants P multiplied by the ratio of constants cu/c. The probabilities P(A ≤ a) are cumulative probabilities from the distribution A ~ Normal(μ, σ2) for μ and σ the known mean and standard deviation of A respectively. The probabilities P(P = p) depend upon the distribution of the number of occupants P. If we assume P = K + 1 where K is Binomial as above, these are found as:
P(P = p) = P(K = p – 1). Derivation: For the known roof area case, we assume the roof area a lies below the threshold u so that:
P(Y/D > c | A ≤ u) = P(Y/D > c).
This probability depends upon a single random number P, the unknown number of occupants in a house with N bedrooms. Rearranging as a probability of P we obtain:

Stormwater Management using Rainwater Harvesting Testing the Kellagher / Gerolin methodology on a pilot study
SR 736 R. 2.0
P(Y/D > c) = P(ya / (dP) > c) = P(P < ya / (cd)). Since the number of occupants P is integer-valued, this probability equals
P(P ≤ ⌈ya / (cd)⌉ – 1) =
1)/(
0
)(cdya
p
pPP
hence the result. The probability P(P = p) represents the chance of a house with N bedrooms being occupied by p people. We assume P is at least 1 which gives P(P = 0) = 0 so that the sum can begin at 1 rather than 0. Setting P = 1 + K, we have:
P(P = p) = P(K = p – 1), where these probabilities are given by the distribution for K. We assume K is Binomial(n, q) with parameters solved by matching the mean and standard deviation of
P to known values of P and ν respectively, giving the formulae above. In the unknown roof area case, the target probability depends upon the randomness of two variables: the roof area A and the number of occupants P. These can be separated by taking:
P(Y/D > c | A ≤ u) = EP( P(Y(A) / D(p) > c | A ≤ u, P = p) ) which is the expected value with respect to P of a probability involving only A. The inner probability, in which P has a known value p, is given by: P(Y(A) / D(p) > c | A ≤ u, P = p) = P(y A / (dp) > c | A ≤ u, P = p) = P(A > cdp / y | A ≤ u, P = p)
= )(
)|/(
uAP
pPuAycdpP
as long as p ≤ ccP u /
= 1 – )(
)|/(
uAP
pPycdpAP
as long as p ≤ ccP u /
This gives a non-zero probability only when p ≤ ccP u / . The expectation therefore only
depends upon possible numbers of occupants less or equal to P multiplied by the ratio of constants cu/c. This gives:
P(Y/D > c | A ≤ u) =
)()(
)/(1
/
0
pPPuAP
ycdpAPccP
p
u
.
We again use the Binomial assumption for K = P – 1 to calculate the probabilities P(P = p) to obtain the formulae above. Example 1:
For houses with 2 bedrooms, the average number of occupants is P = 1.72 with standard deviation ν = 0.73. The demand per person is d = 40 and the yield per unit roof area is y = 1.41.

Stormwater Management using Rainwater Harvesting Testing the Kellagher / Gerolin methodology on a pilot study
SR 736 R. 2.0
If we are interested in a critical yield over demand value of cu = 0.95, the critical roof area is given by u = 0.95 * 40 * 1.72 / 1.41 = 46.35. We assume a two-bedroom property has known roof area a = 42 which is below the critical threshold. For this, using the above formula, we find the probability of the yield over demand exceeding c = 0.95 is 0.44 (i.e. a 44% chance). This probability is represented below as the red shaded area on the probability mass function of P. Since ya / (cd) = 1.6, the probability is P(P < ya / (cd)) = P(P ≤ 1) so the answer in this case depends only upon the chance of having one person in a two-bedroom house. If the roof area was just below the critical threshold of 46.35, the probability would remain the same since ya / (cd) would still be below 2.
Example 2: We now assume the roof area is unknown with a two-bedroom average of μ = 42 with standard deviation σ = 6.9. Using the same values as Example 1 above, we now use the second formula to calculate the target probability. This gives the probability of the yield over demand exceeding c = 0.95 when the roof area is below 46.35 as 0.43 (i.e. a 43% chance). This probability is represented in the diagram below. The probability distributions of P and A combine to give the sampled points shown in the bottom-left panel. Red values indicate that Y/D > c and the proportion of these gives a Monte Carlo estimate of the target probability.

Stormwater Management using Rainwater Harvesting Testing the Kellagher / Gerolin methodology on a pilot study
SR 736 R. 2.0
Applying the same method to data on houses with 3 and 4 bedrooms gives the following probabilities:
Number of bedrooms N 2 3 4 Number of occupants P: mean (sd) 1.72 (0.73) 2.38 (0.97) 2.97 (1.12)
Roof area A: mean (sd) 42 (6.9) 49.7 (6.9) 74 (8) Critical roof area u (using cu = 0.95) 46.35 64.14 80.04
P(Y/D > 0.95 | A ≤ u) 0.430 0.284 0.345 These are demonstrated by the plots below which show the distribution of P with a Monte Carlo estimate of the probability as the proportion of red samples.

Stormwater Management using Rainwater Harvesting Testing the Kellagher / Gerolin methodology on a pilot study
SR 736 R. 2.0
Example 3: Using the same parameters as Example 2 but selecting the critical roof area u using a smaller yield over demand value of cu = 0.8 gives the following probabilities:
Number of bedrooms N 2 3 4 Number of occupants P: mean (sd) 1.72 (0.73) 2.38 (0.97) 2.97 (1.12)
Roof area A: mean (sd) 42 (6.9) 49.7 (6.9) 74 (8) Critical roof area u (using cu = 0.8) 39.04 54.01 67.40
P(Y/D > 0.95 | A ≤ u) 0.420 0.187 0.340
These are demonstrated as before by the plots below. Compared to Example 2, the distributions of P and A are unchanged but the lower critical roof area affects the final probabilities.

Stormwater Management using Rainwater Harvesting Testing the Kellagher / Gerolin methodology on a pilot study
SR 736 R. 2.0
Appendix E Active management of rainwater harvesting systems – an overview
E1 Introduction This statement is a brief exploration of the options of using Active control to manage tank storage in rainwater harvesting systems in order to minimise the storage volume and maximise the probability of storing runoff from a large rainfall event. It is important to note that with the use of Active control the important condition of Y/D having to be less than 0.95 is removed as a constraint, thus making it applicable for all properties and locations in the UK. Rainwater harvesting systems are currently operated in a passive manner. This means that runoff is stored until needed, and if it is already full, an overflow comes into operation. In many cases “overflow” means over-filling and flooding out from the unit, as many tanks are not directly connected to a positive drainage system or infiltration unit / soakaway. The premise in this report is that any overflow is actively drained and thus the overflow volume has an impact downstream when the tank is over-filled. It is worth noting that the operation of a tank overflow is generally regarded as a good thing in that floating material is removed, thus keeping the system “cleaner”, although the evidence associated with this benefit is limited. In the case where Y/D < 0.95, the operational frequency of an overflow is rare; this depends on the size of the tank and the Y/D ratio. If it is designed for stormwater management of a 60mm storm, as suggested in this report, the overflow operation will be infrequent, but as the results still show (Figures 10.6 and 10.7) small overflow spills will always occur; Y/D of around 0.65 having around 20 to 30 generally very small spills in 100 years while Y/D of 0.95 would probably have more than one spill every year. Thus a tank would have to be very large and Y/D < 0.95 to guarantee no overflow taking place. This discussion on overflow operation is relevant to Active control systems in that an overflow is less likely to take place if the system is designed to ensure sufficient storage is maintained at all times in a tank to store the runoff from an extreme event. However, even in this situation it is likely that some spills will still occasionally occur, depending on the operational rules and Y/D ratio. These spills would only be associated with extreme events that are larger than the design event.
E2 Active control decision rules Active control of the storage in a tank means that storage has to be maintained so that there is room for runoff from a large rainfall event. Clearly if a tank has been filled by such an event, any decision to empty a tank must aim to avoid the tank being emptied at a time when the downstream system is under “stress”. This means that the tank must not be emptied when: 1. A significant rainfall event is likely to happen in the near future; or 2. A system downstream is currently under stress from an event. Forecasting of rainfall In the first case a decision rule requires the ability to forecast a large event likely to occur in the near future. This might mean 1 to 3 hours if the system to be protected is

Stormwater Management using Rainwater Harvesting Testing the Kellagher / Gerolin methodology on a pilot study
SR 736 R. 2.0
the drainage system downstream (plus the time to empty the tank), or even 1 to 3 days if it is a water course to be protected. A duration longer than a day is unlikely to be relevant as this implies a very large hydrological catchment and it is not conceivable that volumes in rainwater harvesting tanks city wide (or even large detention basins) having an impact where a forecast of 3 days is critical for the catchment. Although rainfall forecasting is still in development, examples of this application already exist in USA Werf (2011)[1]. The advantage of this approach is that retention of runoff is maximised. However it should be noted that where demand is fairly regular and consistent, the benefit of retaining water as long as possible and only creating storage when it is needed is likely to be limited, subject to hydrological conditions. Where Y/D is < 1.0 studies have shown that where storage exceeds 5% of Demand, around 75 – 85% of the runoff is utilised. Where the reverse is the case (Y/D > 1.0) the tank will tend to overfill and it will fill and then spill regularly anyway so consumption will approach 100% of Demand. Where this approach may have considerable benefits is where stored water needs to be maximised and is used for special circumstances (irrigation at times of extended dry periods) or to capture wet season rainfall for use at other times. Discharge during periods of zero stress in the system downstream If the technology and investment is not available for forecasting rainfall, the alternative approach is to create the spare storage in the tank at a time when the system downstream is not under stress. In practice drainage systems are rarely under stress, thus any event of say more than 20 mm in a day may only occur a few times in a year, and larger events even less frequently. Thus emptying a tank is only going to be a problem if this is carried out at the time of an extreme event or very shortly thereafter. This implies that a simple timer system linked to a raingauge would allow emptying of a tank some time after an event if water levels have exceeded a threshold in the tank. In practice this arrangement of linking the tank state to a raingauge, although quite feasible technically, has implications of cost and complexity which are preferably avoided. However the concept of rainfall measurement can be derived from water level depth change in the tank using ultrasonic measurement or a more coarse set of assumptions; for example pumping down to the defined storage level if a set point has been exceeded for more than a day, but only pumped down two days later if a second, higher set point is exceeded. However this second set point is probably an unnecessary refinement. This strategy would need to be tested for both Y/D < 1.0 and also Y/D > 1.0, but it is likely that this would be very effective in guaranteeing sufficient storage for large events. In terms of the practicalities of tank design and operation, such a set of control rules is relatively simple; effectively this capability is already used for small waste water pumping stations, though a timer to delay action is not normally required.
E3 The mechanics of operating an Active control system The mechanics of operating an Active control rainwater harvesting system does not require two pumps; one for normal operation and one for emptying the tank when needed. In most cases this process could be based on using the same pump to its normal

Stormwater Management using Rainwater Harvesting Testing the Kellagher / Gerolin methodology on a pilot study
SR 736 R. 2.0
destination (a header tank), but the overflow from that unit will need to be specifically designed to capture potentially frequent discharges. The overflow system must be capable of easily passing the maximum pump flow rate. All that is required is for at least one, possibly two, float switches to be used to trigger the drawdown in the tank when it over-fills, and a timer to delay this action.
Switch levels
Stormwater storage
Water saving
Figure E1 Rainwater harvesting tanks with Active control for stormwater management
It is worth noting that when Y/D exceeds 1.0, the operation of this drawdown and overflow discharge will become relatively frequent.
E4 Sizing of Active control tanks The size of a rainwater harvesting system needs to decide on: The storage needed for normal water supply; The size of the storage needed to store the design depth of an extreme event; The pump set point(s) for triggering the pump to maintain adequate storage for an
extreme event. Storage for normal water supply The 5% rule is a reasonable rule of thumb (the smaller of the two volumes of 5% of the

Stormwater Management using Rainwater Harvesting Testing the Kellagher / Gerolin methodology on a pilot study
SR 736 R. 2.0
annual Yield or Demand) for sizing tanks. In practice this can be reduced if Y/D is either significantly less than 0.7 or greater than 1.3. Analysis has shown that little water is lost where tanks are sized for 10 days for ratios that are much higher or lower than 1.0. However where Demand or rainfall is very variable in time, analysis would be needed to ascertain an optimum size for the rainwater harvesting tank. Size of the storage for the design event This is entirely a function of cost, space available and benefits associated with reducing runoff volumes. As this volume needs to available for an extreme event occurring it can only be used as part of the storage for normal water saving where a predictive approach on extreme event rainfall is taken. Thus the minimum storage provision in a tank would normally be equal to the selected design event runoff and the storage volume for saving water. Set point for maintaining adequate storage for extreme events Where Y/D exceeds 1.0 the tank will normally continue to fill and therefore drawdown of the water in the tank will happen fairly frequently. At this stage it is unclear what the design buffer storage depth should be and whether this should be linked to the Y/D ratio. However it is suggested that an arbitrary value of 10mm of effective rainfall might be used. However in this case where Y/D is larger than 1.0 it may be appropriate to take the conservative view that this storage is normally not available for the extreme event storage (as the tank will often have water stored between 0mm and 10mm) depth range. However if the tank is sized on the 5% rule, it is possible that the 10mm can be taken out of this storage where the Y/D ratio allows. Drawdown of the tank would take place once the set point had been exceeded, but only pumped down to the ‘off’ switch level between 24 and 72 hours after the set point was triggered. Where Y/D is low (below 1.0) tanks are nearly always close to empty. This might mean that an extreme event may have taken place even if the 10mm set point has just been triggered. In this situation, the event should not be discharged for the allotted time needed to protect the system downstream. Therefore because it is not possible to know whether it is a minor or major event that has taken place, the drawdown delay needs to assume that it a large event has taken place. The choice of delay time is quite important in not being too soon, but the probability of back-to-back significant rainfall events occurring is probably so low as to not warrant specific calculation of a subsequent event happening within 3 days. A caveat needs to be added here; because it is possible that the “significant” event being stored may only be 10mm or 20mm. If this is the case then an event of a similar magnitude may have a relatively high probability. This discussion shows that the requirements on set points are: If Y/D is below 1.0, only one set point is needed as one must assume that the event
might have been a large one; If Y/D is significantly more than 1.0, the water conservation volume of the tank
might be assumed to be full and two set points might be useful.