overview of hazus€¦ · depth grid generated outside of hazus using hec-ras, ... functional day 1...
TRANSCRIPT
Overview of HAZUSDecember 6, 2011

2
What is HAZUS?
Risk assessment tool for analyzing potential losses from hurricane, flood, and earthquake
Uses current scientific and engineering concepts in a GIS to estimate hazard related damages
HAZUS is only an estimation tool for losses due to a disaster and could be significantly different from an actual event
3
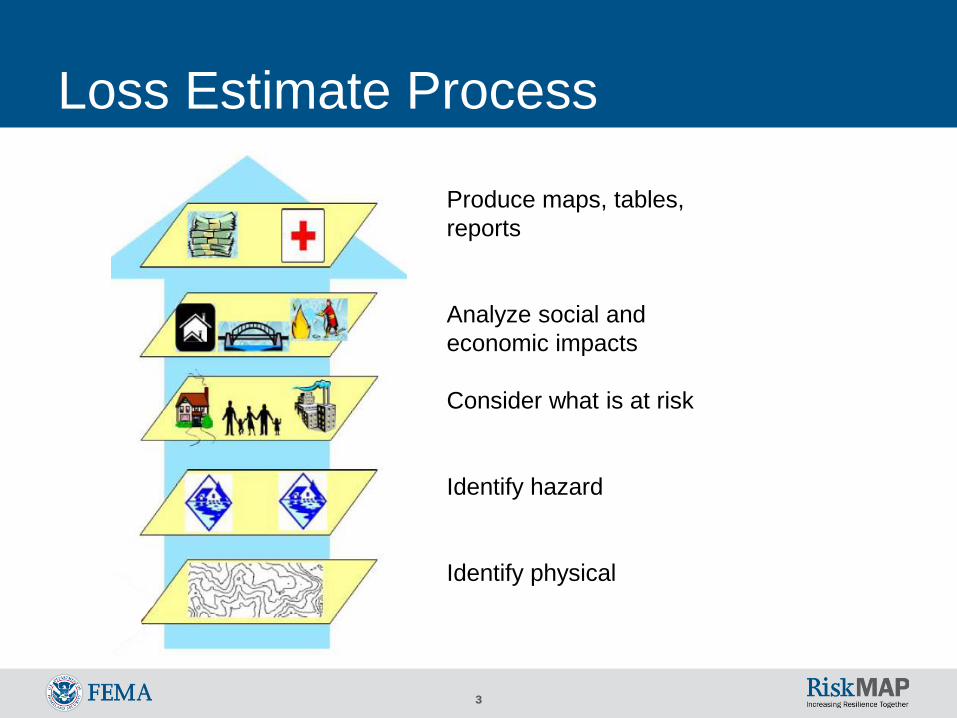
Loss Estimate Process
Produce maps, tables, reports
Analyze social and economic impacts
Consider what is at risk
Identify hazard
Identify physical
4
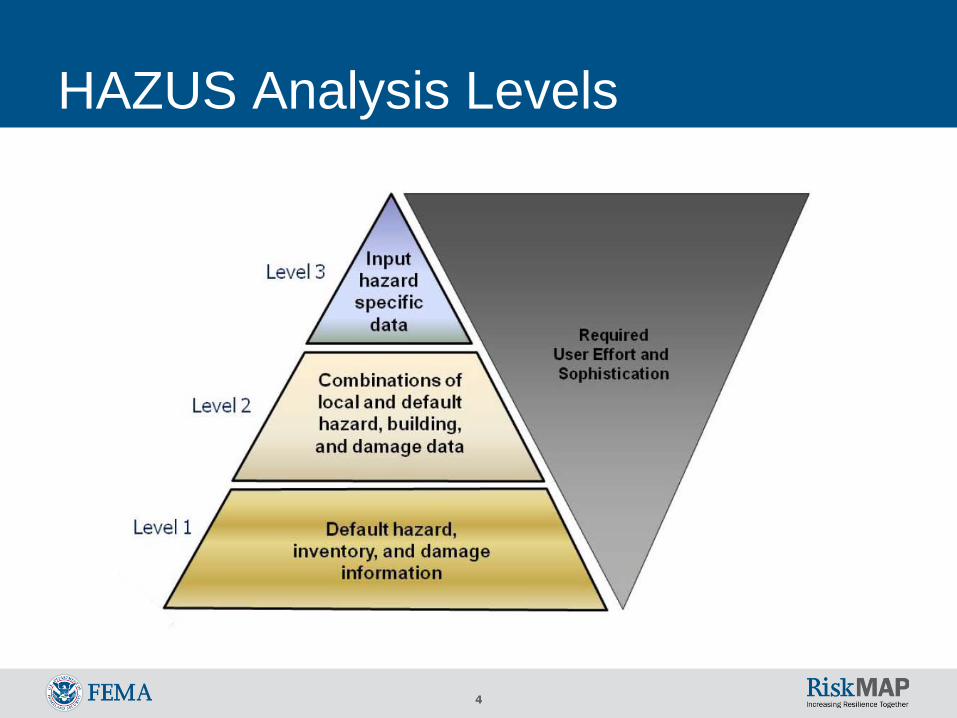
HAZUS Analysis Levels
5
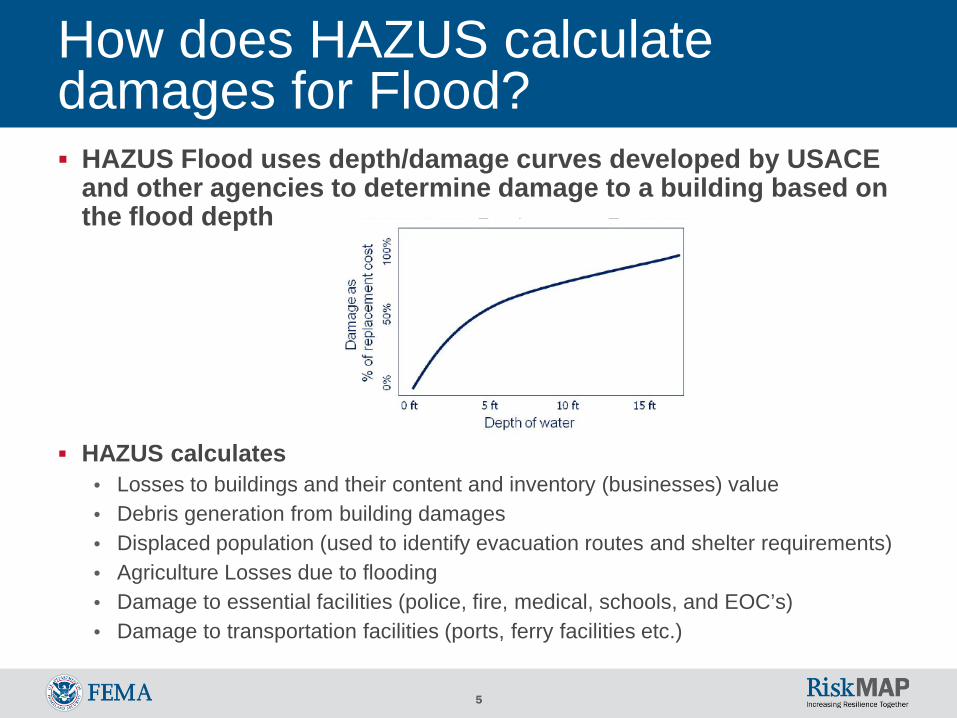
How does HAZUS calculate damages for Flood? HAZUS Flood uses depth/damage curves developed by USACE
and other agencies to determine damage to a building based on the flood depth
HAZUS calculates • Losses to buildings and their content and inventory (businesses) value • Debris generation from building damages• Displaced population (used to identify evacuation routes and shelter requirements)• Agriculture Losses due to flooding• Damage to essential facilities (police, fire, medical, schools, and EOC’s)• Damage to transportation facilities (ports, ferry facilities etc.)
6
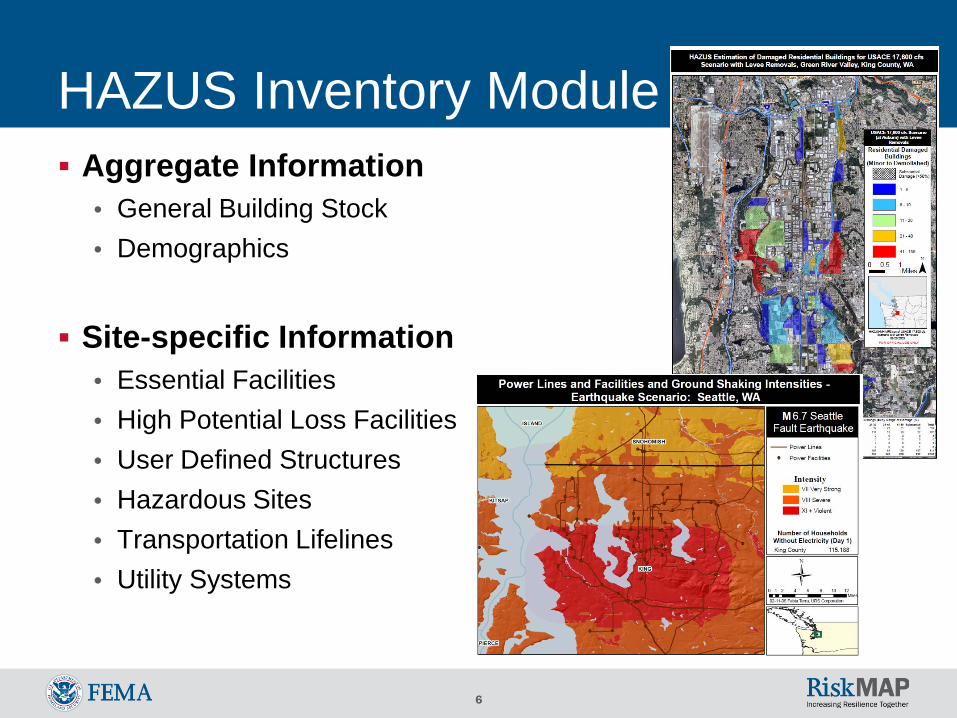
HAZUS Inventory Module Aggregate Information
• General Building Stock• Demographics
Site-specific Information• Essential Facilities• High Potential Loss Facilities• User Defined Structures• Hazardous Sites• Transportation Lifelines• Utility Systems
7
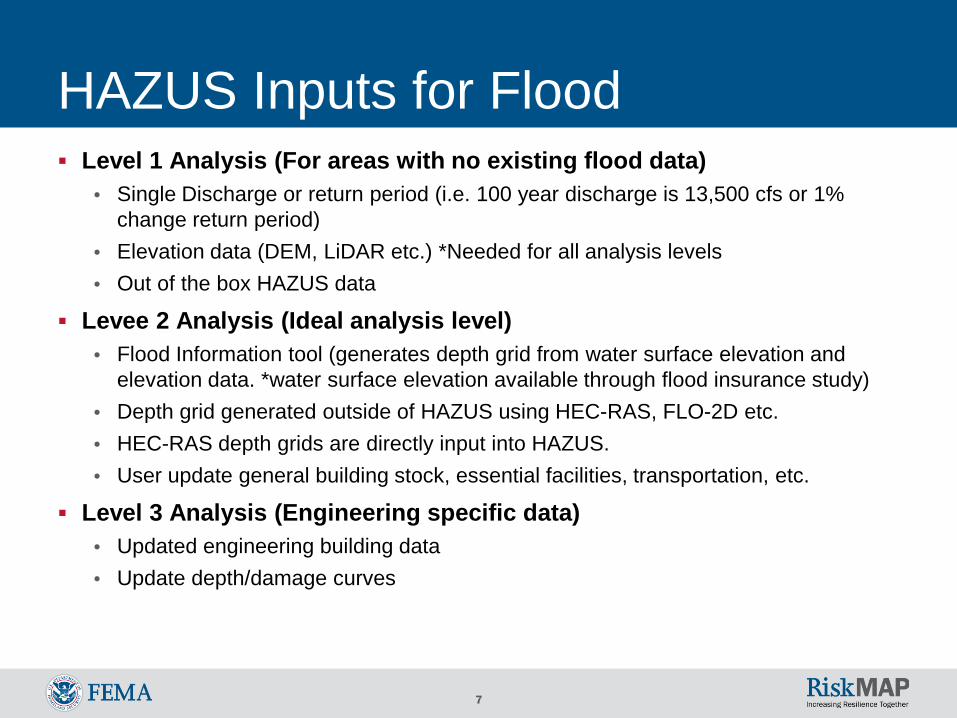
HAZUS Inputs for Flood Level 1 Analysis (For areas with no existing flood data)
• Single Discharge or return period (i.e. 100 year discharge is 13,500 cfs or 1% change return period)
• Elevation data (DEM, LiDAR etc.) *Needed for all analysis levels• Out of the box HAZUS data
Levee 2 Analysis (Ideal analysis level)• Flood Information tool (generates depth grid from water surface elevation and
elevation data. *water surface elevation available through flood insurance study)• Depth grid generated outside of HAZUS using HEC-RAS, FLO-2D etc. • HEC-RAS depth grids are directly input into HAZUS.• User update general building stock, essential facilities, transportation, etc.
Level 3 Analysis (Engineering specific data)• Updated engineering building data• Update depth/damage curves
8
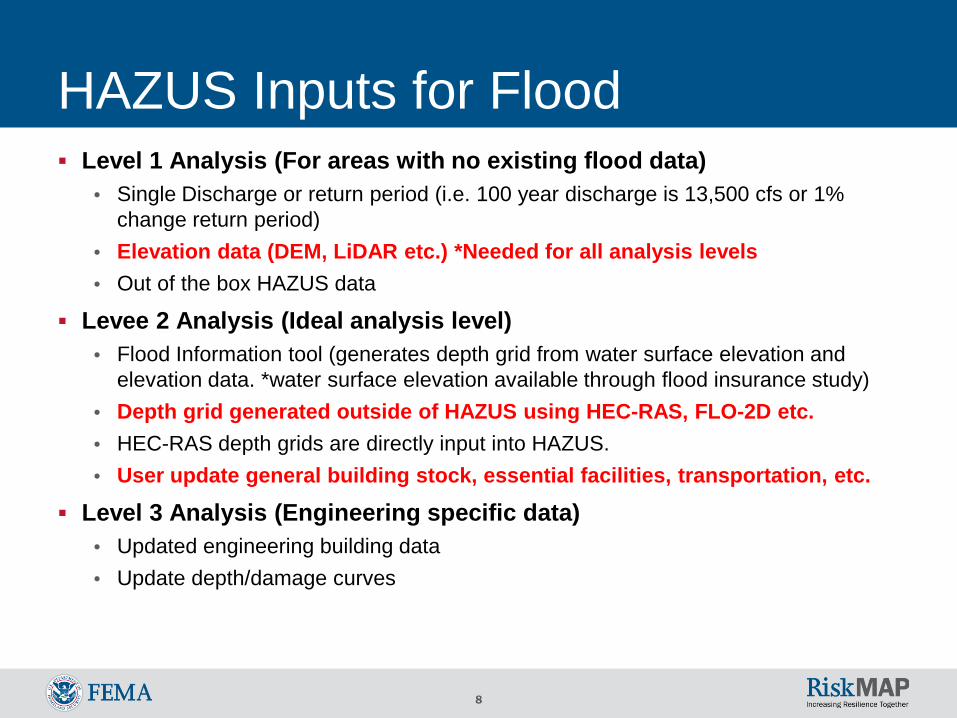
HAZUS Inputs for Flood Level 1 Analysis (For areas with no existing flood data)
• Single Discharge or return period (i.e. 100 year discharge is 13,500 cfs or 1% change return period)
• Elevation data (DEM, LiDAR etc.) *Needed for all analysis levels• Out of the box HAZUS data
Levee 2 Analysis (Ideal analysis level)• Flood Information tool (generates depth grid from water surface elevation and
elevation data. *water surface elevation available through flood insurance study)• Depth grid generated outside of HAZUS using HEC-RAS, FLO-2D etc. • HEC-RAS depth grids are directly input into HAZUS.• User update general building stock, essential facilities, transportation, etc.
Level 3 Analysis (Engineering specific data)• Updated engineering building data• Update depth/damage curves
9
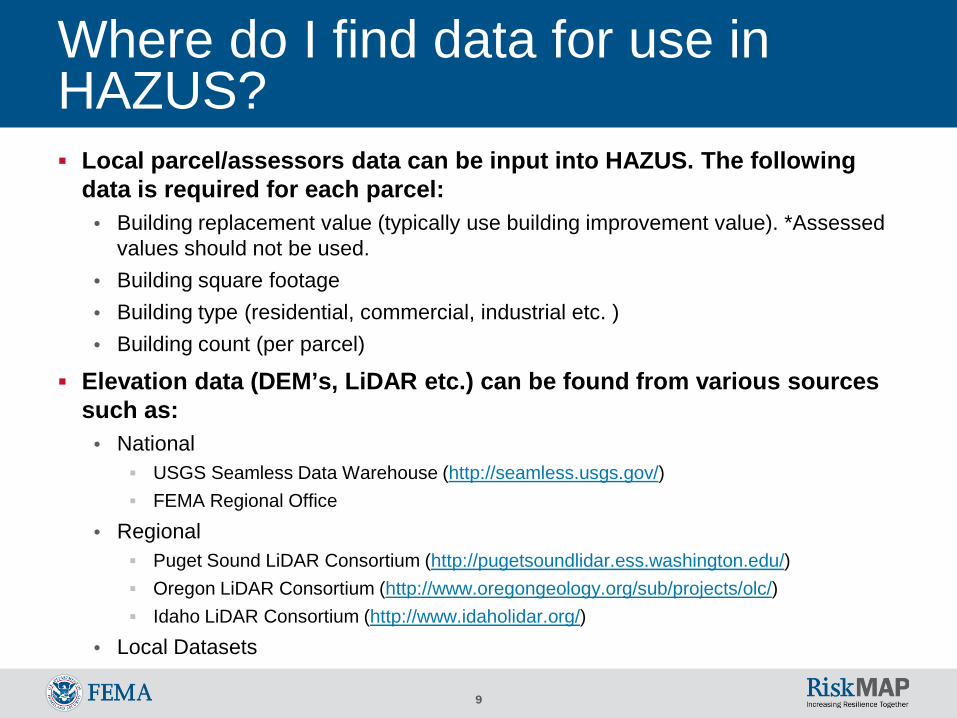
Where do I find data for use in HAZUS? Local parcel/assessors data can be input into HAZUS. The following
data is required for each parcel:• Building replacement value (typically use building improvement value). *Assessed
values should not be used.• Building square footage• Building type (residential, commercial, industrial etc. )• Building count (per parcel)
Elevation data (DEM’s, LiDAR etc.) can be found from various sources such as:
• National USGS Seamless Data Warehouse (http://seamless.usgs.gov/) FEMA Regional Office
• Regional Puget Sound LiDAR Consortium (http://pugetsoundlidar.ess.washington.edu/) Oregon LiDAR Consortium (http://www.oregongeology.org/sub/projects/olc/) Idaho LiDAR Consortium (http://www.idaholidar.org/)
• Local Datasets
10
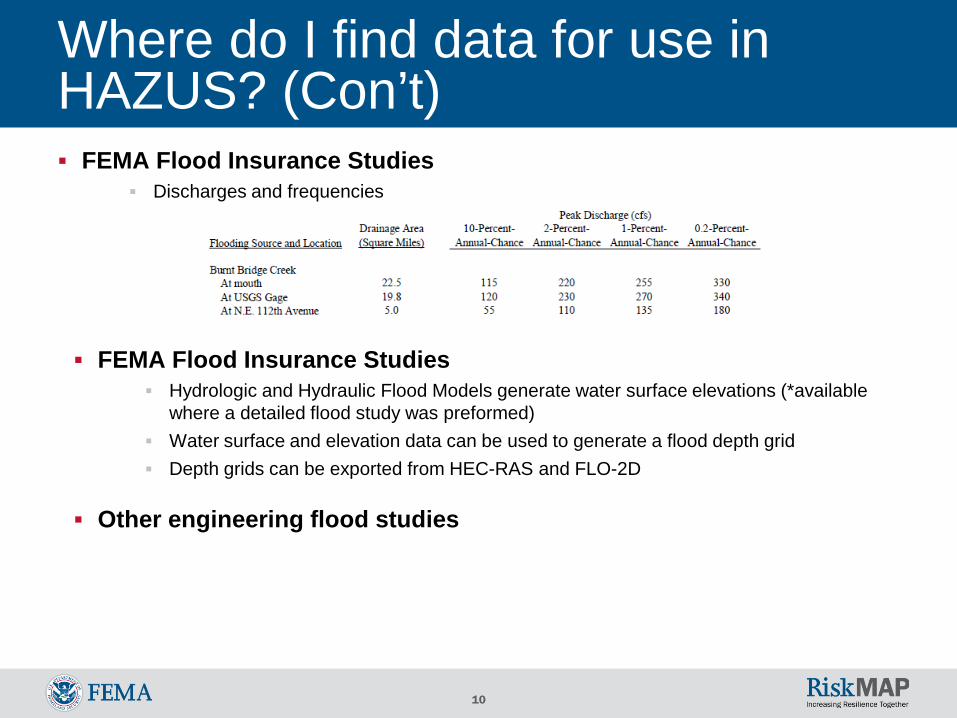
Where do I find data for use in HAZUS? (Con’t) FEMA Flood Insurance Studies
Discharges and frequencies
FEMA Flood Insurance Studies Hydrologic and Hydraulic Flood Models generate water surface elevations (*available
where a detailed flood study was preformed) Water surface and elevation data can be used to generate a flood depth grid Depth grids can be exported from HEC-RAS and FLO-2D
Other engineering flood studies
11
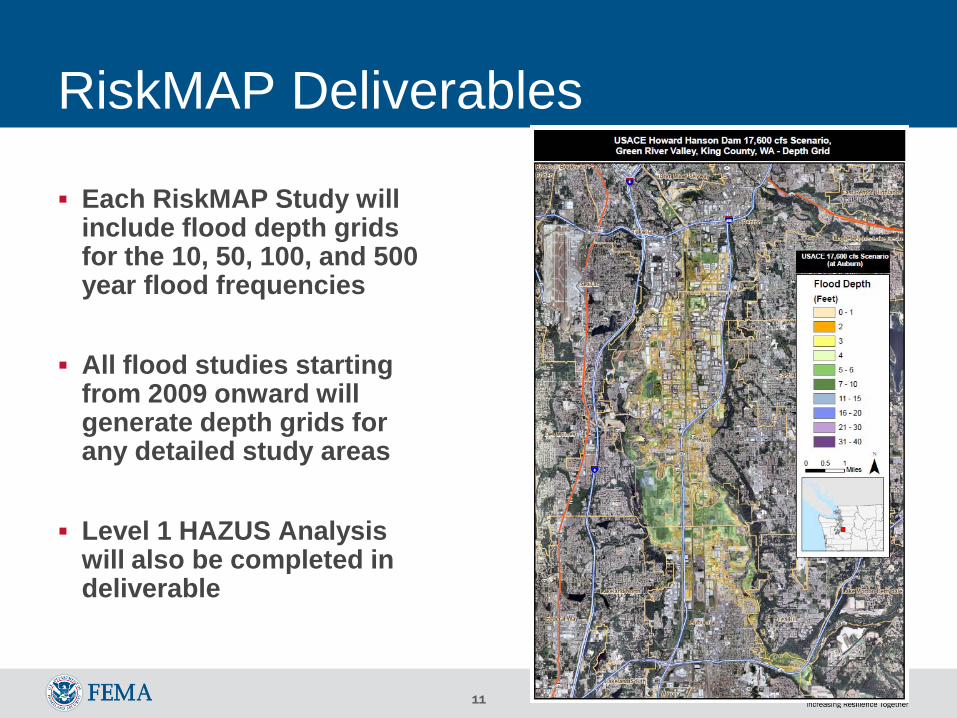
RiskMAP Deliverables
Each RiskMAP Study will include flood depth grids for the 10, 50, 100, and 500 year flood frequencies
All flood studies starting from 2009 onward will generate depth grids for any detailed study areas
Level 1 HAZUS Analysis will also be completed in deliverable
12
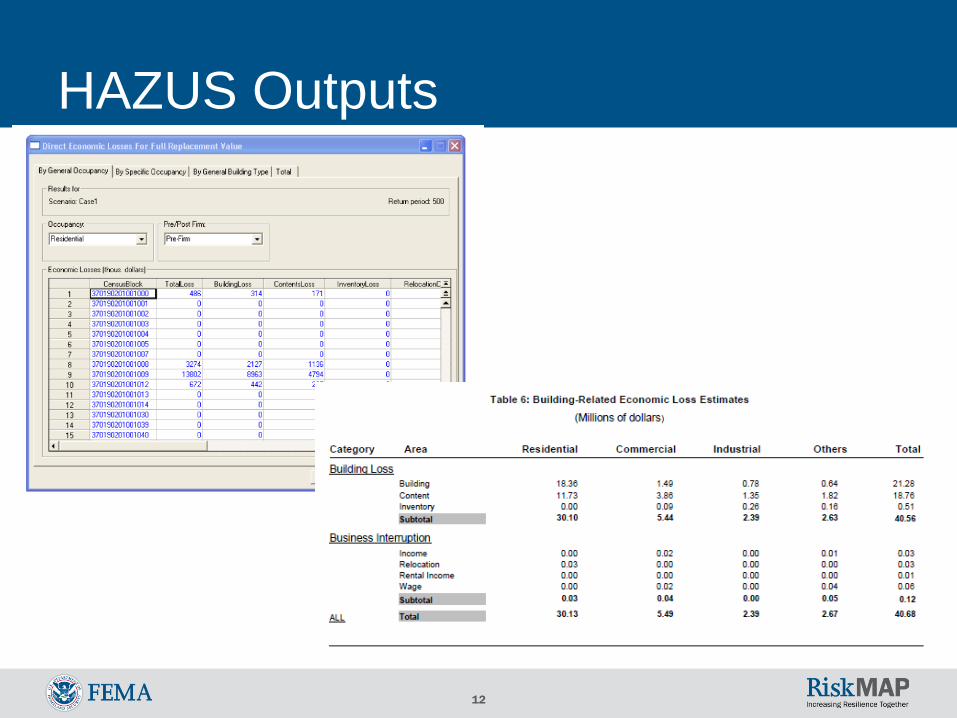
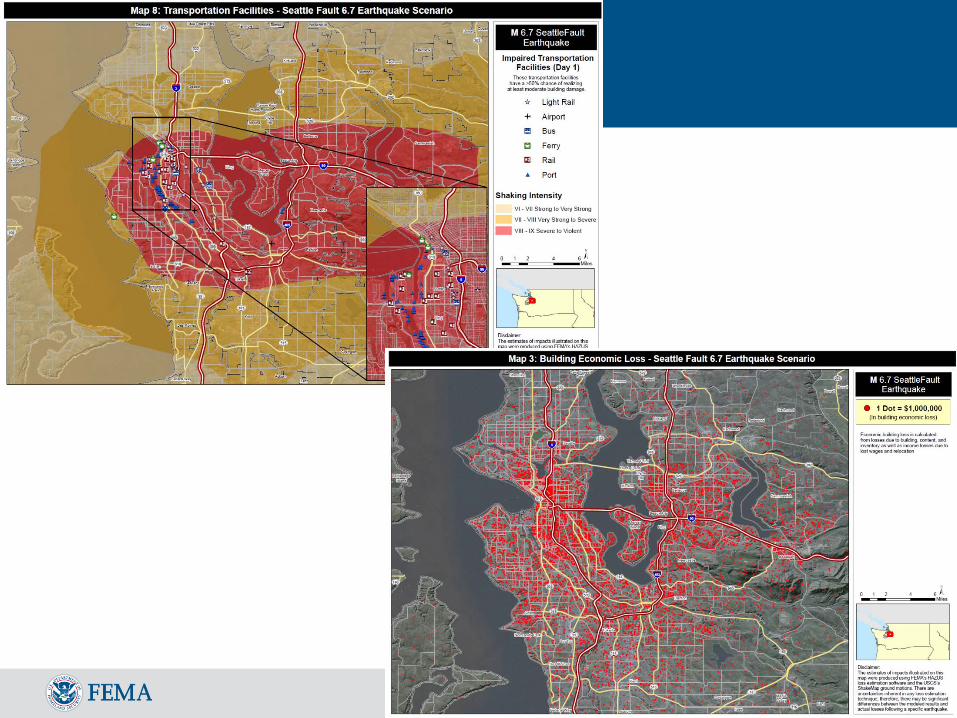
HAZUS Outputs
13
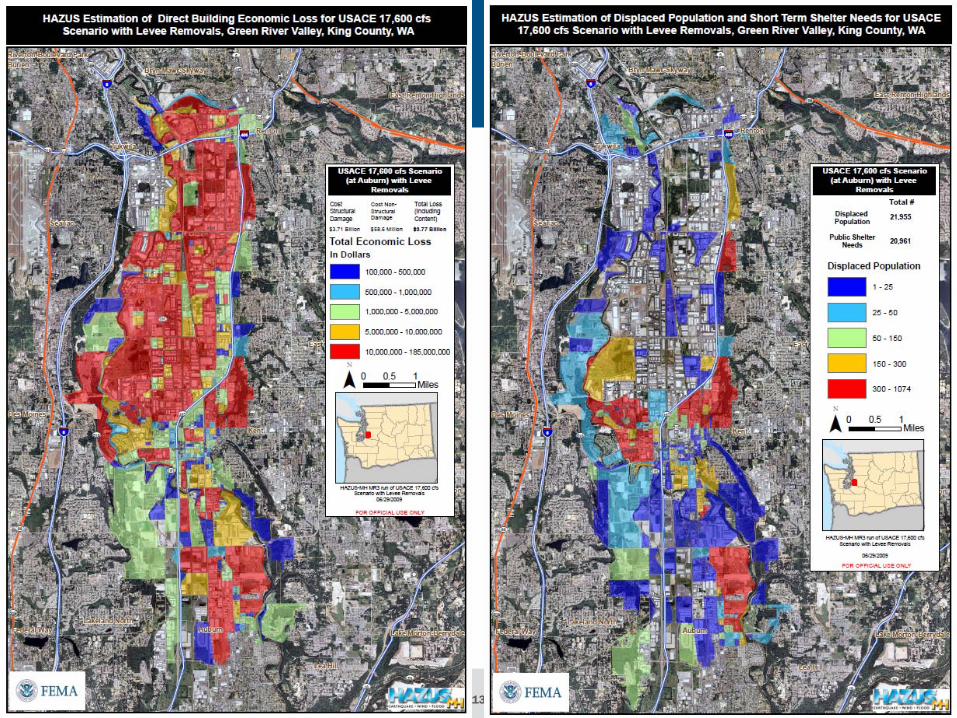
HAZUS Outputs
14
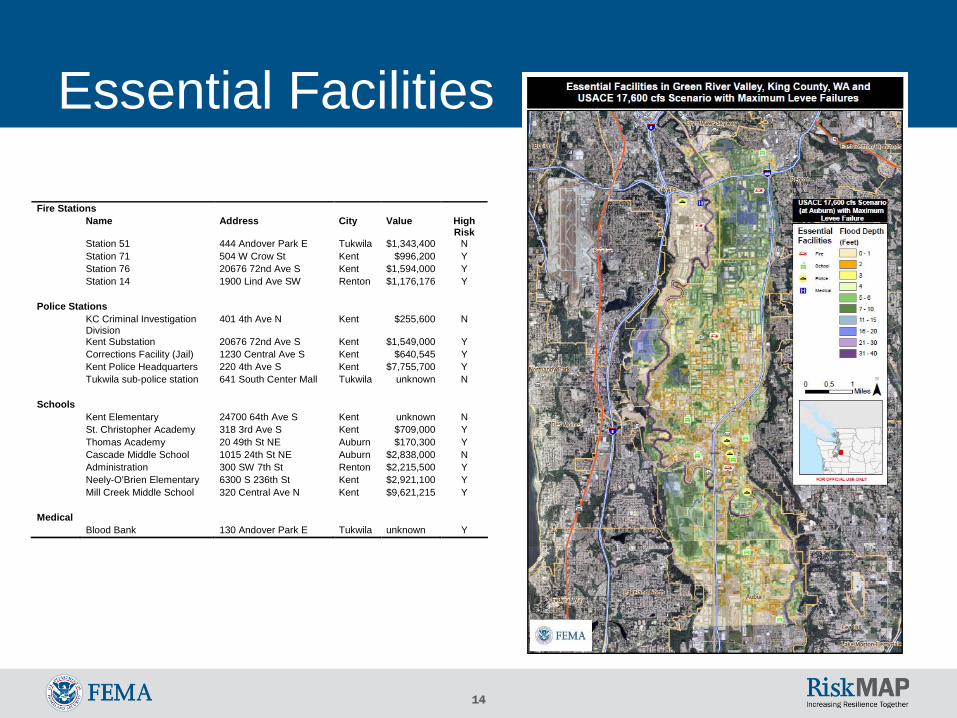
Essential Facilities
Fire Stations Name Address City Value High
Risk Station 51 444 Andover Park E Tukwila $1,343,400 N Station 71 504 W Crow St Kent $996,200 Y Station 76 20676 72nd Ave S Kent $1,594,000 Y Station 14 1900 Lind Ave SW Renton $1,176,176 Y Police Stations KC Criminal Investigation
Division 401 4th Ave N Kent $255,600 N
Kent Substation 20676 72nd Ave S Kent $1,549,000 Y Corrections Facility (Jail) 1230 Central Ave S Kent $640,545 Y Kent Police Headquarters 220 4th Ave S Kent $7,755,700 Y Tukwila sub-police station 641 South Center Mall Tukwila unknown N Schools Kent Elementary 24700 64th Ave S Kent unknown N St. Christopher Academy 318 3rd Ave S Kent $709,000 Y Thomas Academy 20 49th St NE Auburn $170,300 Y Cascade Middle School 1015 24th St NE Auburn $2,838,000 N Administration 300 SW 7th St Renton $2,215,500 Y Neely-O'Brien Elementary 6300 S 236th St Kent $2,921,100 Y Mill Creek Middle School 320 Central Ave N Kent $9,621,215 Y Medical Blood Bank 130 Andover Park E Tukwila unknown Y

15
How does HAZUS calculate damages for Earthquakes? Damage in HAZUS is described by five damage states:
HAZUS uses damage states to estimate life-safety consequences of building damage, expected monetary losses due to building damage, expected monetary losses due to business disruption, and other social and economic impacts.
16
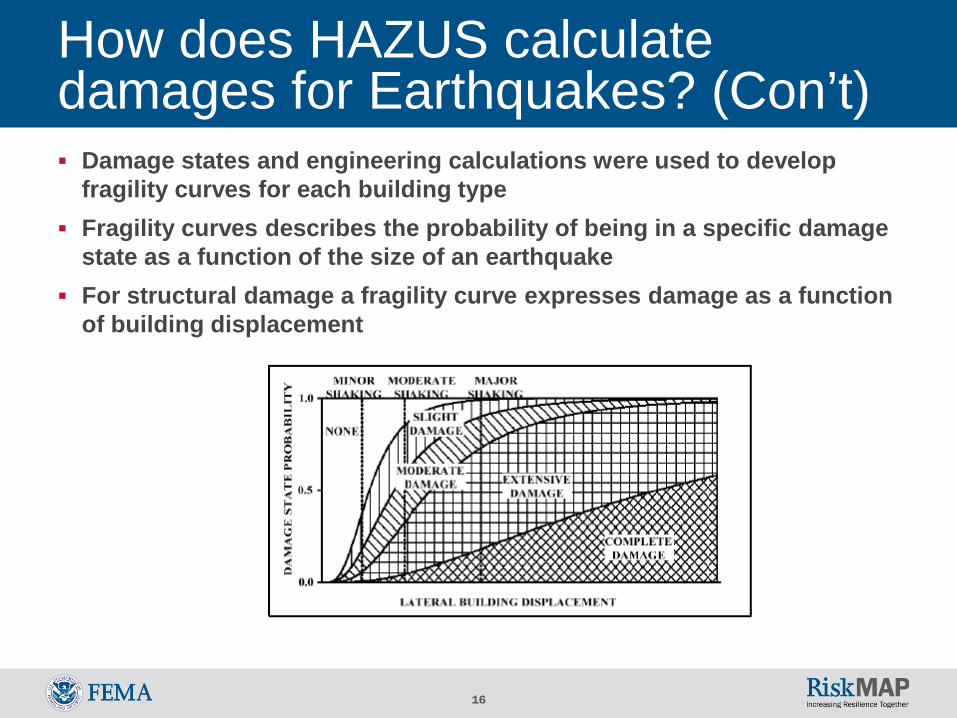
How does HAZUS calculate damages for Earthquakes? (Con’t) Damage states and engineering calculations were used to develop
fragility curves for each building type Fragility curves describes the probability of being in a specific damage
state as a function of the size of an earthquake For structural damage a fragility curve expresses damage as a function
of building displacement
17
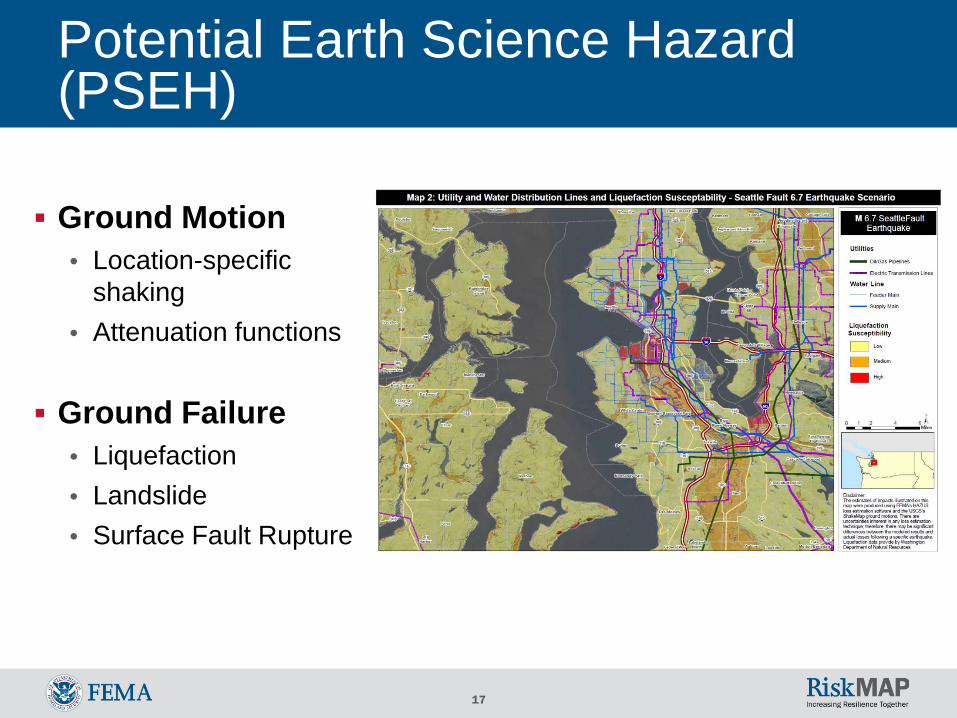
Potential Earth Science Hazard (PSEH)
Ground Motion• Location-specific
shaking• Attenuation functions
Ground Failure• Liquefaction• Landslide• Surface Fault Rupture

18
Where do I find data for use in HAZUS? Local parcel/assessors data can be input into HAZUS. The following
data is required for each parcel:• Building replacement value (typically use building improvement value). *Assessed
values should not be used.• Building square footage• Building type (residential, commercial, industrial etc. )• Building count (per parcel)• Can also update bridge, road, utility information
Shake Maps are available at USGS• http://earthquake.usgs.gov/earthquakes/shakemap/• Choose a geographic area> Click Archive• Choose the appropriate network (Pacific NW)> Choose All Years> and choose
Scenarios for Type• Once a Shakemap is selected choose Downloads. Download the HAZUS Zip File
and the Shape Files.
19
HAZUS Earthquake Utilities and Procedure Documents
Shakemap Utility – Converts the downloaded shapefiles to a geodatabase
Procedure for Importing Shakemaps into HAZUS
SOP for Creation of Earthquake Scenario Priority Maps (contact Kelly Stone)
Earthquake Export tool – Allows the user to generate maps and tables automatically from HAZUS (contact Kelly Stone)

20
HAZUS OutputsHighway
%Chance of Being Functional Day 1
%Chance of Being Functional Day 3 PDsExceedModerate
US 2 88.7 93.6 9.60%
STATE ROUTE 529 88.7 93.6 9.60%
I-5 RAMP 87.4 92 11.81%
STOCKSHOW ROAD 76.6 87.7 17.55%
STOCKSHOW ROAD 75.8 86.7 18.92%
164TH ST SW 77.5 87.5 17.82%
MAPLE ROAD 77.4 84.4 21.87%
STATE ROUTE 522 70.4 80 27.43%
I-5 80.1 87.8 17.46%
STATE ROUTE 9 74.4 79.9 27.50%
STATE ROUTE 9 81.2 84.4 21.91%
I-5 88.7 93.6 9.60%
I-5 88.7 93.6 9.60%
CASCADE VIEW 88 92.7 10.83%
41ST ST 88.7 93.6 9.60%
I-5 85.1 89.3 15.49%
I-5 85.1 89.3 15.49%
21
HAZUS Outputs
22
How to Use HAZUS Output
Disaster Response Hazard Mitigation Plan Community Planning Future Development Preparedness Exercises Validation Studies
23
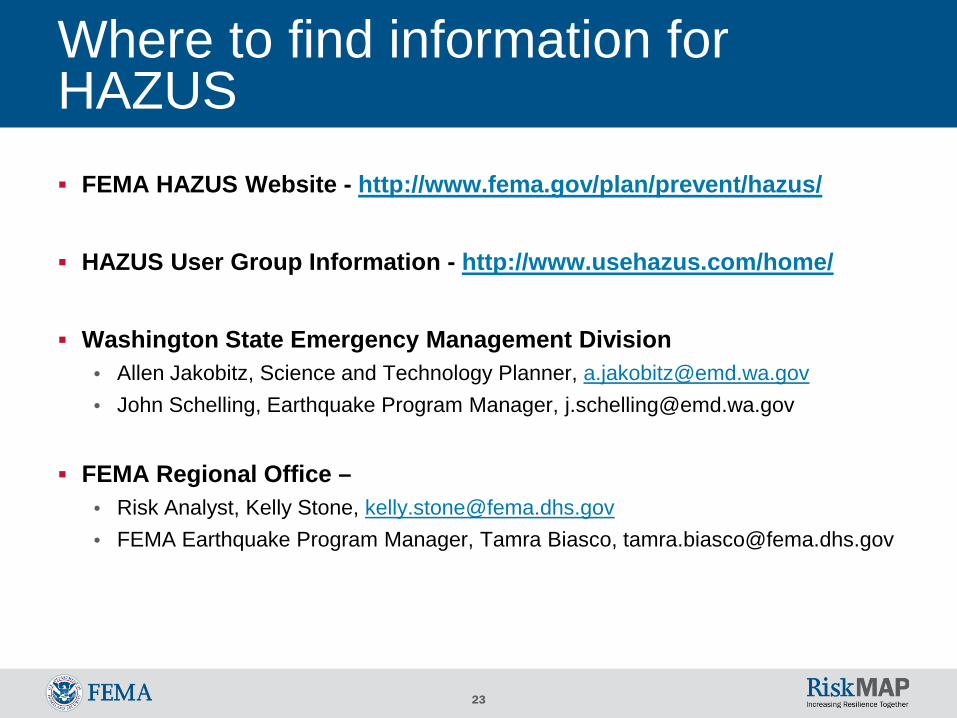
Where to find information for HAZUS FEMA HAZUS Website - http://www.fema.gov/plan/prevent/hazus/
HAZUS User Group Information - http://www.usehazus.com/home/
Washington State Emergency Management Division• Allen Jakobitz, Science and Technology Planner, [email protected]• John Schelling, Earthquake Program Manager, [email protected]
FEMA Regional Office –• Risk Analyst, Kelly Stone, [email protected]• FEMA Earthquake Program Manager, Tamra Biasco, [email protected]
24
HAZUS Training - Online
ESRI Virtual Campus – search for ‘Hazus’ Examples
• Hazus-MH for Decision Makers• Basic Hazus – 12 courses (Fall/Winter 2011)• Introduction to CDMS• User Defined Flood Hazard
Cost ranges from free to $32
25
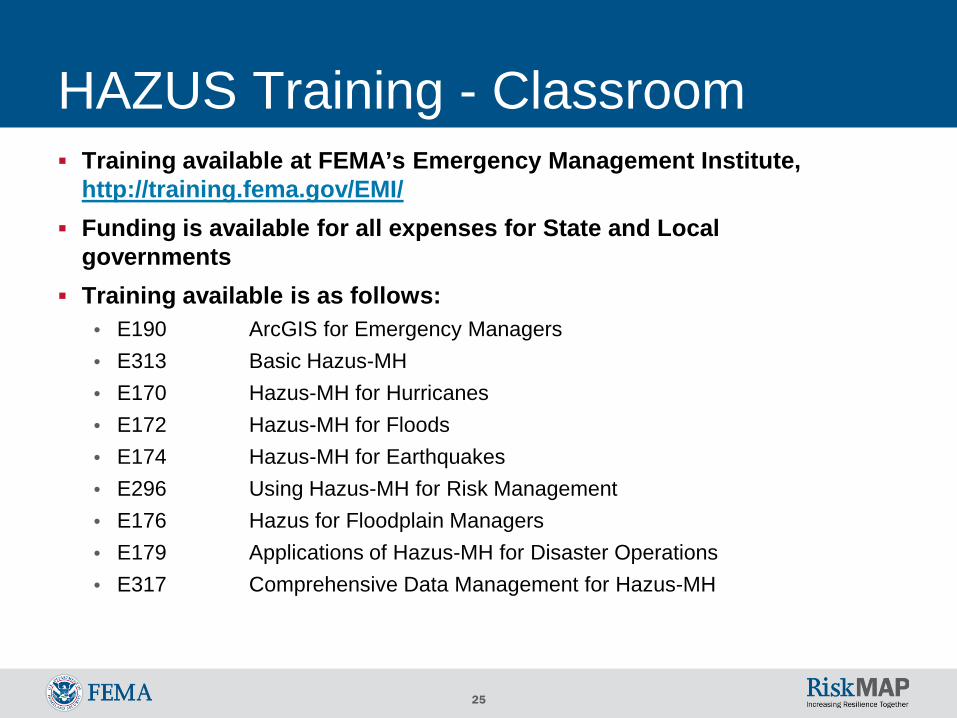
HAZUS Training - Classroom Training available at FEMA’s Emergency Management Institute,
http://training.fema.gov/EMI/ Funding is available for all expenses for State and Local
governments Training available is as follows:
• E190 ArcGIS for Emergency Managers• E313 Basic Hazus-MH• E170 Hazus-MH for Hurricanes• E172 Hazus-MH for Floods• E174 Hazus-MH for Earthquakes• E296 Using Hazus-MH for Risk Management• E176 Hazus for Floodplain Managers• E179 Applications of Hazus-MH for Disaster Operations• E317 Comprehensive Data Management for Hazus-MH
26
Contact and Upcoming Calls/ Webinars
Kelly S. Stone, Risk Analyst, FEMA Region [email protected]
WA HUG Call – January 10th, 2011 11:00-12:00pm• Call information available on http://www.usehazus.com/