challenges in hazus level-ii data preparations: generating ... · challenges in hazus level-ii data...
TRANSCRIPT
Patricia (Patty) R. Newman, Recep (Ray) Cakir, Joseph F. Schilter, Timothy J. Walsh, Stephen L. Slaughter, and David K. Norman
Washington State Department of Natural Resources – Division of Geology
and Earth Resources
Northwest HAZUS User Group Meeting May 5th, 2014
MULTI-HAZARD LOSS ASSESSMENTS MAPPING ACTIVITY; FEMA COOPERATING TECHNICAL PARTNERS (CTP) RISKMAP PROGRAM
CHALLENGES IN HAZUS LEVEL-II DATA PREPARATIONS:
Generating the User-Defined Data for Grays Harbor County

Contents
• RiskMAP Project Overview
• Results
• Conclusion
• Challenges
• UDF Data Preparation

Vision for RiskMAP
http://www.fema.gov/risk-mapping-assessment-planning
Identified Risks
RiskMAP Data Sources
Risk Assessment
• US Census Data
• State Geologic Data
• County Assessor Data
• Earthquake
• Tsunami
• Flood
• Data Tables
• Maps
• Reports
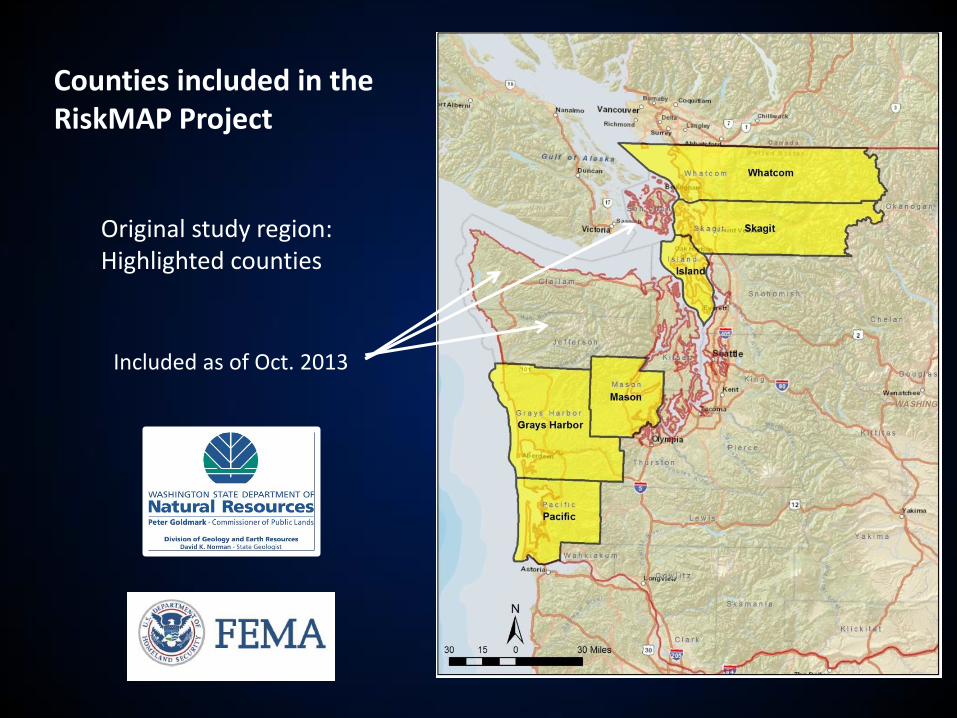
Counties included in the RiskMAP Project
Included as of Oct. 2013
Original study region: Highlighted counties
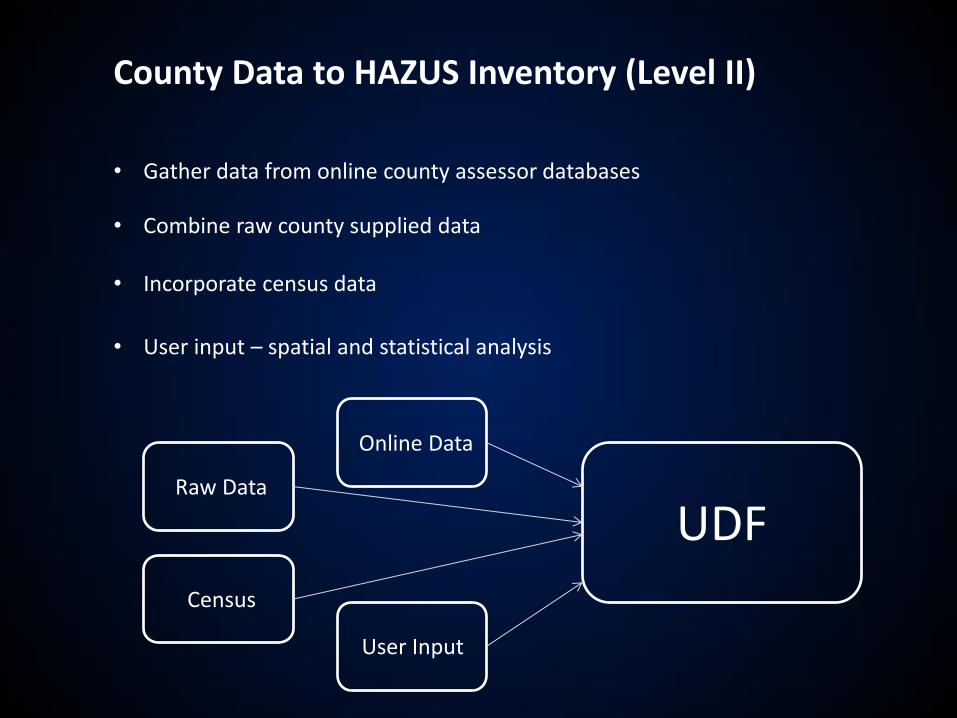
County Data to HAZUS Inventory (Level II)
• Gather data from online county assessor databases
• Combine raw county supplied data
• Incorporate census data
• User input – spatial and statistical analysis
Online Data
Raw Data
Census
User Input
UDF
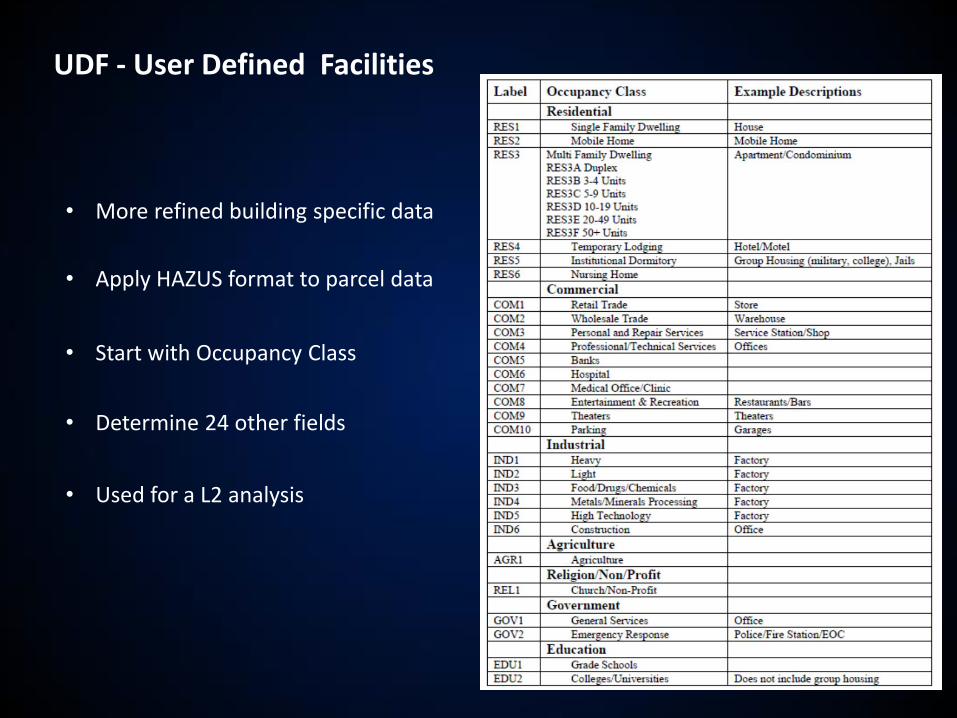
UDF - User Defined Facilities
• Start with Occupancy Class
• Apply HAZUS format to parcel data
• Determine 24 other fields
• More refined building specific data
• Used for a L2 analysis

UDF Challenges
Occupancy Class
• The county assessor descriptions may all be generalized as RES or COM, when there are more specific options
• Ex: the county classifies it as COM, when it may be a hospital (COM6)
• Check given information to determine occupancy class
• Year Built Approximated from known year built of neighbors
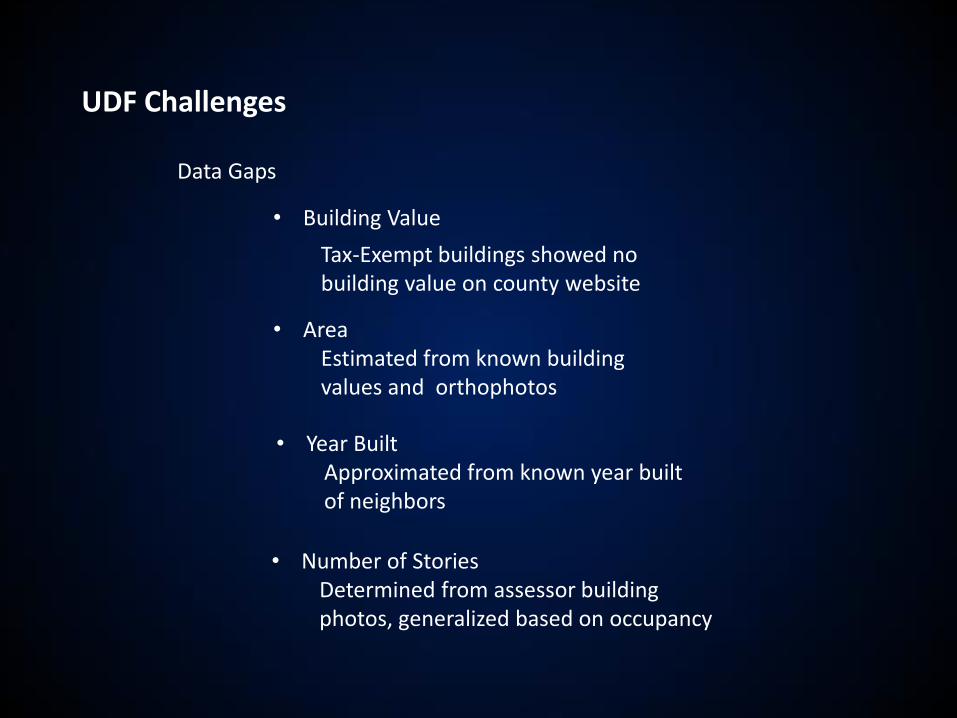
UDF Challenges
Data Gaps
• Building Value
Tax-Exempt buildings showed no building value on county website
• Area Estimated from known building values and orthophotos
• Number of Stories Determined from assessor building photos, generalized based on occupancy
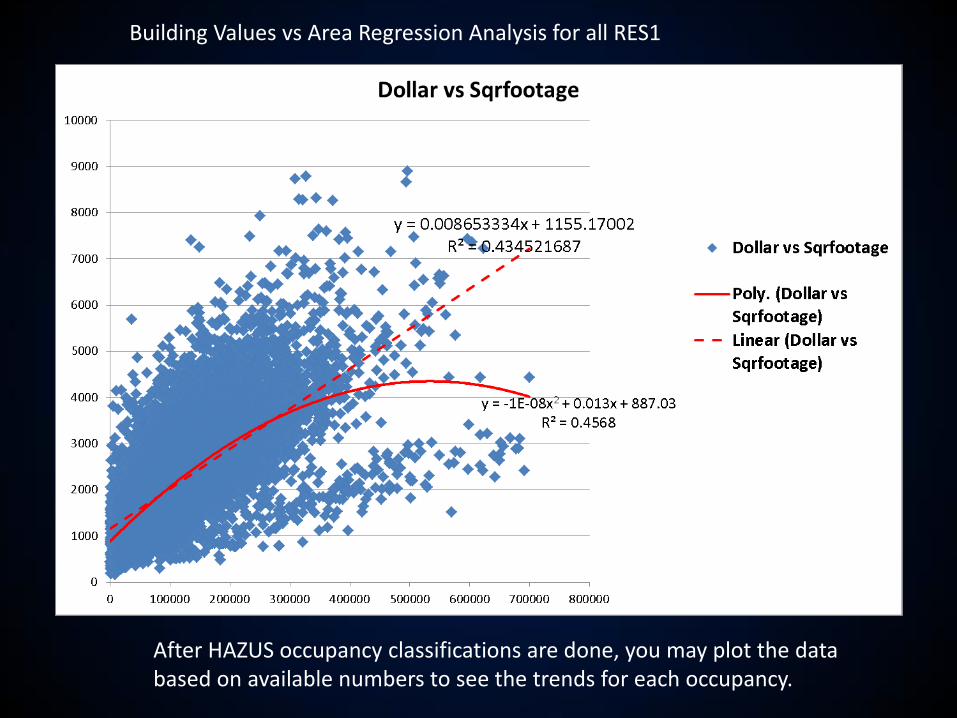
Building Values vs Area Regression Analysis for all RES1
After HAZUS occupancy classifications are done, you may plot the data based on available numbers to see the trends for each occupancy.
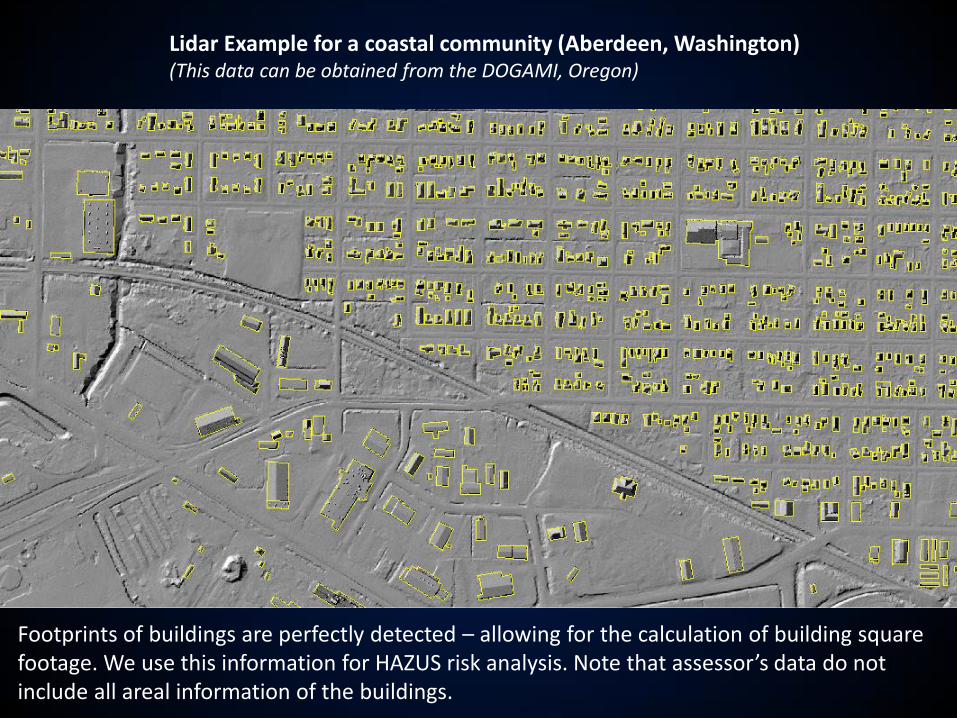
Lidar Example for a coastal community (Aberdeen, Washington) (This data can be obtained from the DOGAMI, Oregon)
Footprints of buildings are perfectly detected – allowing for the calculation of building square footage. We use this information for HAZUS risk analysis. Note that assessor’s data do not include all areal information of the buildings.
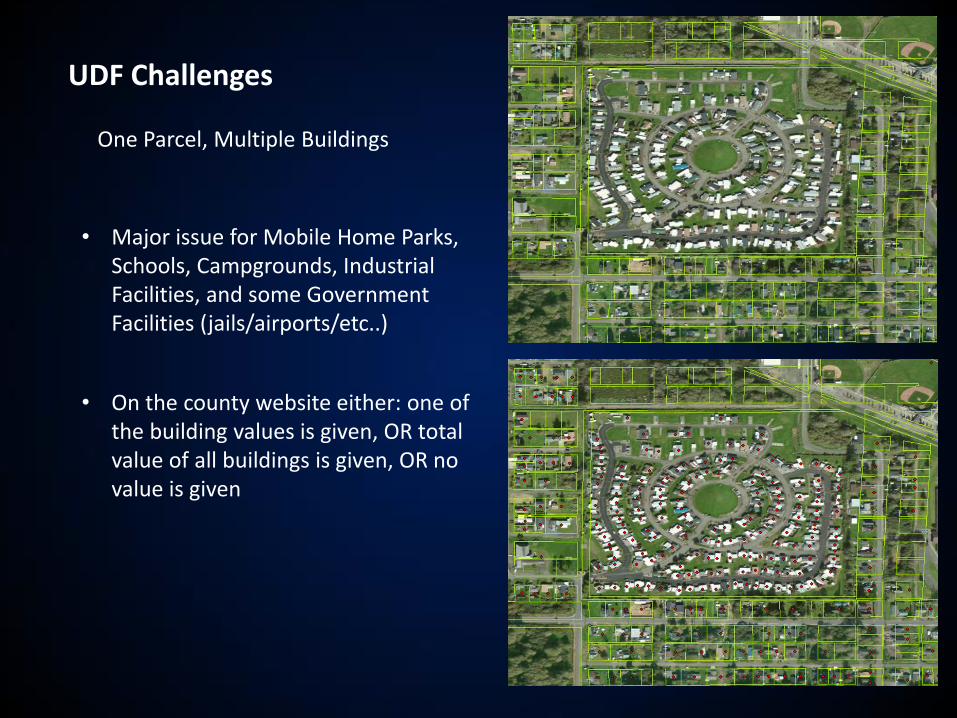
UDF Challenges
One Parcel, Multiple Buildings
• Major issue for Mobile Home Parks, Schools, Campgrounds, Industrial Facilities, and some Government Facilities (jails/airports/etc..)
• On the county website either: one of the building values is given, OR total value of all buildings is given, OR no value is given
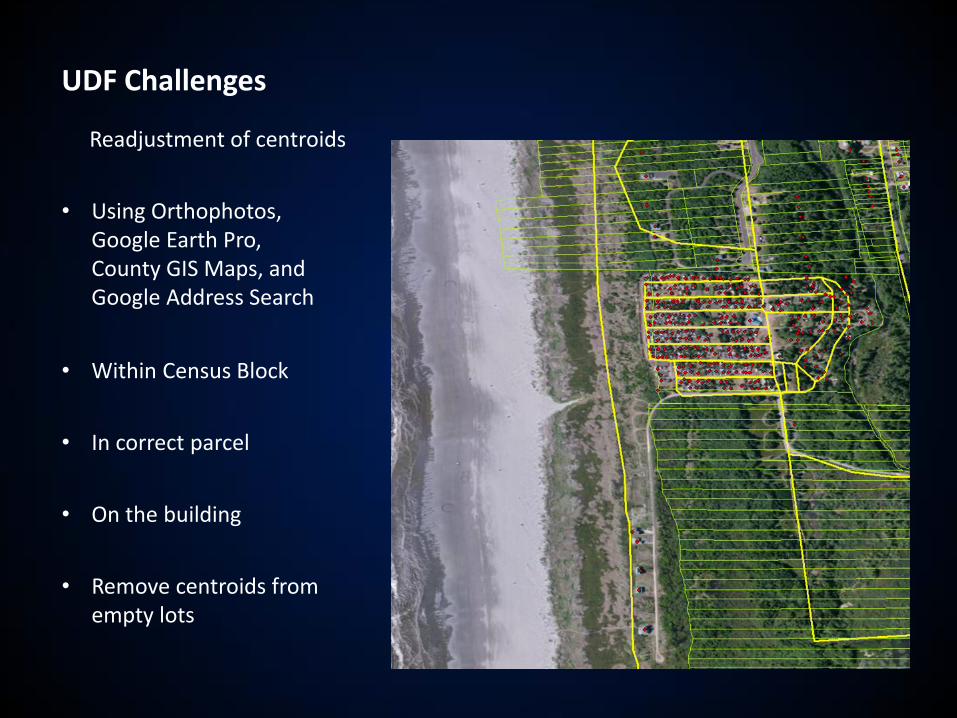
UDF Challenges
Readjustment of centroids
• Using Orthophotos, Google Earth Pro, County GIS Maps, and Google Address Search
• Within Census Block
• On the building
• In correct parcel
• Remove centroids from empty lots

Examples of questionable houses: • Burnt Down? • FFE?
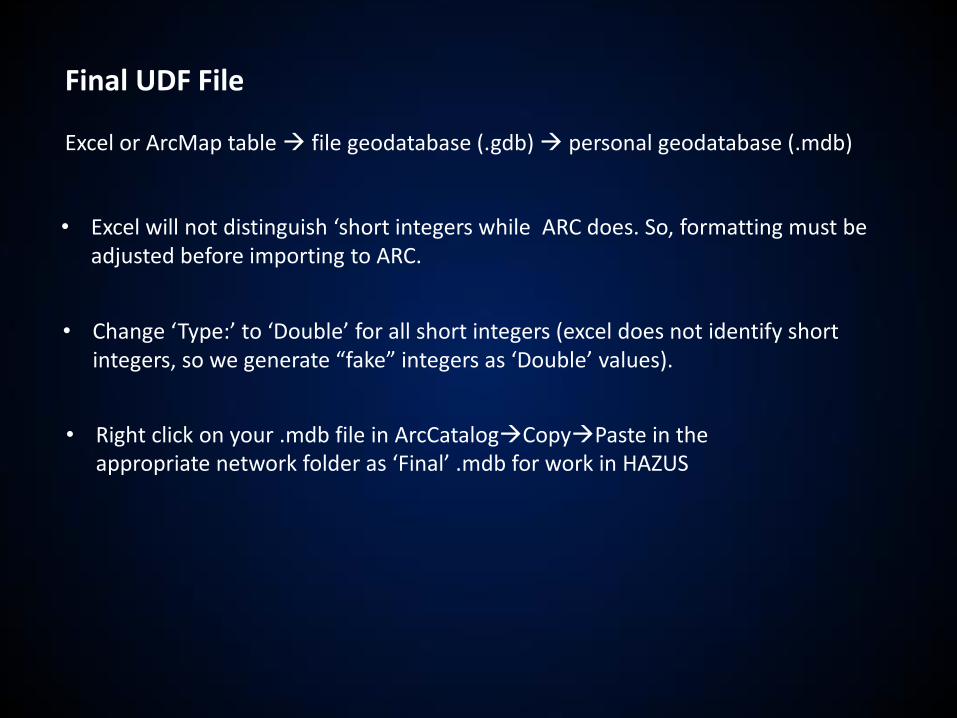
Final UDF File Excel or ArcMap table file geodatabase (.gdb) personal geodatabase (.mdb)
• Excel will not distinguish ‘short integers while ARC does. So, formatting must be adjusted before importing to ARC.
• Change ‘Type:’ to ‘Double’ for all short integers (excel does not identify short integers, so we generate “fake” integers as ‘Double’ values).
• Right click on your .mdb file in ArcCatalogCopyPaste in the appropriate network folder as ‘Final’ .mdb for work in HAZUS
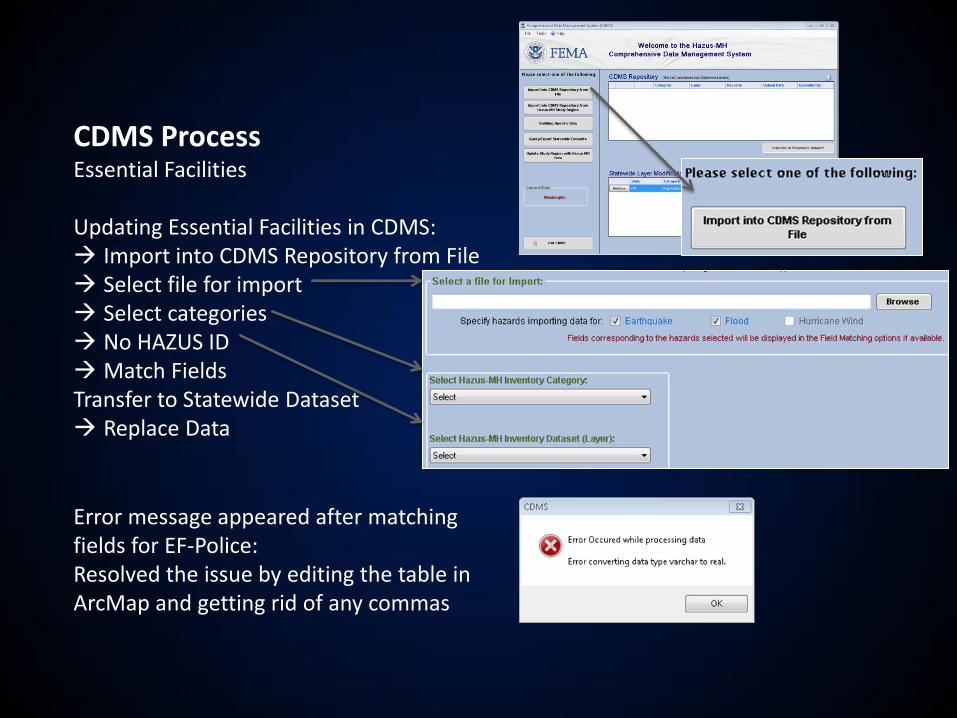
CDMS Process Essential Facilities Updating Essential Facilities in CDMS: Import into CDMS Repository from File Select file for import Select categories No HAZUS ID Match Fields Transfer to Statewide Dataset Replace Data
Error message appeared after matching fields for EF-Police: Resolved the issue by editing the table in ArcMap and getting rid of any commas
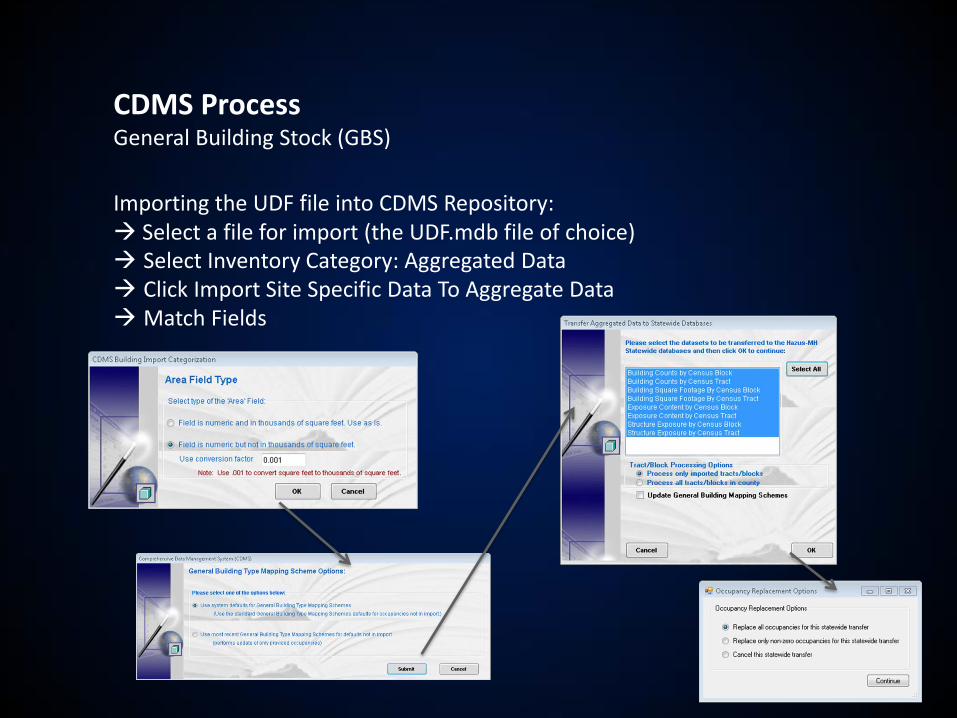
CDMS Process General Building Stock (GBS)
Importing the UDF file into CDMS Repository: Select a file for import (the UDF.mdb file of choice) Select Inventory Category: Aggregated Data Click Import Site Specific Data To Aggregate Data Match Fields

Preparing the Shakemap
Cascadia M 9.0 Scenario Event: download from USGS shakemap site: http://earthquake.usgs.gov/earthquakes/shakemap/list.php?y=2011&s=1
• Download HAZUS.Zip File • In HAZUS EQ user manual read Appendix J to convert
USGS shakemap shapefiles into HAZUS formatted geodatabase file.

How to upload/run the shakemaps in HAZUS
• In HAZUS, Hazard Data Maps Add map to list (select ‘Hazus_Shakemaps’ ‘CascadiaM9_shakemap’ and add the pga / pgv / psa03 / psa10 maps, one by one)
• Then, Hazard Scenario… Define a New Scenario User Supplied Hazard… Ground Shaking select PGA / PGV / PSA03 / PSA10, enter Magnitude: 9 Name it
• Once your Data Maps and Scenario are in HAZUS you are ready to run the analysis and gather results
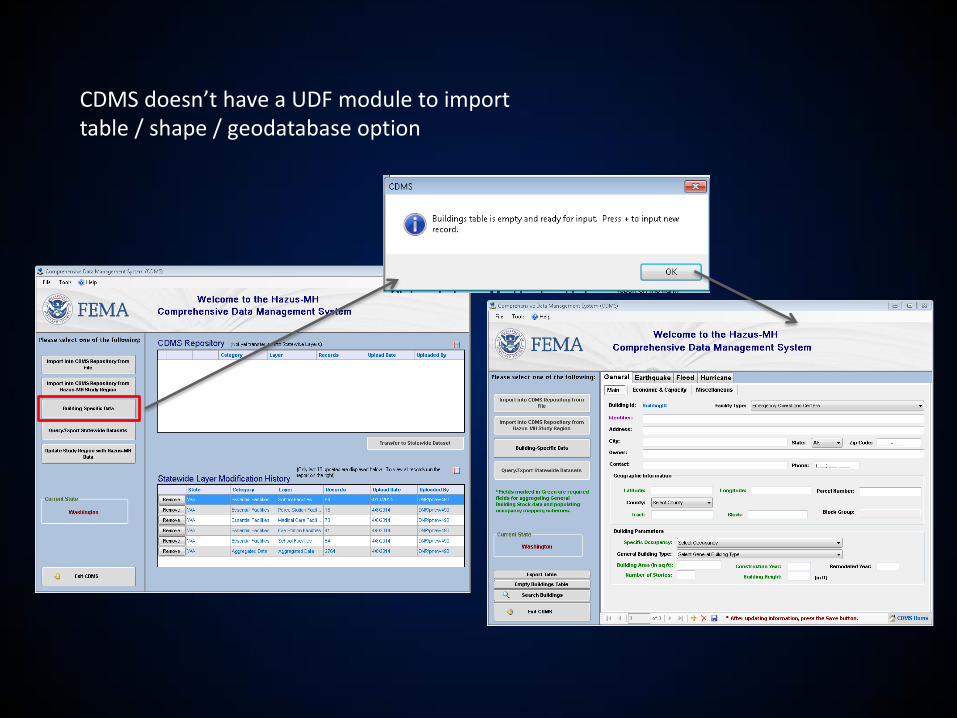
CDMS doesn’t have a UDF module to import table / shape / geodatabase option

Inventory: UDF How to upload the UDF into HAZUS (and correct formatting errors)
• Inventory User-Defined-Facilities Import (.mdb file) match fields
• If this error message appears, open ArcCatalog, copy/paste the latest Final .mdb file into a new folder, version/date it, carry the table over into a blank ArcMap. Add Fields correctly to resolve the issues:
• For Grays Harbor, UD_NAME, UD_NUMSTORIES, UD_AREA, LANDSLIDE, and LIQUEFACTION give this error message.
• Fixed UD_NAME by changing the field from text – 150 to text – 40.
• Fixed UD_AREA by changing the field from double to float.
• UD_NUMSTORIES, LANDSLIDE, and LIQUEFACTION we kept as short int, just say yes to the error message, and they go through. The only issue we had was that LANDSLIDE (which we made default value 1) was 0. Everything else worked.
• When the fields are completely incompatible this error message appears:
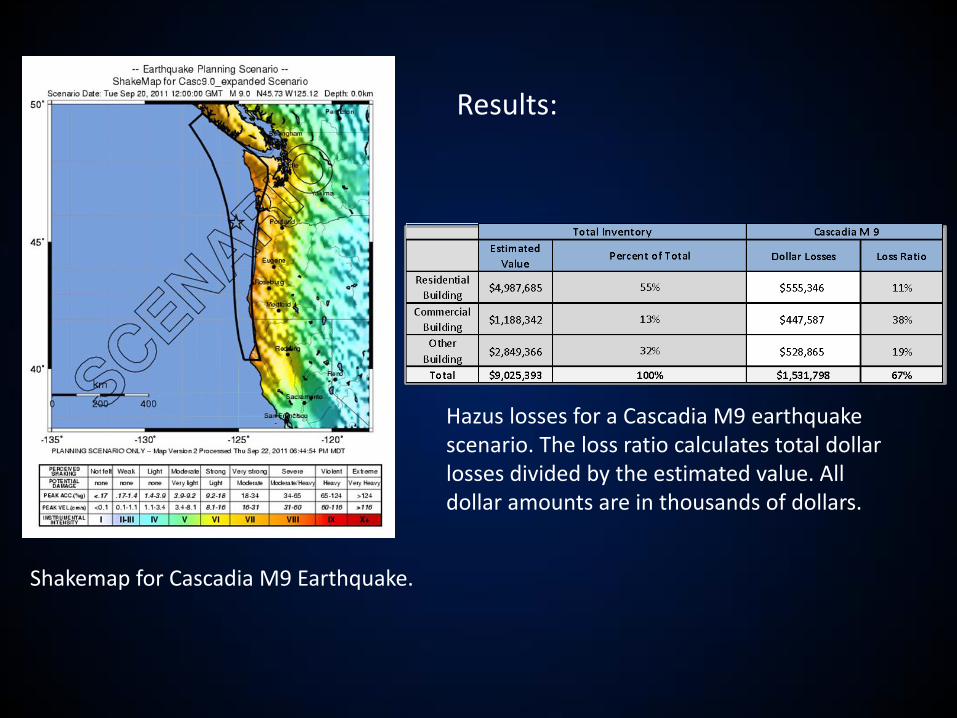
Shakemap for Cascadia M9 Earthquake.
Hazus losses for a Cascadia M9 earthquake scenario. The loss ratio calculates total dollar losses divided by the estimated value. All dollar amounts are in thousands of dollars.
Results:
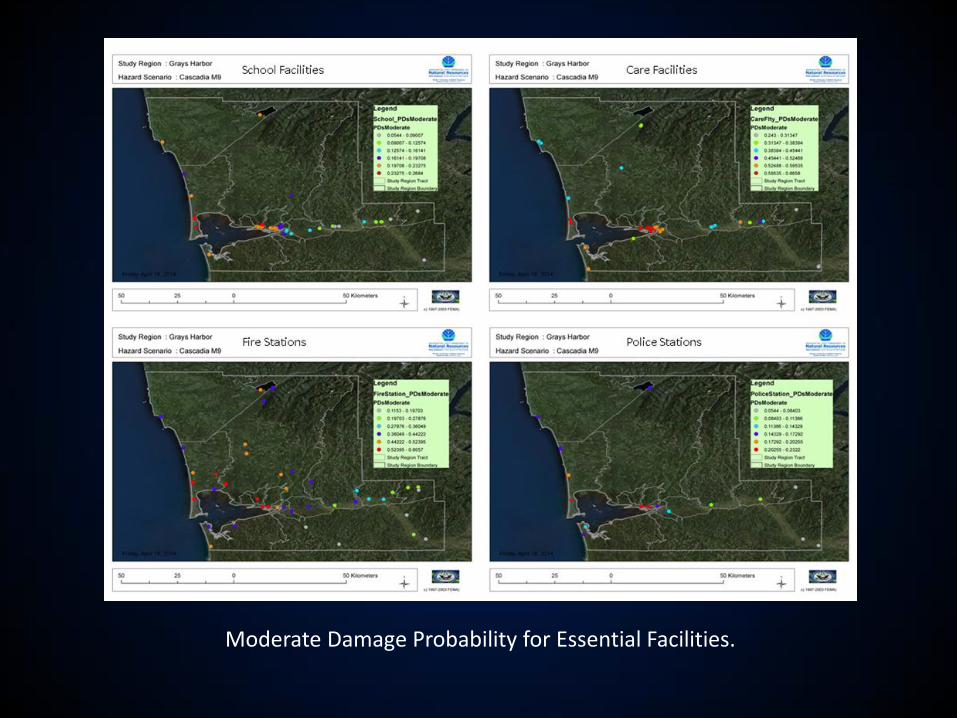
Moderate Damage Probability for Essential Facilities.
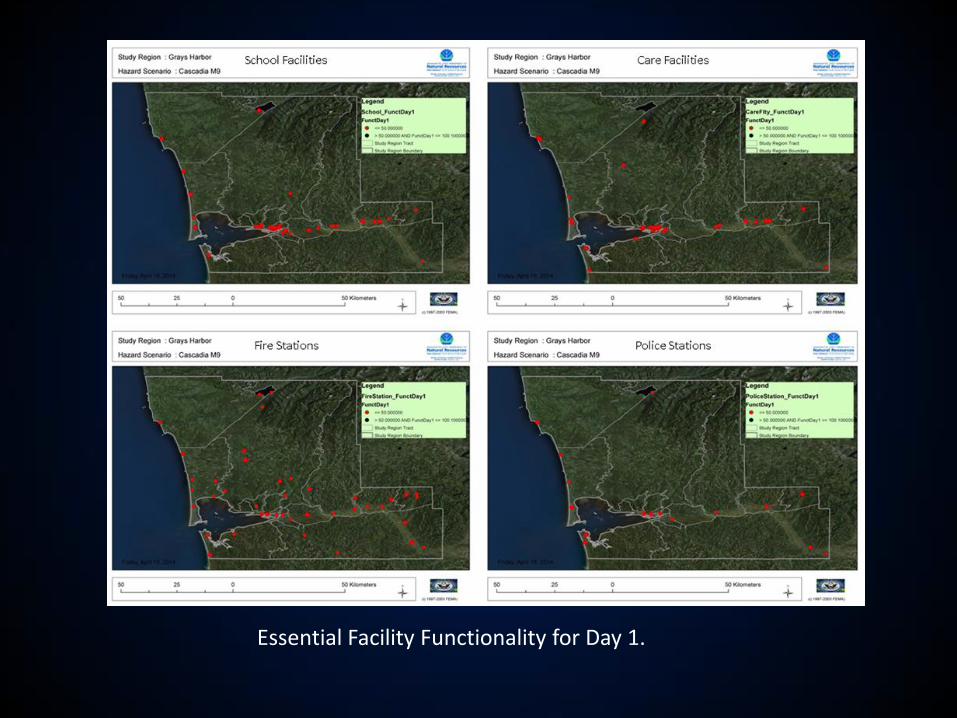
Essential Facility Functionality for Day 1.
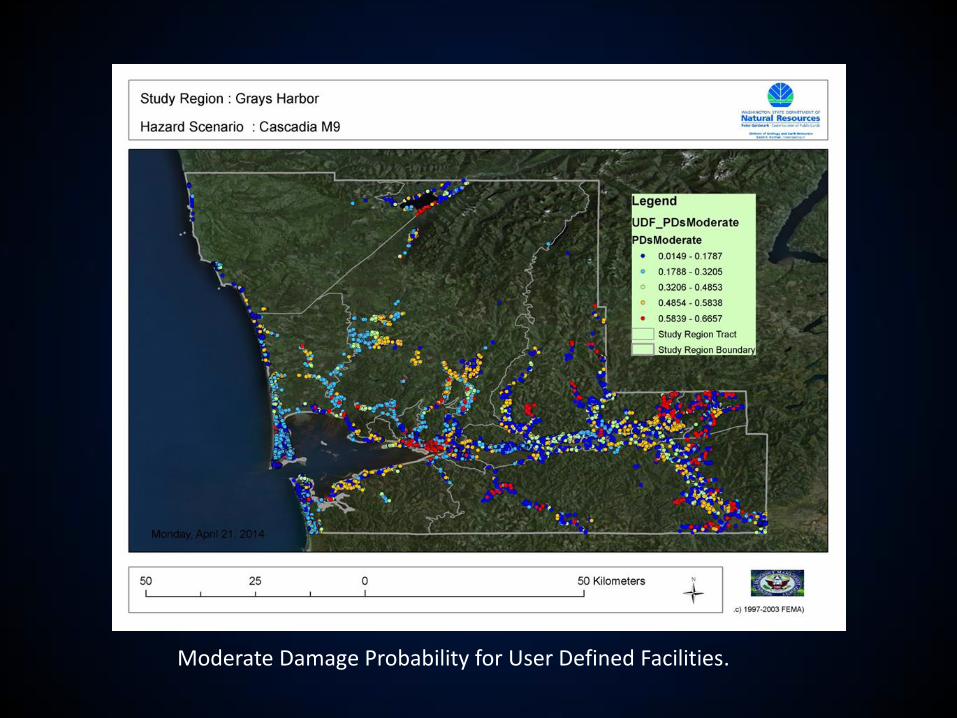
Moderate Damage Probability for User Defined Facilities.
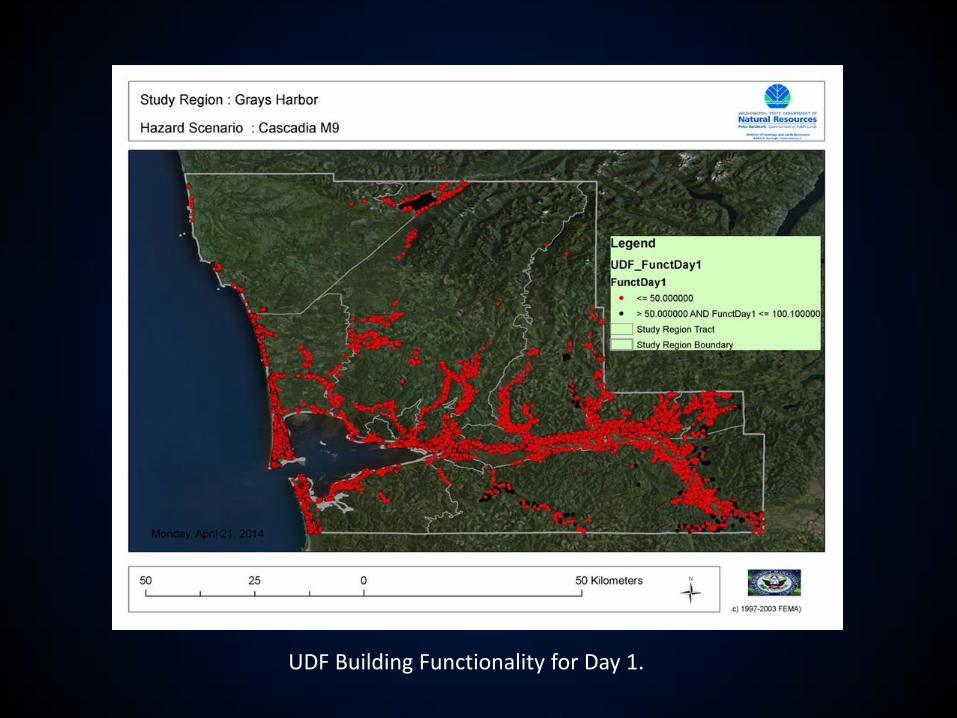
UDF Building Functionality for Day 1.
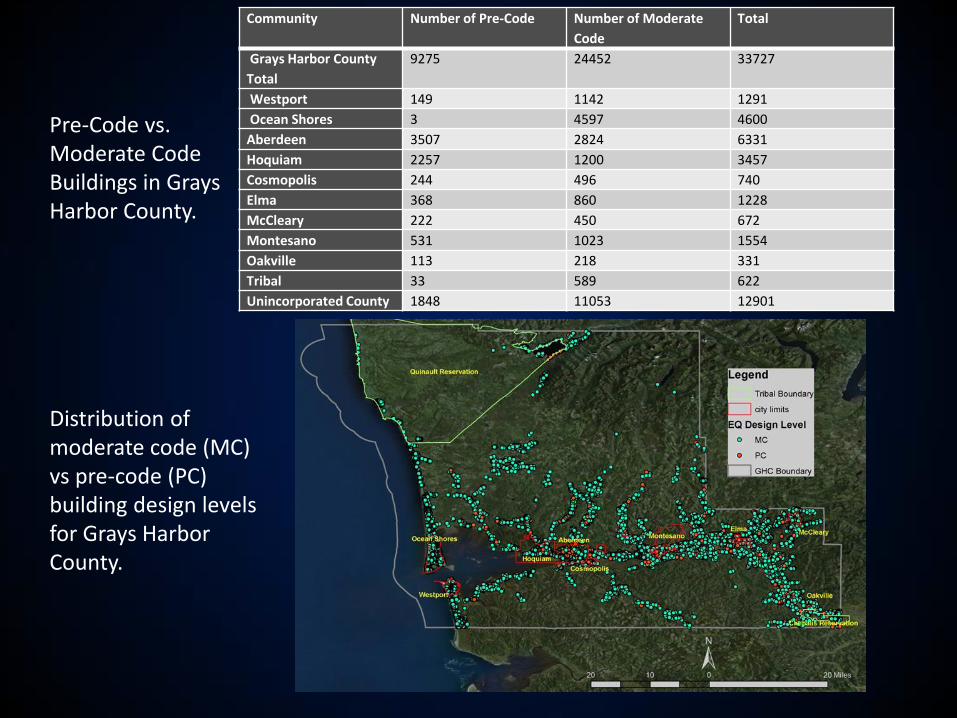
Pre-Code vs. Moderate Code Buildings in Grays Harbor County.
Community Number of Pre-Code Number of Moderate
Code
Total
Grays Harbor County
Total
9275 24452 33727
Westport 149 1142 1291
Ocean Shores 3 4597 4600
Aberdeen 3507 2824 6331
Hoquiam 2257 1200 3457
Cosmopolis 244 496 740
Elma 368 860 1228
McCleary 222 450 672
Montesano 531 1023 1554
Oakville 113 218 331
Tribal 33 589 622
Unincorporated County 1848 11053 12901
Distribution of moderate code (MC) vs pre-code (PC) building design levels for Grays Harbor County.

UDF Liquefaction Susceptibility

UDF Liquefaction Susceptibility Aberdeen Area

UDF Liquefaction Susceptibility Aberdeen Area

UDF Soil Type

Shallow Landslide Susceptibility Zones
Occupancy Building Value
(in dollars)
Total Number of Buildings in
Landslide Zone
Residential $37,518,448.55 316
Commercial $1,924,060.00 12
Other $4,296,065.00 4
Total $43,738,573.55 332
Landslide Building Damage Costs for occupancy type
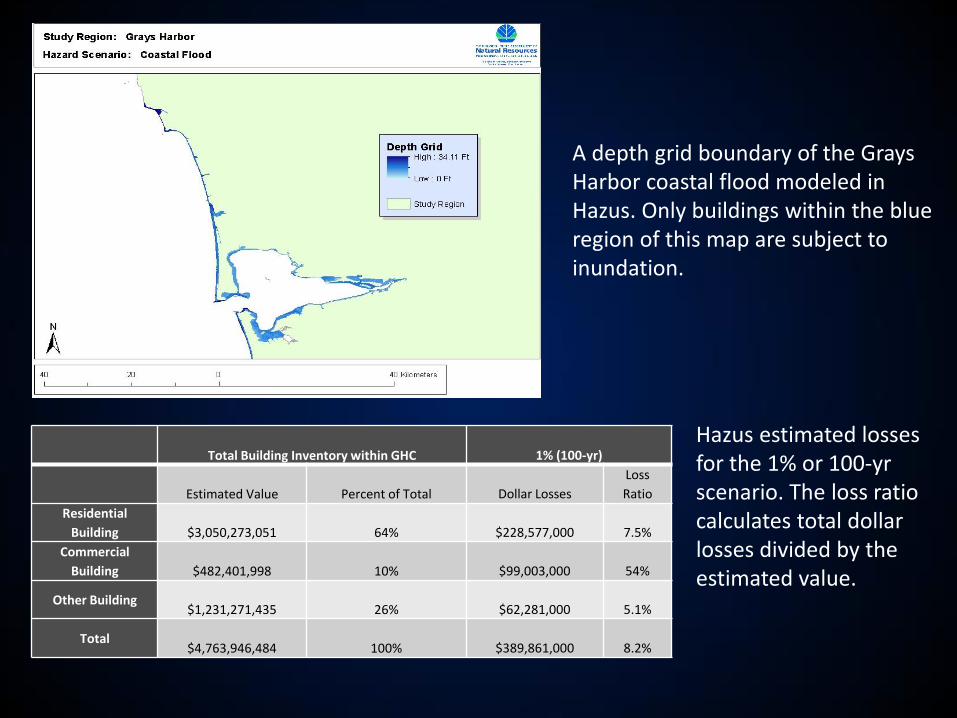
Hazus estimated losses for the 1% or 100-yr scenario. The loss ratio calculates total dollar losses divided by the estimated value.
A depth grid boundary of the Grays Harbor coastal flood modeled in Hazus. Only buildings within the blue region of this map are subject to inundation.
Total Building Inventory within GHC
1% (100-yr)
Estimated Value Percent of Total
Dollar Losses
Loss
Ratio
Residential
Building $3,050,273,051 64%
$228,577,000
7.5%
Commercial
Building $482,401,998 10%
$99,003,000
54%
Other Building $1,231,271,435 26%
$62,281,000
5.1%
Total $4,763,946,484 100%
$389,861,000
8.2%
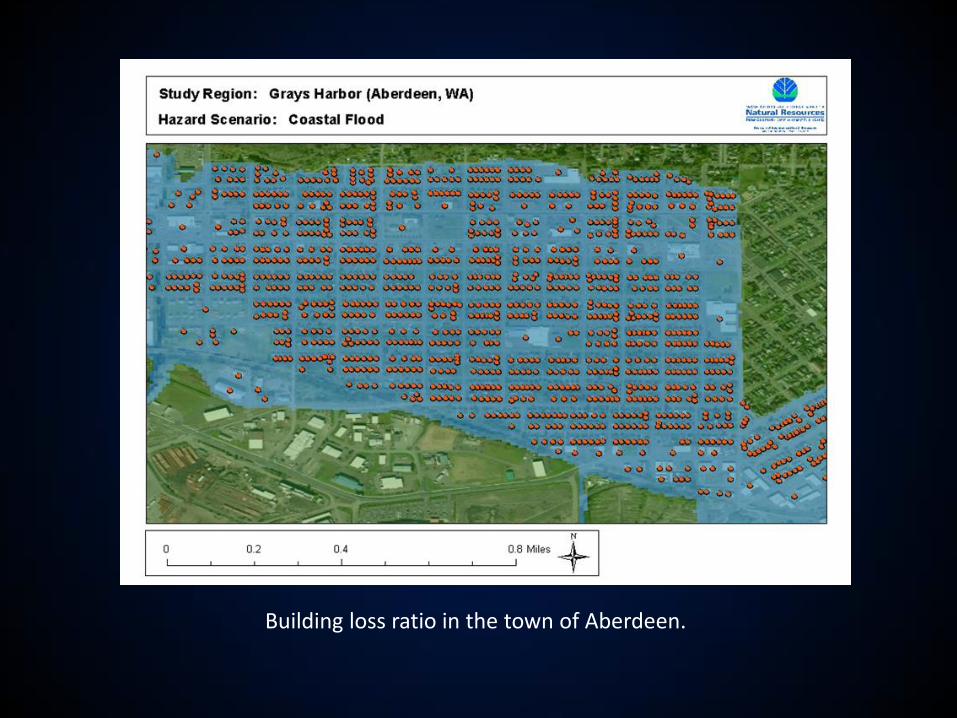
Building loss ratio in the town of Aberdeen.
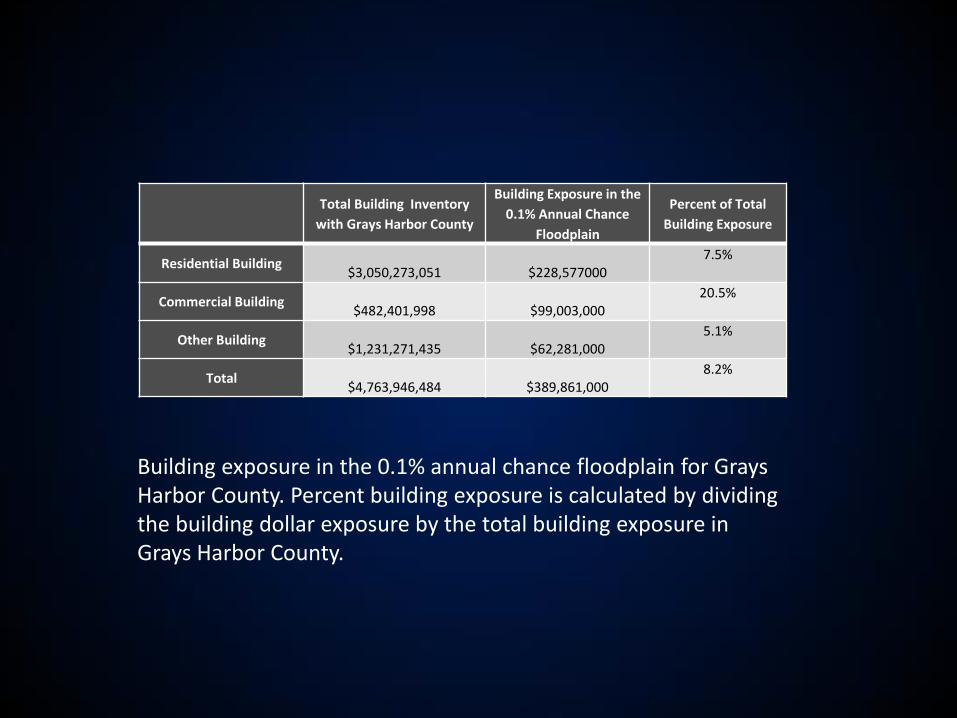
Building exposure in the 0.1% annual chance floodplain for Grays Harbor County. Percent building exposure is calculated by dividing the building dollar exposure by the total building exposure in Grays Harbor County.
Total Building Inventory
with Grays Harbor County
Building Exposure in the
0.1% Annual Chance
Floodplain
Percent of Total
Building Exposure
Residential Building $3,050,273,051 $228,577000
7.5%
Commercial Building $482,401,998 $99,003,000
20.5%
Other Building $1,231,271,435 $62,281,000
5.1%
Total $4,763,946,484 $389,861,000
8.2%
Tsunami Risk Assessment Overview
In addition to the coastal flood model, an attempt was made to simulate the effects of tsunami. The study region for this model includes Pacific County and the lower third of Grays Harbor County. Because Hazus-MH 2.1 does not support tsunami modeling, inundation zones were generated by 2 separate schemes. The first one is referred to in this report as the 1A model and was simulated from a M 9.1 earthquake along the Cascadia Subduction Zone. The second, referred to as the L1 model, was prepared in 2011 based on a M 9.0 earthquake in the same region. The results of both studies were developed using a numerical model known as MOST (Method of Splitting Tsunami). This method uses a finite difference pattern which employs a 3-tier grid system. The outer grid is the coarsest and the inner grid—focusing on occupied areas of interest— is the finest grid system on which calculations are made. The following tables and figures demonstrate the results and differences between the 1A and L1 models. Between both models the L1, which is the most current, suggests a higher level of damage value to the study region (Gica et al, 2014).

A comparison between the 1A and L1 models covering tsunami inundation of Coastal Pacific County and Grays Harbor County. Note the L1 model implies greater damage.
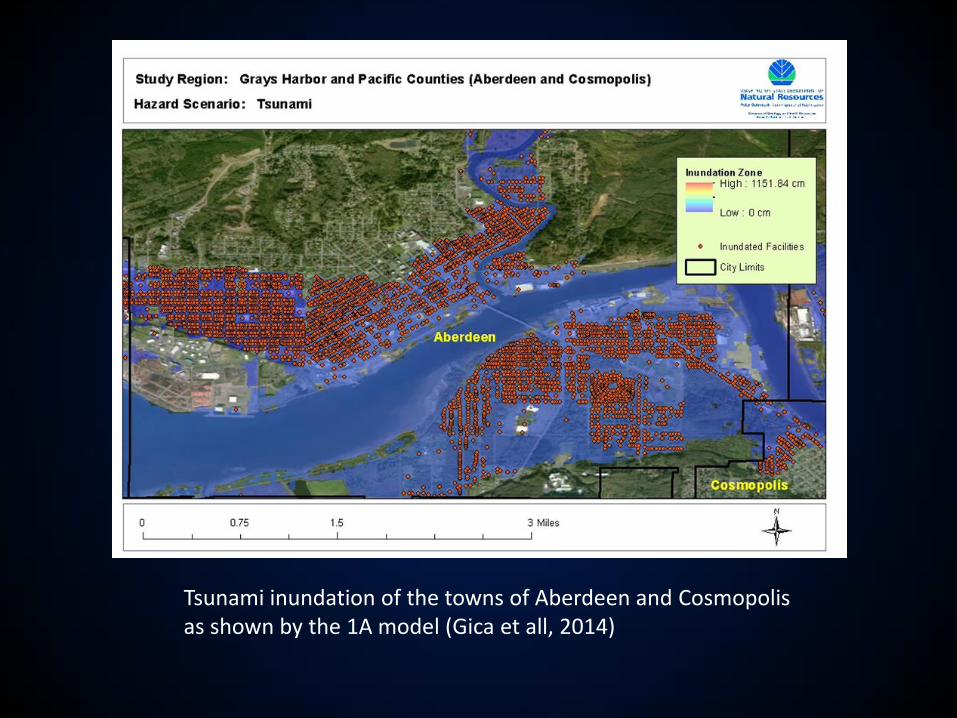
Tsunami inundation of the towns of Aberdeen and Cosmopolis as shown by the 1A model (Gica et all, 2014)
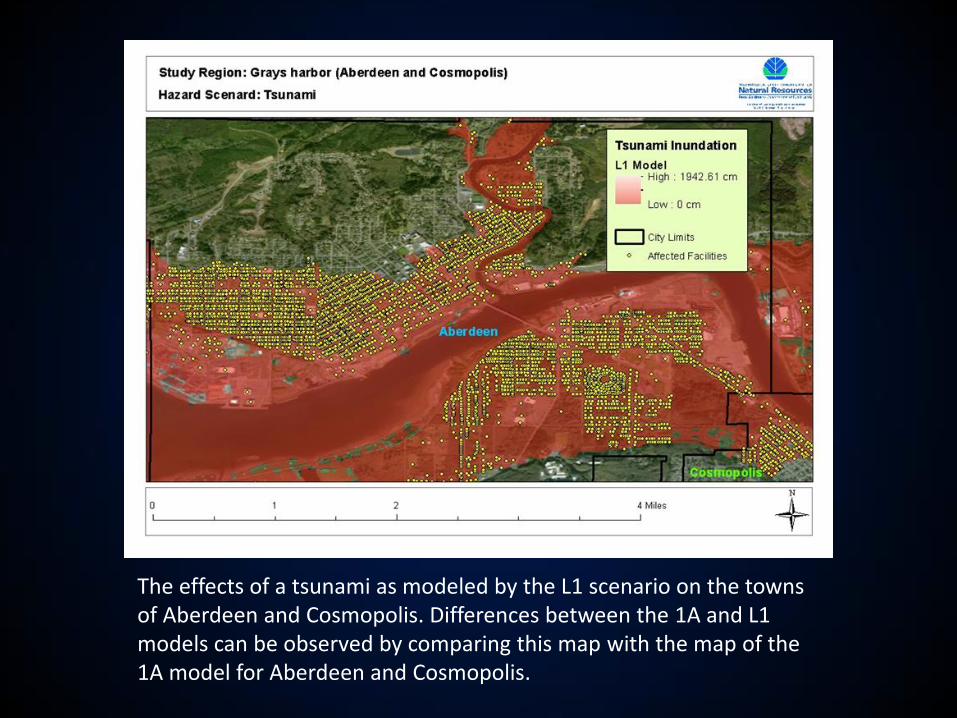
The effects of a tsunami as modeled by the L1 scenario on the towns of Aberdeen and Cosmopolis. Differences between the 1A and L1 models can be observed by comparing this map with the map of the 1A model for Aberdeen and Cosmopolis.
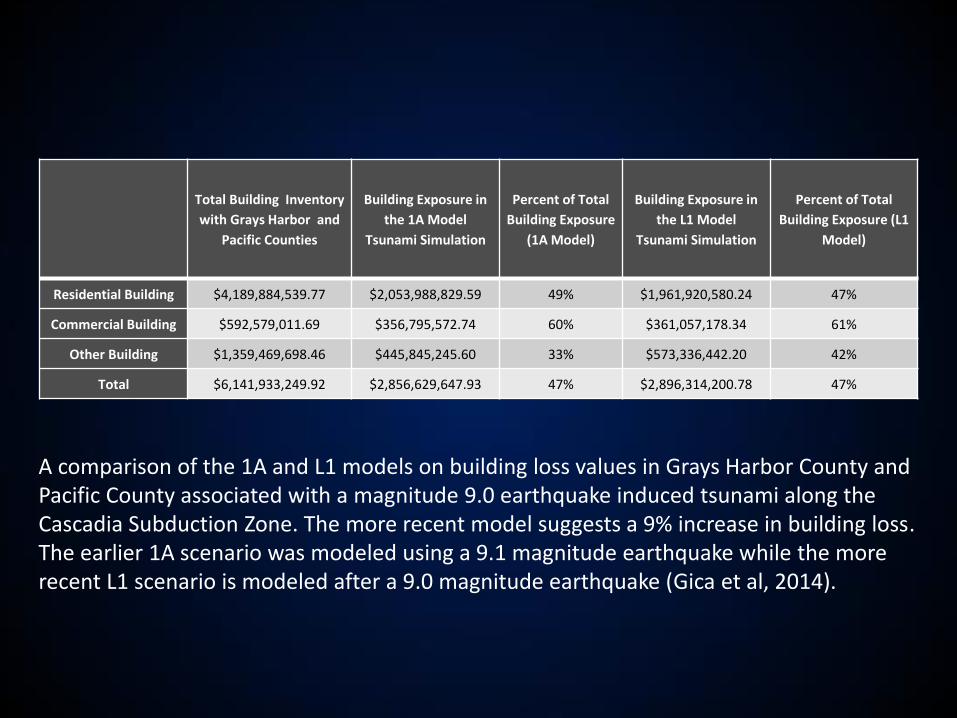
A comparison of the 1A and L1 models on building loss values in Grays Harbor County and Pacific County associated with a magnitude 9.0 earthquake induced tsunami along the Cascadia Subduction Zone. The more recent model suggests a 9% increase in building loss. The earlier 1A scenario was modeled using a 9.1 magnitude earthquake while the more recent L1 scenario is modeled after a 9.0 magnitude earthquake (Gica et al, 2014).
Total Building Inventory
with Grays Harbor and
Pacific Counties
Building Exposure in
the 1A Model
Tsunami Simulation
Percent of Total
Building Exposure
(1A Model)
Building Exposure in
the L1 Model
Tsunami Simulation
Percent of Total
Building Exposure (L1
Model)
Residential Building $4,189,884,539.77 $2,053,988,829.59 49% $1,961,920,580.24 47%
Commercial Building $592,579,011.69 $356,795,572.74 60% $361,057,178.34 61%
Other Building $1,359,469,698.46 $445,845,245.60 33% $573,336,442.20 42%
Total $6,141,933,249.92 $2,856,629,647.93 47% $2,896,314,200.78 47%

CONCLUSIONS • The goal of the RiskMAP project is to reduce the loss of life and property • The current counties included in the RiskMAP project are Grays Harbor, Pacific,
Mason, Skagit, Whatcom, Island, Clallam, Jefferson, and San Juan • Some challenges we encountered include: county occupancy definitions / one
parcel, multiple buildings / centroid readjustment / county gaps in info / tax exempt buildings (gov) / data gaps ( including building value, area, year built, number of stories)
• UDF – most significant data source and can supply all the data needed for other inventory. Gives individual building evaluations, instead of aggregated / census block/tract evaluations
• We have created detailed procedure manuals on how to prepare the UDFs using the correct Hazus formatting, how to create the final UDF file, how to update essential facilities and general building stock in CDMS, how to download and prepare shakemaps in Hazus, and how to run the EQ and FL models in Hazus
• An official report will be made available soon (for Grays Harbor County)