ws hazus intro_slides
TRANSCRIPT

HAZUS-MH for Decision Makers Transcript
Copyright © 2006 ESRI
All rights reserved.
The information contained in this document is the exclusive property of ESRI. This work is protected under United States copyright
law and other international copyright treaties and conventions. No part of this work may be reproduced or transmitted in any form or
by any means, electronic or mechanical, including photocopying and recording, or by any information storage or retrieval system,
except as expressly permitted in writing by ESRI. All requests should be sent to Attention: Contracts and Legal Services Manager,
ESRI, 380 New York Street, Redlands, CA 92373-8100, USA.
The information contained in this document is subject to change without notice.
@esri.com, 3D Analyst, ADF, AML, ARC/INFO, ArcAtlas, ArcCAD, ArcCatalog, ArcCOGO, ArcData, ArcDoc, ArcEdit, ArcEditor,
ArcEurope, ArcExplorer, ArcExpress, ArcFM, ArcGIS, ArcGlobe, ArcGrid, ArcIMS, ArcInfo Librarian, ArcInfo, ArcInfo-
Professional GIS, ArcInfo-The World's GIS, ArcLocation, ArcLogistics, ArcMap, ArcNetwork, ArcNews, ArcObjects, ArcOpen,
ArcPad, ArcPlot, ArcPress, ArcQuest, ArcReader, ArcScan, ArcScene, ArcSchool, ArcSDE, ArcSdl, ArcStorm, ArcSurvey, ArcTIN,
ArcToolbox, ArcTools, ArcUSA, ArcUser, ArcView, ArcVoyager, ArcWatch, ArcWeb, ArcWorld, Atlas GIS, AtlasWare, Avenue,
BusinessMAP, Database Integrator, DBI Kit, ESRI, ESRI-Team GIS, ESRI-The GIS Company, ESRI-The GIS People, FormEdit,
Geographic Design System, Geography Matters, Geography Network, GIS by ESRI, GIS Day, GIS for Everyone, GISData Server,
InsiteMAP, JTX, MapBeans, MapCafé, MapObjects, ModelBuilder, MOLE, NetEngine, PC ARC/INFO, PC ARCPLOT, PC
ARCSHELL, PC DATA CONVERSION, PC STARTER KIT, PC TABLES, PC ARCEDIT, PC NETWORK, PC OVERLAY, PLTS,
Rent-a-Tech, RouteMAP, SDE, SML, Spatial Database Engine, StreetEditor, StreetMap, TABLES, the ARC/INFO logo, the ArcCAD
logo, the ArcCAD WorkBench logo, the ArcCOGO logo, the ArcData logo, the ArcData Online logo, the ArcEdit logo, the
ArcExplorer logo, the ArcExpress logo, the ArcFM logo, the ArcFM Viewer logo, the ArcGIS logo, the ArcGrid logo, the ArcIMS
logo, the ArcInfo logo, the ArcLogistics Route logo, the ArcNetwork logo, the ArcPad logo, the ArcPlot logo, the ArcPress for
ArcView logo, the ArcPress logo, the ArcScan logo, the ArcScene logo, the ArcSDE CAD Client logo, the ArcSDE logo, the
ArcStorm logo, the ArcTIN logo, the ArcTools logo, the ArcView 3D Analyst logo, the ArcView Business Analyst logo, the ArcView
Data Publisher logo, the ArcView GIS logo, the ArcView Image Analysis logo, the ArcView Internet Map Server logo, the ArcView
logo, the ArcView Network Analyst logo, the ArcView Spatial Analyst logo, the ArcView StreetMap 2000 logo, the ArcView
StreetMap logo, the ArcView Tracking Analyst logo, the Atlas GIS logo, the Avenue logo, the BusinessMAP logo, the Data
Automation Kit logo, the ESRI ArcAtlas Data logo, the ESRI ArcEurope Data logo, the ESRI ArcScene Data logo, the ESRI ArcUSA
Data logo, the ESRI ArcWorld Data logo, the ESRI Digital Chart of the World Data logo, the ESRI globe logo, the ESRI Press logo,
the Geography Network logo, the MapCafé logo, the MapObjects Internet Map Server logo, the MapObjects logo, the MOLE logo,
the NetEngine logo, the PC ARC/INFO logo, the Production Line Tool Set logo, the RouteMAP IMS logo, the RouteMAP logo, the
SDE logo, The World's Leading Desktop GIS, Water Writes, www.esri.com, www.geographynetwork.com, www.gisday.com, and
Your Personal Geographic Information System are trademarks, registered trademarks, or service marks of ESRI in the United States,
the European Community, or certain other jurisdictions.
Other companies and products mentioned herein are trademarks or registered trademarks of their respective trademark owners.

Guest presenter: Kevin MickeyDirector of Professional Education and Outreach
The Polis Center, Indiana University–Purdue University
HAZUS-MHfor Decision Makers
Hello. My name is Kevin Mickey and I am the director of the Professional Education Program
which is located at the Polis Center at Indiana University–Purdue University, Indianapolis. The
seminar that you are about to view HAZUS-MH for Decision Makers, represents a joint
collaboration between the Federal Emergency Management Agency and ESRI. I want to welcome
you to this seminar and I hope that you are able to benefit from your experience during this next
hour as we begin to explore this important technology.
Copyright © 2006 ESRI. All rights reserved. 1

Copyright © 2004 ESRI. All rights reserved.
Seminar overviewTopics
What is HAZUS-MH?Overview of the Hurricane Model Overview of the Flood ModelOverview of the Earthquake ModelWrap-up
During the seminar, we're first going to start out with a review of what HAZUS-MH is, how it
can help us address the issues related to hazards, and what kind of information it will produce.
We're then going to look at some examples of applications of HAZUS to the study of hurricanes,
floods, and earthquakes, and then we'll end with a wrap-up of information about how you can
obtain HAZUS, how you can obtain training for this application, and where you can find other
users that are applying the technology within their own areas.
Copyright © 2006 ESRI. All rights reserved. 2

Copyright © 2004 ESRI. All rights reserved.
What is HAZUS-MH?
Let's start out with a discussion of HAZUS-MH and what it actually is.
Copyright © 2006 ESRI. All rights reserved. 3

Copyright © 2004 ESRI. All rights reserved.
What is HAZUS-MH?Facilitates a risk-based approach to disaster management
HAZUS allows us to provide what is called a risk-based approach to disaster management. What
that means is that we can look at a geographic area and we can assess, based upon information
about hazards that have occurred in that area or might occur, whether a risk exists and what that
risk might be.
Copyright © 2006 ESRI. All rights reserved. 4

Copyright © 2004 ESRI. All rights reserved.
What is HAZUS-MH?Facilitates a risk-based approach to disaster managementCalculates scientifically-defensible damages, economic losses, and mitigation benefits
With that information we can calculate scientifically defensible estimates of damages, economic
losses that might occur as a result of those damages, and the impacts of various types of
mitigation that we could place within our areas.
Copyright © 2006 ESRI. All rights reserved. 5

Copyright © 2004 ESRI. All rights reserved.
What is HAZUS-MH?Facilitates a risk-based approach to disaster managementCalculates scientifically-defensible damages, economic losses, and mitigation benefitsIdentifies and visually displays hazards and vulnerabilities
HAZUS resides on a geographic information system. What this means is that it allows us to not
only assess whether a hazard exists, but it also allows us to visually display where that hazard is
and the vulnerabilities, such as the buildings in our community and the people who live in the
community, and how the hazard and that exposure interact.
Copyright © 2006 ESRI. All rights reserved. 6

Copyright © 2004 ESRI. All rights reserved.
What is HAZUS-MH?Facilitates a risk-based approach to disaster managementCalculates scientifically-defensible damages, economic losses, and mitigation benefitsIdentifies and visually displays hazards and vulnerabilitiesFree ArcGIS 9 extension
One of the really wonderful things about this technology is that it is absolutely free and it's an
extension of ArcGIS® 9, which means that not only do you have all the tools that HAZUS
provides, but you have everything that ArcGIS comes with as well, which opens a tremendous
wealth of possibilities for assessing, analyzing, and determining how to address hazards within
your communities.
Copyright © 2006 ESRI. All rights reserved. 7

Copyright © 2004 ESRI. All rights reserved.
What is HAZUS-MH?Includes over 200 publicly available inventory layers
Once you install HAZUS, you immediately have access to well over 200 publicly available layers
of information.
Copyright © 2006 ESRI. All rights reserved. 8

Copyright © 2004 ESRI. All rights reserved.
What is HAZUS-MH?Includes over 200 publicly available inventory layersInventory is divided into two categories
Common to all hazards• General building types and occupancies• Lifelines• Replacement costs• Demographics
That information can be broken down into two categories. One category is what we consider
common to all hazards; for example, the types of buildings that might be found in your
communities, such as residential buildings, commercial buildings, industrial, and others, and
information about how those buildings are constructed, such as are they made from wood, steel,
concrete or other materials? Other information that's common includes things like lifelines (such
as bridges), the cost to replace structures in our other inventory, and information about the people
who live in the areas that we want to study.
Copyright © 2006 ESRI. All rights reserved. 9

Copyright © 2004 ESRI. All rights reserved.
What is HAZUS-MH?Includes over 200 publicly available inventory layersInventory is divided into two categories
Common to all hazards• General building types and occupancies• Lifelines• Replacement costs• Demographics
Hazard-specific • Specific building types• Environmental data
(rainfall, elevation, etc.)
The other type of inventory information is what we term a hazard specific inventory, and this
addresses issues that are important to specific types of hazards such as earthquakes, where we
need to understand detailed information about how a building is engineered and information such
as environmental data, which is relevant if we want to, for example, study the impact of flooding
on our community. Examples of environmental data include things like rainfall, elevation, soils,
and many other types of things.
Copyright © 2006 ESRI. All rights reserved. 10

Copyright © 2004 ESRI. All rights reserved.
Why HAZUS-MH?The cost of disasters
Hurricane Hugo (1989) $1.3 billionLoma Prieta Earthquake (1989) $867.2 millionHurricane Andrew (1992) $20 billionMidwest Floods (1993) $1.17 billionNorthridge Earthquake (1994) $25 billionHurricane Katrina (2005) $200 billion+
A very important question that we need to consider is: Why do we need a tool like HAZUS-MH?
On this slide, you see a list of some of the more well-known disasters that have occurred during
the past few years, but we all need to understand that disasters do not just happen periodically.
They are something that affects us on an ongoing basis. Consider these facts: on an average, 70 to
75 damaging earthquakes occur around the planet, and it's been estimated that losses from a
future U.S. earthquake could approach $200 billion dollars. Another issue is that earthquakes, as
an example of a hazard, occur in nearly every state of this country and 45 of those states are at
risk of moderate to very high risk of earthquake events. Consider other hazards such as
hurricanes. On an average, five hurricanes strike the U.S. coastline each year and two of those
five hurricanes are typically major hurricanes.
Between 1972 and 2001, also consider that flooding was a major issue. On average, 127 people
during that period were killed by flood-related events, and between 1992 and 2001 floods actually
cost this nation more than $4.1 billion dollars on an annual basis. So we've established that
disasters are a major concern and we need a way to address those, and that leads us to HAZUS-
MH.
Copyright © 2006 ESRI. All rights reserved. 11

Copyright © 2004 ESRI. All rights reserved.
HAZUS-MH benefitsHAZUS-MH allows user to:
IDENTIFY vulnerable areas
What HAZUS will allow us to do is first to identify where we are vulnerable to disasters.
Remember that HAZUS resides on a geographic information system. This means that we can see
geographically where disaster risks might occur.
Copyright © 2006 ESRI. All rights reserved. 12

Copyright © 2004 ESRI. All rights reserved.
HAZUS-MH benefitsHAZUS-MH allows user to:
IDENTIFY vulnerable areas ASSESS level of readiness to deal with a disaster before disaster occurs
With that information we can also assess how ready we are to deal with a disaster before that
disaster actually takes place…
Copyright © 2006 ESRI. All rights reserved. 13

Copyright © 2004 ESRI. All rights reserved.
HAZUS-MH benefitsHAZUS-MH allows user to:
IDENTIFY vulnerable areas ASSESS level of readiness to deal with a disaster before disaster occursESTIMATE potential losses from specific hazard events
…and then we can estimate what the losses might be from various types of disasters—very, very
important information for a planner to know so they can effectively make plans to address those
needs…
Copyright © 2006 ESRI. All rights reserved. 14

Copyright © 2004 ESRI. All rights reserved.
HAZUS-MH benefitsHAZUS-MH allows user to:
IDENTIFY vulnerable areas ASSESS level of readiness to deal with a disaster before disaster occursESTIMATE potential losses from specific hazard eventsDECIDE how to allocate resources for most effective and efficient response and recovery
…and decide on how to allocate the resources they have in order to respond and recover from that
disaster event.
Copyright © 2006 ESRI. All rights reserved. 15

Copyright © 2004 ESRI. All rights reserved.
HAZUS-MH benefitsHAZUS-MH allows user to:
IDENTIFY vulnerable areas ASSESS level of readiness to deal with a disaster before disaster occursESTIMATE potential losses from specific hazard eventsDECIDE how to allocate resources for most effective and efficient response and recoveryPRIORITIZE mitigation measures that need to be implemented to reduce future losses
With that information, we're able to prioritize various mitigation measures that we can take and
determine how those can be implemented in order to reduce the further losses or future losses we
might see from a disaster.
Copyright © 2006 ESRI. All rights reserved. 16

Copyright © 2004 ESRI. All rights reserved.
Supported hazards
Hurricanes
Riverine and coastal floods
Earthquakes
HAZUS currently supports three types of hazard analysis, those being hurricane events, riverine
and coastal floods, and earthquakes. We're going to explore each of these hazards and the type of
information that HAZUS will provide during this session.
Copyright © 2006 ESRI. All rights reserved. 17

Copyright © 2004 ESRI. All rights reserved.
Loss estimation methodology
1. Define hazard
When we look at how HAZUS performs and how it assesses losses, it begins by a definition of
the hazard. For instance, with a flood, we need to know what the shape of the land is so that we
know where water is coming from and what happens when it arrives in our area. With an
earthquake, we need to know what kinds of soils exist. We need to know various other things in
order to best determine how an earthquake is going to impact our region.
Copyright © 2006 ESRI. All rights reserved. 18
Copyright © 2004 ESRI. All rights reserved.
Loss estimation methodology
2. Define and overlayinventory
1. Define hazard
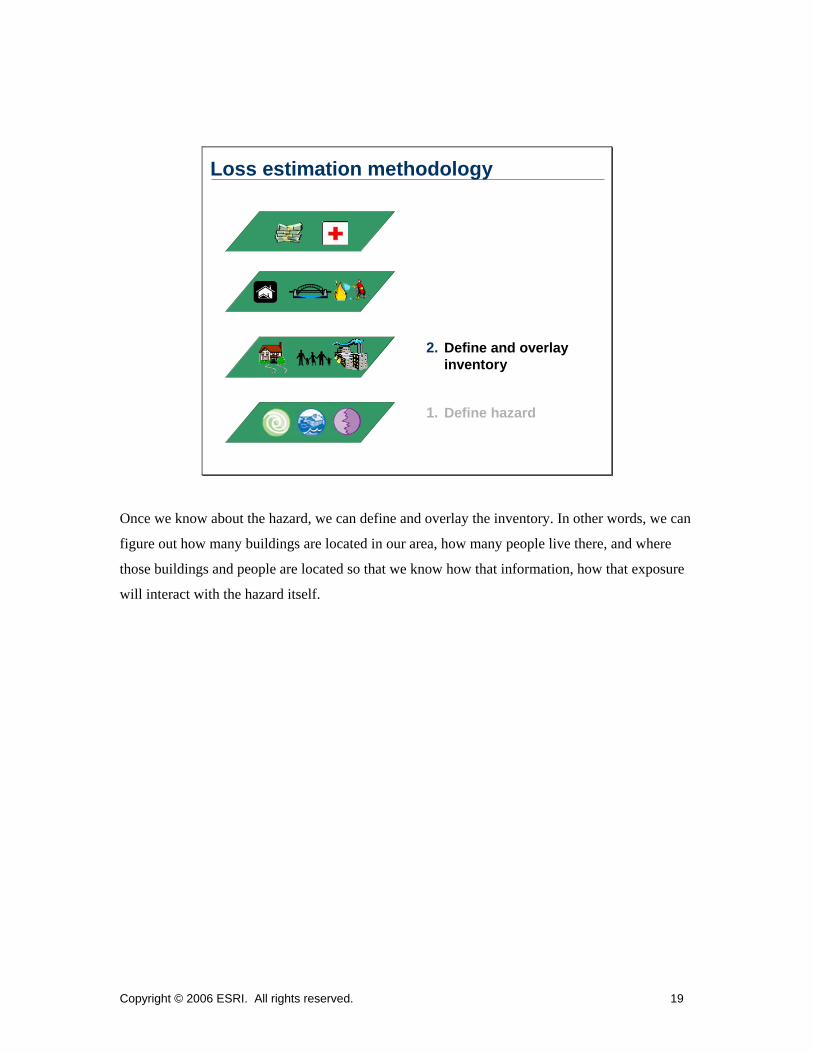
Once we know about the hazard, we can define and overlay the inventory. In other words, we can
figure out how many buildings are located in our area, how many people live there, and where
those buildings and people are located so that we know how that information, how that exposure
will interact with the hazard itself.
Copyright © 2006 ESRI. All rights reserved. 19

Copyright © 2004 ESRI. All rights reserved.
Loss estimation methodology
3. Determine damage
2. Define and overlayinventory
1. Define hazard
With that information, we're then able to determine how much damage will actually be incurred
from the disaster and, don't forget, we also can determine where that damage is going to take
place and what it's going to cost.
Copyright © 2006 ESRI. All rights reserved. 20

Copyright © 2004 ESRI. All rights reserved.
Loss estimation methodology
4. Estimate losses
3. Determine damage
2. Define and overlayinventory
1. Define hazard
That leads us to the final step in the loss estimation methodology, which is the estimation of those
losses, and HAZUS will provide us with that information as you will see in this session—not only
as tables, but also as maps and various others forms of information.
Copyright © 2006 ESRI. All rights reserved. 21

Copyright © 2004 ESRI. All rights reserved.
Damage/loss functionsAssess damage and losses based on hazard conditions
HAZUS functions, as we said earlier, based upon scientifically defensible approaches. It does this
with the use of damage and loss functions. Those functions allow us to determine what's going to
happen if a disaster takes place based upon the type of exposure we have in our area.
Copyright © 2006 ESRI. All rights reserved. 22
Copyright © 2004 ESRI. All rights reserved.
Damage/loss functionsAssess damage and losses based on hazard conditionsExample: Hurricane model has 1884 unique building categories
45 damage/loss functions for each building model~85,000 unique damage/loss curves
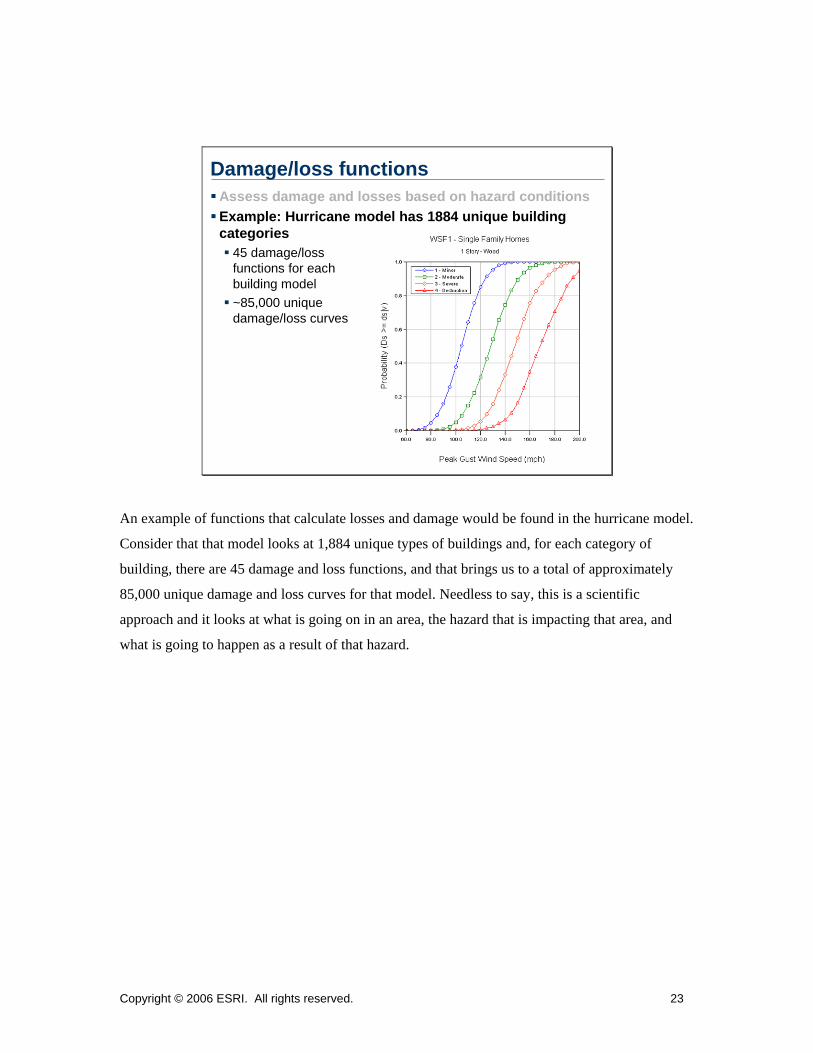
An example of functions that calculate losses and damage would be found in the hurricane model.
Consider that that model looks at 1,884 unique types of buildings and, for each category of
building, there are 45 damage and loss functions, and that brings us to a total of approximately
85,000 unique damage and loss curves for that model. Needless to say, this is a scientific
approach and it looks at what is going on in an area, the hazard that is impacting that area, and
what is going to happen as a result of that hazard.
Copyright © 2006 ESRI. All rights reserved. 23
Copyright © 2004 ESRI. All rights reserved.
Output
Generic OutputXCasualties
XXEconomic lossXXOpportunity costsXXSales declineXXSupply shortages
Indirect LossesXXXShelter needs
XCrop damageXXXIncome lossXXXCost of repair
Direct LossesXXXDebris generationXX Hazardous materials release
XFire followingInduced Damage
XXUtility systemsXXTransportation systems
XXHigh potential loss facilitiesXXXEssential facilitiesXXXGeneral building stock
EarthquakeGround ShakingGround Failure
HurricanePressure|Missile|Run
FloodFrequency Depth
Discharge Velocity
Direct Damage
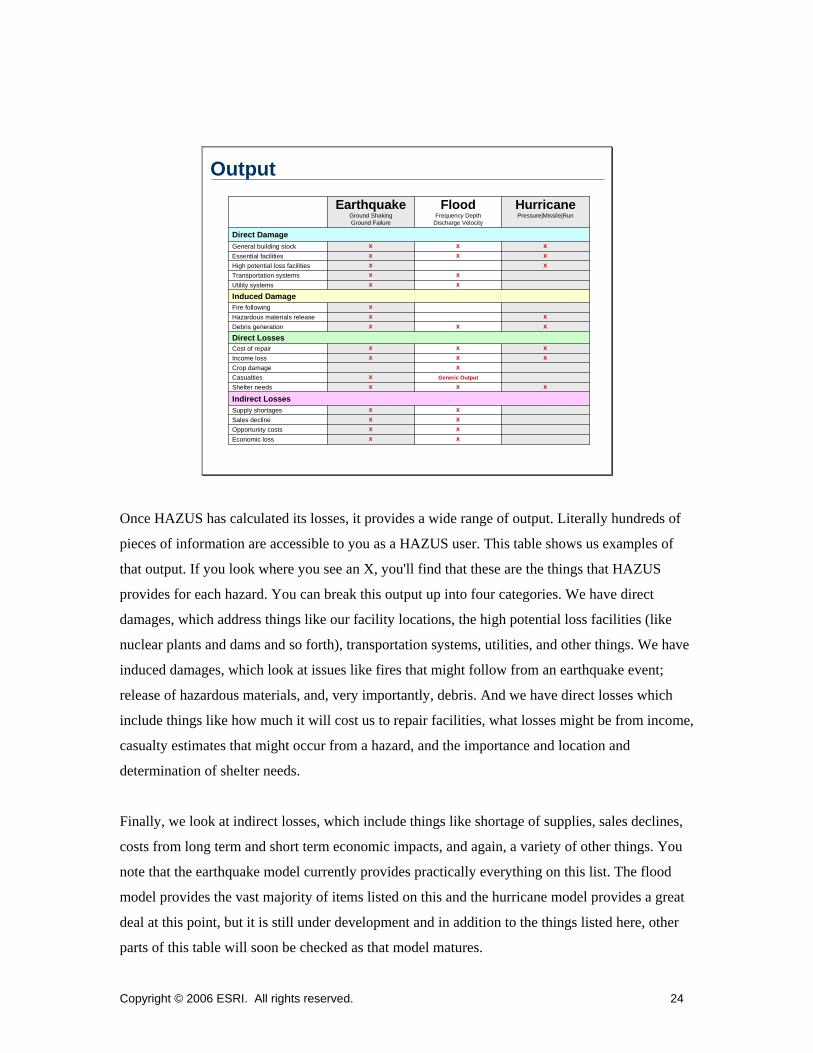
Once HAZUS has calculated its losses, it provides a wide range of output. Literally hundreds of
pieces of information are accessible to you as a HAZUS user. This table shows us examples of
that output. If you look where you see an X, you'll find that these are the things that HAZUS
provides for each hazard. You can break this output up into four categories. We have direct
damages, which address things like our facility locations, the high potential loss facilities (like
nuclear plants and dams and so forth), transportation systems, utilities, and other things. We have
induced damages, which look at issues like fires that might follow from an earthquake event;
release of hazardous materials, and, very importantly, debris. And we have direct losses which
include things like how much it will cost us to repair facilities, what losses might be from income,
casualty estimates that might occur from a hazard, and the importance and location and
determination of shelter needs.
Finally, we look at indirect losses, which include things like shortage of supplies, sales declines,
costs from long term and short term economic impacts, and again, a variety of other things. You
note that the earthquake model currently provides practically everything on this list. The flood
model provides the vast majority of items listed on this and the hurricane model provides a great
deal at this point, but it is still under development and in addition to the things listed here, other
parts of this table will soon be checked as that model matures.
Copyright © 2006 ESRI. All rights reserved. 24

Copyright © 2004 ESRI. All rights reserved.
Software demonstration
Well, why don't we go ahead and take a look at an actual HAZUS model and the kinds of things
you can actually do with this software. What you're looking at is in fact ArcMap, one of the
important applications that comes with ArcGIS. For those of you who are ArcMap users, you'll
probably recognize this screen as looking very, very familiar with one fundamental difference,
and that is the addition of the four menus that you see here: Inventory, Hazard, Analysis, and
Results.
We'll go ahead and look at some things that we find under that Inventory menu first. If we click
on the Inventory menu, we'll see a list of options drop down that allow us to find out what kind of
exposure we have within our area.
Among other things, we have what we term a General Building Stock—that is information about
structures that are found in our community based upon aggregate totals to what we call census
tracts. On the map that you see on the screen over here on the side, the areas that are shaded in the
colors here are actual census tracts. These are areas which have typically between 3,500 and
4,500 people in them. We can actually click on the General Building Stock option and go over
here to the, for example, Dollar Exposure table and HAZUS will open a window for us that tells
Copyright © 2006 ESRI. All rights reserved. 25

us what we know about how much dollar value we look at within this particular area. You'll
notice that there's a tremendous amount of information available from this window.
Let's go ahead and take a look at some of the things we find here. Under our Building tab, we
find, for instance, information about what we call General Occupancies. There are seven of those
considered in HAZUS. If we look at the column headers we can determine what those mean.
Residential structures, commercial structures, industrial, agriculture, and, by scrolling over, we
would see educational structures and some other ones. We also can look at specific occupancies
which include a breakdown of each one of those general occupancies. So we have, for instance,
single family housing, multi-family housing, and a variety of other types of categories. In
addition to information about building replacement costs, we have information about contents,
and again the same types of tables with specific and general occupancies and we can look at a
total accumulated dollar exposure as well.
One of the things that makes HAZUS a very user-friendly tool is the ability to quickly generate
thematic maps. If we go back to our General Occupancy Table type, for instance, all that we need
to do to graphically display where our dollar exposure is for residential housing (our structures) is
to click on the column labeled RES and simply click the Map button. Once we do that, what
HAZUS has done, and we can see this by clicking the OK button, is produce for us a thematic
map which shows us where residential housing is and where the greatest dollar values are actually
found. Areas on this map which are shown in the darker colors of orange, down in these areas,
indicate where we have a higher exposure of residential housing in terms of its dollar value. In
addition to the considerable amount of information we have about aggregate data, we also have a
great deal of information that HAZUS provides right out of the box and it can be enhanced based
on site-specific locations. An example of such data includes what we term Essential Facilities.
We'll click on that option and you'll note that we have five major categories of essential facilities:
medical care facilities (includes things like hospitals and health care clinics) and fire stations we'll
find as well. We'll find police stations, various emergency response centers, and schools. These
are all facilities considered critical to the ongoing functioning of a community after a disaster has
taken place.
One of the things that is really nice about HAZUS is that, again, it is user-friendly and we can
click simply on one of the tabs and tell the software that we want to map the location. In this case,
medical care facilities, only by clicking that Map button, and HAZUS will, as we'll see when we
Copyright © 2006 ESRI. All rights reserved. 26

click our OK button, generate a map that shows us where those hospitals are located and even
using an appropriate symbol.
Let's go ahead and go back to the Inventory menu and talk about a few other things here. We
have lots of other site-specific information. Here you see High Potential Loss Facilities. Again
those are the locations of individual dams and various other types of high potential loss value
facilities. You'll also see a very important option called User Defined Facilities. We can actually
use that to enter individual structures that we might be interested in modeling in our community.
That means even if HAZUS doesn't provide that information, you as a user of HAZUS can
enhance the power of this tool by adding your own data. We also have Transportation Systems
(things like bridges and roadways and various related data). Utility Systems, we'll look at many
things there. For instance, different types of water; potable versus waste, oil, natural gas, electric
facilities, and, as was the case in other tables we looked at already, we can break that information
down even more finely–in this case, facilities and pipelines. We'll go ahead and click the OK
button to close that window.
There's a great deal of information found under that Inventory menu. We also have hazardous
materials, demographic data about how many people live in that area, when buildings were
constructed, and a variety of other important types of information. Now one of the great
advantages of having HAZUS designed on a GIS platform, such as ArcGIS in this case, is that
not only can we take advantage of the powerful amount of information this tool comes with right
out of the box, but we can quite easily add additional information to our maps as well to provide a
context for what it is we're studying.
For example, in this case, I'm simply going to go to the View menu and go to a bookmark, which
is just a preset map that I've designed. We'll come down here to specifically a smaller area of that
larger geography in southern Alabama and we'll go ahead and very easily add streams to the map.
Let's go ahead and turn off these other layers so you can see that. We can add streams, we can
add roads, we can add railroads, and we can add a great deal more. We can even add photography
to this map. I'll take advantage real quickly here of a tool that comes with ArcGIS, again, right
out of the box, called our magnifier, and we can add free photography to see very quickly what is
actually located in that area. Now, imagine yourself as a HAZUS user determining where
damages are expected to occur and then being able to integrate other information such as
Copyright © 2006 ESRI. All rights reserved. 27

photography so that you can better understand and explain what the impacts are of those hazards
on your community.
Let's go ahead and close this window and we'll come back and take a look at some other
information here. We’ll clean this up just a bit and go return out to our full window once again.
There are some other things that we'll find in HAZUS in addition to all that inventory
information. Our second menu is the Hazard menu. This is a wonderful resource that allows us to
model various types of disasters that we believe might occur in our community and then we can
see what the impacts of those disasters might be.
We'll come to this Hazard menu in this example and we'll choose Scenario and it opens up a nice
wizard for us—easy to use. We'll click the Next button and we'll take a look at an example of a
historic hurricane. We'll click on Historic and choose the Next button. This will then elicit a list
of all the hurricanes that are category 3 or higher that have occurred between 1900 and 2001.
Again this information is right out of the box with HAZUS. We've not provided it with anything
at this point. Everything is right with the toolset. We can even click on the Region Filter button
and that will filter out for us any storms that have not had some impact on the area that we're
studying. We call that area our study region.
We can go ahead and click on one of these storms. We'll choose Hurricane Opal as an example in
1995 and we'll click the Next button. What that will then do is produce for us a map that shows us
where Hurricane Opal passed through, and that's indicated by this black line on the map, as well
as information about how strong the winds were from that particular storm. Now remember we
can now take that information and we can assess what might happen to our community based
upon what kinds of structures and what kind of population are located in that area and what might
then occur today were that same storm to happen. We click the Next button and it gives us a
description of that scenario and click Next again and in this case we'll say no because we've
already loaded a scenario that we're going to look at in just a few minutes. So we'll choose Next
and finally finish the wizard.
Another thing we can do as users of HAZUS, we can come to our Analysis menu. We can
actually understand exactly how it is calculating damages. If we come to Analysis and we go to
Building Damage Functions, for instance, HAZUS will produce for us a window. We'll resize that
so you can see it better. It will produce for us a window which will show where damage occurs
Copyright © 2006 ESRI. All rights reserved. 28

under certain conditions. For instance, we can look at a type of building such as a wood structure
and we can open our menu options here and we find out that we can look at different types of
wood structure based on whether they're single family homes and how many stories, whether
they're marginally engineered multi-family units, and just a variety of other things. If we click on
a single family home as an option, HAZUS in this right panel will produce for us the Damage
Function Curve which tells us with the different curves how strong wind has to be (which is
shone here on the bottom axis) for certain types of destruction to occur, which give us a
probability of destruction on the y axis. You can see the minor destruction occurs with smaller
amounts of wind or lesser amounts of wind and major destruction has to require higher amounts
of wind. Intuitive, but again scientifically-based information.
You remember, I did say that the Hurricane Model, which is what we're looking at now, has
thousands of damage functions. It doesn't look like that might be the case here on this window,
but you can start seeing how that might be possible when we go over here and change, for
instance, the type of roof that we're dealing with. Again, note the damage functions change here
now. Whether or not there's secondary water resistance present, what type of roof deck
attachment we might be looking at, and just many, many other things. Again, this is what makes
HAZUS so powerful because it's so user-friendly and it's scientifically assessing those damages.
Let's go ahead and close this Damage Function Viewer and take a very brief look at our Results
menu. Under the Results menu, we're able to determine what we expect might happen to our
community if the type of disaster that we're describing to the model were to take place. Now in
the next section, we're going to look specifically at output from a major Hurricane Model that
might take place within this area and we'll explore this Results menu in considerable detail at that
time.
Now, let's go ahead and switch back over to our presentation and summarize where we're at, at
this point.
Copyright © 2006 ESRI. All rights reserved. 29

Copyright © 2004 ESRI. All rights reserved.
ReviewWhat is HAZUS-MH?Why HAZUS-MH?
The cost of disastersHAZUS-MH benefitsSupported hazardsLoss estimation methodologyDamage/loss functionsOutput
So far, we've come along and talked a little about what HAZUS is, why HAZUS is important in
terms of how much disasters cost our nation every year, what kind of benefits that the tool can
provide to us, what it can do in terms of hazards support, and how it actually functions in terms of
its methodology and loss functions. And we started to look at the output, but now we're going to
explore that information in considerably more detail.
Copyright © 2006 ESRI. All rights reserved. 30

Copyright © 2004 ESRI. All rights reserved.
Overview of the Hurricane Model
Let's go ahead now and take a detailed look at the hurricane model.
Copyright © 2006 ESRI. All rights reserved. 31

Copyright © 2004 ESRI. All rights reserved.
Supported statesModel includes 22 gulf and east coast states as well as Hawaii
The HAZUS hurricane model supports 22 Gulf and East Coast states as well as the state of
Hawaii, all shown graphically on this slide.
Copyright © 2006 ESRI. All rights reserved. 32

Copyright © 2004 ESRI. All rights reserved.
Hurricane scenariosIndividual storms
User-definedHistorical
There are many, many different kinds of scenarios that you as a HAZUS user can run. For
instance, you could select to define an individual storm. For instance, you could literally come
along and tell the model that you want to predict the loss estimates from a storm that travels a
certain distance with a certain type of strength at a certain speed and the model will predict those
losses. As you also saw, the model comes with literally hundreds of storms based upon historical
events and you can then look at what might happen to your community were one of those
historical storms to occur at this time based upon what type of exposure your community has to
hazards.
Copyright © 2006 ESRI. All rights reserved. 33

Copyright © 2004 ESRI. All rights reserved.
Hurricane scenariosIndividual storms
User-definedHistorical
Probabilistic
In addition modeling individual storms, we can also do what is called a probabilistic analysis.
This looks at the statistical likelihood of a hurricane of a specific size occurring within the area
that you defined and then it looks, of course, at what kind of losses you might expect from that
type of an event.
Copyright © 2006 ESRI. All rights reserved. 34

Copyright © 2004 ESRI. All rights reserved.
Major HurricaneU.S. Gulf Coast
Software demonstration
Now let's go ahead and take a look at a specific example. In this case, we're going to examine
what might happen if we were to have a major hurricane along our U.S. Gulf Coast and again
we'll return back to the same model we looked at previously. We'll click again on the HAZUS
window and let's see what we can find out.
First of all, what we can do with this tool is we can come under our Results menu and we can
actually map the wind speeds. So we'll go to Wind Speeds and we're allowed to view a table
which shows us how strong that wind was at its maximum in terms of the peak gusts as well as
the maximum sustained miles per hour that that wind was having within each area. That
information is reported on the basis of census tracts, which again are areas on our map over here
that have around 3,500 to 4,500 people in them. We can again click on any one of the columns in
the table, and simply by clicking the Map button, we can graphically see where the winds might
have been strong. We'll close this window.
Here, what you see displayed is a line, which represents where our storm might have occurred as
well as the peak wind gusts that might have been associated with that particular storm event.
We'll go ahead and move over to some more results. Let's go to our Results menu and let’s take a
look at what we might expect to happen to our building stock were we to have this kind of an
Copyright © 2006 ESRI. All rights reserved. 35
event. We'll go down to General Building Stock and we'll take a look specifically at building
stock by occupancies. You might recall from earlier what that refers to is what kind of use
buildings are actually placed for. This includes the things listed here on the slide: Residential,
Commercial, Industrial, Agricultural, Religion, Government, and Education. What we can now
do is we can select one of these things.
Let's take a look at Residential and we can look at a probabilistic estimate of whether or not we
expect certain types of damage. Here we see Minor damage, At Least Minor, Moderate, and we
can go across this table to look all the way to the likelihood of destruction of residential structures
in each one of these census tracts. We'll go ahead and click on a Severe column here to see which
areas we can expect severe destruction for residential buildings. We'll click the Map button and
again, HAZUS will generate for us a thematic map. We'll close this window. What you can now
see is a map where we see areas highlighted in orange here. Those are areas where we expect the
highest amounts of destruction. Where we see the lighter colors, those are areas where we expect
less destruction. Not surprisingly, the greatest amount of destruction from wind-related hurricane
events of this type would be found along the coast, where those winds will initially be the
strongest and then decreasing inland as the hurricane travels farther away from the water. We can
also see the wind speeds associated with those different census tracts because we mapped that
earlier. But nothing prohibits us from unchecking that information since this is after all a GIS, and
that means we can look simply at where we expect the severe residential destruction. Remember
this is a geographic information system, so we can quickly display different types of information
and we can see how that information relates just by the click of a button.
Let's look at some other results. Let's go to our Results menu once again and we'll come down
this time to one of our site-specific tables. We'll choose Essential Facilities. Let's take a look at
where we expect schools to sustain negative impacts from this hurricane. We'll click on the
Schools tab. What we'll find is a great deal of information, but unlike what we looked at with
General Building Stock, this again is reported by individual schools. So we can actually look at
individual school buildings, and we're able to determine how many days those buildings are likely
to be unavailable and the probabilities, again, of different amounts of damage occurring in
relation to those facilities. Let's go ahead and click on our Severe column to find out which
schools are expected to possibly be severely damaged. We can click on the Map button. Again,
HAZUS generates a useful map for us. We'll uncheck our severe for residential and we can
quickly see by looking at the darker colored symbols on the map which schools are likely to
Copyright © 2006 ESRI. All rights reserved. 36

sustain the greatest amounts of damage. This information is extraordinarily helpful for that
mitigation planner who wants to go out and determine where they need to look at different types
of buildings because of more risks that might be present in some areas versus others.
We'll go ahead and uncheck this layer so we can look at some more information. Another thing
that we find that’s very helpful in HAZUS is that it gives us estimations of degree. If we go to our
results option, we can come down to the Debris table and we'll notice that not only do we get
estimates of debris, but it's broken down by different types of material. Here we see a distinction
between brick and wood debris and concrete and steel debris. This is an indication of what kinds
of equipment are going to be required to actually remove that debris after the disaster has
occurred, and we can actually determine where that debris is located again by clicking the Map
button to see where we expect those problems to take place. We can also look in the Hurricane
Model at tree debris-related material and we can map that information as well.
Let's look at one final table and then we'll explore a few other reports. Let's click on our Results
menu once again. In this case, we'll come down to the Shelter option. What you'll find in the
Shelter tables for all the models (Hurricane, Flood, and Earthquake) is a distinction between
households that are displaced, which are people who are going to have to leave the area based on
damage to their homes, versus people who might require short term shelter. That distinction is
determined based upon the income of the population in the individual areas of your community,
whether they have homeownership, the age of the people living there, and a variety of other
things. You as the user can come in and actually modify the parameters used to determine shelter
needs and HAZUS will again reassess losses if you have done so. We'll go ahead and click on the
Close button.
Let's take a look at a few of the reports we might see as a result of this event. We'll come to our
Result option and we'll walk down to Summary Reports. What we are shown now is a window
which lists the many different reports that HAZUS will provide to you, again, right out of the
box. Here we find a list of reports related to our inventory. In other words, what is at risk in our
region? We find a tab labeled Buildings, where we're able to see how much damage to different
types of buildings we can expect from the event that we're studying. We find Induced Losses,
which in the hurricane example include only debris, and we'll find Direct Losses, which for
hurricanes include economic losses for our buildings and our shelter requirements, and then we'll
Copyright © 2006 ESRI. All rights reserved. 37

also find some miscellaneous reports which include two important reports which are often used
by HAZUS users.
One is the Quick Assessment report and we'll view that simply by clicking the View button and
HAZUS will then generate the report by going to the actual data that you provided for your
region. Again, out of the box or information that you have provided and with this Quick
Assessment Report, we're able to, as the name implies, quickly get some information about our
region. Here we find Regional Statistics–for example, the number of buildings that are located in
the region, the number of people living in the region that we see here, and the dollar exposure for
both residential structures and all structures combined.
We are also able to come down and see what might happen from our specific scenario results. So
we can see that the maximum peak gust wind speed is 159 miles per hour in this model and the
amount of damage to different types of buildings at different damage levels, here minor,
moderate, severe and so forth, is what is shown on here. Again, remember these numbers are only
approximations and the quality of the data that you supplied to the model will help derive those
numbers to a more realistic estimate, but they are exceptionally useful from a planning
perspective since it allows us to better understand where we are at risk within our communities.
We will also find other information on this and other reports, things like shelter estimates and
economic losses.
Let's take a look at one of the more detailed reports now. We'll close this window. Again return to
our Summary Reports window and we can come down to our Buildings tab in this case. Let's
look at our Damage by Building Count by Building Type. We'll click on our View button. What
we're able to now find is a breakdown. Go ahead and resize this window so we can all see. We'll
find a breakdown by county within our state that we're interested in, by type of construction
material, listed here on the side, and, again, by the amount of damage: none, minor, moderate,
severe, and so forth—giving us a rough estimate or estimate of the number of buildings that we
can expect to sustain damage from this particular type of event. Again, lots and lots of wonderful
information that we are then able to use to better plan for and prepare for disasters of the type that
we might be studying in this scenario.
We'll go ahead and close this window and let's look at one of the really useful reports. We'll go
over here to our Other Reports tab and click on Global Summary Report. This is a report and we
Copyright © 2006 ESRI. All rights reserved. 38

open it up with the View button. This is a report that will give us kind of the big picture of what
we expect to take place within our particular study area. So we'll go ahead and we'll scroll
through. We'll start out by looking at a table of contents about what's actually found in the report
and we'll continue with what is a description of the area that we're looking at. Here we're
exploring a region that has approximately 21,000 square miles and about 379 census tracts with
approximately 540,000 households and a population of about 1.4 million people. Again,
remember that this information comes right out of the box as soon as you install HAZUS, so it's
valuable for its information resources even before you do analysis with the model.
We'll go ahead and continue through the report and we find we have an estimate of approximately
500,000 buildings, which have a value of approximately $68 billion dollars. You then find a
breakdown of different classifications of buildings and how much value those buildings actually
have. Here we find, for instance, that residential structures occupy the vast majority of our
exposure within this particular region.
We'll go ahead and now continue through the different scenario or the scenario we've defined.
We're able to look at the specific parameters that have been entered for this hurricane event. We
are able to see that we entered three specific points in time and the amount of time between each
point, because that tells us how fast that storm has traveled, the winds at each point in time, and
the associated pressure, and so forth. With that information, HAZUS is then able to calculate our
losses. We can now see those losses by moving through some of the rest of the report. For
instance, we're looking at around 170,000 buildings with moderate damage, which is a significant
percentage of buildings in the region, and approximately 50,000 of those buildings might be
completely destroyed. If you want more information, you can then scroll down and look at a
breakdown of damage by the amount of damage, by the amount of structures, and by the different
occupancies, again, that HAZUS supports.
Remember, again, that this is a general report. You can get much more detail by going to the
individual tables if you so desire. We can even scroll down and look at different types of
buildings by construction materials. We can move to some of the other pages and look at our
essential facility damages. So, a breakdown of how many structures are likely to be moderately
damaged versus totally damaged, and how many structures will be expected to have certain losses
of use. We can continue moving through and find estimations of debris. This is often something a
planner needs to consider. In this case, for this particular event, again, just for the study region in
Copyright © 2006 ESRI. All rights reserved. 39

southern Alabama, were this storm that we looked at to occur, we'd be looking at as much as 70
million tons of debris requiring over 100,000 truck loads if we chose to remove that debris from
its location. We have an estimation of shelter requirements with 123,000 households likely to be
displaced and as we all know from recent events, those kinds of numbers are fairly realistic.
If we continue to move through the report, we look at building-related losses and it gives us an
estimation of how much we can expect in losses and it breaks information on our economic losses
down by property damage for different types of categories, as well as business-related
interruption losses. Again, we can continue through these reports and find more and more
information that allows us as planners and responders to prepare for events of this type. Let’s go
ahead and close this window and our report window and we'll move on to our next hazard.
Copyright © 2006 ESRI. All rights reserved. 40

Copyright © 2004 ESRI. All rights reserved.
Overview of the Flood Model
The next hazard we're going to explore is the flood model.
Copyright © 2006 ESRI. All rights reserved. 41

Copyright © 2004 ESRI. All rights reserved.
Flood scenariosSpecific return intervals
When you look at what HAZUS can do in terms of flood modeling, it actually provides a wide
range of capabilities. An example is the ability to study what we term specific return intervals. An
example of a return interval might be a 100-year return interval, where we're looking at an event
that has a 1 percent chance of being equaled or exceeded in any given year.
Copyright © 2006 ESRI. All rights reserved. 42

Copyright © 2004 ESRI. All rights reserved.
Flood scenariosSpecific return intervalsSpecific discharge frequency (riverine)
We can also look at a specific discharge frequency. That literally means that you can enter into
the model individual streams and the amount of water that is flowing through those streams. And
you can assess where that water will go and what's likely to happen to our exposed inventory—
again, those buildings and the population where the flooding takes place. Such information as
discharges can even be obtained from the Internet, using either historic information or, in some
cases, near real-time data.
Copyright © 2006 ESRI. All rights reserved. 43

Copyright © 2004 ESRI. All rights reserved.
Flood scenariosSpecific return intervalsSpecific discharge frequency (riverine)Annualized losses
You can also, with the flood model, examine annualized losses. This is a situation where, as a
planner, I need to determine what I can expect might happen in my community in terms of losses
from flooding on an annual basis so I can more effectively plan for responses to flooding-related
events.
Copyright © 2006 ESRI. All rights reserved. 44

Copyright © 2004 ESRI. All rights reserved.
Flood scenariosSpecific return intervalsSpecific discharge frequency (riverine)Annualized lossesQuick look
The HAZUS flood model also provides a tool called the Quick Look tool, which allows us to
actually say to the model that we believe water is located in a specific area and it is a specific
depth and then allows us to look at what might have happened to our general building stock as a
result of that water being where we say it is.
Copyright © 2006 ESRI. All rights reserved. 45
Copyright © 2004 ESRI. All rights reserved.
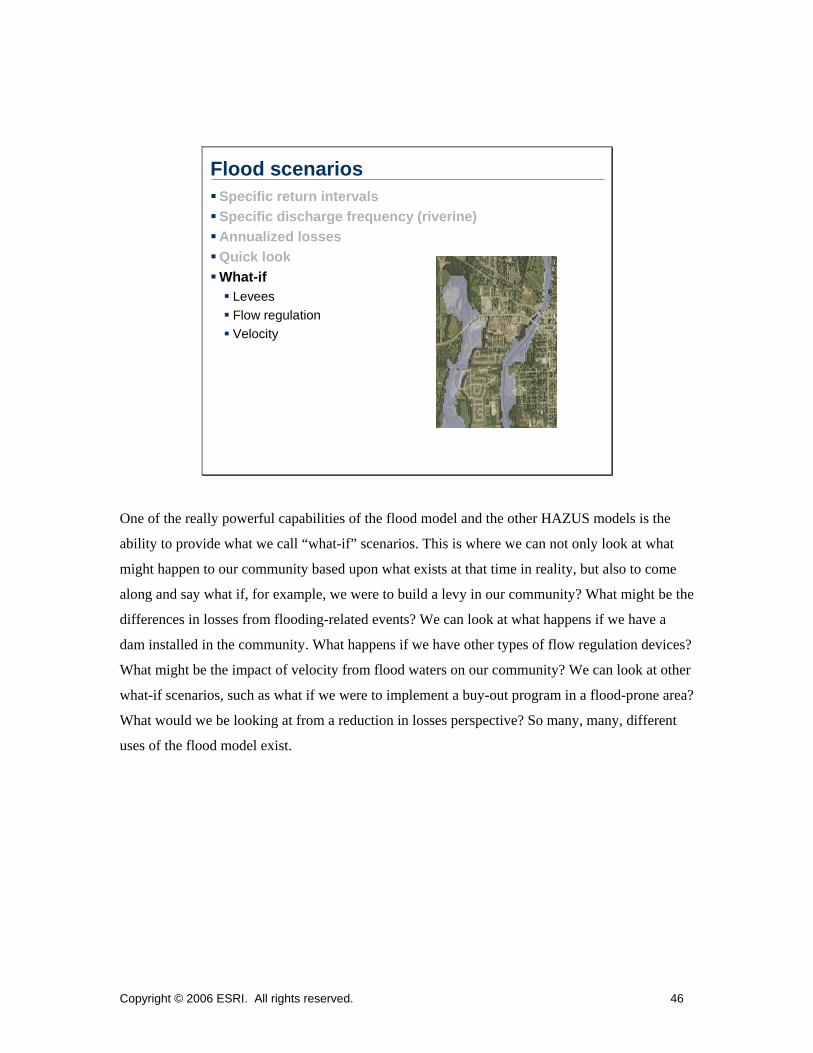
Flood scenariosSpecific return intervalsSpecific discharge frequency (riverine)Annualized lossesQuick lookWhat-if
LeveesFlow regulationVelocity
One of the really powerful capabilities of the flood model and the other HAZUS models is the
ability to provide what we call “what-if” scenarios. This is where we can not only look at what
might happen to our community based upon what exists at that time in reality, but also to come
along and say what if, for example, we were to build a levy in our community? What might be the
differences in losses from flooding-related events? We can look at what happens if we have a
dam installed in the community. What happens if we have other types of flow regulation devices?
What might be the impact of velocity from flood waters on our community? We can look at other
what-if scenarios, such as what if we were to implement a buy-out program in a flood-prone area?
What would we be looking at from a reduction in losses perspective? So many, many, different
uses of the flood model exist.
Copyright © 2006 ESRI. All rights reserved. 46

Copyright © 2004 ESRI. All rights reserved.
Software demonstration
100 Year FloodOrange County, Indiana
What we'll do now is explore one such application. In this case, we'll take a look at a scenario
which involves a county in southern Indiana named Orange County and we'll look specifically at
what might happen based on 100-year flood return events. We'll click back again on our HAZUS
window and, in this case, we're going to go to our HAZUS startup screen, which we can quickly
do by clicking the button up here on the upper left-hand corner of the screen and indicate that we
want to open a different study area, our study region. And we can walk through that wizard very
easily and select our model that we want to explore and tell the application that we want to look
at the flood-related implications of that model. Then we'll click the Finish button and wait just a
moment for HAZUS to open up that flood-related information.
Now, as this application opens to look at the flood model, I'll point out several things that are
very useful. What you're looking at here in the background is information about the elevation of
the terrain and the shape of the terrain in the area that we believe is prone to flooding. What's just
appeared on the screen in the orange are areas we believe would actually be flooded based upon a
100-year return period event. Now what we can do is look at what the results would be to that
community if this flooding were to occur as predicted. We can do so, again by coming to our
Results menu and telling the application that we want to view this study case or the area that
we're looking at in our examples of what this flood model has predicted. As an example, we'll
Copyright © 2006 ESRI. All rights reserved. 47

come down to our model based on the 100-year flood. When we say OK, under our Results menu,
we see now that lots and lots of information opened up and is available to us.
Let's look at just a few examples of what this flood model has predicted. As an example, we'll
come down to our general building stock; remember that's information that's aggregated to a
geographic area rather than a specific point. In this case, that area in our flood model is the level
of a census block, which is a much smaller area than a census tract based upon physical features,
such as rivers, roads, and various other things. Also, we find in this flood mModel that we can
look not only at full replacement cost—in other words, how much it will cost us to rebuild those
structures in that area—but we can also look at the depreciated replacement costs. That is really
important to us as planners because we need to be able to understand what we can expect to have
come back to us from insurant versus what is going to be required in order to rebuild in the areas
that have been damaged by flooding. If we click on the By Full Replacement option, we can see
again, the range of information that HAZUS provides, once again organized into an easily
navigable format. And if we click again on our By General Occupancy tab, we're able to easily
see that we have those major occupancy categories as we did in the hurricane model. We're also
able to look at what we term pre- versus post-firm information and this reflects whether or not in
this community we have enacted flood programs that require certain building practices to take
place when structures are constructed. For example, we might require in our communities that
first floors be built at a certain height if they're in flood-prone areas. Within this model, you can
indicate which areas do have flood regulations in place and which don't, and those tell you which
are pre-firm or pre-regulation and which are post-firm or post-regulation.
You can also look at total losses as well regardless of whether it's in a regulated area or not. As
we could in the hurricane model, we can look at the general occupancy information. But we can
also look at specific occupancies, again, breaking information down by what type of residential
structure, what type of commercial structure, and so forth. And we can look at information by
building type and again break things down to how that building is constructed based upon its
construction material. We can look at total information as well, which includes a summarization
of all types of buildings and what we're looking at as a result. As we could with the hurricane
model in most tables, we can click on a column, such as total estimated losses. These are reported
in thousands of dollars, as shown up here in our title header. If we click on our Map button, what
we're able to see again is a map that HAZUS will produce for us that shows us where we are
likely to be most susceptible from an economic loss perspective based upon what kinds of
Copyright © 2006 ESRI. All rights reserved. 48
inventory is located in different areas and based on the amount of water that is expected to be
found from this type of flooding event. On this map, where you see the darker colored areas,
those are indications, of course, that we expect more damage to occur from an economic
perspective from flooding of this type.
Now, as we could with the hurricane model, not only can we look at aggregated information such
as what we just explored, but again, we can also look at damage to individual buildings. So let’s
go ahead and turn off the layer that we just displayed and we'll come here under the Results menu
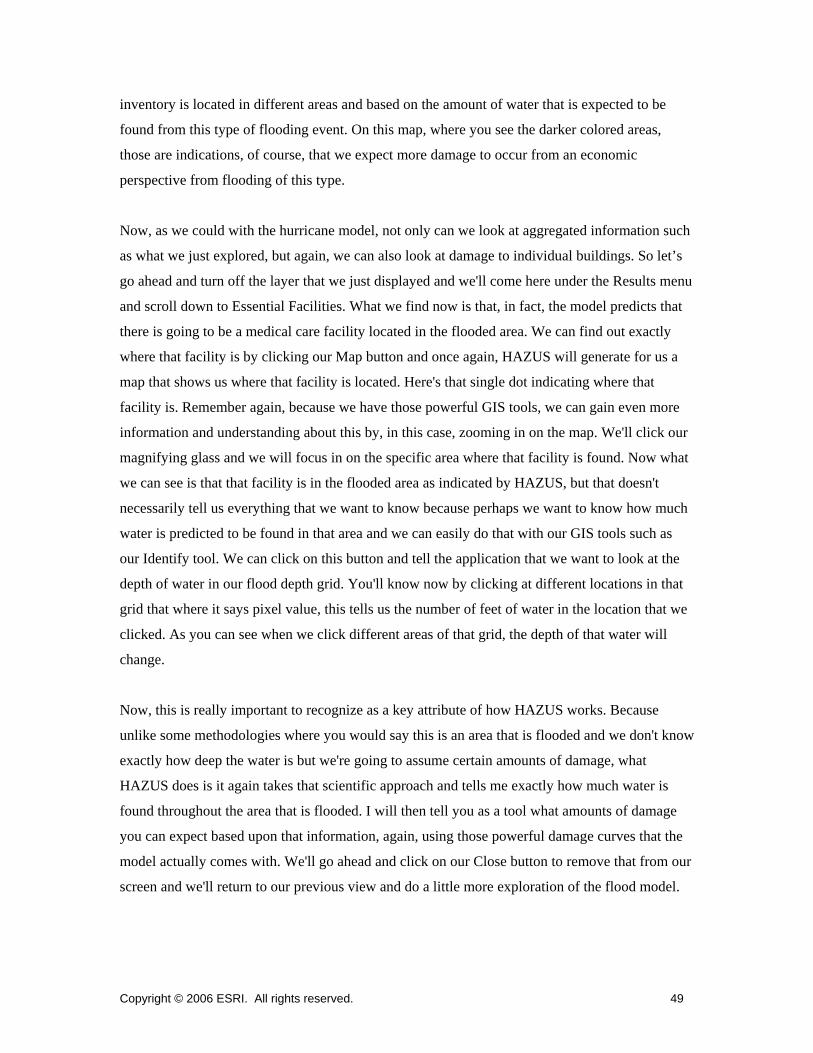
and scroll down to Essential Facilities. What we find now is that, in fact, the model predicts that
there is going to be a medical care facility located in the flooded area. We can find out exactly
where that facility is by clicking our Map button and once again, HAZUS will generate for us a
map that shows us where that facility is located. Here's that single dot indicating where that
facility is. Remember again, because we have those powerful GIS tools, we can gain even more
information and understanding about this by, in this case, zooming in on the map. We'll click our
magnifying glass and we will focus in on the specific area where that facility is found. Now what
we can see is that that facility is in the flooded area as indicated by HAZUS, but that doesn't
necessarily tell us everything that we want to know because perhaps we want to know how much
water is predicted to be found in that area and we can easily do that with our GIS tools such as
our Identify tool. We can click on this button and tell the application that we want to look at the
depth of water in our flood depth grid. You'll know now by clicking at different locations in that
grid that where it says pixel value, this tells us the number of feet of water in the location that we
clicked. As you can see when we click different areas of that grid, the depth of that water will
change.
Now, this is really important to recognize as a key attribute of how HAZUS works. Because
unlike some methodologies where you would say this is an area that is flooded and we don't know
exactly how deep the water is but we're going to assume certain amounts of damage, what
HAZUS does is it again takes that scientific approach and tells me exactly how much water is
found throughout the area that is flooded. I will then tell you as a tool what amounts of damage
you can expect based upon that information, again, using those powerful damage curves that the
model actually comes with. We'll go ahead and click on our Close button to remove that from our
screen and we'll return to our previous view and do a little more exploration of the flood model.
Copyright © 2006 ESRI. All rights reserved. 49

In addition to looking at individual facilities as we just did, we have a great deal of information
that is available to us as planners, such as estimations of how much debris we can expect,
estimations of what our shelter requirements might be, and a variety of other things such as
economic impacts. Let’s take a quick look again at our shelter needs and we'll click on our
Shelter option and as we did in the hurricane model, we note that we have an indication not only
of displaced population but also an indication of how many people are expected to need shelter
within each census block. We can map those short-term shelter needs if we need to and once
again HAZUS will produce a map where we'll see where we expect shelter demands to be higher.
And with this information, before that flooding occurs, we can try to ensure that we have those
resources in place that might help us address those shelter requirements if and when they ever
need to be addressed.
As we did in the hurricane model, we can also come to our Results menu and see a wide range of
reports. Let’s go ahead and come down to our Summary Reports tab and go to the other tab in
here. We will find a Quick Assessment Report, just as we did for our hurricane model. We'll click
on the View button and again the model will generate a report giving us a quick overview of what
we can expect in terms of losses from this type of flooding activity or event. Again, we start out
with an overview of what our region or study area looks like, how big it is—about 400 square
miles in this case. How many buildings are located in this area? How many people are found in
the area? And what kind of exposed value do we have in terms of economic risks to our buildings
in the area of concern? We can also, with the Quick Assessment Report, determine our displaced
population and short-term shelter, as well as a breakdown in a general sense of economic losses,
so we can again determine what this fairly likely flood-related event might cost our community if
it were to take place. We'll go ahead and close this window and take a look at just a few more
reports.
We come to the Results menu once again. Come down to Summary Reports and, in this case,
we'll click on our Buildings tab. Let’s examine in this situation the building damages by the
different types of occupancies. We'll click on Building Damage By General Occupancy and we
can click our View button and once again HAZUS will generate that report for us. In this case,
since we asked for more detailed information, HAZUS will indeed provide exactly what we
requested. Let’s go ahead and expand that just a bit more for you. Here, we have the breakdown
of different types of uses for buildings in the area and the number of square feet and thousands of
Copyright © 2006 ESRI. All rights reserved. 50

square feet based upon the percentage of damage that we can expect based on what the model has
predicted if we were to have a flood event of the type that we are exploring.
Let's take a brief look at economic impacts as well. We'll come down to the Results menu. Come
down to Summary Reports and take a look at our Losses tab. Here we find a wide range of
economic impacts. Something that is particularly useful to point out is again we can look at a
general overview here of damage to buildings, but we can also look at damage to other critical
parts to our community such as transportation facilities and utilities. We can do that again either
in these reports or we can look specifically at the details provided in the tables. We'll come and
take a look at direct economic losses per building as an example. Again, HAZUS will generate
that report for us. We will go ahead and resize it a bit so that you can get a good look at it. As we
scroll down here on our window, you'll note that a breakdown of economic losses has been
provided not only for capital stock losses, which include things like structural losses, contents,
and inventory, but things that can be sold in a building as well as the information related to
income losses. So what are the costs, for instance, to relocate structures? What are capital-related
losses, what are wag-related losses, and what are rental-income related losses? And again,
remember that all this information has been calculated based on the parameters that you entered
based on the inventory that HAZUS has provided or that you have enhanced (as we will discuss
in a few moments) and provided a scientifically based estimation of these losses. We'll go ahead
and close this window and look at one remaining report.
Again, we'll come to our Results menu and go to Summary Reports and I want to point out that in
the flood model in particular, we cannot only look at the things that we described, but we can
even look at information such as the losses to vehicles. What you'll find is that HAZUS not only
assesses total vehicle losses but it also looks at losses from a day-versus-night perspective
because the model inventory comes with information that indicates where we believe those
vehicles will be at specific times of the day. We'll click on Direct Economic Losses for Vehicles
for the day time and we'll view that report. We'll scroll down and once more resize so that we can
all see. When we look at the report, it's useful to point out that not only does it give you an
estimate of vehicle losses, but it looks at the type of vehicle. So we break information down by
cars, light trucks, and heavy trucks. This information takes into account how deep water actually
has to be within the area that flooding is occurring in order for those vehicles to start sustaining
damage. We'll go ahead and close this window.
Copyright © 2006 ESRI. All rights reserved. 51

Before we actually leave our HAZUS flood model exploration, I think it's also important to note
that HAZUS, for our flood model, really is not intended to replace the regulatory flood maps or
studies that might be done for a community and it is not used to set insurance rates for flood-
related events. But it has extraordinary potential and potential implications as a planning tool for
flood-related hazards in your community. Let's go ahead and look at our last example of a hazard.
Copyright © 2006 ESRI. All rights reserved. 52

Copyright © 2004 ESRI. All rights reserved.
Overview of the Earthquake Model
In this case, that will be an earthquake-related hazard.
Copyright © 2006 ESRI. All rights reserved. 53

Copyright © 2004 ESRI. All rights reserved.
Earthquake scenariosUser defined events
HAZUS has the ability to look at many different types of scenarios related to earthquakes as it did
for both hurricane events and flood events. Examples include user-defined events. For instance,
we can come in as a user of the tool and literally say that we believe an earthquake is going to
take place at a specific location at a specific depth and be of a specific size or magnitude and now
we want to see what will happen to our community as a result of inputting those parameters.
Copyright © 2006 ESRI. All rights reserved. 54

Copyright © 2004 ESRI. All rights reserved.
Earthquake scenariosUser defined eventsHistoric events
In addition, we're able to explore a database that comes with the toolset that literally provides
thousands of historic earthquake locations so we can then ask the toolset to ascertain what kinds
of damages we might expect to see if an event that has happened in the past were to once again
occur today or in the future.
Copyright © 2006 ESRI. All rights reserved. 55

Copyright © 2004 ESRI. All rights reserved.
Earthquake scenariosUser defined eventsHistoric eventsProbabilistic events
We can also, as we did in the hurricane model, look at what is termed a probabilistic event. This
again is an example of where we are looking at the statistical likelihood of an earthquake of a
certain size occurring within our area and allowing us to determine what kinds of losses we might
receive as a result of such an earthquake event.
Copyright © 2006 ESRI. All rights reserved. 56

Copyright © 2004 ESRI. All rights reserved.
Software demonstration
Magnitude 7 EarthquakeCharleston, South Carolina
Now, as we did for our other models, we'll take a look at a specific example of an earthquake. In
this situation, we're going to look at a very earthquake-prone area, which is Charleston, South
Carolina, an area that has received large earthquakes in the past and may receive them in the
future. We'll see what might happen based upon the exposed inventory in Charleston today if we
were to have an earthquake occur in that location.
Let's again return to HAZUS and move to our HAZUS Wizard and tell it we want to open up an
earthquake example. We'll click our Finish button and in just a moment, we'll see HAZUS
regenerate showing us the area around Charleston, South Carolina. Now, as we had in the
previous examples, I've already run an analysis so we're going to sit for a few minutes and take a
look at the loss estimations that might occur if we were to see an earthquake of this size that
we've described. We'll come under our Results menu first and, actually before we do that, why
don't we go to the Hazard menu and come down to Show Current and it’s useful to note that we
can actually see where the earthquake is. So we'll click the Map button and that will then display
a layer, a hazard scenario layer. That's our earthquake location. If you look on the map, this is
where the earthquake would be centered from. We'll come here now to our Results menu and
we'll start taking a look at some of those loss estimations.
Copyright © 2006 ESRI. All rights reserved. 57

We can move down to again our General Building Stock and once again, that's the aggregated
data—in this case, to the level of the census tract, as we did in the hurricane model—and we can
look at specific estimations of where we expect losses to occur. So, for instance, we'll come over
here and we'll take a look at General Building Stock By Count of Structures and we'll allow the
table to open up and tell the application that we want to look at a specific category of structures;
in this case, those being of a low design level and with a building quality “built to code.” If we
look up here under Building Type, you'll see a wide range of structure types, ranging from wood
structures to steel to concrete, and a whole variety of other types of structures. Notice that there
are many more breakdowns of building types found in the earthquake model than we found in the
other models, specifically the flood model as an example. This reflects the fact that HAZUS,
again from that scientific approach, takes into account that we need more information about
things like building construction quality and standards and so forth for some types of hazards than
we might need for others. And in this situation we'll look at a wood structure. We'll return to our
window and we are able to now see the count of the number of buildings that we expect to
receive damage.
As we saw in our previous models, this damage is broken down based upon how strong the
earthquake is expected to be across the region and the degree of damage that is expected to occur
throughout that region. So, as a case in point, let's look at where we would expect moderate
amounts of damage to occur and the number of structures listed here in this column that we
expect to receive at least moderate damage. And we'll click our Map button and once again,
HAZUS will generate a layer of information for us. We have a legend over here on the side that
indicates the number of structures within each of the areas that are colored, those census tracts
that we expect to be moderately damaged, and we're able to see in our thematic map where those
damaged areas are expected to be. So, in this case, if we look at the red colored areas, those are
areas that we expect to receive the most damage. The orange colored areas are the next most
significant damage, and so forth, in terms of the number of buildings that we expect to be at least
moderately damaged in this particular example.
As we could in both the flood and hurricane models, not only can we look at aggregate loss
estimates such as what we just explored, but we can come and look at individual structures. We'll
do that by moving to our results and, in this case, let's take a look at schools that are extensively
damaged. As you recall, schools are under our Essential Facilities table, so we'll open that table.
Note again that we have the different tabs indicating different types of essential facilities. We'll
Copyright © 2006 ESRI. All rights reserved. 58

click on the Schools tab. Here we'll see a list of the schools in our community (again, individual
buildings), and we can scroll across the table and look at the probabilities of different amounts of
damage for each one of those school structures. So, if we, for example, click on where we expect
to see extensive damage, we see probabilities of that type of damage listed for each school and, as
we can for many types of HAZUS information, we click on the Map button and the application
will generate a map for us that shows us which schools we expect to see the most damage.
Now don't forget, HAZUS is looking at the environment in which these schools are located, so
it’s taking into account information about how much energy is released from the earthquake, what
kinds of physical conditions exist (such as soils), and many other types of things that we can
either use, again, out of the box with the tool or we can enhance with locally available
information. Many, many other things exist out of our earthquake model for our results. If we
come to again, to our Results column, we can scroll down and look as an example at our Utility
Systems output and we'll see just as an indicator of how much detail is really provided in this
tool. We can look at our potable water facilities, wastewater facilities, oil systems, natural gas,
electric power, and much, much, much more.
So let's say we want to explore damages to electrical facilities. We can click on one of those
columns and again, simply map that to see where that damage is expected to occur, at which
facilities. That information then gives us the ability to place resources in the field to address
where that risk might take place, either after, during, or before that particular event happens.
We'll close this window.
And again, we'll look at one other type of very important table. If we go to Results, we can look
at our Debris table and, as we saw in some of the other models, we see that the HAZUS
earthquake model breaks debris down not only as our total debris estimation but based upon how
much effort will be required to move that debris from its location to another place where we can
actually store it or do something else. If we click our Close button, we can close that table out and
let's take a look at some of the reports out of the earthquake model.
We'll come to our Results menu and, as we saw with the other two models, we can click on
Summary Reports and scroll through a whole list of tabs that provide us again, a wide range of
information that summarizes what we expect to see in terms of losses as well as our exposure in
the area. We'll click on our Inventory tab. This gives us a description of what is at risk within this
Copyright © 2006 ESRI. All rights reserved. 59

area. Our Buildings tab describes for us what kinds of losses and damage we expect. Our
Lifelines tab tells us information about how much damage we will see to various lifelines, again,
those listed here, their functionality—in other words, are they available after this earthquake—
and information about performance of specifically potable water and electrical system
components. We can also look at induced losses, again, with the earthquake, fire estimations.
How many ignitions do we expect to see and where would those be located? We can get estimates
of debris. We can look at details about losses. In this case, we're looking at the time of day and an
estimate of casualties. We're looking at economic impacts and we can look at other types of
information, such as our Quick Assessment Reports, based upon the time of day that the
earthquake events might take place, as well as some other reports we might see.
In addition you note that a tab on this screen, called a 3rd Party tab, that reflects that HAZUS
does have the capability to integrate information from some third-party tools such as those listed
in this particular case. Let's look at a few of these reports in particular. We'll click on our Other
tab and lets look at one of our Quick Assessment Reports. If we click on our 2 a.m. quick
assessment, in other words, the middle of the night when people are expected to be located in the
residentially dominated areas, we'll click on our View button and see what might happen under
those conditions, and HAZUS will produce for us a report that says we expect this range of losses
for our economic impacts. We scroll down and find that we get an estimate of building damage in
terms of the number of buildings damaged and the degree of damage. We also get information
about casualty estimates, and it’s useful to point out that for our casualty estimates the earthquake
model specifically looks at the type of casualty from a level one severity level, which is
essentially a condition requiring aid but no hospitalization, through life-threatening injuries and
even fatalities. And, as do the other models, we get estimates of shelter requirements—how many
households are displaced as well as how much public shelter are we going to need to provide
based upon this kind of event.
We'll close this report and explore a couple of other reports. Click once again on our Buildings
tab. Let’s take a look at an estimate of how many buildings we expect to be damaged by general
occupancy. We'll click on the View button in order to derive that information and the application
will tell us. We'll expand this so we can all see again. The application will tell us, breaking down
the number of buildings by category of use, again by the degree of damage, throughout the area
that we're exploring.
Copyright © 2006 ESRI. All rights reserved. 60

I'll go ahead and close this window and look at a couple of other reports. Note that we also have
reports about site-specific locations so we can look, for instance, at hospital functionality. We'll
click our View button and HAZUS will open a report for us. Expand that so we can see it. Note
that in this case we're looking at hospitals; it looks not only at the total accumulated hospital
functionality estimates but it breaks hospitals down into categories based on their size, listed here
on the side, and how many beds are available in those facilities, which is information that comes
directly from the inventory that HAZUS comes with or that you have enhanced. It also looks at
the amount of functionality, estimated based upon how long it's been since that earthquake has
occurred. So we can look at what type of functionality for those hospitals we see on the day of the
earthquake, three days after the earthquake, seven days after the earthquake, a month after the
earthquake, and even three months after the earthquake. This information is extremely valuable
because it tells us as planners that the hospitals, assuming that our information is correctly input
in the model, are going to be of limited use, based upon the type of scenario that we described;
therefore, we need to consider how best to address likely hospitalization needs based on what the
model has told us and based on our local knowledge of the area. We can go ahead and close this
report window and take a look briefly at our lifelines. We'll click on the Lifelines tabs and as an
example we'll look at functionality and in this case we'll explore highway bridge functionality.
Click on our View button and that will open a table. This will tell us the number of bridges
available in our region and the percentage of those bridges that are expected to be functional on
the day of the earthquake, and again, at specific durations of time from the earthquake event.
Don't forget, this is a report that summarizes loss functionality for bridges. It does not prohibit us
from going to the table and looking at specific bridges so we can best assess which bridges are
most likely to be the most at risk from this type of event.
Let's close this window and look at one final report before we wrap up for the afternoon. We'll
click on our Other tab and look at our Global Summary Report. Click on our View button and
we'll wait just a moment for the report to generate. Remember, this is pulling from a live database
because this is real actual data. Absolutely nothing in HAZUS is canned. It's all pulling from
information that is provided with the model or that you've enhanced. We'll look at this Global
Summary Report again as was the case in both the hurricane and flood models. If we click our
Next button we can see our table of contents and begin seeing information about our study area.
Here we look at the size of the region (about 940 square miles in this case) and the number of
buildings that are found in the region. We discovered that 99 percent of those buildings are
associated with residential housing. We continue through a description of our exposure. We find
Copyright © 2006 ESRI. All rights reserved. 61

information about the building inventory, critical facilities, transportation, and lifelines. Moving
on to the next page we find details about things like our transportation system in terms of how
many bridges do we have, how many segments, how many tunnels, what the replacement value of
those facilities is, and much, much more. And we can keep looking at information about detailed
aspects of what our risk exposure is to utilities and various other things.
Finally, we come to the earthquake scenario that we were specifically exploring, so we look at
this large earthquake event to see what might happen to our area if it were to occur today. We
start out finding that we might be seeing as many as 80,000 buildings having moderate damage or
so. A large percentage of the number of the buildings in the region and many of those buildings
would be potentially damaged beyond repair. HAZUS will then produce for you a table that gives
you approximations of the number of buildings damaged based upon the type of use, based upon
the amount of damage that might take place. Again, if you wish, you can even look at information
by counts of buildings and type of damage based upon type of material. We can continue through
the global summary and find out more and more information about the earthquake study area that
we're looking at. So we can look at, for instance, what is our expected impact on essential
facilities? How many hospitals might we see damaged? How many would be moderately
damaged? How many completely? How many functional on the day of the earthquake? So this
information is very important from a planning perspective and we can move through and keep
looking at more information of this type. Transportation, utility-related information, how many
expected facilities we're looking at? How many fires we might see? The amount of debris
generated, shelter requirements, casualties, and much, much more. Finally, an estimation of
building-related losses.
Let's just take a moment to explore what you can do now that you have learned a lot about
HAZUS and its potential applications.
Copyright © 2006 ESRI. All rights reserved. 62

Copyright © 2004 ESRI. All rights reserved.
Wrap-up
Copyright © 2006 ESRI. All rights reserved. 63

Copyright © 2004 ESRI. All rights reserved.
Local (39%)
Military (1%)Organizations
(1%)Other (7%)
State (8%)
Federal (8%)
Universities (13%)
PrivateIndustry (23%)
Who uses HAZUS-MH?2004 Utilization Report
4,200 users in 2004, 19,600 users predicted by 200868% of states and territories for DMA 2000 Planning 15% of participating localities in multi-hazard mitigation planning
As of 2004, when the Utilization Report was conducted by FEMA, there were around 4,200 users
in the nation. By 2008, FEMA's expecting over 19,000 users of the HAZUS application. As of
2004, 68 percent of the states and territories in the country were using this tool for disaster
mitigation active 2000 planning, which is important because that provides access to post-disaster
relief dollars that might not otherwise be available. Fifteen percent of the participating localities
were also using HAZUS in a multihazard mitigation planning capacity.
Copyright © 2006 ESRI. All rights reserved. 64

Copyright © 2004 ESRI. All rights reserved.
Who uses HAZUS-MH?
Local (39%)
Military (1%)Organizations
(1%)Other (7%)
State (8%)
Federal (8%)
Universities (13%)
PrivateIndustry (23%)
2004 Utilization Report4,200 users in 2004, 19,600 users predicted by 200868% of states and territories for DMA 2000 Planning 15% of participating localities in multi-hazard mitigation planning
International usersNorway, Turkey, and Swedenpilot programs
We can look at also international applications of HAZUS in Norway, Turkey, Sweden, and a
variety of other locations and we can see that most HAZUS users do fall in local jurisdictions, but
also there's heavy use in the private industry, in the academic environment, federal and state
agencies, and other organizations as well.
Copyright © 2006 ESRI. All rights reserved. 65

Copyright © 2004 ESRI. All rights reserved.
User levels
Default hazard, inventory, and
damage information
Requireduser effort and sophistication
Level 1
HAZUS is a tool that is available to a wide range of users. Those might include people that we
term level one users, those being individuals that with a minimum of training and access to
experts in earth science or building science can come in and install HAZUS and run effective
models in order to determine what might happen to their particular communities.
Copyright © 2006 ESRI. All rights reserved. 66

Copyright © 2004 ESRI. All rights reserved.
User levels
Combinations of local and default hazard, building, and damage data
Default hazard, inventory, and
damage information
Requireduser effort and sophistication
Level 1
Level 2
Level 2 users are individuals and organizations that wish to enhance the inventory that comes
with HAZUS by integrating information such as local assessors' files and other types of data.
Copyright © 2006 ESRI. All rights reserved. 67

Copyright © 2004 ESRI. All rights reserved.
User levels
Level 3
Combinations of local and default hazard, building, and damage data
Default hazard, inventory, and
damage information
Input hazard specific
data Required
user effort and sophistication
Level 1
Level 2
Level 3 users are individuals that have the ability and the knowledge to move into HAZUS and
actually affect how it assesses damages to their environments.
Copyright © 2006 ESRI. All rights reserved. 68
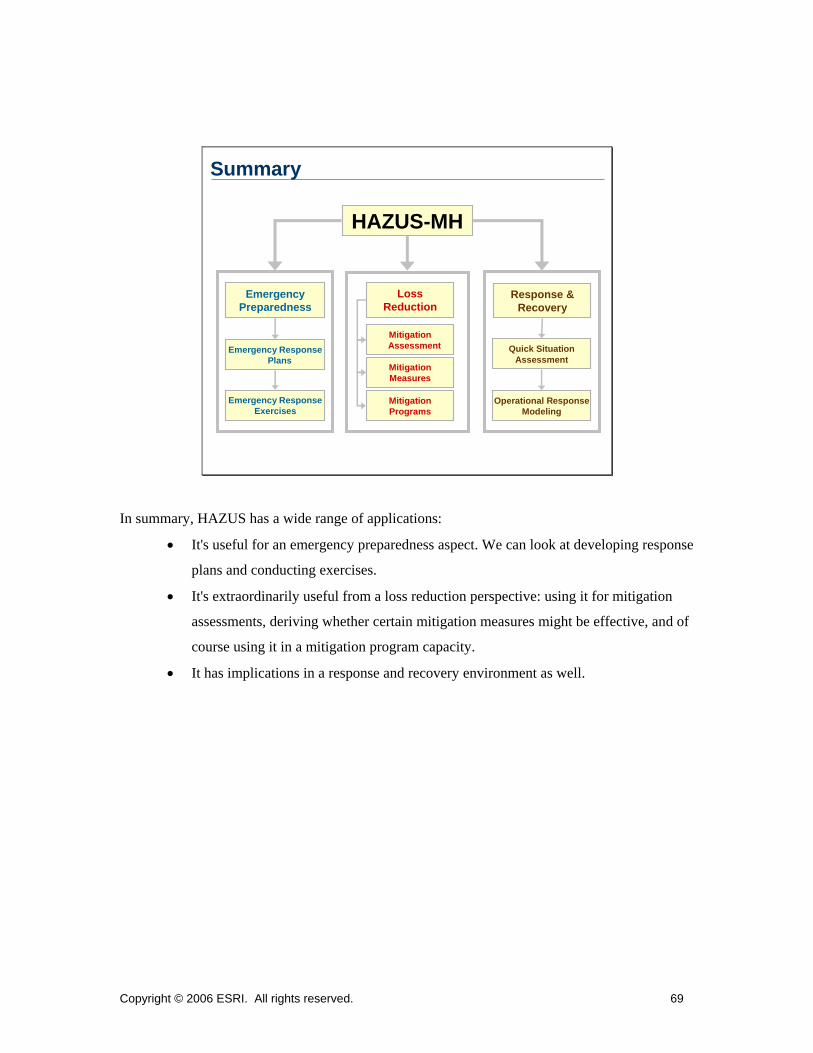
Copyright © 2004 ESRI. All rights reserved.
Summary
HAZUS-MH
EmergencyPreparedness
Emergency Response Plans
Emergency ResponseExercises
Response &Recovery
Quick SituationAssessment
Operational ResponseModeling
LossReduction
MitigationAssessment
MitigationMeasures
MitigationPrograms
In summary, HAZUS has a wide range of applications:
• It's useful for an emergency preparedness aspect. We can look at developing response
plans and conducting exercises.
• It's extraordinarily useful from a loss reduction perspective: using it for mitigation
assessments, deriving whether certain mitigation measures might be effective, and of
course using it in a mitigation program capacity.
• It has implications in a response and recovery environment as well.
Copyright © 2006 ESRI. All rights reserved. 69

Copyright © 2004 ESRI. All rights reserved.
ResourcesHazus-MH Web site (www.fema.gov/hazus)
OverviewModel detailsHAZUS LibraryUser groupsTraining
Now the important question that we will leave you with is, where do you go next? One very good
resource is found on the Web site listed on this page at www.fema.gov/HAZUS. That resource
provides an overview of the tool; details about the models; a library composed of information
such as the utilization report that we described, and much, much more; information about user
groups so that you can find out who is using HAZUS in your area and how they are using it; and
information about where you can find training on this application. You'll find that the training
resource is part of a large program that FEMA has offered and is offering to users of HAZUS
across the nation, which will provide instruction in introductory GIS applications for emergency
management all the way through advanced applications of HAZUS, teaching users and
participants how the tool works and how they can best effect changes to the environment that the
model operates in.
Copyright © 2006 ESRI. All rights reserved. 70
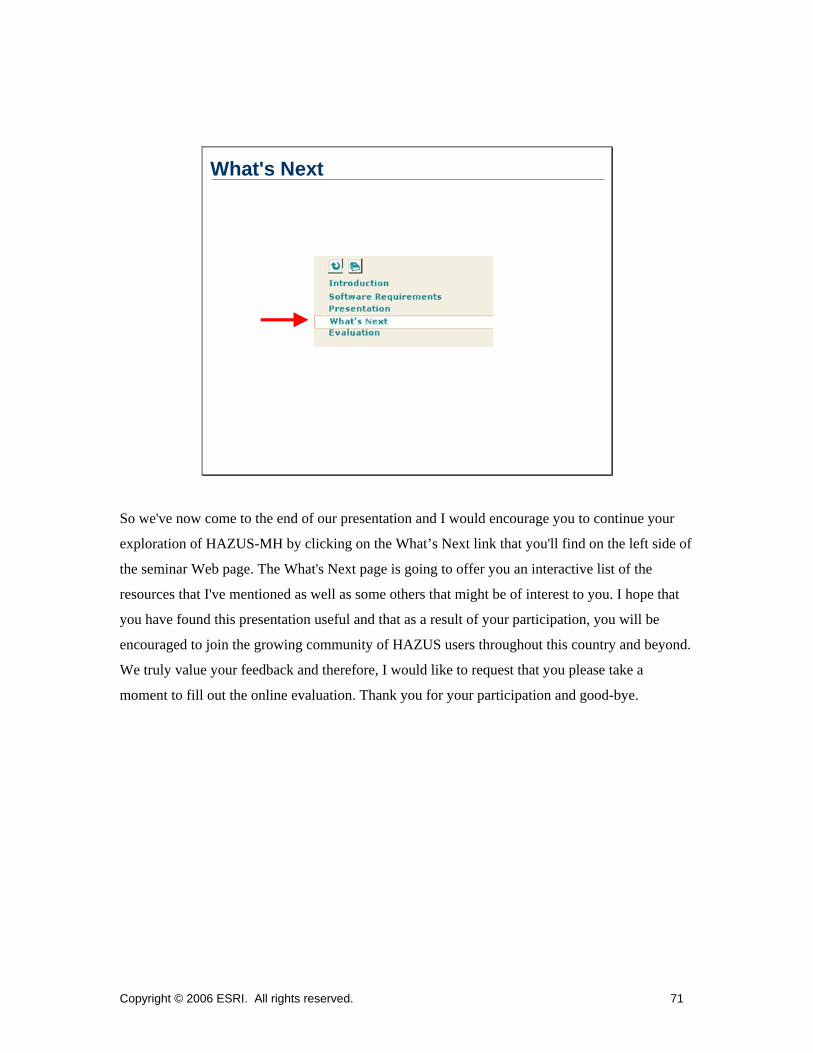
Copyright © 2004 ESRI. All rights reserved.
What's Next
So we've now come to the end of our presentation and I would encourage you to continue your
exploration of HAZUS-MH by clicking on the What’s Next link that you'll find on the left side of
the seminar Web page. The What's Next page is going to offer you an interactive list of the
resources that I've mentioned as well as some others that might be of interest to you. I hope that
you have found this presentation useful and that as a result of your participation, you will be
encouraged to join the growing community of HAZUS users throughout this country and beyond.
We truly value your feedback and therefore, I would like to request that you please take a
moment to fill out the online evaluation. Thank you for your participation and good-bye.
Copyright © 2006 ESRI. All rights reserved. 71