out-of-plane deformation of balanced and symmetric composites as measured by holographic...
TRANSCRIPT
Out-of-plane Deformation of Balanced and Symmetric Composites as Measured by Holographic Interferometry
H.W. CHANG, Bendix Advanced Technology Center, Columbia, MD
Although much work has been done on theoretical as well as experimental aspects of the dimensional stability of graphitelepoxy composites, much of the work in the literature has been limited to the measurement of co- efficients of in-plane thermal expansion using strain gages. Little information is available on the out-of-plane thermal expansion of composites. A cathetometer tech- nique has been used to measure warpage of unbalanced laminates,' but because of the low sensitivity, the tech- nique is not suitable for measuring out-of-plane expansion of those symmetrically balanced. Although lamination theory predicts uniformity of out-of-plane expansion in a symmetrically balanced composite, material imperfection can cause some warpage, although possibly too small to be deiected with conventional techniques. Therefore, the objective of this work was to measure uniformity of out-of- plane expansion of a symmetrically balanced composite using a nonconventional technique; i.e., holographic interferometry.
Experiment The material used was ( * 1 O) , 1 s laminate (7.0 x 7.0 x
0.20 cm) prepared with Fiberite 2134A pre-preg. The pre- preg contained 60-percent Thornel 300 fibers and graphite- epoxy 934. The holographic-interferometry experiments were done in the thermomechanics laboratory at the University of Manitoba.
A double-exposure holographic-interferometry technique was used. This technique relies on interference which takes place between the light from two holographic images. Both images, one before thermal deformation and the other after deformation, are reconstructed at the same time. Since each image had a slightly different light-path length due to thermal expansion, there exists a difference in phase in the light reflected from points on each image. The difference in phase causes interference, resulting in light and dark fringes on the object. The types and the numbers of fringes can be related to the types of deforma- tion and the degree of deformation, respectively.
Three phases of the holographic-interferometry experi- ment are briefly discussed below.
Making of the Hologram. Since holographic interfero- metry depends on fringes which are caused by the
difference in light paths, the technique does not make a distinction between rigid-body movement and deformation of a test sample; both change the light path, and hence cause fringes. Because of this, the test sample was fastened to a holder through a hole in the center of the sample. The holder was made of lnvar which has a low coefficient of thermal expansion.
The sample holder was placed in a Blue M convection oven. The oven was heated close to but below 170 "C. A holographic film plate (Kodak 120-02) was placed in the plate holder, When the sample temperature reached 170°C (as measured by a resistance thermometer attached to the sample) the film plate was exposed for the necessary exposure time (usually 10 seconds). When the sample temperature reached 175"C, the holographic plate was exposed once more. For the 190, 210, 230°C experi- ments, the above procedure was repeated with a new plate for each temperature with a 5°C (for 190°C test) or 1 "C (for 210 and 230°C tests) interval. At the end of the experiments, the film plates were processed and bleached according to the manufacturer's recommended procedure In all cases it was possible to obtain good clear holo- grams. This indicated that air turbulence in the oven was not a serious problem.
In most cases, for exposure times as long as 10 seconds, air turbulence creates conditions in which a hologram either cannot be formed or a hologram will be formed iyith extremely low efficiency. In the experiments described here this was not the case, perhaps due to the charac- teristics of the oven and the fact that heating rates were kept rather low and high temperature was allowed to stabilize for a few minutes. Also, the fringes on the holo- gram were sharp and continuous. If air turbulence was a problem, the fringes would exhibit a wavy, discontinuous nature. Also, since the temperature change between the two exposures was small, no compensation was necessary for any problems associated with thermo-optical properties of the oven window.
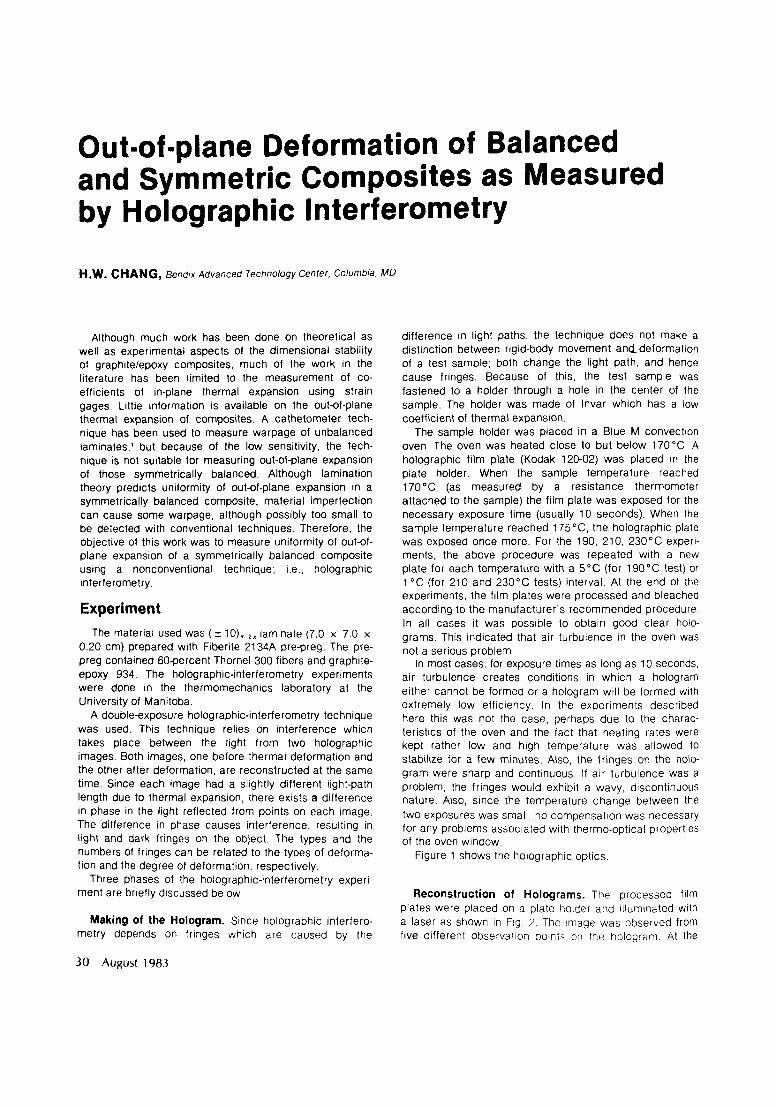
Figure 1 shows the holographic optics.
Reconstruction of Holograms. The processed film plates were placed on a plate holder and illuminated with a laser as shown in Fig 2 The image was observed from five different observation poifiis or1 the hologram At the
30 August 1983
MIRROR B
Fig. l a p t i c s
Fig. 24econstruction of hologram
OBSERVATION_t_O POINT
4 5
6 7
10 8 9
15 16 17
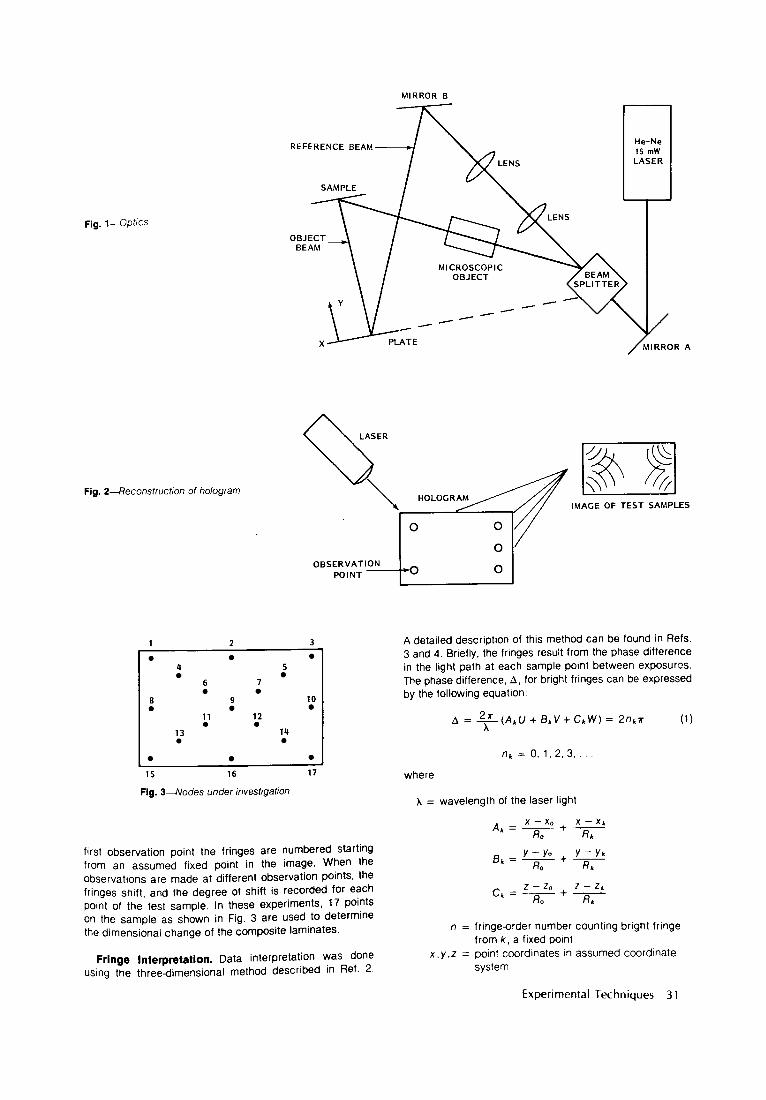
Fig. 3 4 o d e s under investigabon
first observation point the fringes are numbered Starting from an assumed fixed point in the image. When the observations are made at different observation points, the fringes shift, and the degree of shift is recorded for each Point of the test sample. In these experiments, 17 points on the sample as shown in Fig. 3 are used to determine the dimensional change of the composite laminates.
Fringe Interpretation. Data interpretation was done Using the three-dimensional method described in Ref. 2.
0 1
OF TEST SAMPLES
A detailed description of this method can be found in Refs. 3 and 4. Briefly, the fringes result from the phase difference in the light path at each sample point between exposurzs. The phase difference, A , for bright fringes can be expressed by the following equation:
(1 1 2 * A = -(AkU A + Bkv+ ckw) = 2nkT
where
A = wavelength of the laser light
n = fringeader number counting bright fringe
x , y .z = point coordinates in assumed coordinate from k . a fixed point
system
Experimental Techniques 3 1
xu.yu,zu = laser-source coordinates xh , y k .zk = observation-point coordinates
R,, = [(x - X”)) + ( y - yo)’ + (2 - Z 0 ) 2 ] ” ’
R, = [ (X - X r ) ’ + ( y - y h ) ’ + ( z - Z k ) ’ ] ’ ’ ’
In order to solve for U . V , and W in eq ( l ) , the three components of displacement in the assumed coordinate system, i t is necessary to use three observation points ( k = 1.2.3) thus forming three equations of the type of
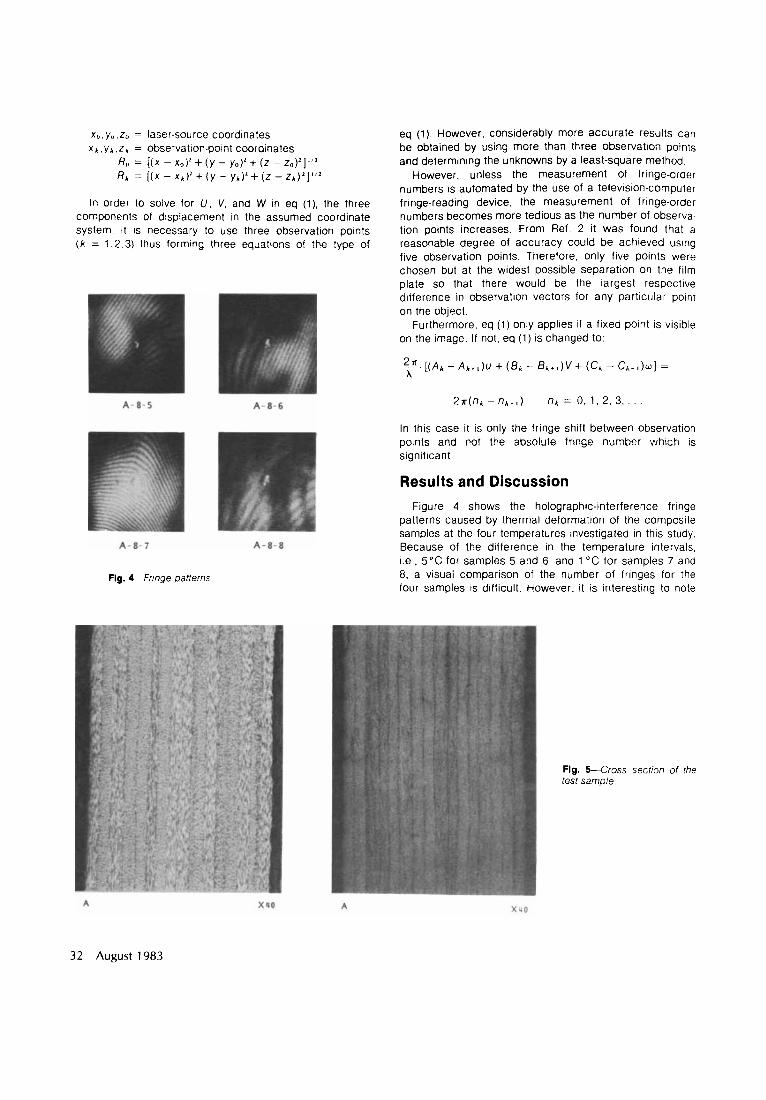
Fig. 4 2 r i n g e patterns
eq ( I ) However, considerably more accurate results can be obtained by using more than three observation points and determining the unknowns by a least-square method
However, unless the measurement of fringe-order numbers is automated by the use of a television-computer fringe-reading device, the measurement of fringe-order numbers becomes more tedious as the number of observa- tion points increases From Ref 2 it was found that a reasonable degree of accuracy could be achieved using five observation points Therefore only five points were chosen but at the widest possible separation on the film plate so that there would be the largest respective difference in observation vectors for any particular point on the object
Furthermore, eq (1) only applies if a fixed point is visible on the image If not, eq (1) is changed to
* [ ( A k - A k + , ) U + ( B k - B k + , ) v + ( c k - C , + i ) W ] = x
In this case it is only the fringe shift between observation points and not the absolute fringe number which is significant
Results and Discussion Figure 4 shows the holographic-interference fringe
patterns caused by thermal deformation of the composite samples at the four temperatures investigated in this study Because of the difference in the temperature intervals, I e , 5°C for samples 5 and 6, and 1 “ C for samples 7 and 8, a visual comparison of the number of fringes for the four samples is difficult However, it is interesting to note
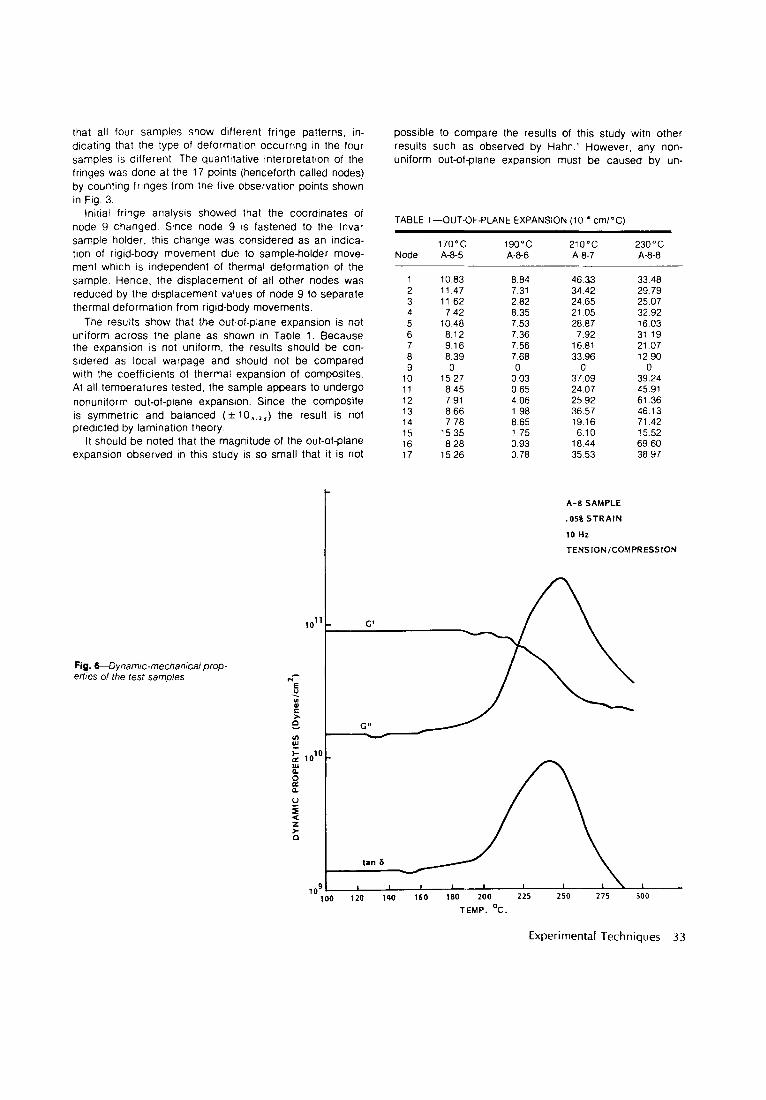
Fig. C X r o s s section of the test sampie
32 August 1983
that all four samples show different fringe patterns, in- dicating that the type of deformation occurring in the four samples is different. The quantitative interpretation of the fringes was done at the 17 points (henceforth called nodes) by counting fringes from the five observation points shown in Fig. 3.
Initiat fringe analysis showed that the coordinates of node 9 changed. Since node 9 is fastened to the lnvar sample holder, this change was considered as an indica- tion of rigid-body movement due to sample-holder move- ment which is independent of thermal deformation of the sample. Hence, the displacement of all other nodes was reduced by the displacement values of node 9 to separate thermal deformation from rigid-body movements.
The results show that the out-of-plane expansion is not uniform across the plane as shown in Table 1. Because the expansion is not uniform, the results should be con- sidered as local warpage and should not be compared with the coefficients of thermal expansion of composites. At all temperatures tested, the sample appears to undergo nonuniform out-of-plane expansion. Since the composite is symmetric and balanced ( 2 10, zs) the result is not predicted by lamination theory.
It should be noted that the magnitude of the out-of-plane expansion observed in this study is so small that it is not
possible to compare the results of this study with other results such as observed by Hahn.' However, any non- uniform out-ofplane expansion must be caused by un-
TABLE 1-OUT-OF-PLANE EXPANSION (lo-' crn/"C) ~~ ~~
170°C 190°C 210°C 230°C Node A-8-5 A-8-6 A-8-7 A-8-8
1 1083 8 84 46 33 33 48 2 11 47 7 31 34 42 29 79 3 11 62 2 82 24 65 25 07 4 7 42 8 35 21 05 32 92 5 1048 7 53 28 87 16 03 6 8 12 7 36 7 92 31 19 7 9 16 7 56 16 81 21 07 8 8 39 7 68 33 96 12 90 9 0 0 0 0
10 1527 0 03 37 09 39 24 11 8 45 0 65 24 07 45 91 12 7 91 4 06 25 92 61 36 13 8 66 1 98 36 57 46 13 14 7 70 8 65 19 16 71 42 15 1535 1 75 6 10 15 52 16 8 28 0 93 18 44 69 60 17 1526 0 78 35 53 38 97
A-8 SAMPLE
.05% STRAIN
10 Hz TENSION /COMPRESSION
Fig. Uynamc-mechanical prop- ert;es of the test samples
TEMP. 'C.
Experimental Techniques 33

symmetric nature of laminates and small nonuniformity of the out-of-plane expansion observed in this study seems to be due to imperfect symmetric lay-up caused by im- perfection of the process. This conclusion is supported by the optical photograph shown in Fig. 5. Throughout the picture, the larger boundaries are not straight lines and in some cases the thickness of individual laminae is not the same All these imperfections would cause nonuniform out- of-plane expansion of symmetrically balanced composite laminates.
Table 1 shows that most of the nodes undergo drastic dimensional change between 190°C and 210°C. In order to see whether there is any significant changes in the com- posite properties around this temperature range, dynamic properties were measured with a Rheometric mechanical spectrometer. The instrument measures elastic part (G') and viscous part (G " ) of the complex modulus and from the ratio of G' and G", (tan 6) it is possible to measure the glass-transition temperature. As shown in Fig. 6, the onset of tan 6 is around 190°C. Thus the drastic dimensional change around 200°C appears to be related to the onset of the glass-transition temperature.
In summary, the holographic technique can be success- fully used for measuring out-of-plane expansion. Because of the high sensitivity, the technique is useful in mea-
suring uniformity of out-of-plane expansion Of balanced, symmetric laminates which can be caused by the imperfec- tion of the material This was demonstrated by following the shape change of the composites at high temperature As expected, a drastic change in shape was observed at the onset of glass-transition temperatures
Acknowledgment The author would like to express his deep appreciation
to T R Hsu of the University of Manitoba for the use of his holography laboratory and to R Lewak for assisting the author with the experimentation Both Professor Hsu and Mr Lewak contributed tremendously to the author s under- standing of the holography experiments
References 7 . Hahn, H.T, Comp. Tech. Review. 3 (3). (1981). 2. Dhir, S.K. and Sikora. J.P.. "An lmproved Method for Obtaining the General-displacement Field from a Holographic lnterfero- gram, " EXPERIMENTAL MECHANICS, 12 (7), 323-327 (July 7972). 3 Hsu. T.R. and Lewak, R.. "Measurements of Thermal Distortion of Composite Plates by Holographic Interferometry, " EXPERI-
4. Pirgon, O., Wostenholm, G.H. and Yates. €3.. J Phys. D. A m / . Physics, 6, 309 (7973)
MENTAL MECHANICS, 16 (5), 782-787(May 7976).
34 August 1983