holography at the u.s. army research laboratory: … 1. introduction the u.s. army research...
TRANSCRIPT

Holography at the U.S. Army Research Laboratory:
Creating a Digital Hologram
by Karl K. Klett, Jr., Neal Bambha, and Justin Bickford
ARL-TR-6299 September 2012
Approved for public release; distribution unlimited.

NOTICES
Disclaimers
The findings in this report are not to be construed as an official Department of the Army position
unless so designated by other authorized documents.
Citation of manufacturer’s or trade names does not constitute an official endorsement or
approval of the use thereof.
Destroy this report when it is no longer needed. Do not return it to the originator.

Army Research Laboratory Adelphi, MD 20783-1197
ARL-TR-6299 September 2012
Holography at the U.S. Army Research Laboratory:
Creating a Digital Hologram
Karl K. Klett, Jr., Neal Bambha, and Justin Bickford
Sensors and Electron Devices Directorate, ARL
Approved for public release; distribution unlimited.
ii
REPORT DOCUMENTATION PAGE Form Approved OMB No. 0704-0188
Public reporting burden for this collection of information is estimated to average 1 hour per response, including the time for reviewing instructions, searching existing data sources, gathering and maintaining the
data needed, and completing and reviewing the collection information. Send comments regarding this burden estimate or any other aspect of this collection of information, including suggestions for reducing the
burden, to Department of Defense, Washington Headquarters Services, Directorate for Information Operations and Reports (0704-0188), 1215 Jefferson Davis Highway, Suite 1204, Arlington, VA 22202-4302.
Respondents should be aware that notwithstanding any other provision of law, no person shall be subject to any penalty for failing to comply with a collection of information if it does not display a currently valid
OMB control number.
PLEASE DO NOT RETURN YOUR FORM TO THE ABOVE ADDRESS.
1. REPORT DATE (DD-MM-YYYY)
September 2012
2. REPORT TYPE
Final
3. DATES COVERED (From - To)
January 2012–Present 4. TITLE AND SUBTITLE
Holography at the U.S. Army Research Laboratory: Creating a Digital Hologram
5a. CONTRACT NUMBER
5b. GRANT NUMBER
5c. PROGRAM ELEMENT NUMBER
6. AUTHOR(S)
Karl K. Klett, Jr., Neal Bambha, and Justin Bickford
5d. PROJECT NUMBER
5e. TASK NUMBER
5f. WORK UNIT NUMBER
7. PERFORMING ORGANIZATION NAME(S) AND ADDRESS(ES)
U.S. Army Research Laboratory
ATTN: RDRL-SEE-E
2800 Powder Mill Road
Adelphi, MD 20783-1197
8. PERFORMING ORGANIZATION REPORT NUMBER
ARL-TR-6299
9. SPONSORING/MONITORING AGENCY NAME(S) AND ADDRESS(ES)
10. SPONSOR/MONITOR’S ACRONYM(S)
11. SPONSOR/MONITOR'S REPORT NUMBER(S)
12. DISTRIBUTION/AVAILABILITY STATEMENT
Approved for public release; distribution unlimited.
13. SUPPLEMENTARY NOTES
14. ABSTRACT
This report describes how to create a digital hologram. Creating a hologram is the first step in supporting the U.S. Army
Research Laboratory’s efforts to remotely sense high spatial resolution three-dimensional (3-D) images. The digital hologram
itself is an interference pattern of two sources of light, one source being from a laser that illuminates a target object and the
other source being the light from the target itself. A holographic image has several components, and these components come
from the mathematics that describe holography. These different components are discussed. Finally, a comparison is made
between a holographic image and regular images that might be made with a digital or film camera.
15. SUBJECT TERMS
Digital holography, Fourier transform
16. SECURITY CLASSIFICATION OF: 17. LIMITATION OF ABSTRACT
UU
18. NUMBER OF PAGES
14
19a. NAME OF RESPONSIBLE PERSON
Karl K. Klett, Jr. a. REPORT
Unclassified
b. ABSTRACT
Unclassified
c. THIS PAGE
Unclassified
19b. TELEPHONE NUMBER (Include area code)
(301) 394-0615
Standard Form 298 (Rev. 8/98)
Prescribed by ANSI Std. Z39.18

iii
Contents
List of Figures iv
1. Introduction 1
2. Methods, Assumptions, and Procedure 1
2.1 A Comparison of Digital Holography and Conventional Imaging .................................1
2.2. Laboratory Equipment and Implementation....................................................................2
3. Results and Discussion: The Hologram, Use of a Transform Equation to Form an
Image, and Components of the Holographic Image 4
4. Conclusion 6
5. References 7
Distibution List 8
iv
List of Figures
Figure 1. A comparison of traditional and holographic imaging. ...................................................2
Figure 2. Notional components required for holography................................................................3
Figure 3. ARL holographic laboratory test setup............................................................................3
Figure 4. Hologram of a die. ...........................................................................................................4
Figure 5. Fourier transform of figure 4, showing components of a hologram image, which are focused virtual image, unfocused real image, DC terms, and stray light artifacts. ..............5

1
1. Introduction
The U.S. Army Research Laboratory (ARL) is embarking on a program of holographic
interferometry to understand its limitations for the purpose of remote sensing. A pre-requisite
for this work is to record a digital hologram. When two holograms are recorded and processed,
using two different wavelengths, three-dimensional (3-D) images are formed. Such images,
depending on the wavelengths selected, show depth information that can approach microscopic
dimensions. Other advantages of using holographic techniques are the large depth of field, the
lack of a need for mechanical focusing mechanisms, and perfect image reconstruction that
possess both phase and amplitude information of the object being examined, instead of just
intensity information that is in a regular photograph.
Although this work can and has been performed with chemical films, digital imaging and
processing of images can be accomplished much more quickly. This report describes the
laboratory procedures used to make a hologram.
2. Methods, Assumptions, and Procedure
2.1 A Comparison of Digital Holography and Conventional Imaging
Digital holography, sometimes called lensless imaging, is different from imaging using a lens.
The latter is referred to as direct imaging. Digital holography mixes light to create interference
patterns. These interference patterns, which are called holograms, are then transformed to create
an image. The Fresnel method of transformation, which uses Fourier transforms, is used here to
make an image from the hologram. The contrasts between holography and direct imaging are
shown in figure 1. When a lens is used as a primary objective in an optical system, it performs
the Fourier transform. In a holography system that does not use a lens, the Fourier transform
must be performed mathematically on the fringe patterns that form from the interference of light
of the object and reference beams (Takeda, 1996). Such a fringe pattern is shown later on in
figure 4.

2
Figure 1. A comparison of traditional and holographic imaging.
2.2. Laboratory Equipment and Implementation
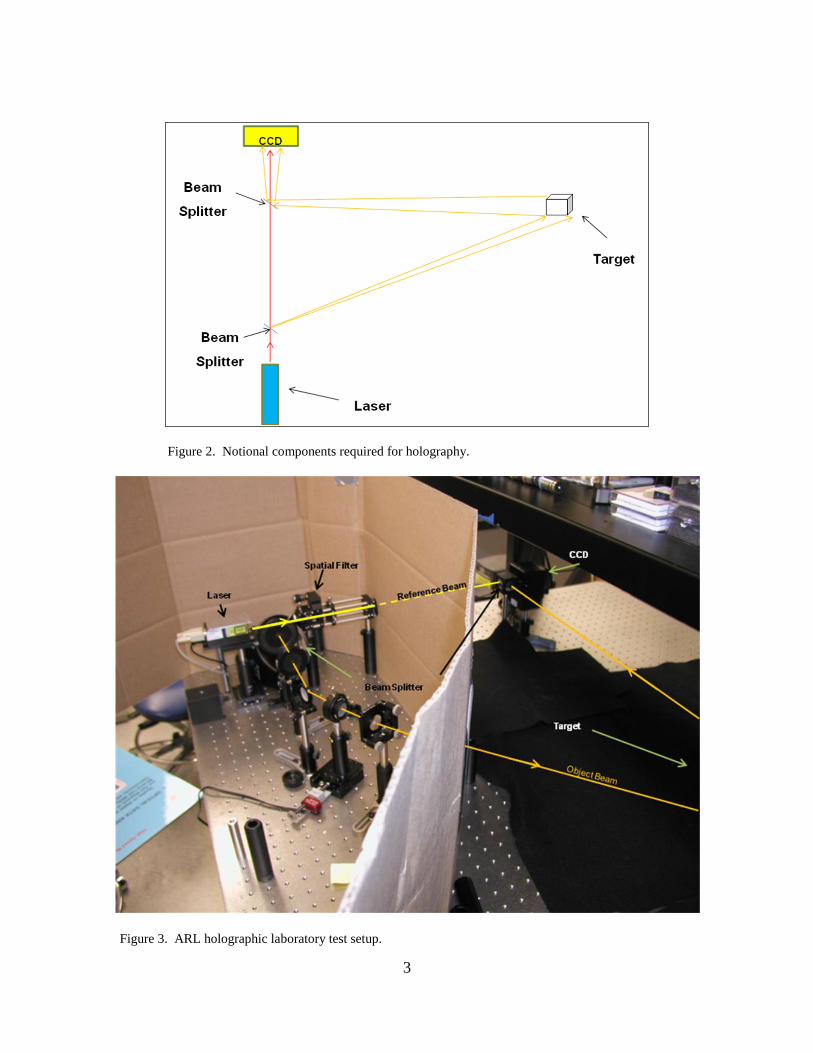
Figure 2 shows a notional description of components required for holography (Wagner, 1999).
Light is mixed at the charge-coupled device (CCD) using a beamsplitter from the laser source
and the target. This equipment is mounted on a floating optics table to reduce vibration, because
any movement, on the order of one wavelength of light, will cause destructive interference of the
light that is required to make the hologram. The coherence length of the laser sets the minimum
distance requirement between components. If the laser coherence length is 1 m, then the round-
trip distance of the laser to the target and back to the CCD must be 1 m. Our actual setup is
shown in figure 3. The laser is model LM-685-PLR-45-1, which is a solid-state laser made by
Ondax. It has a center wavelength of 685.1 nm and is tunable over a range of about 0.3 mn with
variable power up to 100 mW. The CCD is an Opticstar DS-142 ICE with dimensions of
1360x1024. The pixels are square and have dimensions of 4.65 microns. The other components
were purchased from Thor Labs. The spatial filter is required so that there is no spatial structure
in the reference beam. We found that we could view images with the CCD to ensure that we
obtained fringes. Vibration, lack of laser coherence, and cleanliness of the reference beam were
various reasons that we did not record good fringe patterns. In the beginning of our work, we
found it useful to set beam ratios of approximately 1:1 between the reference beam and the target
beam. The use of neutral density filters (or variable circular beam splitters) may be required,
placed between the laser and the CCD, so that the beams ratios are correct. These are required to
attenuate the laser beam going to the CCD, since it is brighter than the radiance from the target.
We used an array averaging capability of the CCD to check the beam ratios.
3
Figure 2. Notional components required for holography.
Figure 3. ARL holographic laboratory test setup.

4
3. Results and Discussion: The Hologram, Use of a Transform Equation to
Form an Image, and Components of the Holographic Image
We first imaged a die, since it reflects visible light well and has spatial detail, as our first image
at a distance of about 1 m. Its hologram is shown in figure 4. The hologram consists of, what
appears to be, a braided interference pattern. If this pattern does not exist, the hologram is
probably not correct. One must make sure that the optics table is stable, the reference beam has
no structure, and the reference and target beams are balanced.
Figure 4. Hologram of a die.
To view the target image, the hologram must be transformed. At ARL, a Fresnel transformation,
which used a Fourier transform, was used, which is listed as equation 1 (Schnars, 2010).
(1)

5
The pixel intensity that makes up the hologram of figure 4 is the first term in equation 1, which is
labeled the “CCD Signal”. The Fourier transform is the third term of equation 1 and the second
term is a spherical wave term that removes distortion from the image. The “k” and “l” indices in
equation 1 are matrix locations of the CCD in terms of rows (k) and columns (l). When figure 4
is processed, using equation 1, the following image is formed (figure 5). There are four
components in the holographic image of figure 5, which come from the interference of light from
the local oscillator (the reference beam) and the target as shown in equation 2 (Schnars, 2010):
(2)
Figure 5. Fourier transform of figure 4, showing components of a hologram image, which are focused
virtual image, unfocused real image, DC terms, and stray light artifacts.
The subscripts “T” and “LO” refer to the target and local oscillator, respectively. The real image
is actually focused, not by reimaging, but by changing the value of “d” in equation 1 to “–d”
LOTLOTLOTLOT EEEEEEEE **222 ||||)(

6
4. Conclusion
Digital holography is the foundation for many scientific and engineering measuring methods.
The general setup, shown in figure 2, may be modified, as long as reference and target beams
interfere. Recording an interference pattern, like figure 4, is the first step in making a digital
hologram image. Equation 1 describes the matrix equations that must be used to transform an
image from the fringe patterns that make up a hologram into a holographic image. Failure to
form an image may result from an unstable optics table, instabilities in the air that change its
refractive index, spatial variability of the reference beam, or unbalanced beam ratios.

7
5. References
Schnars, U.; Jueptner, W. Digital Holography; Berlin, Germany: Springer, 2010.
Takeda, M.; Taniguchi, K. et al. Single-transform Fourier-Hartley Fringe Analysis for
Holographic Interferometry, in Simulation and Experiment in Laser Metrology, Fuzessy, Z.;
Juptner, W; et al., Akademic Verlag, Berlin, 1996, pp. 67–73.
Wagner, C.; Seebacher, S. et al. Digital Recording and Numerical Reconstruction of Lensless
Fourier Holograms in Optical Metrology. Applied Optics 1 August 1999, 38 (22).

8
1 ADMNSTR
ELEC DEFNS TECHL INFO CTR
ATTN DTIC OCP
8725 JOHN J KINGMAN RD STE 0944
FT BELVOIR VA 22060-6218
1 US ARMY RSRCH DEV AND ENGRG CMND
ARMAMENT RSRCH DEV & ENGRG CTR
ARMAMENT ENGRG & TECHNLGY CTR
ATTN AMSRD AAR AEF T J MATTS
BLDG 305
ABERDEEN PROVING GROUND MD 21005-5001
1 US ARMY INFO SYS ENGRG CMND
ATTN AMSEL IE TD A RIVERA
FT HUACHUCA AZ 85613-5300
1 US GOVERNMENT PRINT OFF
DEPOSITORY RECEIVING SECTION
ATTN MAIL STOP IDAD J TATE
732 NORTH CAPITOL ST NW
WASHINGTON DC 20402
17 US ARMY RSRCH LAB
ATTN IMAL HRA MAIL & RECORDS MGMT
ATTN RDRL CIO LL TECHL LIB
ATTN RDRL SEE E K KLETT, JR. (5 COPIES)
ATTN RDRL SEE E W CHANG (5 COPIES)
ATTN RDRL SEE G WOOD (2 COPIES)
ATTN RDRL SEE M J BICKFORD
ATTN RDRL SEE M N BAMBHA
ATTN RDRL SEE O P PELLEGRINO
ADELPHI MD 20783-1197