u.s. army research laboratory
TRANSCRIPT
21
U.S. Army Research Laboratory SUMMER RESEARCH TECHNICAL REPORT
Optimizing Strategies for an Observation-nudging-based Four-Dimensional
Data Assimilation Forecast Approach with WRF-ARW
ANDRE PATTANTYUS MENTOR: ROBERT DUMAIS, JR.
BATTLEFIELD ENVIRONMENT DIVISION WHITE SANDS MISSILE RANGE, NEW MEXICO
Report Documentation Page Form ApprovedOMB No. 0704-0188
Public reporting burden for the collection of information is estimated to average 1 hour per response, including the time for reviewing instructions, searching existing data sources, gathering andmaintaining the data needed, and completing and reviewing the collection of information. Send comments regarding this burden estimate or any other aspect of this collection of information,including suggestions for reducing this burden, to Washington Headquarters Services, Directorate for Information Operations and Reports, 1215 Jefferson Davis Highway, Suite 1204, ArlingtonVA 22202-4302. Respondents should be aware that notwithstanding any other provision of law, no person shall be subject to a penalty for failing to comply with a collection of information if itdoes not display a currently valid OMB control number.
1. REPORT DATE AUG 2011 2. REPORT TYPE
3. DATES COVERED 00-00-2011 to 00-00-2011
4. TITLE AND SUBTITLE Optimizing Strategies For An Observation-Nudging-BasedFour-Dimensional Data Assimilation Forecast Approach With WRF-ARW
5a. CONTRACT NUMBER
5b. GRANT NUMBER
5c. PROGRAM ELEMENT NUMBER
6. AUTHOR(S) 5d. PROJECT NUMBER
5e. TASK NUMBER
5f. WORK UNIT NUMBER
7. PERFORMING ORGANIZATION NAME(S) AND ADDRESS(ES) Battlefield Environment Division,White Sands Missile Range,NM,88002
8. PERFORMING ORGANIZATIONREPORT NUMBER
9. SPONSORING/MONITORING AGENCY NAME(S) AND ADDRESS(ES) 10. SPONSOR/MONITOR’S ACRONYM(S)
11. SPONSOR/MONITOR’S REPORT NUMBER(S)
12. DISTRIBUTION/AVAILABILITY STATEMENT Approved for public release; distribution unlimited
13. SUPPLEMENTARY NOTES See also ADA548876
14. ABSTRACT The Weather Research and Forecasting model is an open-source numerical weather prediction model withnumerous features, such as the four-dimensional data assimilation system, an option to nudge forecasts toobservations in order to improve forecast quality and performance. This process can act as a dynamicalinitialization prior to the forecast period to reduce errors that result from interpolation across the grid.For data void regions, assimilating observations from a temporary network could vastly improve forecastsin the region. However, users must specify how much influence each observation will get in the model andover how large an area each observation will influence. These weighting factors will have a great effect onthe forecast quality. This research attempts to determine the optimal setting of the radius of influence forupper air and surface observations within the assimilation system. A case study over Yuma, AZ, isexamined in which a low-pressure system produced dynamic and orographic precipitation across theregion. Observations from the U.S. Air Force in Yuma will be assimilated into Weather Research andForecasting for the 06 coordinated universal time forecast for an entire 24-h forecast cycle. Results suggestupper air observations have a greater impact on forecast accuracy given a large radius of influence.
15. SUBJECT TERMS
16. SECURITY CLASSIFICATION OF: 17. LIMITATION OF ABSTRACT Same as
Report (SAR)
18. NUMBEROF PAGES
19
19a. NAME OFRESPONSIBLE PERSON
a. REPORT unclassified
b. ABSTRACT unclassified
c. THIS PAGE unclassified
Standard Form 298 (Rev. 8-98) Prescribed by ANSI Std Z39-18

22
Contents
List of Figures 23
List of Tables 23
Abstract 24
Acknowledgments 25
Student Bio 26
1. Introduction 27
2. Experimental Design 29
3. Results and Discussion 30
4. Summary and Conclusion 36
5. References 38

23
List of Figures
Figure 1. Domain configurations for (a) domain 1 and (b) domain 2. Assimilated observations are represented as circles (surface stations) and triangles (radiosondes) and their radii of influence are approximated by the open circles with radii equal to 120 km and 60 km in (a) and 40 km and 20 km in (b). Verification stations are also labeled with 4-letter station ids. Location of domain 2 in (a) represented by box. ......................................29
Figure 2. Estimated one day accumulated precipitation from radar ending 12 UTC 1 December 2007. .......................................................................................................................31
Figure 3. Experimental accumulated precipitation for the entire simulation over domain 1. Experiment labels top right. .....................................................................................................32
Figure 4. Observed and experimental accumulated precipitation in domain 1 for (a) KNYL, (b) KBLH, and (c) SWLC1. .....................................................................................................32
Figure 5. (a) Temperatures and (b) dewpoints at KNYL valid 07 UTC 30 Nov 2007 - 06 UTC 1 Dec 2007. ..............................................................................................................................33
Figure 6. Model reflectivity and upper-level winds from experiment (L) HLRAD and (R) SMRAD valid 02 UTC 1 December 2007 (top) and 03 UTC 1 December 2007 (bottom). ...34
Figure 7. Experimental accumulated precipitation for entire simulation period over domain 2. Experiment labels top right. .....................................................................................................35
Figure 8. Observed and experimental accumulated precipitation in domain 2 for (a) KNYL, (b) KBLH, and (c) SWLC1. .....................................................................................................35
List of Tables
Table 1. Model physics options used in all experiments. ..............................................................30
Table 2. List of model experiments with descriptions. ..................................................................30
24
Abstract
The Weather Research and Forecasting model is an open-source numerical weather prediction model with numerous features, such as the four-dimensional data assimilation system, an option to nudge forecasts to observations in order to improve forecast quality and performance. This process can act as a dynamical initialization prior to the forecast period to reduce errors that result from interpolation across the grid. For data void regions, assimilating observations from a temporary network could vastly improve forecasts in the region. However, users must specify how much influence each observation will get in the model and over how large an area each observation will influence. These weighting factors will have a great effect on the forecast quality. This research attempts to determine the optimal setting of the radius of influence for upper air and surface observations within the assimilation system. A case study over Yuma, AZ, is examined in which a low-pressure system produced dynamic and orographic precipitation across the region. Observations from the U.S. Air Force in Yuma will be assimilated into Weather Research and Forecasting for the 06 coordinated universal time forecast for an entire 24-h forecast cycle. Results suggest upper air observations have a greater impact on forecast accuracy given a large radius of influence.

25
Acknowledgments
I would like to acknowledge the mentorship provided by Robert Dumais, Jr., for providing leadership and focus on research goals. Technical support was provided by Richard Padilla and Robert Flanigan. Thanks to Yuma Proving Ground (YPG) for providing the data for this project. Thanks also to the rest of the U.S. Army Research Laboratory (ARL) staff at White Sands Missile Range (WSMR) for a pleasant working environment and for making me feel welcome for the summer internship.
26
Student Bio
I received my B.S. in Meteorology from Plymouth State University, NH, in 2007. I received my M.S. in Meteorology from Florida Institute of Technology in 2010. My master’s thesis titled “Numerical Investigations of Mountain Flows in the Las Vegas and Owens Valleys” involved high resolution mesoscale modeling using the WRF-ARW. In June 2011, I was the lead author of “Improving High-Resolution Model Forecasts of Downslope winds in the Las Vegas Valley,” which was published in the Journal of Applied Meteorology and Climatology. This paper was the result of my master’s thesis research. I also presented this research at the Florida Academy of Sciences Annual Meeting in March 2010, the 5th International Symposium on Computational Wind Engineering in May 2010, the International symposium for the Advancement of Boundary Layer Remote Sensing in June 2010, and the AMS Annual Meeting in January 2011. I am currently in the Environmental Science Ph.D. program at Florida Tech and continue to research the use of the WRF-ARW at high-spatial resolution over complex terrain and the use of four-dimensional data assimilation (FDDA). Other interests include the use of the WRF-ARW and FDDA for short-term cycling forecasts for wind farms. I plan to pursue a career in applications meteorology and mesoscale modeling.
27
1. Introduction
U.S. Army test ranges, garrison installations, and tactical battle regions are often located in regions of complex terrain that depend on accurate, high-resolution weather analyses and forecasts to carry out routine tests, daily activities, and mission execution operations. An efficient yet sophisticated high-resolution modeling system is required to both ingest local and regional sources of weather data, and to produce detailed local forecasts/nowcasts, which capture the unique time-dependent flow and sensible weather conditions related to complex terrain environments under varying synoptic and mesoscale forcing states. Unfortunately, neither local observations nor the courser resolution global and mesoscale model outputs from national centers are able to resolve these local factors in their data analyses and forecasts (1). This is especially the case in many areas where military personnel are stationed or deployed. In such areas, sufficient or reliable weather data is often limited or may lack altogether, despite the presence of complex local terrain and land use features. This poses a serious challenge for high-resolution mesoscale numerical weather prediction (NWP) models that rely on denser networks of weather observation sites and platforms to provide both surface and upper air data for forecast initialization. If observation data is lacking over most of a mesoscale forecast region, the high-resolution model tends to interpolate the sparse observations across the entire region (and rely more on interpolated background model states provided by a previously executed courser external model run). This will certainly have a negative impact on the high-resolution forecasts if the observations and background model states do not resolve the critical and dominant mesoscale and synoptic details. The Advanced Research version of the Weather Research and Forecasting (WRF-ARW) model has the capability to ingest observations and relax (or nudge) the model towards these observations in order to produce a more accurate short-range forecast.
A form of continuous and dynamic atmospheric data assimilation called four-dimensional data assimilation (FDDA), or observation/station nudging, has demonstrated the potential to improve mesoscale model initializations and short-range forecasts based upon the insertion of local/regional asynoptically observed direct weather quantities (temperature, winds, moisture, pressure) into model integration through fictitious relaxation “forcing” terms. Each grid point in observation-nudging FDDA is relaxed or “nudged” based upon weighted averages of each innovation (i.e., differences between the observation and external background model value at a given location). These weights are based upon a grid-dependent horizontal radius of observation influence, observation time window, vertical influence, and parameter-specific nudging/relaxation time-scale magnitude values determined through user-specified namelist values. The time window allows one to ramp observational nudging up and down. A new FDDA user-specified parameter in the WRF-ARW v3.2.1 namelist is “obs_sfcfact”, which allows the user to specify a smaller radius of influence for surface observations while maintaining a larger radius of influence for upper air observations. Additional namelist flexibility in v3.2.1 is

28
allowing a user to specify the vertical influence depth within the model planetary boundary layer of surface observations, based also upon the particular boundary layer stability regime.
Incorporation of the observation-nudging FDDA system into the WRF-ARW framework has been followed by numerous studies highlighting the improvement in forecasts. Studies by Penn State (2) found improvements at all model levels and grid resolutions (down to 4 km) by using FDDA over CONUS and Alaska for all variables being ingested. Attempts to improve precipitation forecasts in Israel via FDDA, and with grid resolutions down to 1 km, verified favorably against observations (3). Researchers noted forecast skill degraded with decreasing resolution due to inadequate representation of orographic forcing. A study over White Sands Missile Range in 2005 (4) found that a model surface cold bias reduced explicit precipitation forecasts. However, the model was able to capture the dominant orographically-generated precipitation. Initial results from Dugway Proving Ground, UT, suggest that the model FDDA was able to better capture a precipitation event than its predecessor MM5, even though the FDDA had not been fully updated to match that of the MM5 FDDA yet (1). Although improvements to traditional model forecasts have been shown through the use of FDDA, a number of questions remain on the effect of the user-specified weighting factors and the use of isotropic weighting. In observation nudging, experience-based ad-hoc weighting functions act as the “Kalman gain” used in more sophisticated analysis/data assimilation systems such as 3DVAR, 4DVAR, and EnKF. The Kalman gain in these more sophisticated systems relies upon optimally-estimated values of background and observation errors. Computationally, FDDA observation nudging is a more efficient approach, and its continuous versus intermittent assimilation method is advantageous for high spatial/temporal scales, and asynoptic data rates and observing frequencies.
Given the high cost of upper air versus surface observations and the difficulty in deploying systems in the field, it is necessary to quantify the impact of both types of observations on the model’s FDDA, which may, in turn, be synoptic/mesoscale-forcing and location-dependent. In particular, what size to make the radius of influence for observations? How much improvement is there from surface versus upper air observations? In this way, strategies for optimizing FDDA can be developed, and the number of observations needed can be determined based on forecast needs. It is hypothesized for this study of a dynamically forced southwestern U.S. precipitation event that upper air data will have a larger impact on forecast accuracy.
A series of model experiments were carried out over Yuma Proving Grounds (YPG), AZ, from 0600 UTC 30 November to 0600 UTC 1 December 2007. Observations were ingested into WRF-ARW FDDA from the YPG base surface mesonet. Special radiosondes were released across YPG at close to a 90-min frequency throughout much of this day in support of special ongoing range exercises, and these were incorporated through the FDDA. Verification of the model results was done using available NWS and Mesowest surface stations outside of the YPG mesonet but within the model domain both in close and far proximity to YPG FDDA stations.
29
2. Experimental Design
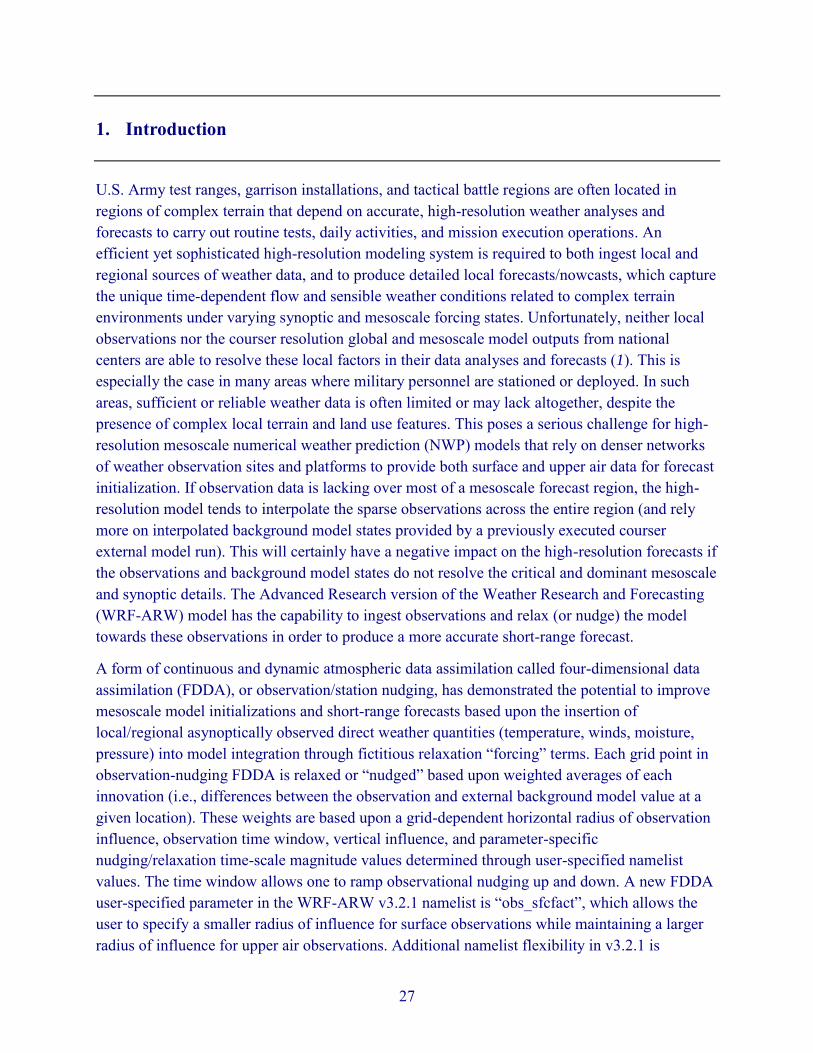
A one-way, double-nest domain configuration of the WRF-ARW model, with horizontal grid spacing of 3 km and 1 km, respectively, was run for all experiments using 90 terrain-following vertical levels. Figure 1 displays the horizontal domain configuration. The center of the model domain is located within YPG. Observations included in the FDDA were taken from the YPG surface mesonet and radiosondes, and are shown on figure 1. There are five surface stations and three sounding locations included. As is shown, the surface stations were tightly clustered in one area, while the sounding locations were more evenly spaced. Two sets of sounding and surface stations are collocated. The large open circles represent our user-defined radii of influence for the observations that were tested in the experiments. The largest circles represent a radii = 120 (40) km, and the smaller circles are radii = 60 (20) km in domain 1 (2). The five station identifiers represent stations used in model verification. The model physics are held constant for all experiments and are summarized in table 1. Initial and lateral boundary conditions come from the NAM-218 forecasts produced by NCEP (~12 km).
Figure 1. Domain configurations for (a) domain 1 and (b) domain 2. Assimilated observations are represented as circles (surface stations) and triangles (radiosondes) and their radii of influence are approximated by the open circles with radii equal to 120 km and 60 km in (a) and 40 km and 20 km in (b). Verification stations are also labeled with 4-letter station ids. Location of domain 2 in (a) represented by box.
Additionally, an adaptive time-stepping method was used during integration of all experiments, except where specified. This method allows for shorter running time and less computational expense. Certain microphysics options were found to cause a positive bias in precipitation forecasts (5). However, these results are only from course resolution grids (>10 km), where convection is parameterized. Results have not been published on grids smaller than 5 km, in which cumulus physics are solved explicitly. The dynamic time-step used hereafter begins with a time-step of 18 s (6) in domain 1 (2). The maximum (minimum) allowed time-step is 3× (.5×)

30
the starting value. Runs with fixed, static time-steps were also executed to determine if and how dynamic time-stepping affects the explicit precipitation process.
Table 1. Model physics options used in all experiments.
Physics Scheme
Land surface Noah surface Layer QNSE
PBL QNSE SW radiation Dudhia LW radiation RRTM
Cloud microphysics Thompson
All experiments were initialized at 0600 UTC 30 November 2007 and integrated for 24 hours. Observations were assimilated over the entire period of integration, except for the experiment labeled COLDS. The list of experiments and brief descriptions are found in table 2.
Table 2. List of model experiments with descriptions.
Experiment Description
LGRAD radii of influence for all obs domain 1 = 120 km, domain 2 = 40 km HLRAD radii of influence for UA obs remains same but surface obs 60 km, 20 km SMRAD radii of influence for all obs domain 1 = 60 km, domain 2 = 20 km HSRAD radii of influence for UA obs remains same but surface obs 30 km, 10 km DFRAD radii of influence for all obs set to 18 km, 6 km STATIC same as HLRAD but with fixed time-step of 9 sec for domain 1, 3 sec for domain 2 COLDS same as STATIC but with no fdda
Analysis of model results will focus on the ability of the model to capture the rain event intensity and timing over the entire domain. Model rainfall totals compared to the verification stations totals will also be addressed. Variables that were assimilated will also be analyzed at the verification stations to determine how and if the observations had an impact. Observations will be compared to model results from the simple nearest grid point, as neither the number of stations nor the time period to validate was long enough to produce statistical significance or warrant the use of more robust methods.
3. Results and Discussion
The rain event that occurred across the domain from 30 November to 1 December 2007 was the result of a surface low pressure system moving up the coast of California and the passage of a strong upper-level trough. The coastal range of California and Baja, Mexico, provided additional lift and moisture advection up from the Sea of Cortez, which fed the system as it progressed
31
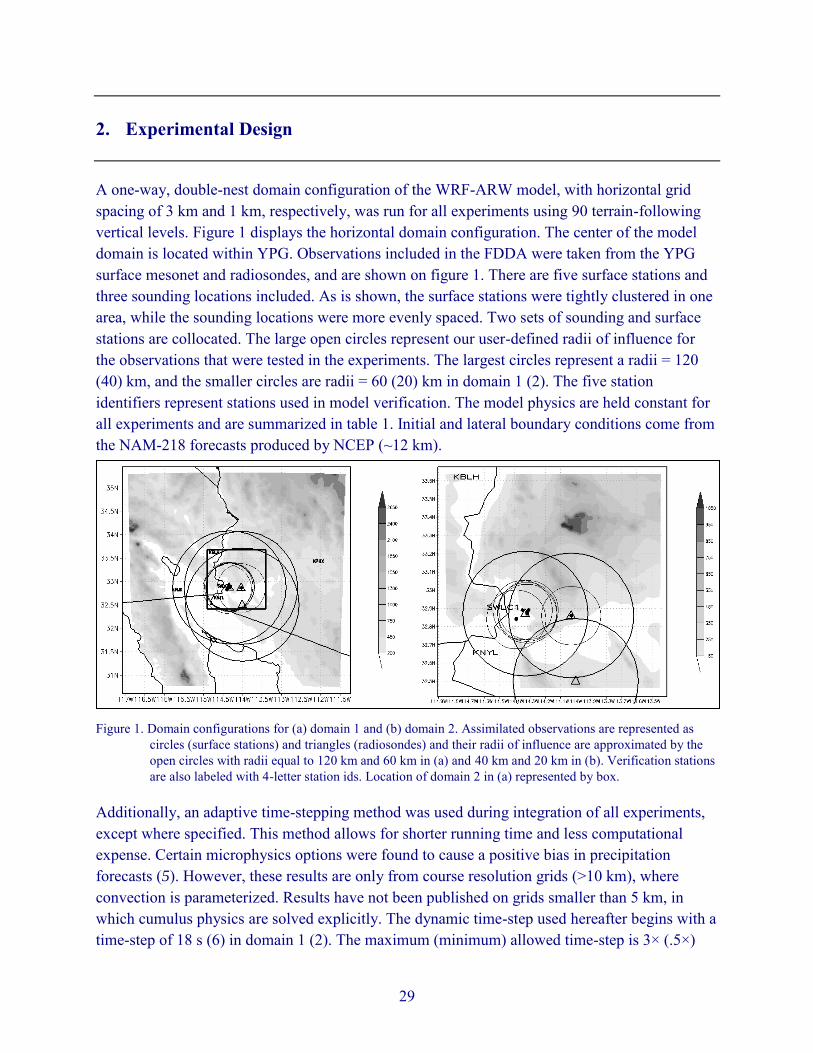
through the region. A distinct convective band progressed through YPG from the west at 0200−0300 UTC 1 December and produced much of the precipitation in that local area. Overall, the system produced significant orographic, dynamic, and convective precipitation, as seen in the radar estimated precipitation in figure 2.
Figure 2. Estimated one day accumulated precipitation from radar ending 12 UTC 1 December 2007.
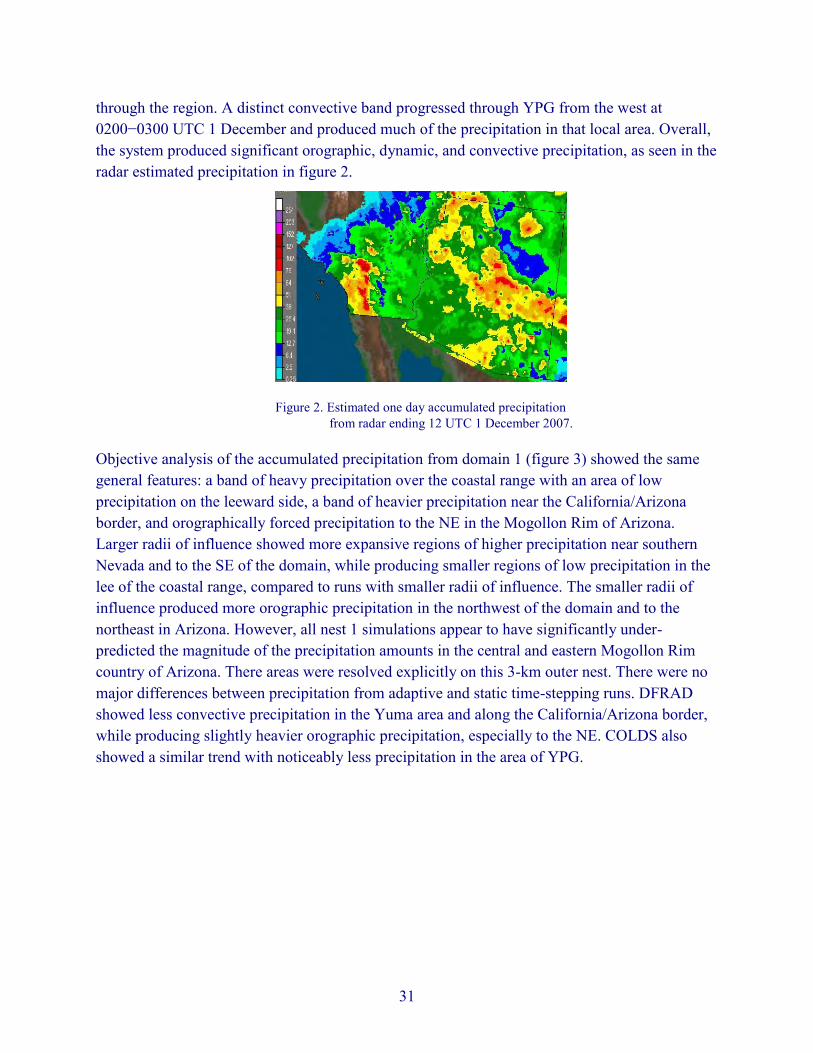
Objective analysis of the accumulated precipitation from domain 1 (figure 3) showed the same general features: a band of heavy precipitation over the coastal range with an area of low precipitation on the leeward side, a band of heavier precipitation near the California/Arizona border, and orographically forced precipitation to the NE in the Mogollon Rim of Arizona. Larger radii of influence showed more expansive regions of higher precipitation near southern Nevada and to the SE of the domain, while producing smaller regions of low precipitation in the lee of the coastal range, compared to runs with smaller radii of influence. The smaller radii of influence produced more orographic precipitation in the northwest of the domain and to the northeast in Arizona. However, all nest 1 simulations appear to have significantly under-predicted the magnitude of the precipitation amounts in the central and eastern Mogollon Rim country of Arizona. There areas were resolved explicitly on this 3-km outer nest. There were no major differences between precipitation from adaptive and static time-stepping runs. DFRAD showed less convective precipitation in the Yuma area and along the California/Arizona border, while producing slightly heavier orographic precipitation, especially to the NE. COLDS also showed a similar trend with noticeably less precipitation in the area of YPG.
32
Figure 3. Experimental accumulated precipitation for the entire simulation over domain 1. Experiment labels top right.
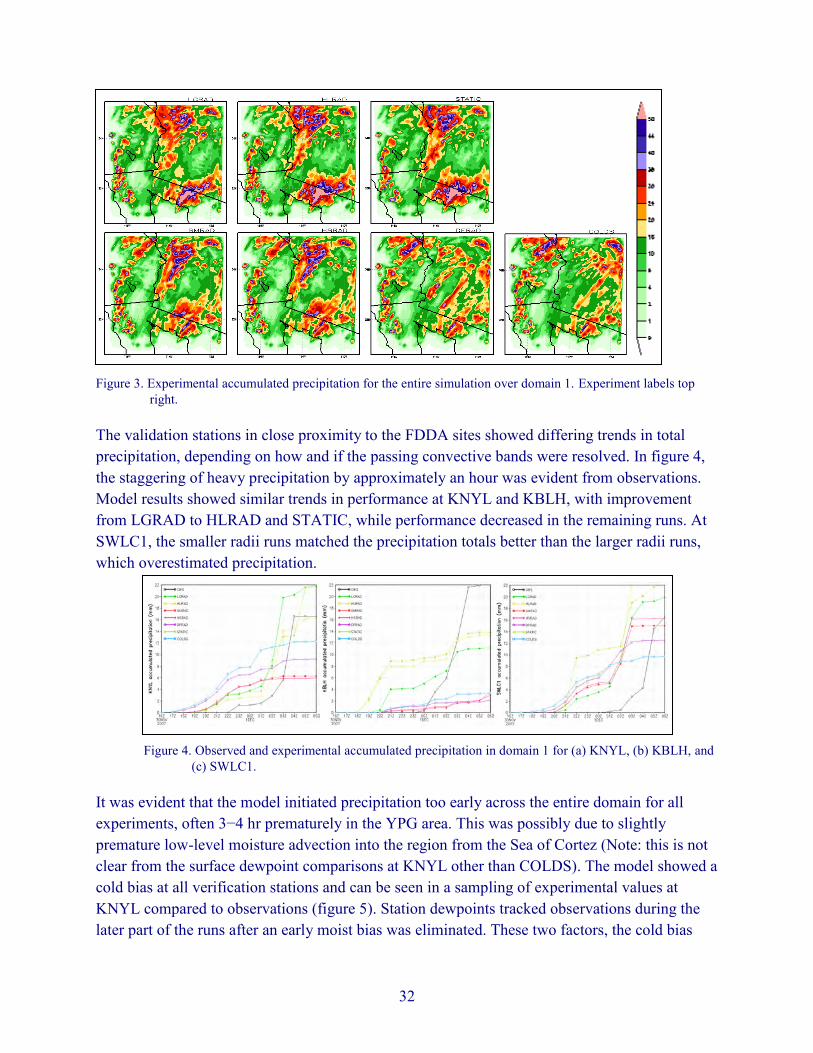
The validation stations in close proximity to the FDDA sites showed differing trends in total precipitation, depending on how and if the passing convective bands were resolved. In figure 4, the staggering of heavy precipitation by approximately an hour was evident from observations. Model results showed similar trends in performance at KNYL and KBLH, with improvement from LGRAD to HLRAD and STATIC, while performance decreased in the remaining runs. At SWLC1, the smaller radii runs matched the precipitation totals better than the larger radii runs, which overestimated precipitation.
Figure 4. Observed and experimental accumulated precipitation in domain 1 for (a) KNYL, (b) KBLH, and (c) SWLC1.
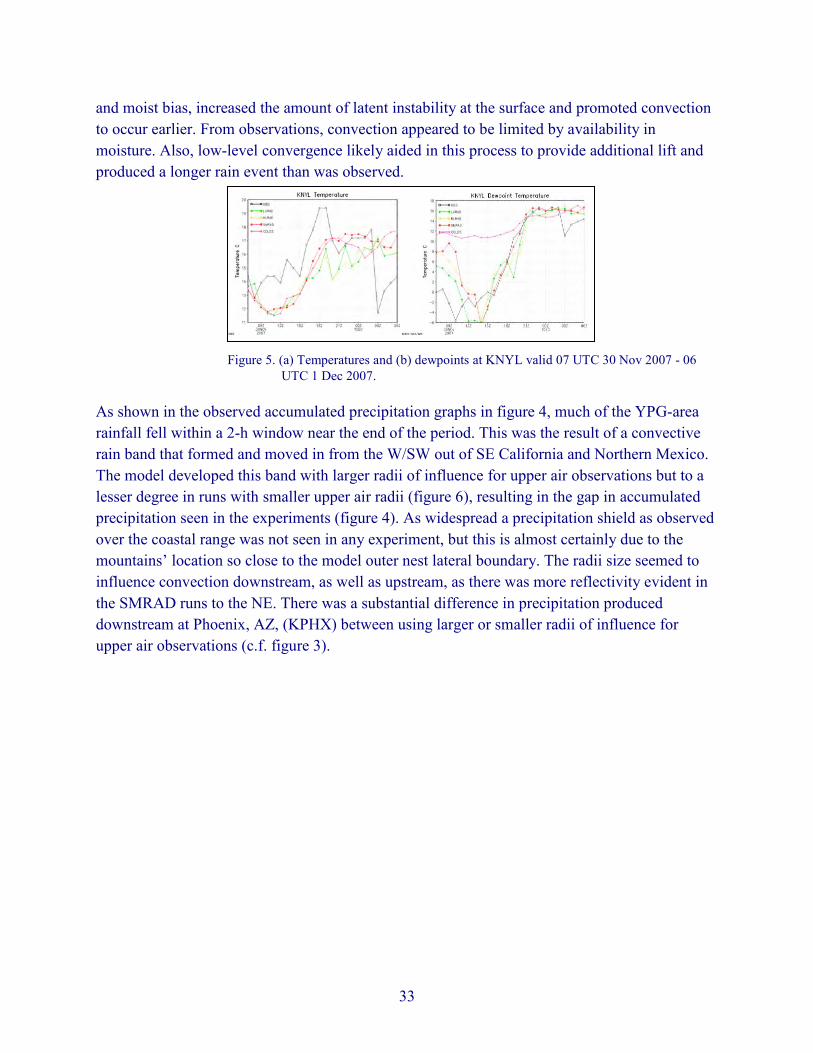
It was evident that the model initiated precipitation too early across the entire domain for all experiments, often 3−4 hr prematurely in the YPG area. This was possibly due to slightly premature low-level moisture advection into the region from the Sea of Cortez (Note: this is not clear from the surface dewpoint comparisons at KNYL other than COLDS). The model showed a cold bias at all verification stations and can be seen in a sampling of experimental values at KNYL compared to observations (figure 5). Station dewpoints tracked observations during the later part of the runs after an early moist bias was eliminated. These two factors, the cold bias
33
and moist bias, increased the amount of latent instability at the surface and promoted convection to occur earlier. From observations, convection appeared to be limited by availability in moisture. Also, low-level convergence likely aided in this process to provide additional lift and produced a longer rain event than was observed.
Figure 5. (a) Temperatures and (b) dewpoints at KNYL valid 07 UTC 30 Nov 2007 - 06 UTC 1 Dec 2007.
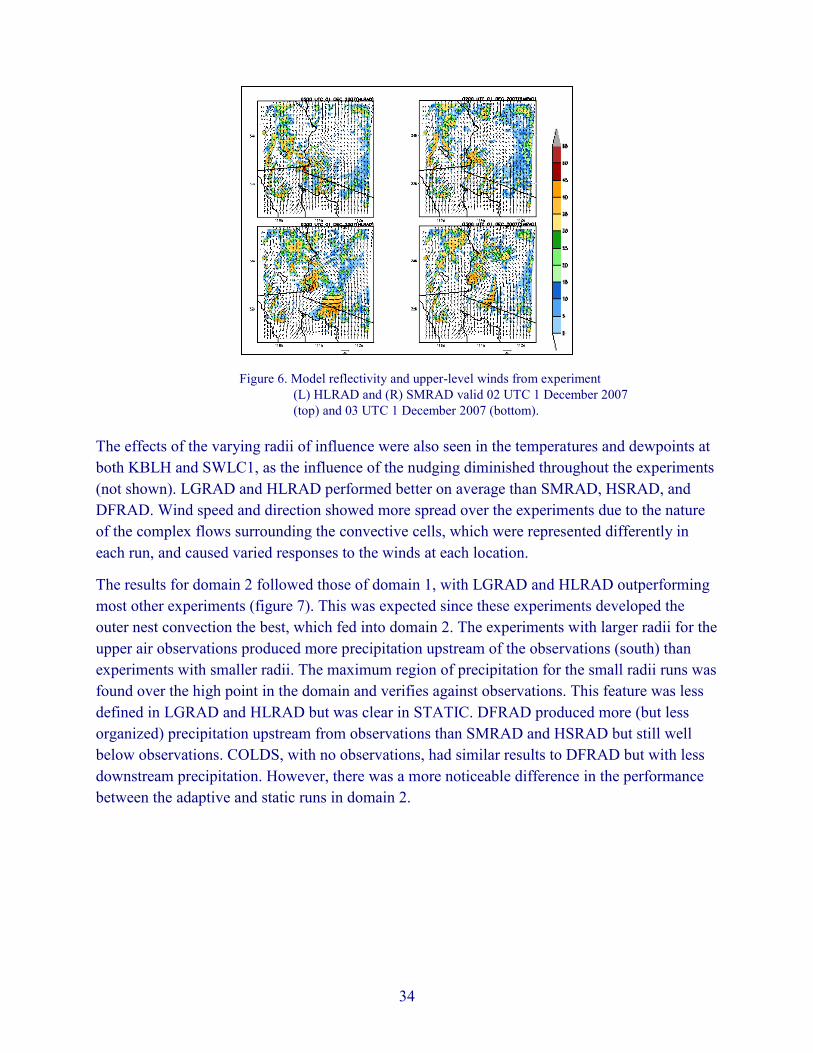
As shown in the observed accumulated precipitation graphs in figure 4, much of the YPG-area rainfall fell within a 2-h window near the end of the period. This was the result of a convective rain band that formed and moved in from the W/SW out of SE California and Northern Mexico. The model developed this band with larger radii of influence for upper air observations but to a lesser degree in runs with smaller upper air radii (figure 6), resulting in the gap in accumulated precipitation seen in the experiments (figure 4). As widespread a precipitation shield as observed over the coastal range was not seen in any experiment, but this is almost certainly due to the mountains’ location so close to the model outer nest lateral boundary. The radii size seemed to influence convection downstream, as well as upstream, as there was more reflectivity evident in the SMRAD runs to the NE. There was a substantial difference in precipitation produced downstream at Phoenix, AZ, (KPHX) between using larger or smaller radii of influence for upper air observations (c.f. figure 3).
34
Figure 6. Model reflectivity and upper-level winds from experiment (L) HLRAD and (R) SMRAD valid 02 UTC 1 December 2007 (top) and 03 UTC 1 December 2007 (bottom).
The effects of the varying radii of influence were also seen in the temperatures and dewpoints at both KBLH and SWLC1, as the influence of the nudging diminished throughout the experiments (not shown). LGRAD and HLRAD performed better on average than SMRAD, HSRAD, and DFRAD. Wind speed and direction showed more spread over the experiments due to the nature of the complex flows surrounding the convective cells, which were represented differently in each run, and caused varied responses to the winds at each location.
The results for domain 2 followed those of domain 1, with LGRAD and HLRAD outperforming most other experiments (figure 7). This was expected since these experiments developed the outer nest convection the best, which fed into domain 2. The experiments with larger radii for the upper air observations produced more precipitation upstream of the observations (south) than experiments with smaller radii. The maximum region of precipitation for the small radii runs was found over the high point in the domain and verifies against observations. This feature was less defined in LGRAD and HLRAD but was clear in STATIC. DFRAD produced more (but less organized) precipitation upstream from observations than SMRAD and HSRAD but still well below observations. COLDS, with no observations, had similar results to DFRAD but with less downstream precipitation. However, there was a more noticeable difference in the performance between the adaptive and static runs in domain 2.

35
Figure 7. Experimental accumulated precipitation for entire simulation period over domain 2. Experiment labels top right.
The performance at the verification stations was similar in domain 2 as in domain 1, with KBLH and KNYL performing better with large radii experiments and SWLC1 with small radii experiments (figure 8). The results at KBLH were relatively unchanged from those in domain 1, which may be due to its close proximity to the boundaries of domain 2. SWLC1 was closer to the observations than KNYL and so experienced more nudging than KNYL (c.f. Fig 1). Regardless, experiments with larger radii of influence produced greater amounts of precipitation, but this may be more of a result from the boundary forcing from domain 1 rather than from nudging in domain 2. There was also an improvement at KNYL and SWLC1 in temperatures and dewpoints in experiments with large radii in domain 2 (vs from the domain 1 values not shown). Values did not change in experiments with small radii at KNYL since it was outside of the radii of influence, but values did increase at SWLC1 going from too dry to too moist. At SWLC1, experiments where the radii encompassed the station showed better performance with temperatures and dewpoints than those that did not.
Figure 8. Observed and experimental accumulated precipitation in domain 2 for (a) KNYL, (b) KBLH, and (c) SWLC1.
36
4. Summary and Conclusion
Results showed that the use of large radii of influence appeared necessary for both surface and upper air observations in the WRF-ARW FDDA. In this case, upper air observations appeared to provide the greatest improvement in forecasted precipitation, while surface observations showed the most improvement prior to the onset of precipitation. Adaptive time-stepping did not display a bias in precipitation while cutting down on runtime by approximately 50%, which is critical to the Army’s interest in running frequent FDDA cycling using such nesting configurations.
Significant differences in rainfall were produced over YPG, in both domains, between experiments using large radii and those with small radii. The large radii experiments produced more precipitation that matched observed radar estimated precipitation patterns over the region and local station precipitation totals. These runs also produced more coherent reflectivity values, representing the convective band that produced heavy precipitation in the area, which was not produced in experiments with small radii (especially for upper air observations). Surface variables also showed improvement in these experiments, which appeared to be more of a result of upper air observations rather than surface observations. More research is needed on surface variables to confirm these findings. Downstream effects from upper air observations could be seen in domain 1 precipitation fields, likely as a result of the current isotropic weighting approach used in the FDDA nudging. This may be solved by using a slightly smaller radius of influence, or in the future new approaches to FDDA that can apply anisotropic weightings.
Based on the precipitation totals produced from the experiments, upper air observations appeared to have a greater impact on performance than surface observations for this highly dynamic case. Only surface dewpoints showed a dramatic improvement from the inclusion of surface observations in FDDA. Wind speeds and directions showed some improvement but were difficult to verify against suspect station data. However, in conditions of weak synoptic/dynamic forcing and significant terrain and/or land use heterogeneity, these findings could be completely different. Much more research must be done.
Adaptive time-stepping produced impressive savings in computational cost and runtime, while producing results similar from a static time-step. The omission of the STATIC series in figure 5 was due to its striking resemblance to its adaptive counterpart HLRAD. The improvement in runtime was approximately 50%. This is slightly higher than previously reported savings because the extra computational costs from the relaxation terms in FDDA are significantly reduced at larger time-steps with a minimal impact on performance. On the 1-km domain, there were larger differences in the precipitation field between the static and adaptive experiments than on the 3-km domain.

37
Further research is needed to continue to improve WRF-ARW FDDA. Potential experiments should investigate the use of FDDA on the coarse domain only; the inclusion of upstream sounding data to improve upstream precipitation and convection; the performance of different microphysics schemes; the assimilation of one variable at a time (i.e., temperature, moisture, or winds); and, most importantly, the reduction of the model daytime cold bias at the surface.
38
5. References
1. Liu, Y.; Bourgeois, A.; Warner, T.; Swerdlin, S.; Hacker, J. 6th Annual WRF Users’ Workshop, Boulder, CO, 2005.
2. Deng, A.; Stauffer, D.; Gaudet, B.; Dudhia, J.; Hacker, J.; Bruyere, C.; Wu, W.; Vandenberghe, F.; Liu, Y.; Bourgeois, A. 10th Annual WRF Users’ Workshop, Boulder, CO, 2009.
3. Rostkier-Edelstein, D.; Liu, Y.; Roux, G.; Givati, A.; Pietrokowski, A.; Ge, M.; Hahmann, A.; Pinto, J.; Warner, T.; Swerdlin, S., 9th European Conference on Application of Meteorology, Toulouse, FR, 2009.
4. Yu, W.; Liu, Y.; Warner, T.; Bullock, R.;, Brown, B.; Ge, M., 7th Annual WRF Users’ Workshop, Boulder, CO, 2006.
5. Hutchinson, T. A. 19th Conference on Numerical Weather Prediction, Omaha, NE, 2009.