sentinel-1 toolbox tops interferometry tutorialstep.esa.int/docs/tutorials/s1tbx topsar...
TRANSCRIPT

Sentinel-1 Toolbox
Copyright © 2015 Array Systems Computing Inc. http://www.array.ca/
http://step.esa.int
TOPS Interferometry Tutorial Issued May 2015
Updated August 2016
Luis Veci

TOPS Interferometry Tutorial
2
Interferometry Tutorial The goal of this tutorial is to provide novice and experienced remote sensing users with step-by-step instructions on interferometric processing with Sentinel-1 Interferometric Wideswath products.
What is Interferometry? Interferometric synthetic aperture radar (InSAR) exploits the phase difference between two complex radar SAR observations taken from slightly different sensor positions and extracts information about the earth’s surface. A SAR signal contains amplitude and phase information. The amplitude is the strength of the radar response and the phase is the fraction of one complete sine wave cycle (a single SAR wavelength). The phase of the SAR image is determined primarily by the distance between the satellite antenna and the ground targets. By combining the phase of these two images after coregistration, an interferogram can be generated whose phase is highly correlated to the terrain topography. For an introduction to interferometric concepts, please see ESA’s InSAR Principles: Guidelines for SAR Interferometry Processing and Interpretation (ESA TM-19).
Sentinel-1 Interferometric Wide Swath Products The Interferometric Wide (IW) swath mode is the main acquisition mode over land for Sentinel-1. It acquires data with a 250 km swath at 5 m by 20 m spatial resolution (single look). IW mode captures three sub-swaths using Terrain Observation with Progressive Scans SAR (TOPSAR). With the TOPSAR technique, in addition to steering the beam in range as in ScanSAR, the beam is also electronically steered from backward to forward in the azimuth direction for each burst, avoiding scalloping and resulting in homogeneous image quality throughout the swath. TOPSAR mode replaces the conventional ScanSAR mode, achieving the same coverage and resolution as ScanSAR, but with a nearly uniform SNR (Signal-to-Noise Ratio) and DTAR (Distributed Target Ambiguity Ratio).

TOPS Interferometry Tutorial
3
TOPSAR Acquisitions
IW SLC products contain one image per sub-swath and one per polarisation channel, for a total of three (single polarisation) or six (dual polarisation) images in an IW product. Each sub-swath image consists of a series of bursts, where each burst has been processed as a separate SLC image. The individually focused complex burst images are included, in azimuth-time order, into a single sub-swath image with black-fill demarcation in between, similar to ENVISAT ASAR Wide ScanSAR SLC products.
Fogo Volcano 2014 Eruption In this tutorial, we will process two Sentinel-1 IW SLC products over the 2014 eruption of the Fogo volcano in Cape Verde. The eruption began on November 23, 2014 and continued to be active until February 8, 2015.

TOPS Interferometry Tutorial
4
Pico de Fogo in Cape Verde off the coast of Africa
Opening a Pair of SLC Products In order to perform interferometric processing, the input products should be two or more Single Look Complex (SLC) products over the same area acquired at different times.
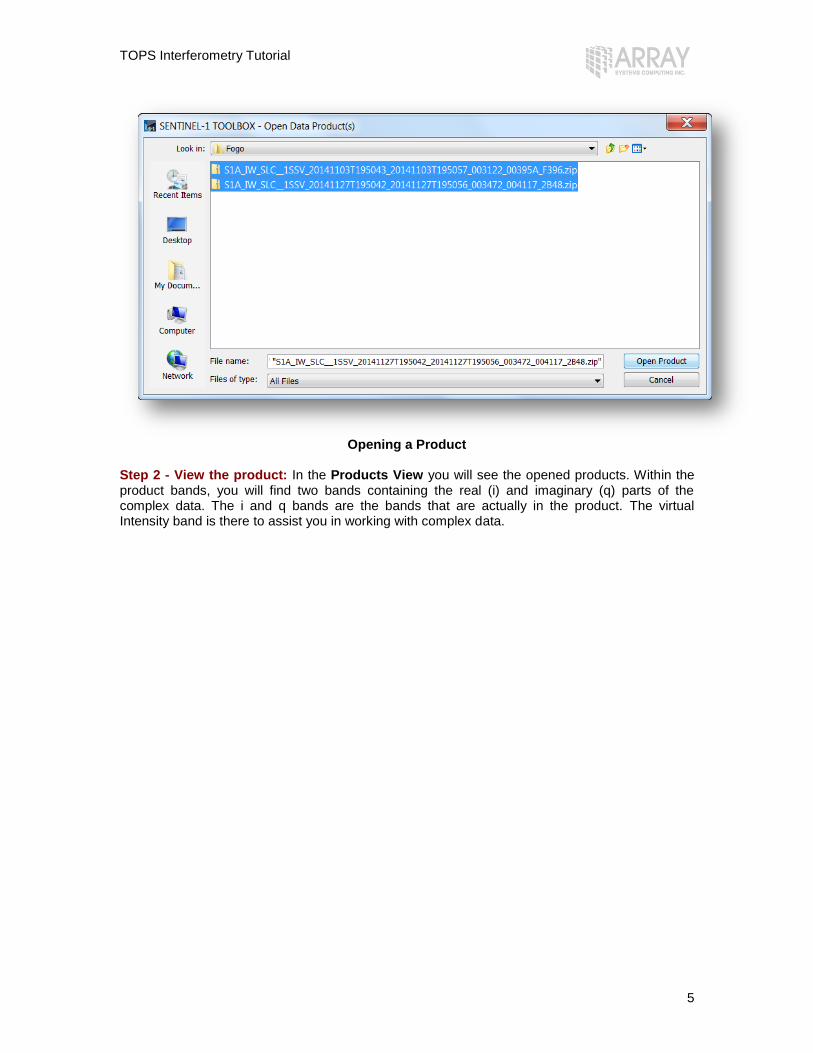
Step 1 - Open the products: Use the Open Product button in the top toolbar and browse for the location of the Sentinel-1 Interferometric Wide (IW) swath products. Select the manifest.safe file from each Sentinel-1 product folder and press Open Product. Press and hold the Ctrl button on the keyboard to select multiple products at a time. If the product is zipped, you may also select the zip file.
TOPS Interferometry Tutorial
5
Opening a Product
Step 2 - View the product: In the Products View you will see the opened products. Within the product bands, you will find two bands containing the real (i) and imaginary (q) parts of the complex data. The i and q bands are the bands that are actually in the product. The virtual Intensity band is there to assist you in working with complex data.

TOPS Interferometry Tutorial
6
Products View
In Sentinel-1 IW SLC products, you will find 3 subswaths IW1, IW2, IW3. Each subswath is for an adjacent acquisition by the TOPS mode. Fogo Island can be seen in IW3.
Footprint of Subswaths on World Map
Step 3 - View a band: To view the data, double-click on the Intensity_IW3_VV band. Zoom in using the mouse wheel and pan by clicking and dragging the left mouse button.

TOPS Interferometry Tutorial
7
Intensity IW3 Band
Within a subswath, TOPS data is acquired in bursts. Each burst is separated by demarcation zones. Any ‘data’ within the demarcation zones can be considered invalid and should be zero-filled but may contain garbage values.
Coregistering the Data For interferometric processing, two or more images must be coregistered into a stack. One image is selected as the master and the other images are the slaves. The pixels in slave images will be moved to align with the master image to sub-pixel accuracy. Coregistration ensures that each ground target contributes to the same (range, azimuth) pixel in both the master and the slave image. For TOPS InSAR, S-1 TOPS Coregistration should be used. Step 4 - Coregister the images into a stack: Select S-1 TOPS Coregistration in the Radar menu.
Select S-1 TOPS Coregistration

TOPS Interferometry Tutorial
8
TOPS Coregistration consists of a graph that reads two products, select a single subswath with TOPSAR-Split, applies a precise orbit correction with Apply-Orbit-File and performs a DEM assisted Back-Geocoding coregistration.
S-1 TOPS Coregistration
In the first Read operator, select the first product [1]. This will be your master image. In Read(2) select the other product. This will be your slave image. In the TOPSAR-Split tab, select the IW3 subswath for each of the products.

TOPS Interferometry Tutorial
9
Select a Subswath and Polarisation
In the Apply-Orbit-File tab, select Sentinel Precise Orbits. Orbit auxiliary data contain information about the position of the satellite during the acquisition of SAR data. The Precise Orbit Determination (POD) service for SENTINEL-1 provides Restituted orbit files and Precise Orbit Ephemerides (POE) orbit files. POE files cover approximately 28 hours and contain orbit state vectors at fixed time steps of 10 seconds intervals. Files are generated one file per day and are delivered within 20 days after data acquisition. If Precise orbits are not yet available for your product, you may select the Restituted orbits which may not be as accurate as the Precise orbits but will be better than the predicted orbits available within the product. Orbit files for Sentinel-1 are automatically downloaded by the Toolbox.

TOPS Interferometry Tutorial
10
Select Sentinel Precise Orbits
In the Back-Geocoding tab, select the Digital Elevation Model (DEM) to use and the interpolation methods. Areas outside the DEM or in the sea may be optionally masked out. Select to output the Deramp and Demod phase if you require Enhanced Spectral Diversity to improve the coregistration.
Back-Geocoding Parameters

TOPS Interferometry Tutorial
11
In the Write tab, specify the output folder and the target product name.
Specify the output name, format and folder
Press Process to begin processing the coregistration. The resulting coregistered stack product will appear in the Products View.
Coregistered Stack Product
Interferogram Formation and Coherence Estimation The interferogram is formed by cross multiplying the master image with the complex conjugate of the slave. The amplitude of both images is multiplied while the phase represents the phase difference between the two images. The interferometric phase of each SAR image pixel would depend only on the difference in the travel paths from each of the two SARs to the considered resolution cell. The interferometric phase variation Δϕ is then proportional to ΔR divided by the transmitted wavelength λ.

TOPS Interferometry Tutorial
12
Step 5 - Form the Interferogram: Select the stack and select Interferogram Formation from the InSAR Products menu.
Select Interferogram Formation
The phase difference can have contributions from five different sources:
Δϕflat is called flat Earth phase which is the phase contribution due to the earth curvature.
Δϕelevation is the topographic contribution to the interferometric phase. Δϕdisplacement is the surface deformation contribution to the interferometric phase. Δϕatmosphere is the atmospheric contribution to the interferometric phase. It is
introduced due to the atmospheric humidity, temperature and pressure change between the two acquisitions.
Δϕnoise is the phase noise introduced by temporal change of the scatterers, different look angle, and volume scattering.

TOPS Interferometry Tutorial
13
Contributors to SAR Interferometric Phase
Through the interferometric processing, we shall try to eliminate other sources of error to be left with only the contributor of interest which is typically the elevation or the displacement. In the interferogram formation step we shall remove the flat-Earth phase. The flat-Earth phase is the phase present in the interferometric signal due to the curvature of the reference surface. The flat-Earth phase is estimated using the orbital and metadata information and subtracted from the complex interferogram.

TOPS Interferometry Tutorial
14
Interferogram Dialog
The interferogram product produced will contain a band for the interferometric phase.
Interferometric Phase Band
If you open the interferometric phase band, you will still see the demarcation zone between two bursts. This will be removed once TOPS Deburst is applied.

TOPS Interferometry Tutorial
15
Interferometric Phase
Interferometric fringes represent a full 2π cycle. Fringes appear on an interferogram as cycles of arbitrary colours, with each cycle representing half the sensor’s wavelength. Relative ground movement between two points can be calculated by counting the fringes and multiplying by half of the wavelength. The closer the fringes are together, the greater the strain on the ground. Flat terrain should produce a series of regularly spaced, parallel fringes. Any deviation from a parallel fringe pattern can be interpreted as topographic variation. With the same operator, you may also generate the coherence estimation in the same processing step as the interferogram. The coherence between master and slave images can show you if the images have strong similarities and are therefore good candidates for generating a DEM. Loss of coherence can produce poor interferometric results. Loss of coherence could be caused by temporal (time between acquisitions), geometric (orbit errors), volumetric (vegetation) or processing.
Coherence Contribution
The coherence band shows how similar each pixel is between the slave and master images in a scale from 0 to 1. Areas of high coherence will appear bright. Areas with poor coherence will be dark. In the image, vegetation is shown as having poor coherence and buildings have very high coherence.

TOPS Interferometry Tutorial
16
TOPS Deburst and TOPS Merge To seamlessly join all burst data into a single image, apply the TOPS Deburst operator from the Sentinel-1 TOPS menu.
Select TOPS Deburst
Open the resulting deburst interferometric phase band and deburst coherence band.
Interferometric Phase

TOPS Interferometry Tutorial
17
Coherence
To process multiple swaths, repeat steps 4 & 5 selecting the other subswaths in the TOPS Split operator. To merge the results of the processing from all subswaths, use the TOPS Merge operator. Note: In the September 2015 release of the Toolbox, it should be possible to process all subswaths all at once.
Topographic Phase Removal The Interferogram can then be flattened by removing the topographic phase. The operator will simulate an interferogram based on a reference DEM and subtract it from the processed interferogram. Step 6 - Remove Topographic Phase: Select the Interferogram product and go to the InSAR Products menu. Select Topographic Phase Removal.
Select Topographic Phase Removal

TOPS Interferometry Tutorial
18
Topographic Phase Removal Dialog
The resulting product will have an interferogram with topographic phase removed and a band for the topographic phase.
Topographic Phase Removed

TOPS Interferometry Tutorial
19
Phase Filtering Interferometric phase can be corrupted by noise from:
Temporal decorrelation
Geometric decorrelation
Volume scattering
Processing error Where there is loss of coherence, the interference pattern is lost. To be able to properly unwrap the phase, the signal-to-noise ratio needs to be increased by filtering the phase. Step 7 - Phase Filtering: Select the Interferogram product and go to the InSAR Tools menu. Select Goldstein Phase Filtering.
Select Phase Filtering

TOPS Interferometry Tutorial
20
Phase Filtering Dialog
Filtered Phase Band

TOPS Interferometry Tutorial
21
For more tutorials visit the Sentinel Toolboxes website
http://step.esa.int/main/doc/tutorials/
Send comments to the SNAP Forum
http://forum.step.esa.int/