optimizing chemiluminescent western blotscore.phmtox.msu.edu/scheduling/itemdocs/50/... ·...
TRANSCRIPT
Optimizing Chemiluminescent Western Blots
®
Published July 2011. The most recent version of this protocol is posted at: http://biosupport.licor.com
Developed for:
Odyssey® Fc Imaging System
Page 2 — Optimizing Chemiluminescent Western Blots on the Odyssey® Fc Imager
I. Introduction to Chemiluminescent Western Blotting on the Odyssey Fc Imager
Western blotting was first introduced by Towbin, et al. in 1979 as a simple method of electropho-
retic blotting of proteins onto nitrocellulose sheets. It is now a common laboratory technique with
many variations of the basic procedure. In the first step proteins are separated using gel electro-
phoresis, followed by transfer to a membrane that is then blocked to prevent non-specific binding
of antibodies. The nitrocellulose or polyvinylidene fluoride (PVDF) membrane is then probed with
a detection antibody or conjugate.
Chemiluminescent Western blots are probed with a primary antibody against the target protein,
followed by a secondary antibody labeled with HRP (horseradish peroxidase) enzyme. A chemilu-
minescent substrate for the HRP enzyme is carefully applied to the blot, and light is emitted when
the HRP enzyme modifies the substrate. Photographic film or an imaging system using a digital
CCD camera captures the emitted light as an image.
The Odyssey Fc Imaging System is a three channel, CCD-based imager that detects chemilumi-
nescent signal as well as near-infrared fluorescent signals at 700 nm and 800 nm wavelengths.
This versatile multichannel system can image both chemiluminescent and near-infrared Western
blots. It can detect near-infrared fluorescent markers on a chemiluminescent blot as well, provid-
ing a less expensive alternative to HRP-labeled markers.
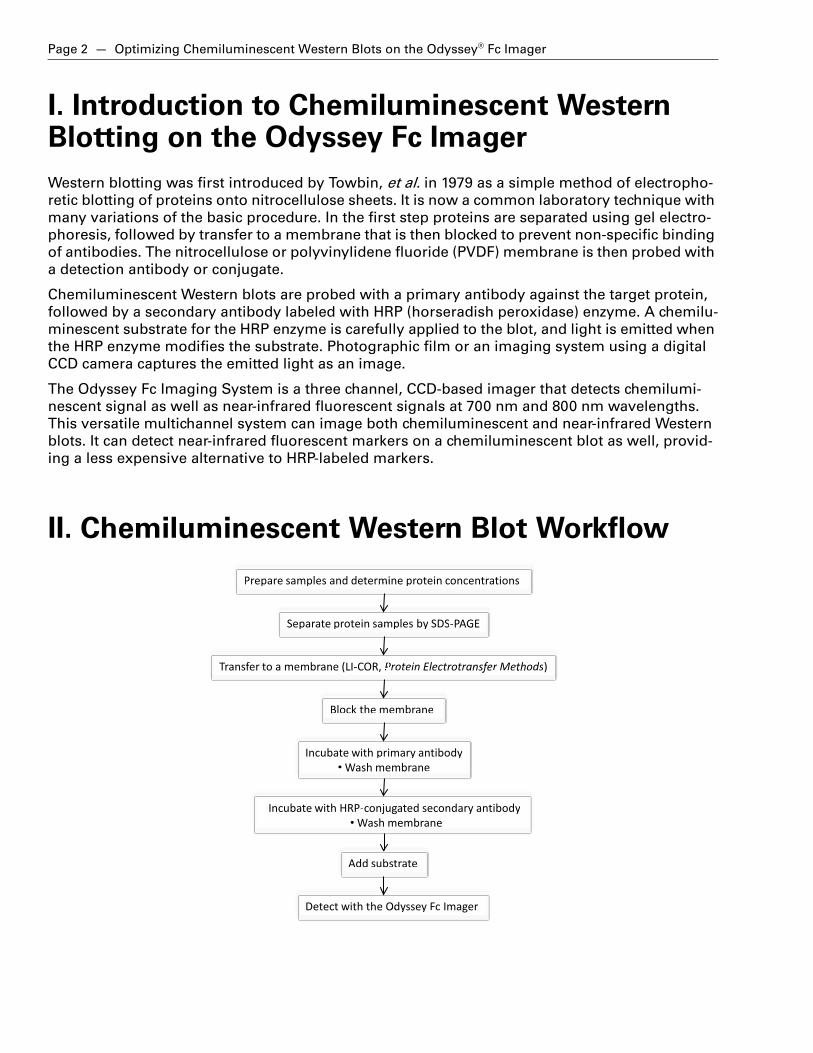
II. Chemiluminescent Western Blot Workflow
Prepare samples and determine protein concentrationsPrepare samples and determine protein concentrationsm
Separate protein samples by SDS-PAGE
Transfer to a membrane (LI-COR, Protein Electrotransfer Methods)
Separate protein samples by SDS-PAGEam
Transfer to a membrane (LI-COR, Protein Electrotransfer Methods) P
Block the membrane
Incubate with primary antibody•Wash membrane
Incubate with HRP-conjugated secondary antibody•Wash membrane
Add substrate
Detect with the Odyssey Fc Imager
Block the membranem
Incubate with HRP-conjugated secondary antibody•Wash membrane
ug
Add substrateub
Detect with the Odyssey Fc ImagerOd
Incubate with primary antibody•Wash membrane
pri
Optimizing Chemiluminescent Western Blots on the Odyssey® Fc Imager — Page 3
III. Factors that Affect a Chemiluminescent Western Blot
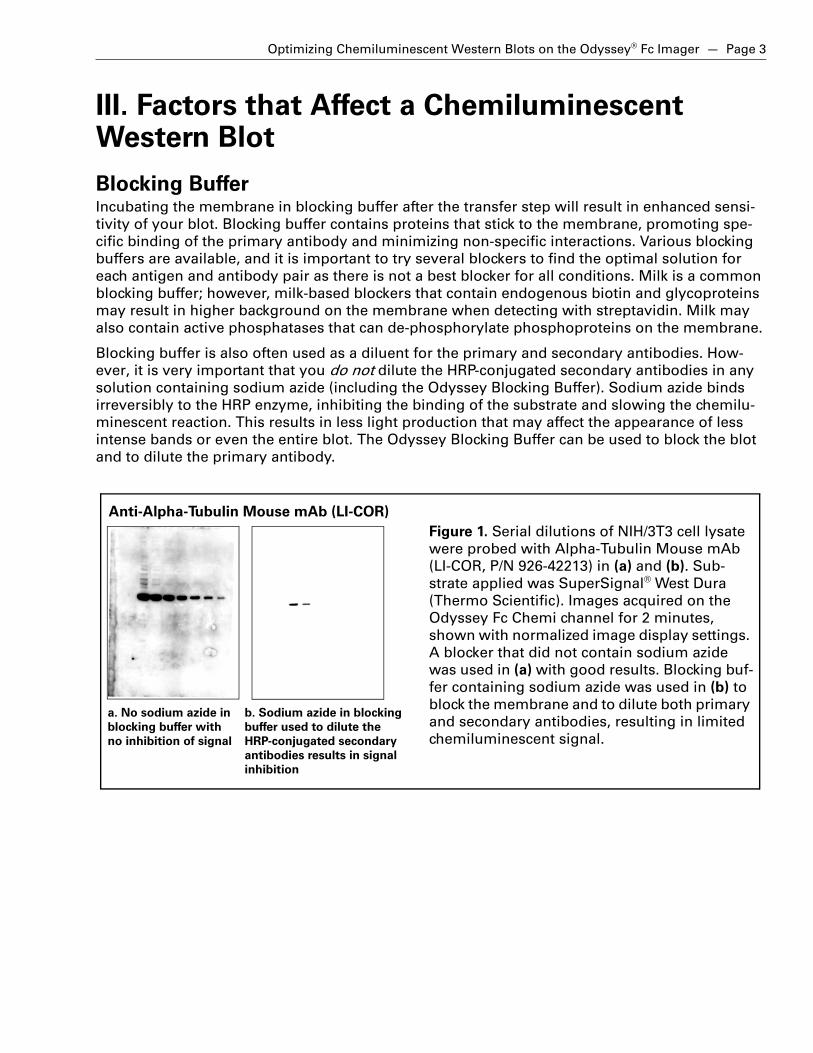
Blocking BufferIncubating the membrane in blocking buffer after the transfer step will result in enhanced sensi-
tivity of your blot. Blocking buffer contains proteins that stick to the membrane, promoting spe-
cific binding of the primary antibody and minimizing non-specific interactions. Various blocking
buffers are available, and it is important to try several blockers to find the optimal solution for
each antigen and antibody pair as there is not a best blocker for all conditions. Milk is a common
blocking buffer; however, milk-based blockers that contain endogenous biotin and glycoproteins
may result in higher background on the membrane when detecting with streptavidin. Milk may
also contain active phosphatases that can de-phosphorylate phosphoproteins on the membrane.
Blocking buffer is also often used as a diluent for the primary and secondary antibodies. How-
ever, it is very important that you do not dilute the HRP-conjugated secondary antibodies in any
solution containing sodium azide (including the Odyssey Blocking Buffer). Sodium azide binds
irreversibly to the HRP enzyme, inhibiting the binding of the substrate and slowing the chemilu-
minescent reaction. This results in less light production that may affect the appearance of less
intense bands or even the entire blot. The Odyssey Blocking Buffer can be used to block the blot
and to dilute the primary antibody.
HRP-conjugated secondary
a. No sodium azide in b. Sodium azide in blocking
Figure 1. Serial dilutions of NIH/3T3 cell lysate
were probed with Alpha-Tubulin Mouse mAb
(LI-COR, P/N 926-42213) in (a) and (b). Sub-
strate applied was SuperSignal® West Dura
(Thermo Scientific). Images acquired on the
Odyssey Fc Chemi channel for 2 minutes,
shown with normalized image display settings.
A blocker that did not contain sodium azide
was used in (a) with good results. Blocking buf-
fer containing sodium azide was used in (b) to
block the membrane and to dilute both primary
and secondary antibodies, resulting in limited
chemiluminescent signal.
Anti-Alpha-Tubulin Mouse mAb (LI-COR)
blocking buffer with
no inhibition of signal
buffer used to dilute the
antibodies results in signal
inhibition
Page 4 — Optimizing Chemiluminescent Western Blots on the Odyssey® Fc Imager
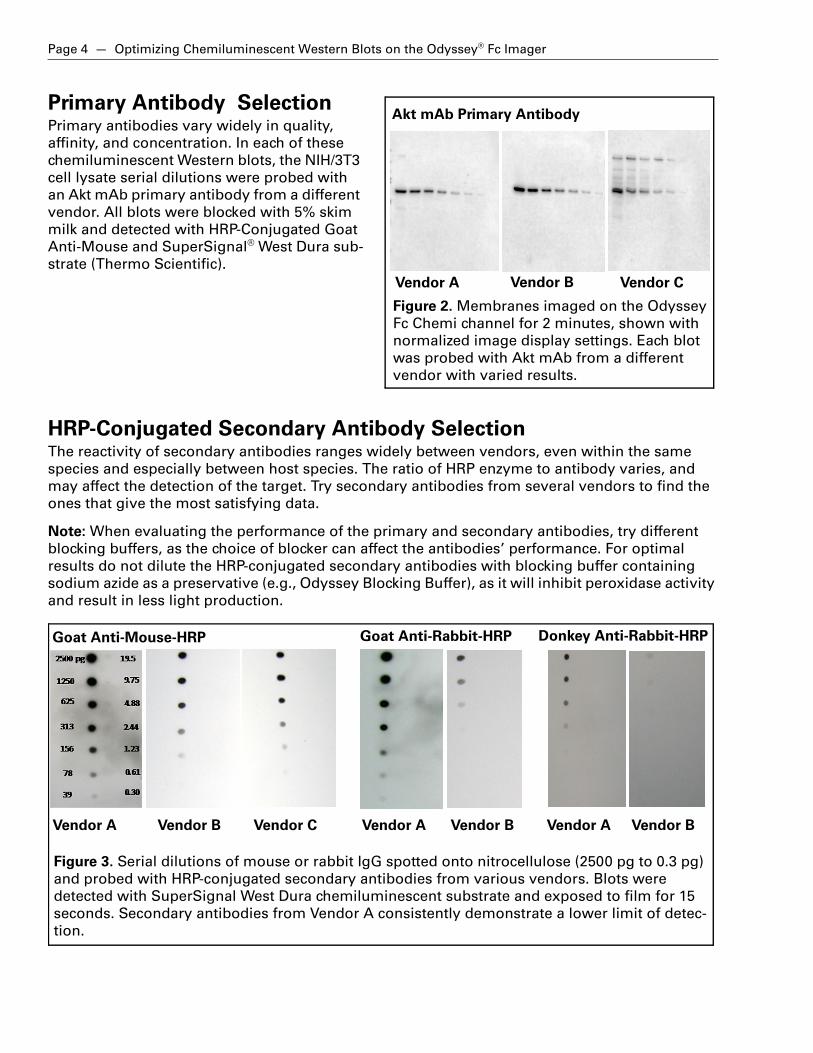
Primary Antibody SelectionPrimary antibodies vary widely in quality,
affinity, and concentration. In each of these
chemiluminescent Western blots, the NIH/3T3
cell lysate serial dilutions were probed with
an Akt mAb primary antibody from a different
vendor. All blots were blocked with 5% skim
milk and detected with HRP-Conjugated Goat
Anti-Mouse and SuperSignal® West Dura sub-
strate (Thermo Scientific).
HRP-Conjugated Secondary Antibody SelectionThe reactivity of secondary antibodies ranges widely between vendors, even within the same
species and especially between host species. The ratio of HRP enzyme to antibody varies, and
may affect the detection of the target. Try secondary antibodies from several vendors to find the
ones that give the most satisfying data.
Note: When evaluating the performance of the primary and secondary antibodies, try different
blocking buffers, as the choice of blocker can affect the antibodies’ performance. For optimal
results do not dilute the HRP-conjugated secondary antibodies with blocking buffer containing
sodium azide as a preservative (e.g., Odyssey Blocking Buffer), as it will inhibit peroxidase activity
and result in less light production.
Vendor A Vendor B Vendor C
Figure 2. Membranes imaged on the Odyssey
Fc Chemi channel for 2 minutes, shown with
normalized image display settings. Each blot
was probed with Akt mAb from a different
vendor with varied results.
Akt mAb Primary Antibody
Goat Anti-Mouse-HRP
Vendor A Vendor B Vendor C Vendor A Vendor B Vendor A Vendor B
Goat Anti-Rabbit-HRP
Figure 3. Serial dilutions of mouse or rabbit IgG spotted onto nitrocellulose (2500 pg to 0.3 pg)
and probed with HRP-conjugated secondary antibodies from various vendors. Blots were
detected with SuperSignal West Dura chemiluminescent substrate and exposed to film for 15
seconds. Secondary antibodies from Vendor A consistently demonstrate a lower limit of detec-
tion.
Donkey Anti-Rabbit-HRP
Optimizing Chemiluminescent Western Blots on the Odyssey® Fc Imager — Page 5
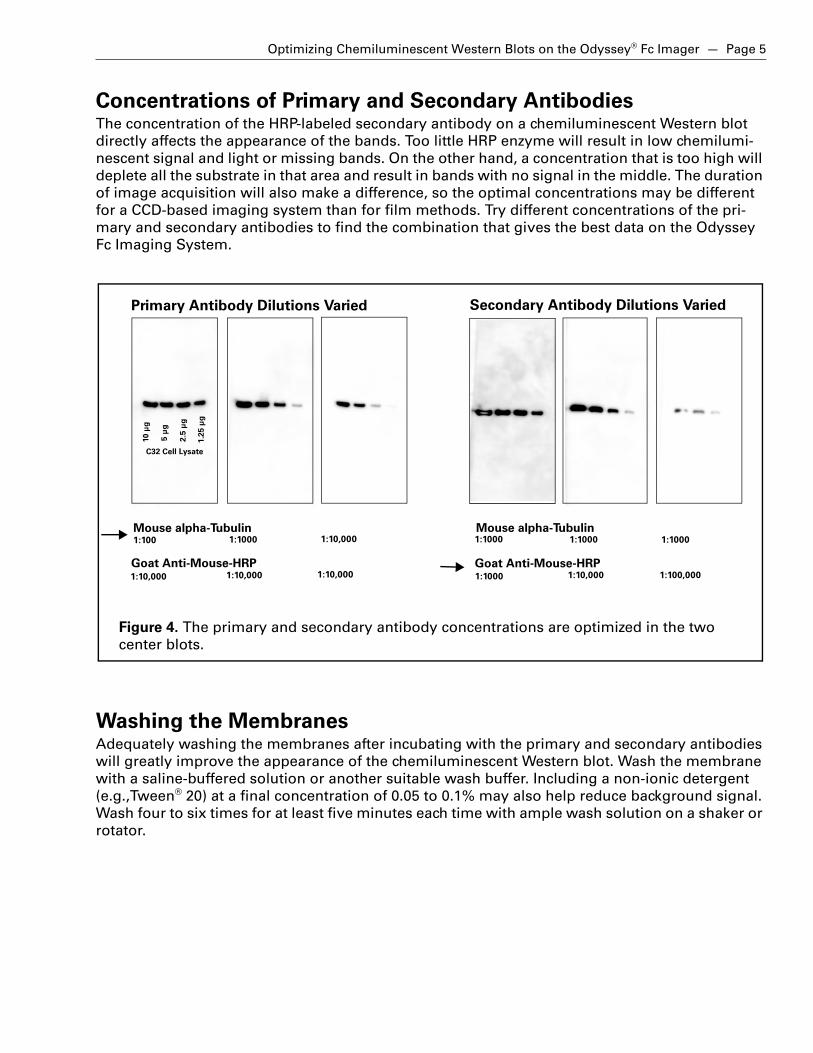
Concentrations of Primary and Secondary AntibodiesThe concentration of the HRP-labeled secondary antibody on a chemiluminescent Western blot
directly affects the appearance of the bands. Too little HRP enzyme will result in low chemilumi-
nescent signal and light or missing bands. On the other hand, a concentration that is too high will
deplete all the substrate in that area and result in bands with no signal in the middle. The duration
of image acquisition will also make a difference, so the optimal concentrations may be different
for a CCD-based imaging system than for film methods. Try different concentrations of the pri-
mary and secondary antibodies to find the combination that gives the best data on the Odyssey
Fc Imaging System.
Washing the MembranesAdequately washing the membranes after incubating with the primary and secondary antibodies
will greatly improve the appearance of the chemiluminescent Western blot. Wash the membrane
with a saline-buffered solution or another suitable wash buffer. Including a non-ionic detergent
(e.g.,Tween® 20) at a final concentration of 0.05 to 0.1% may also help reduce background signal.
Wash four to six times for at least five minutes each time with ample wash solution on a shaker or
rotator.
Figure 4. The primary and secondary antibody concentrations are optimized in the two
center blots.
1:1000 1:1000 1:10001:100 1:1000 1:10,000
1:1000 1:10,000 1:100,000
Goat Anti-Mouse-HRP1:10,000 1:10,000 1:10,000
10
μg
5 μ
g
2.5
μg
1.2
5 μ
g
Primary Antibody Dilutions Varied Secondary Antibody Dilutions Varied
C32 Cell Lysate
Mouse alpha-Tubulin
Goat Anti-Mouse-HRP
Mouse alpha-Tubulin
Page 6 — Optimizing Chemiluminescent Western Blots on the Odyssey® Fc Imager
Chemiluminescent Substrates
There is a wide variety of chemiluminescent sub-
strates for HRP detection and some are better suited
for digital imaging than others. Generally, choose a
substrate with a faster rate of reaction for use with the
Odyssey Fc Imaging System. Some substrates that are
designed for optimal performance on film may not be
suitable for detection on a CCD-based imaging sys-
tem. Try different substrates to find the one that gives
the most desirable image.
Ensure the substrate is at room tem-
perature before use for optimum sig-
nal. Cold temperatures slow the
activity of the HRP enzyme, resulting
in less light production and less
intense or missing bands (Figure 6).
IV. Troubleshooting Guide
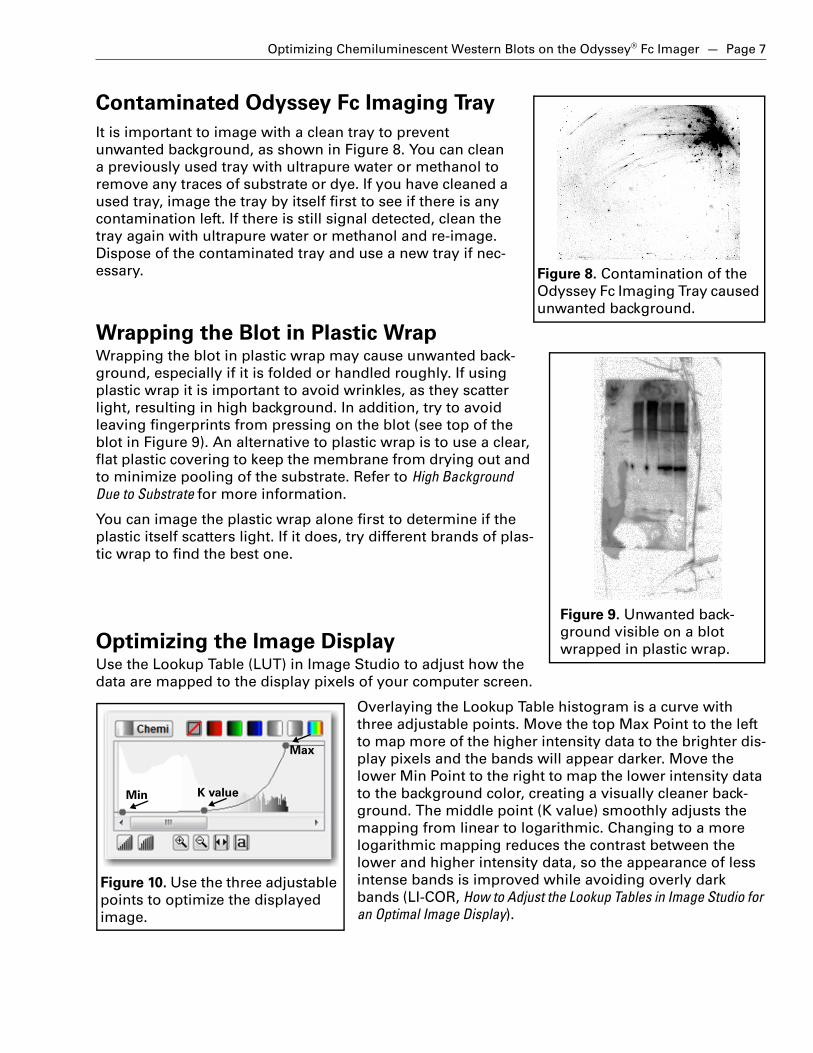
High Background Due to SubstratePools of excess substrate on the membrane
can lead to areas of high background, as can
adding more substrate to a membrane that has
dried. Apply the substrate carefully and wick
off any pools of substrate before imaging. Do
not allow the membrane to dry.
Placing a clear, flat plastic covering on the che-
miluminescent Western blot will prevent the
blot from drying out by keeping the substrate
in contact with the HRP enzyme. It will also
minimize pooling of the substrate. Image the
plastic covering by itself first to determine if it
scatters light, causing high background. You
may need to try several types of plastic cover-
ings before finding the best one.
Figure 5. Different substrates were
used in a.-d. with varied results.
a. b. c. d.
Slot Blots with HRP-Conjugated
Secondary Antibody
Figure 6. Substrate
used (a) cold and
(b) at room temper-
ature. Darker bands
indicate more enzy-
matic activity when
the substrate is at
room temperature
(b).
a. Substrate b. Substrate
used cold at room temp.
Figure 7. High background due to excess sub-
strate (left) and adding more substrate to a
dried blot (right).
Pooled Substrate Adding Substrate
to a Dried Blot
Optimizing Chemiluminescent Western Blots on the Odyssey® Fc Imager — Page 7
Contaminated Odyssey Fc Imaging Tray
It is important to image with a clean tray to prevent
unwanted background, as shown in Figure 8. You can clean
a previously used tray with ultrapure water or methanol to
remove any traces of substrate or dye. If you have cleaned a
used tray, image the tray by itself first to see if there is any
contamination left. If there is still signal detected, clean the
tray again with ultrapure water or methanol and re-image.
Dispose of the contaminated tray and use a new tray if nec-
essary.
Wrapping the Blot in Plastic WrapWrapping the blot in plastic wrap may cause unwanted back-
ground, especially if it is folded or handled roughly. If using
plastic wrap it is important to avoid wrinkles, as they scatter
light, resulting in high background. In addition, try to avoid
leaving fingerprints from pressing on the blot (see top of the
blot in Figure 9). An alternative to plastic wrap is to use a clear,
flat plastic covering to keep the membrane from drying out and
to minimize pooling of the substrate. Refer to High Background Due to Substrate for more information.
You can image the plastic wrap alone first to determine if the
plastic itself scatters light. If it does, try different brands of plas-
tic wrap to find the best one.
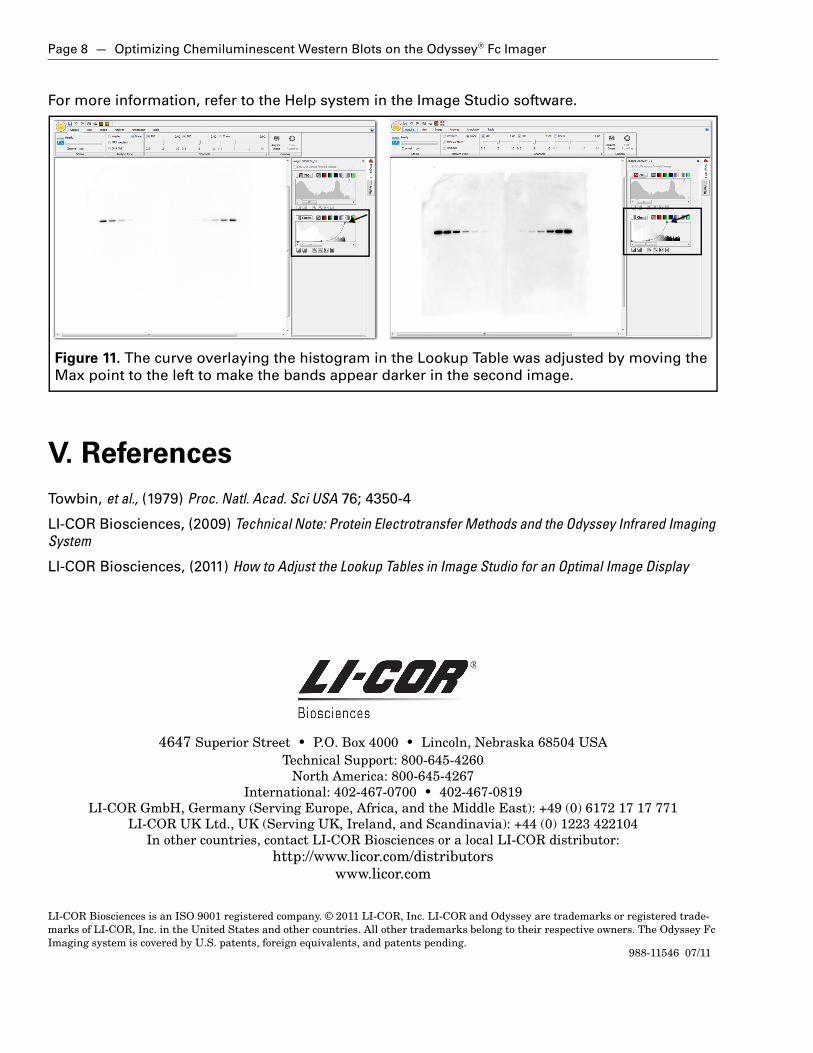
Optimizing the Image DisplayUse the Lookup Table (LUT) in Image Studio to adjust how the
data are mapped to the display pixels of your computer screen.
Overlaying the Lookup Table histogram is a curve with
three adjustable points. Move the top Max Point to the left
to map more of the higher intensity data to the brighter dis-
play pixels and the bands will appear darker. Move the
lower Min Point to the right to map the lower intensity data
to the background color, creating a visually cleaner back-
ground. The middle point (K value) smoothly adjusts the
mapping from linear to logarithmic. Changing to a more
logarithmic mapping reduces the contrast between the
lower and higher intensity data, so the appearance of less
intense bands is improved while avoiding overly dark
bands (LI-COR, How to Adjust the Lookup Tables in Image Studio for an Optimal Image Display).
Figure 8. Contamination of the
Odyssey Fc Imaging Tray caused
unwanted background.
Figure 9. Unwanted back-
ground visible on a blot
wrapped in plastic wrap.
Figure 10. Use the three adjustable
points to optimize the displayed
image.
Min
Max
K value
Page 8 — Optimizing Chemiluminescent Western Blots on the Odyssey® Fc Imager
For more information, refer to the Help system in the Image Studio software.
V. References
Towbin, et al., (1979) Proc. Natl. Acad. Sci USA 76; 4350-4
LI-COR Biosciences, (2009) Technical Note: Protein Electrotransfer Methods and the Odyssey Infrared Imaging System
LI-COR Biosciences, (2011) How to Adjust the Lookup Tables in Image Studio for an Optimal Image Display
4647 Superior Street • P.O. Box 4000 • Lincoln, Nebraska 68504 USATechnical Support: 800-645-4260
North America: 800-645-4267International: 402-467-0700 • 402-467-0819
LI-COR GmbH, Germany (Serving Europe, Africa, and the Middle East): +49 (0) 6172 17 17 771LI-COR UK Ltd., UK (Serving UK, Ireland, and Scandinavia): +44 (0) 1223 422104
In other countries, contact LI-COR Biosciences or a local LI-COR distributor:http://www.licor.com/distributors
www.licor.com
LI-COR Biosciences is an ISO 9001 registered company. © 2011 LI-COR, Inc. LI-COR and Odyssey are trademarks or registered trade-marks of LI-COR, Inc. in the United States and other countries. All other trademarks belong to their respective owners. The Odyssey Fc Imaging system is covered by U.S. patents, foreign equivalents, and patents pending.
Figure 11. The curve overlaying the histogram in the Lookup Table was adjusted by moving the
Max point to the left to make the bands appear darker in the second image.
®
988-11546 07/11