ngn asset integrity investment methodology · ngn asset integrity investment methodology. ... 2...
TRANSCRIPT

NGN Asset Integrity Investment
Sub Appendix A19:B
NGN Asset Integrity Investment Methodology

Asset Integrity Investment
Methodology
Sub Appendix A19:B

2
Asset Integrity Investment Methodology
• Overriding principle is to invest only where clear benefits are delivered.
• Focus is on Total Network Management (TNM) with asset management by
our Customer Operations Area Managers (COAMs).
• This is not an aggressive Investment plan.
• However priorities are shifting due to asset condition.
• Majority of assets have been in operation for over 40 years.
• We have a robust track record of maintaining not unnecessarily replacing
assets.
3
Asset Integrity Investment Methodology
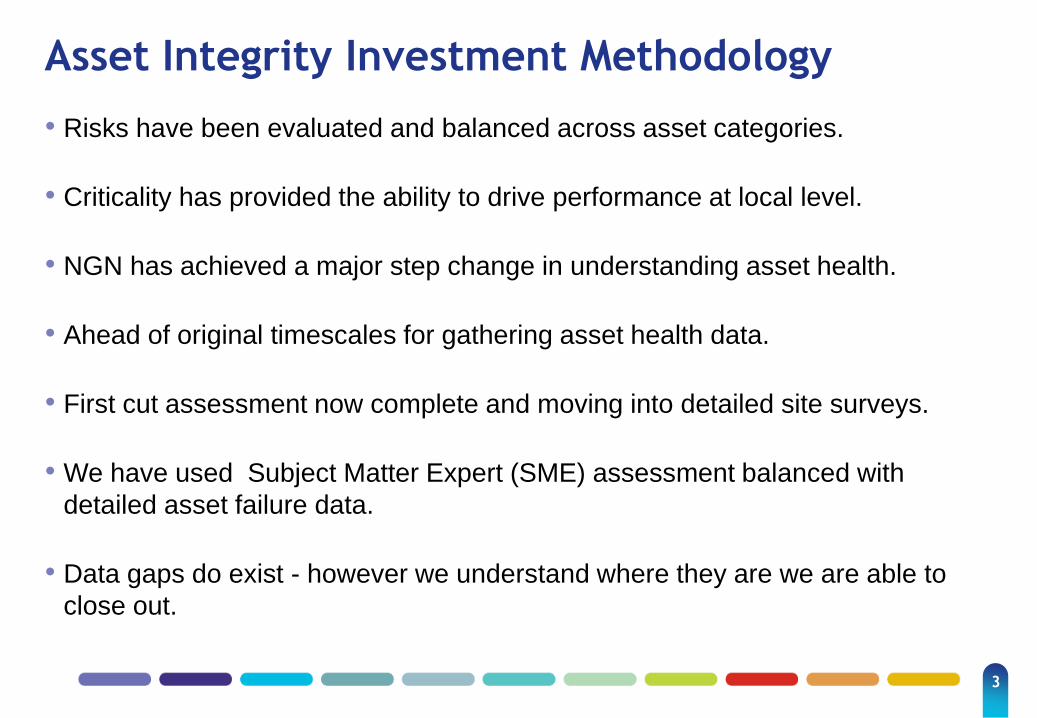
• Risks have been evaluated and balanced across asset categories.
• Criticality has provided the ability to drive performance at local level.
• NGN has achieved a major step change in understanding asset health.
• Ahead of original timescales for gathering asset health data.
• First cut assessment now complete and moving into detailed site surveys.
• We have used Subject Matter Expert (SME) assessment balanced with
detailed asset failure data.
• Data gaps do exist - however we understand where they are we are able to
close out.

4
Asset Health Category 18 – Pressure
Reduction Installations Above 7 bar.
GREEN

5
Asset Health – NGN Overview
• Purpose: To give an overview of NGN’s approach to Asset Health.
• Structure: three categories:
- PRI’s (deep dive – Pre-Heating) Green
- Telemetry above 7 bar (deep dive – Energy Flow Measurement) Amber
- Special Crossings below 7 bar (Deep dive - non N2 Sleeves) Red
• Out of the 47 categories (including sub categories)
- 40% Green
- 54% Amber
- 6% Red
Robust data and/or confident in assumptions
Good data – improvement required, but confident in assumptions
Data unavailable or poor quality – requires more date but based on solid assumptions

6
Asset Health Category 18 – Pressure
Reduction Installations above 7 bar
The challenge:
- PRI’s have multiple independent components parts.
- Different component parts have different asset health and criticality indices.
- Different parts of the PRI may have been modified / upgraded at different
moments in time.
How do you correctly define the asset health of an above 7 bar PRI taking into
account the factors above?
7
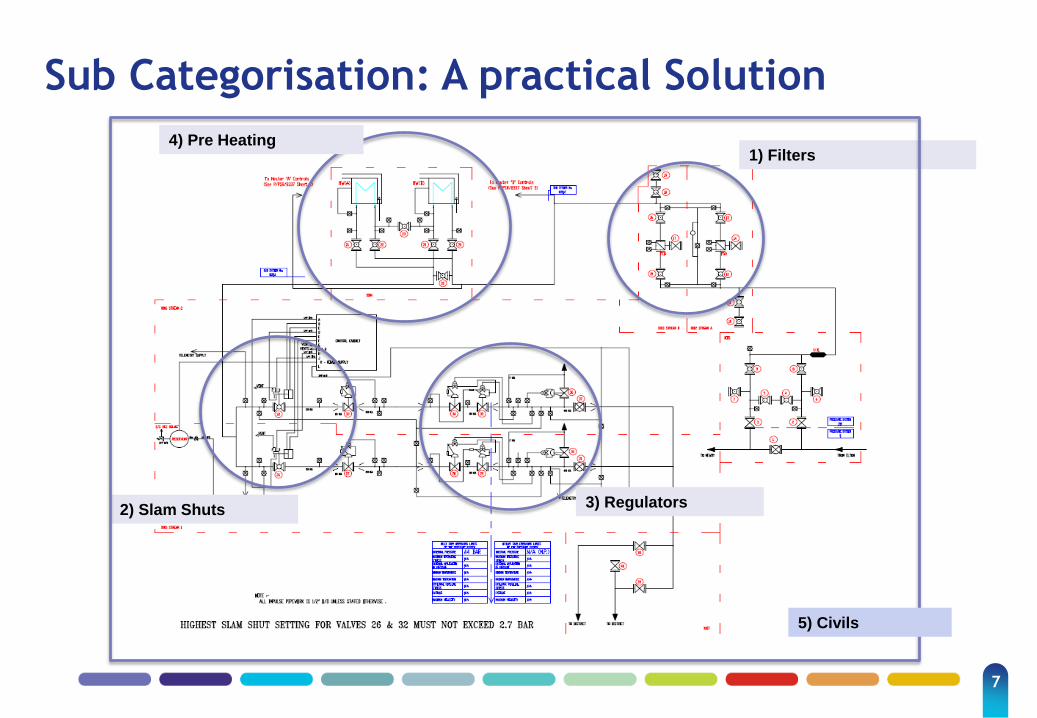
Sub Categorisation: A practical Solution
1) Filters
2) Slam Shuts
4) Pre Heating
3) Regulators
5) Civils

8
The Master Table – Supported by the sub tables
Sub tables populated
independently against
their own criteria rolling
up to the master table.

9
Pre Heating – Deep Dive
Pre-heating represents a significant investment throughout RIIO-GD1. This
investment line has been driven by the asset health assessment.
The network believes it could have a potentially significant issue with site pre-
heating throughout and after RIIO-GD1 if this critical issue is not addressed.
Our above 7 bar PRI’s currently have:
• 67 Water Bath Heaters (WBH); and
• 33 Boiler packages
Within RIIO-GD1 the network is
forecasting to replace / upgrade :
• 16 WBH (24%)
• 20 Boiler Packages (65%)
10
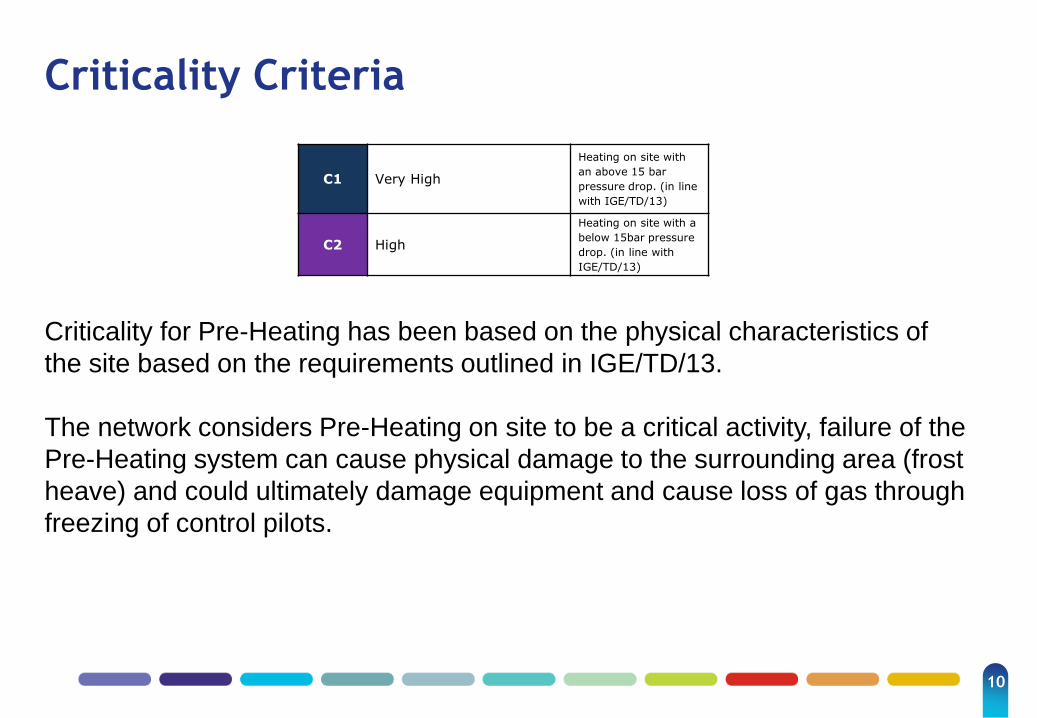
Criticality Criteria
Criticality for Pre-Heating has been based on the physical characteristics of
the site based on the requirements outlined in IGE/TD/13.
The network considers Pre-Heating on site to be a critical activity, failure of the
Pre-Heating system can cause physical damage to the surrounding area (frost
heave) and could ultimately damage equipment and cause loss of gas through
freezing of control pilots.
C1 Very High
Heating on site with
an above 15 bar
pressure drop. (in line
with IGE/TD/13)
C2 High
Heating on site with a
below 15bar pressure
drop. (in line with
IGE/TD/13)
11
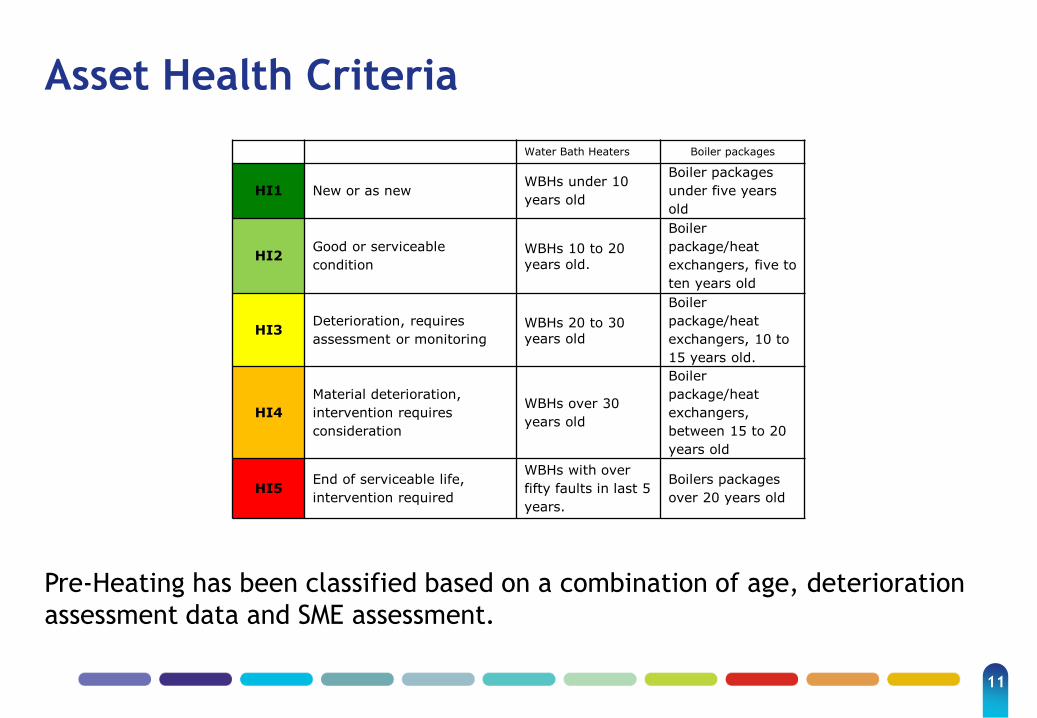
Asset Health Criteria
Pre-Heating has been classified based on a combination of age, deterioration
assessment data and SME assessment.
Water Bath Heaters Boiler packages
HI1 New or as new WBHs under 10
years old
Boiler packages
under five years
old
HI2 Good or serviceable
condition
WBHs 10 to 20 years old.
Boiler
package/heat
exchangers, five to
ten years old
HI3 Deterioration, requires
assessment or monitoring
WBHs 20 to 30 years old
Boiler
package/heat
exchangers, 10 to
15 years old.
HI4
Material deterioration,
intervention requires
consideration
WBHs over 30
years old
Boiler
package/heat
exchangers,
between 15 to 20
years old
HI5 End of serviceable life,
intervention required
WBHs with over
fifty faults in last 5
years.
Boilers packages
over 20 years old

12
Deterioration Rates
NE WBH Average Number of Faults
y = 37.8x - 75469
y = 5.5x - 11000
0
100
200
300
400
500
600
2005 2006 2007 2008 2009 2010 2011
y = 7.4x - 14734
y = 5.2x - 10416
0
20
40
60
80
100
120
140
160
180
2005 2006 2007 2008 2009 2010 2011
NE Boilers Average Number of Faults
WBH • Once over 40 faults in five years has been reached
there is a ongoing significant deterioration in asset
health.
• Below 40 faults in five years show a minimal
increase in deterioration.
• NGN has based its replacement i.e. HI5 threshold on
50 faults in five years identifying the programme
through constant monitoring.
Boiler Packages • Using the same 40 faults in five years criteria there is
a ongoing deterioration in asset health with a
consistently high number of faults.
• Below forty faults in five years show a lower increase
in deterioration.
• NGN has based its replacement i.e. HI5 threshold on
50 faults in five years and we anticipate that a
significant number of boilers will achieve this
threshold considering historic age, fault data coupled
with manufacturers guidelines and SME
assessments.

13
The Data
Our above 7 bar PRI’s
currently have:
• 67 Water Bath Heaters
• 33 Boiler packages
Within RIIO-GD1 the network
is expecting to replace/
upgrade :
• 16 WBH (24%)
• 20 Boiler Packages (65%)
Cowpen Bewley is
being undertaken this
year.
14
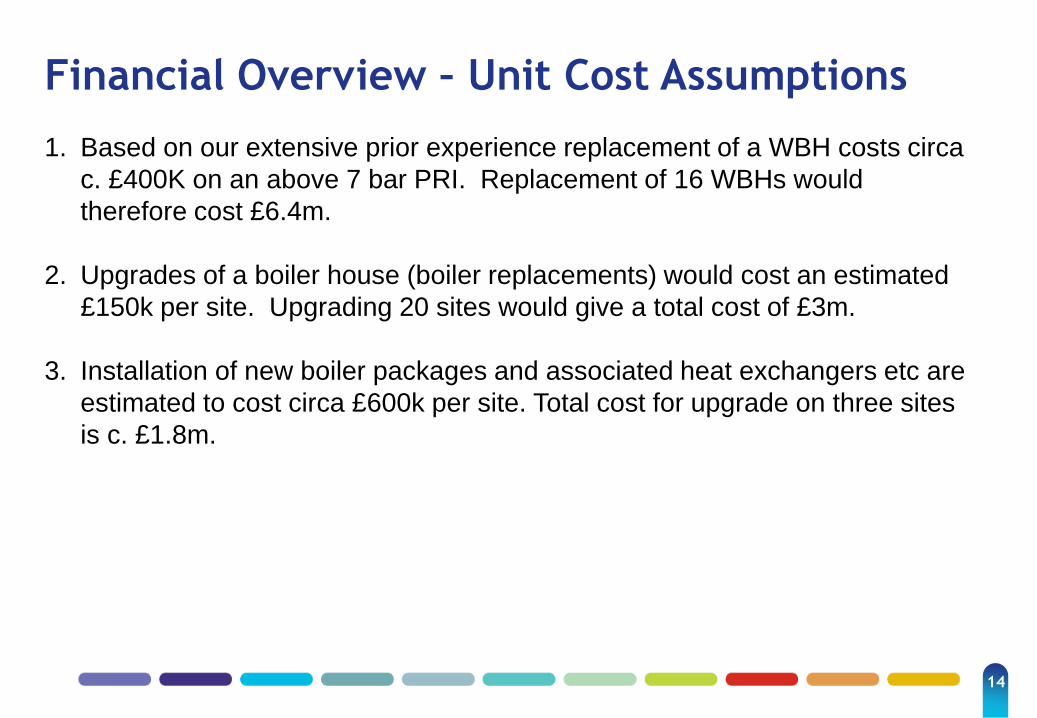
Financial Overview – Unit Cost Assumptions
1. Based on our extensive prior experience replacement of a WBH costs circa
c. £400K on an above 7 bar PRI. Replacement of 16 WBHs would
therefore cost £6.4m.
2. Upgrades of a boiler house (boiler replacements) would cost an estimated
£150k per site. Upgrading 20 sites would give a total cost of £3m.
3. Installation of new boiler packages and associated heat exchangers etc are
estimated to cost circa £600k per site. Total cost for upgrade on three sites
is c. £1.8m.

15
Financial Overview – Forecast Expenditure
See RIIO-GD1 Business Plan – Figure 7.33
Different Asset Health Category 17 – Offtakes
16
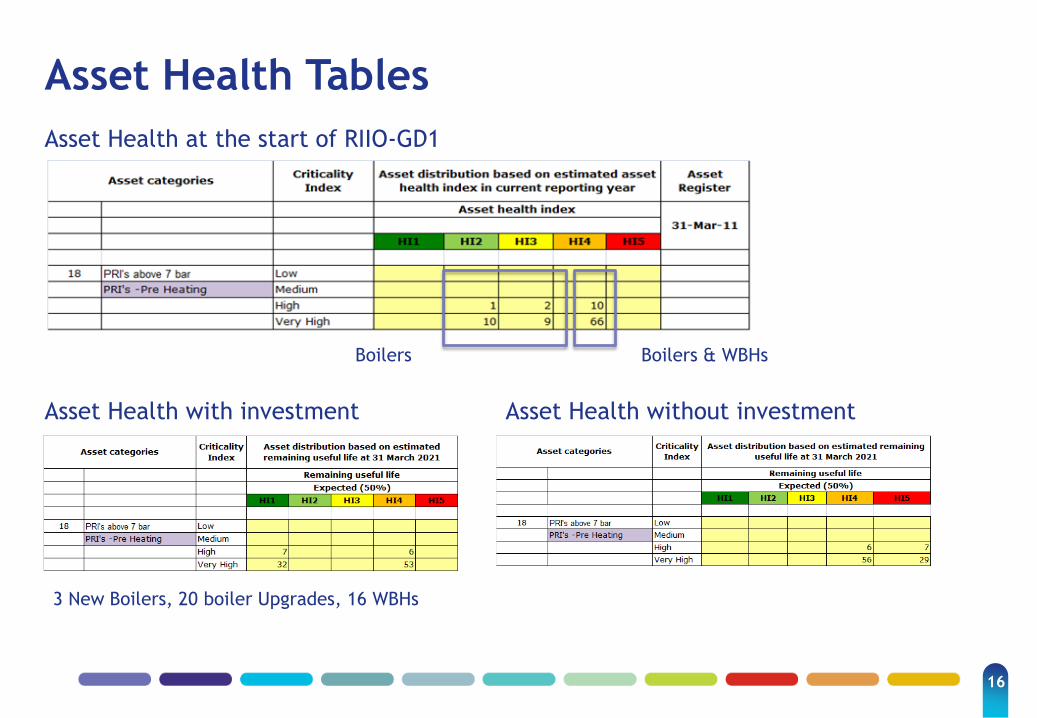
Asset Health Tables
Asset Health at the start of RIIO-GD1
Boilers Boilers & WBHs
Asset Health with investment
3 New Boilers, 20 boiler Upgrades, 16 WBHs
Asset Health without investment
17
Asset Health Category 22 –
Telemetry above 7 bar AMBER
18
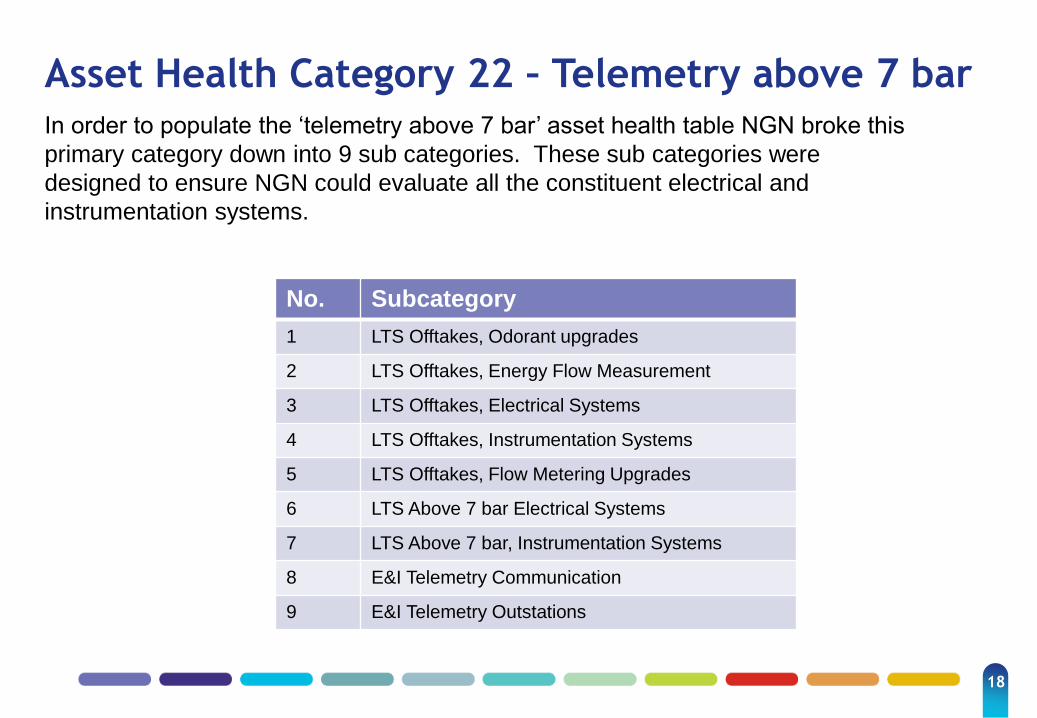
Asset Health Category 22 – Telemetry above 7 bar
In order to populate the ‘telemetry above 7 bar’ asset health table NGN broke this
primary category down into 9 sub categories. These sub categories were
designed to ensure NGN could evaluate all the constituent electrical and
instrumentation systems.
No. Subcategory
1 LTS Offtakes, Odorant upgrades
2 LTS Offtakes, Energy Flow Measurement
3 LTS Offtakes, Electrical Systems
4 LTS Offtakes, Instrumentation Systems
5 LTS Offtakes, Flow Metering Upgrades
6 LTS Above 7 bar Electrical Systems
7 LTS Above 7 bar, Instrumentation Systems
8 E&I Telemetry Communication
9 E&I Telemetry Outstations

19
The Master Table – Supported by the sub tables
Sub tables populated
independently against
their own criteria rolling
up to the master table.

20
Energy Flow Measurement – Deep Dive
C1 Very High
Can not be
replaced on fail -
must operate 24/7
HI4
Material deterioration,
intervention requires
consideration
Component
equipment
tending towards
obsolescence
Asset Health
Criticality
Energy flow measurement equipment is critical to all networks to confirm and record
the energy of the gas entering our system. Failure of this equipment would be a
breach of GSMR regulations and cause significant issues for gas shippers.
Calorimeters and specifically the controllers on the network are now over 15 years old
and are obsolete or have component parts tending towards obsolescence. Minimal
spares / support is available and new improved calorimeters allow the network to ensure
energy measurement accuracy and reliability using the latest IFI developed process/audit
software.
21
Deterioration Rates
As is the case with a large amount of E&I based equipment, a significant factor affecting
deterioration rates is obsolete equipment. E&I equipment and specifically the operating
hardware / software is relatively fast moving, as such many of the deterioration rates
have been based on SMEassessment and historical trends of equipment obsolescence.
Specifically relating to energy flow measurement:
• Deterioration rates have been determined at fiveyear intervals derived from a twenty
year design life. The intervention required was based on network experience of
upgrading this equipment and an estimate of asset depreciation rates linked to
manufacturers guidance on design life.
• Specific to NGN our calorimeter controllers have not been manufactured for some
time and minimal components are available. Skilled contractors to carry out expert
work are also difficult to find. The calorimeters also have a have now been
superseded and will become unsupported during the RIIO-GD1 period.

22
The Data
NGN Offtake Calorimeters
Site Installation Date Manufacturer System Control
Fault Data
Burley Bank 1995/6 Daniels Yes
Ganstead 1995/6 Daniels Yes
Pannal 1995/6 Daniels Yes
Paull 1995/6 Daniels Yes
Pickering 1995/6 Daniels Yes
Towton 1995/6 Daniels Yes
Bishop Auckland 1995/6 Daniels Yes
Wetheral 1995/6 Daniels Yes
Cowpen Bewley 1995/6 Daniels Yes
Elton 1995/6 Daniels Yes
Little Burdon 1995/6 Daniels Yes
Saltwick 1995/6 Daniels Yes
23
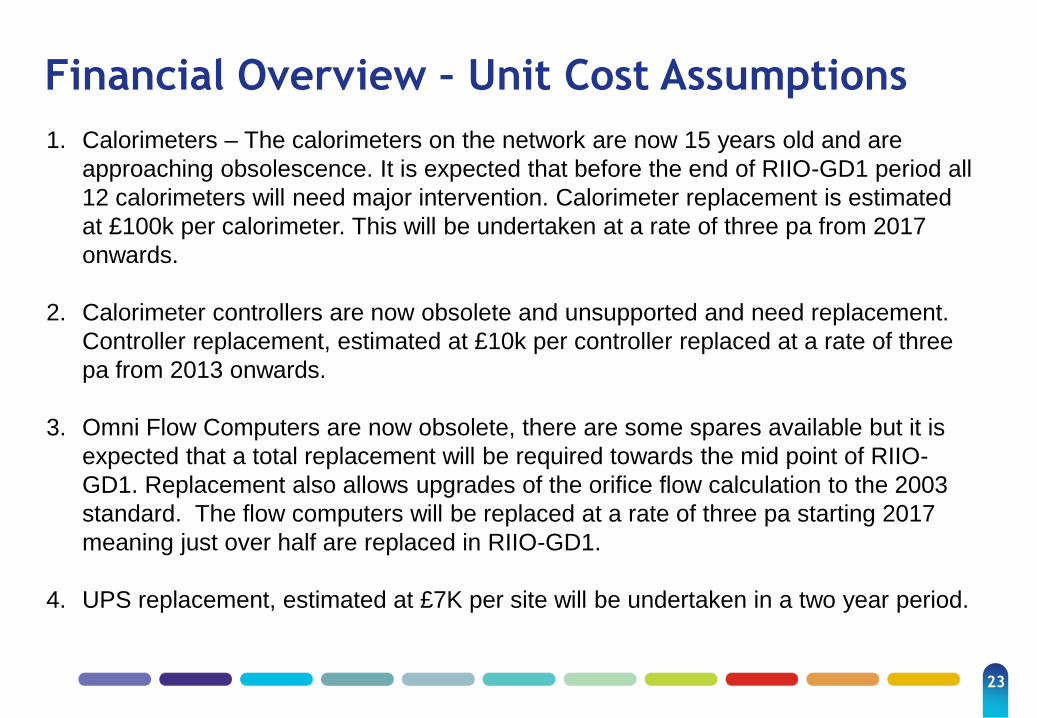
Financial Overview – Unit Cost Assumptions
1. Calorimeters – The calorimeters on the network are now 15 years old and are
approaching obsolescence. It is expected that before the end of RIIO-GD1 period all
12 calorimeters will need major intervention. Calorimeter replacement is estimated
at £100k per calorimeter. This will be undertaken at a rate of three pa from 2017
onwards.
2. Calorimeter controllers are now obsolete and unsupported and need replacement.
Controller replacement, estimated at £10k per controller replaced at a rate of three
pa from 2013 onwards.
3. Omni Flow Computers are now obsolete, there are some spares available but it is
expected that a total replacement will be required towards the mid point of RIIO-
GD1. Replacement also allows upgrades of the orifice flow calculation to the 2003
standard. The flow computers will be replaced at a rate of three pa starting 2017
meaning just over half are replaced in RIIO-GD1.
4. UPS replacement, estimated at £7K per site will be undertaken in a two year period.
24
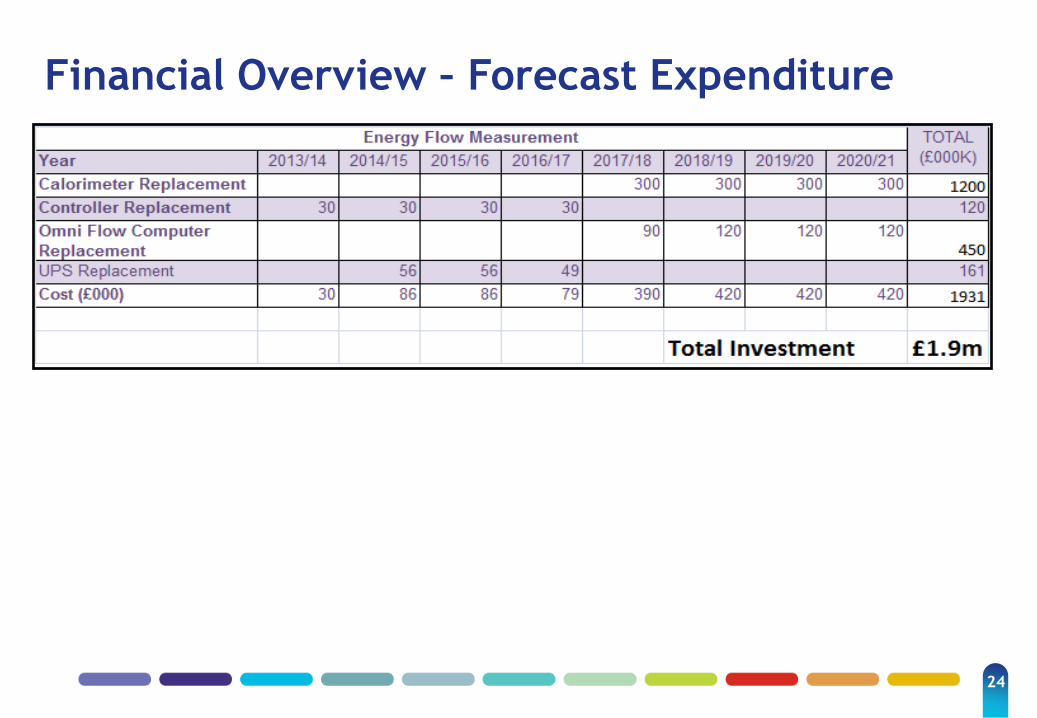
Financial Overview – Forecast Expenditure

25
Asset Health Tables
Asset Health at the start of RIIO-GD1
Asset Health with investment
Asset Health without investment

26
Asset Health Category 3 – Special
Crossings (< 7 bar) RED

27
Asset Health Category 3 –
Special Crossings (< 7 bar)
In order to populate the ‘Special Crossings (< 7 bar)’ asset health table NGN broke
this primary category down into two sub categories. These sub categories were
designed to ensure NGN could evaluate all special crossings within the asset health
system methodology.
No. Subcategory
1 Non Nitrogen (N2) Sleeves
2 Over crossings
NGN currently have c.1700 <7 bar overcrossings. The investment through RIIO-GD1
will allow the upgrade of 140 crossings (8%).

28
The Master Table – Supported by the sub tables
Sub tables populated
independently against
their own criteria rolling
up to the master table.
29
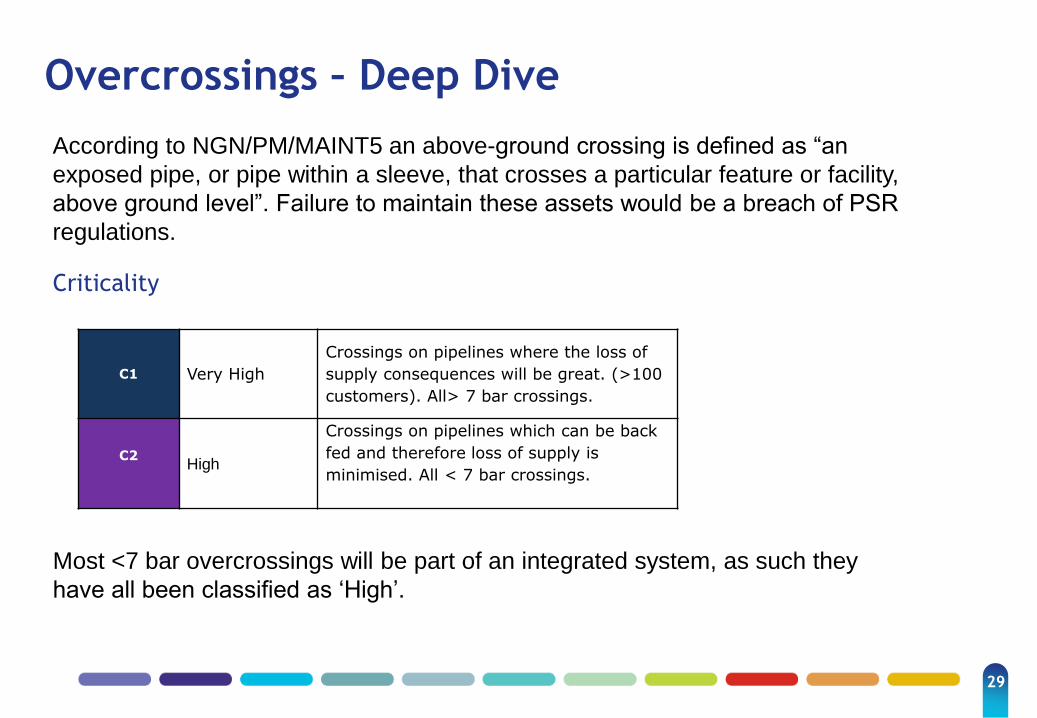
Overcrossings – Deep Dive
C1 Very High
Crossings on pipelines where the loss of
supply consequences will be great. (>100
customers). All> 7 bar crossings.
C2
High
Crossings on pipelines which can be back
fed and therefore loss of supply is
minimised. All < 7 bar crossings.
Criticality
According to NGN/PM/MAINT5 an above-ground crossing is defined as “an
exposed pipe, or pipe within a sleeve, that crosses a particular feature or facility,
above ground level”. Failure to maintain these assets would be a breach of PSR
regulations.
Most <7 bar overcrossings will be part of an integrated system, as such they
have all been classified as ‘High’.
30
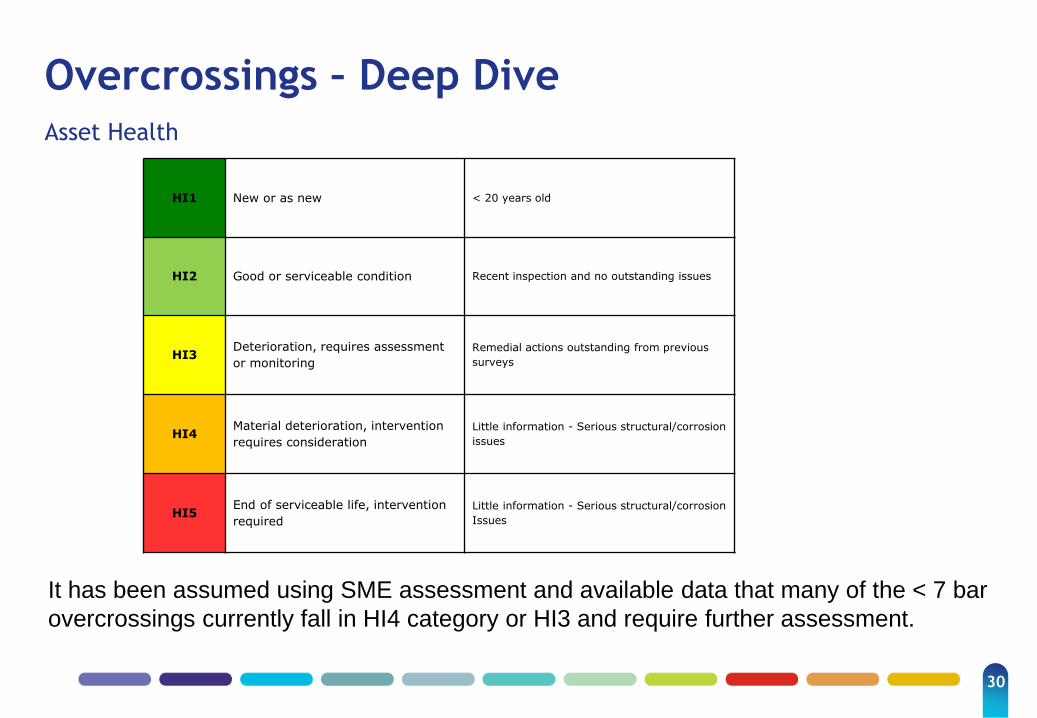
Overcrossings – Deep Dive
Asset Health
HI1 New or as new < 20 years old
HI2 Good or serviceable condition Recent inspection and no outstanding issues
HI3 Deterioration, requires assessment
or monitoring
Remedial actions outstanding from previous
surveys
HI4 Material deterioration, intervention
requires consideration
Little information - Serious structural/corrosion
issues
HI5 End of serviceable life, intervention
required
Little information - Serious structural/corrosion
Issues
It has been assumed using SME assessment and available data that many of the < 7 bar
overcrossings currently fall in HI4 category or HI3 and require further assessment.

31
The Data
All data for overcrossings is held with the relevant experts (pipeline engineers) or within
a database which is under development. Currently this database contains only a list of
points where a pipe is exposed above ground.
32
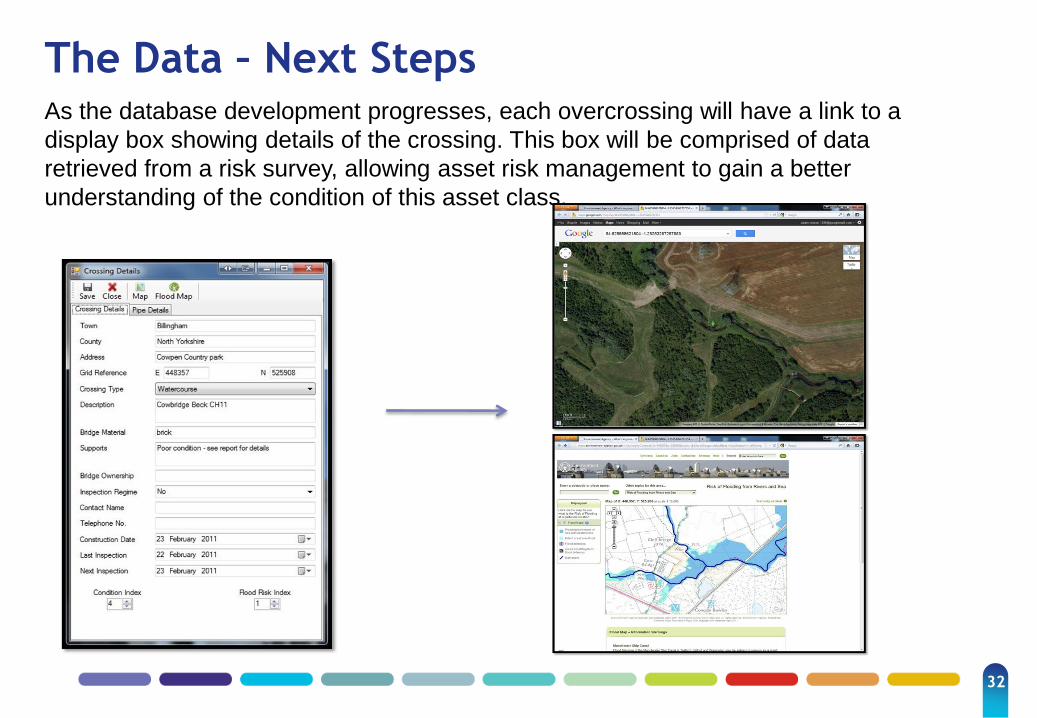
The Data – Next Steps
As the database development progresses, each overcrossing will have a link to a
display box showing details of the crossing. This box will be comprised of data
retrieved from a risk survey, allowing asset risk management to gain a better
understanding of the condition of this asset class.

33
Deterioration Rates
Overcrossings will deteriorate in time due to weather initiating corrosion as well as “one-
off” natural incidents, such as flooding. Ongoing surveys and monitoring will identify
upgrades required to ensure these assets are fit for purpose on a rolling program.
Deterioration rates have been determined in line with the same methodology as was
determined for Asset Category 1: LTS Pipelines, whereby an assumed percentage of
overcrossings are expected to deteriorate in health. This percentage is based on historic
data, to project forward into RIIO-GD1.
Investment will be targeted at preventing this deterioration occurring and maintaining
assets to a good working standard.
34
Financial Overview – Unit cost Assumptions
1. The overcrossings in the network are of various ages and condition. Overcrossings
are unlikely to be replaced entirely and the majority of works will include repainting,
rewrapping and reinforcement to prevent deterioration or to repair damage from an
environmental “one-off” such as flooding.
2. Based on previous remedial work carried out on overcrossings, a unit cost of £5K -
£30K has been estimated, covering all types of remedial work to be undertaken on
overcrossings.

35
Financial Overview – Forecast Expenditure
Overcrossings may require repainting, rewrapping and reinforcing to ensure they stay
in a good and serviceable condition. A total of £2.4m has been allocated for
overcrossings within our RIIO-GD1 plan. This is based on SME assessment and the
data we have to date. It is believed this is sufficient investment to allow none of the
overcrossing assets to be in HI4/HI5 at the end of RIIO-GD1, therefore delivering a
significant removal of risk from the network.
Expenditure (£M) 13/14 14/15 15/16 16/17 17/18 18/19 19/20 20/21
Overcrossings 0.3 0.3 0.3 0.3 0.3 0.3 0.3 0.3
See RIIO Business Plan – Figure 7.38

36
Asset Health Tables
Asset Health and Criticality – at the start of RIIO-GD1
Asset Health and Criticality – With Investment
Asset Health and Criticality – Without Investment

37
Asset Health – Risk Scoring and Trade-Offs
38
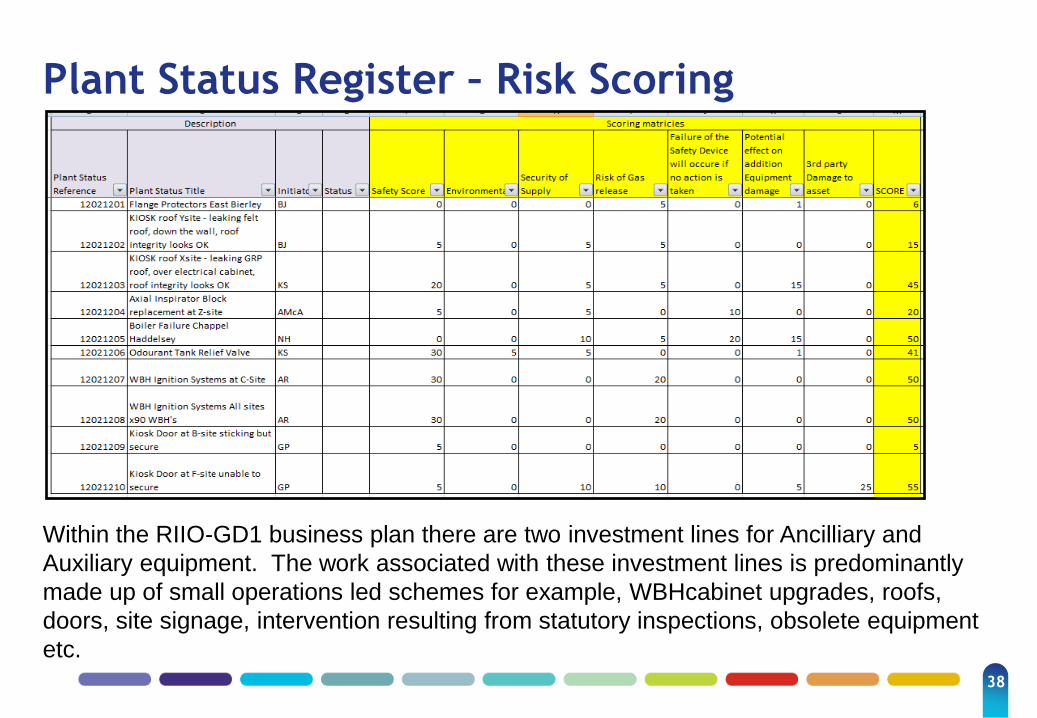
Plant Status Register – Risk Scoring
Within the RIIO-GD1 business plan there are two investment lines for Ancilliary and
Auxiliary equipment. The work associated with these investment lines is predominantly
made up of small operations led schemes for example, WBHcabinet upgrades, roofs,
doors, site signage, intervention resulting from statutory inspections, obsolete equipment
etc.

39
Investment ‘Trade-Off’s’
The Plant Status register will allow the identification of potential ‘problems areas’ which
should be considered as bigger schemes. When these types of schemes are identified
individual business cases will be developed and ‘trades offs’ may have to be made
within the RIIO-GD1 business plan to identify project funding.
In essence this process will form a substantial part of the networks ability to react to
changing operational issues in a clearly defined process which is both auditable and has
a clear methodology for prioritising work. This will ultimately allow NGN to identify
where trade offs for investment have taken place in a systematic process.

40
For consideration
NGN proposes to couple the asset
health category risk profiling with
the plant status register to drive
the optimum investment solutions.

41
Asset Health – The Evolution
42
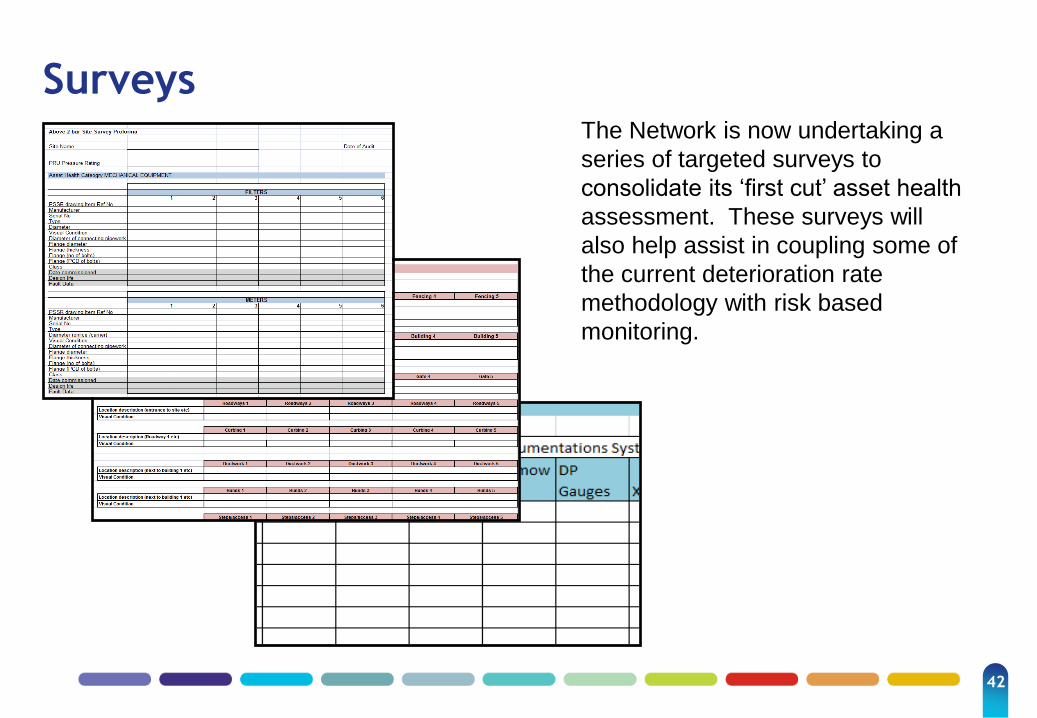
Surveys
The Network is now undertaking a
series of targeted surveys to
consolidate its ‘first cut’ asset health
assessment. These surveys will
also help assist in coupling some of
the current deterioration rate
methodology with risk based
monitoring.

43
Conclusions
• NGN believes asset health measures are a key part of robust asset
management:
- Builds on work NGN has already undertaken; and
- Compliments NGN’s existing and future asset management strategies.
• NGN has made significant progress to developing fully populated measures.
• NGN’s RIIO-GD1 capex forecasts are clearly linked to these measures.
• We aim to have fully populated measures driving investment for all asset
categories before 2017.