kp3 asset integrity programme
DESCRIPTION
asset integrityTRANSCRIPT

A report by the Offshore Division of HSE’s Hazardous Installations Directorate
Health and Safety Executive
Key Programme 3Asset Integrity Programme
1 of ## pages

Health and Safety Executive
Key Programme 3Asset Integrity Programme
2 of 27 pages


Contents
Preface 4
Glossary 4
Part 1 Executive summary 5
Part 2 Introduction 8
Part 3 Analysis of results 10
3.1 Overview of findings 113.1.1 Maintenance management systems 113.1.2 Performance of the maintenance management system 123.1.3 Physical state of plant 143.1.4 Safety critical system testing 16
3.2 Overview of performance according to installation type 183.2.1 Mobiles 183.2.2 FPSOs 193.2.3 Fixed 20
3.3 Discussion of specific template element issues 203.3.1 Maintenance of SCEs/measuring compliance withperformance standards 203.3.2 Backlog 213.3.3 Deferrals 233.3.4 Corrective maintenance 24
3.4 Supplementary factors affecting performance 243.4.1 Company performance and communication 243.4.2 Change management 253.4.3 Impact of project work on maintenance 263.4.4 Verification 26
Part 4 Underlying issues and consideration for improvement 27
Part 5 Good practice 30
Part 6 References 39
Appendix 1 Aims and objectives 41
Appendix 2 Inspection programme background 43
Appendix 3 Results 48
3 of 71 pagesKey Programme 3: Asset Integrity Programme
Health and Safety Executive

Preface
This report has been produced to communicate the results and conclusions of theAsset Integrity Key Programme carried out between 2004 and 2007 by the Healthand Safety Executive’s Offshore Division.
The report is available on the HSE’s Offshore Oil and Gas website athttp://www.hse.gov.uk/offshore/information.htm. The traffic light matrix associatedwith this report can be downloaded separately as an Excel file.
Glossary
ALARP As low as reasonably practicableCAPEX Capital expenditureCEO Chief executive officerCRA Corrosion risk assessmentESDV Emergency shutdown valveFPSO Floating production storage and offloadingFP Floating productionHVAC Heating ventilation and air conditioningHSL Health and Safety LaboratoryICP Independent competent personIMT Inspection management teamsIIWG Installation integrity work groupIVB Independent verifying bodyKP3 Key Programme 3KPI Key performance indicators MAH Major accident hazardsMMS Maintenance management systemNUI Normally unattended installationORA Operational risk assessmentOSD Offshore DivisionPS Performance standardsQRA Quantified risk assessmentRBI Risk based inspection RR Research reportSPC Semi-permanent circularSCE Safety-critical elementTA Technical authorityTR Temporary refugeUKCS UK Continental ShelfUKOOA United Kingdom Offshore Operators Association (now known as
Oil and Gas UK Ltd)WO Work order
4 of 71 pagesKey Programme 3: Asset Integrity Programme
Health and Safety Executive

1 Executive summary
The offshore oil and gas industry on the UK Continental Shelf (UKCS) is a matureproduction area. Much of the offshore infrastructure is at, or has exceeded, itsintended design life. Between 2000 and 2004, HSE’s Offshore Division (OSD) ran amajor programme KP1 aimed at reducing hydrocarbon releases and focusing on theintegrity of process plant. This resulted in a considerable reduction in the number ofmajor and significant hydrocarbon releases. During this time, however, OSD becameincreasingly concerned about an apparent general decline in the condition of fabricand plant on installations and responded with Key Programme 3 (KP3) directedmore widely at asset integrity, and scheduled to run between 2004 and 2007.
Asset Integrity can be defined as the ability of an asset to perform its requiredfunction effectively and efficiently whilst protecting health, safety and theenvironment. Asset integrity management is the means of ensuring that the people,systems, processes and resources that deliver integrity are in place, in use and willperform when required over the whole lifecycle of the asset.
KP3 involved targeted inspections of nearly 100 offshore installations representingabout 40 per cent of the total. These included all types including fixed, mannedand normally unattended installations, floating production (FP), floating productionstorage and offloading (FPSO) vessels and mobile drilling rigs. It involved all ofOSD’s Specialist and Inspection Management Team inspectors and all levels ofmanagement.
Essential for the integrity of any installation are the safety-critical elements (SCEs).These are the parts of an installation and its plant (including computerprogrammes) whose purpose is to prevent, control or mitigate major accidenthazards (MAHs) and the failure of which could cause or contribute substantially to amajor accident. KP3 focused primarily on the maintenance management of SCEs,ie the management systems and processes which should ensure that SCEs wouldbe available when required.
The inspection programme was structured using a template containing 17 elementscovering all aspects of maintenance management, and a number of SCE systemstests. An element covering ‘Physical State of Plant’, was also included allowing theinspection team’s judgement on the general state of the platform to be recorded.The performance, on inspection, of each template element was scored using atraffic light system (explained in Appendix A2.5) which enabled overall installationperformance to be recorded on a matrix. This in turn enabled an overview ofcompany and industry performance to be obtained and examples of good and badpractice clearly identified. It was encouraging to find a number of examples of goodand best practice and these have been shared with the industry and have also beenincluded in the report.
The template and traffic light system has since been adopted by other NationalRegulators. Independent Verification Bodies, employed to verify the performance ofSCEs on the UKCS, have also adopted the template and carried out independentinspections on behalf of dutyholders.
In the light of the findings from KP3, asset integrity will continue to be one of OSD’smain priorities in 2008 and for the foreseeable future.
5 of 71 pagesKey Programme 3: Asset Integrity Programme
Health and Safety Executive

Main findings and lessons learned
The main findings and lessons learned from the Programme are:
Maintenance management systems
n The performance of management systems showed wide variations across theindustry.
n There were often considerable variations in performance between assets in thesame company as well as between companies.
n The state of the plant was often not understood because of the complexity ofcatagorising and recording equipment which was overdue for maintenance orfound to be defective.
n Significant improvement in maintenance systems could be achieved withoutmajor capital expenditure by better planning, improved training and clearstatement of performance standards in testing and maintenance routines.
n There is a poor understanding across the industry of potential impact ofdegraded, non-safety-critical plant and utility systems on safety-criticalelements in the event of a major accident.
n The role of asset integrity and concept of barriers in major hazard risk control isnot well understood.
n The use of operational risk assessments (ORAs) to compensate for degradedSCEs is often not well controlled.
n The technical authority role needs to be strengthened in many companies.n The industry is not effectively sharing good and best practice. This is
particularly evident in that companies were not learning the well-publicisedlessons gained during the life of KP3.
n Cross-organisational learning processes and mechanisms to secure corporatememory need to be improved.
n Companies need to work better with verifiers using their collective skills andknowledge to aid improvement.
n Companies need better key indicators of performance available at the mostsenior management levels to inform decision making and to focus resources.Many management monitoring systems tend to be overly biased tooccupational risk data at the expense of major hazard precursors.
n Many senior managers are not making adequate use of integrity managementdata and are not giving ongoing maintenance sufficient priority.
n There is a need for a common understanding and definition of maintenancebacklog and the use of deferrals.
n Audit and review arrangements are not being used effectively to deliverorganisational learning and continuous improvement.
n The KP3 template provides companies with a framework for improvement.
Overall condition of the infrastructure
n There is wide variation in the condition of hardware integrity across the industrydependent on installation design, CAPEX costs and subsequent investment.
n The main hydrocarbon boundary appears reasonably well controlled butsupporting hydrocarbon infra structure such as valves, pipe supports continuesto be in decline.
n The jacket and primary structural integrity is reasonably well controlled.n In some companies the decline in integrity performance that started following
the low oil price has not been effectively addressed and there appears to be anacceptance of this knowing that the assets are likely to be sold. This declinemay hamper future field development and long-term sustainability.
n Declining standards in hardware is having an adverse impact on morale in theworkforce.
6 of 71 pagesKey Programme 3: Asset Integrity Programme
Health and Safety Executive

n Skills shortages, long lead times for delivery of materials and equipment, bedspace and availability of accommodation vessels are limiting the industry’sability to achieve rapid improvements.
n With suitable prioritisation and leadership real improvements in the condition ofthe infrastructure can be achieved.
n Insufficient full loop testing is carried out on Safety Critical Elements resulting inreduced levels of reliability of SCEs.
Findings on overall industry performance
In broad terms mobile rigs were found more likely to perform better than fixedinstallations. Meanwhile, fixed installations were found more likely to perform betterthan floating production assets.
The performance of installations in a number of elements of the maintenancemanagement system was scored using a traffic light system.
The following aspects of the maintenance management system were found to bemore likely to perform well:
n reporting to senior management;n key company specific indicators of maintenance effectiveness;n communications between onshore and offshore;n supervision (ie confirmation that maintenance tasks have been completed in
accordance with the instructions on the work order, time spent on the plant bysupervisors etc);
n defined life repairs.
The following aspects were found to be more likely to perform badly:
n maintenance of SCEs;n backlog;n deferrals;n measuring compliance with performance standards;n corrective maintenance.
For more than 50 per cent of installations inspected the State of Plant element wasconsidered to be poor. Companies often justified the situation with the claim thatthe plant, fabric and systems were non-safety-critical and a lower level of integritywas justified. This illustrates a lack of understanding in many parts of the industrythat degraded non-safety-critical plant and utility systems can impact on safetycritical elements in the event of a major accident reducing their performance.
The findings arising from the inspections of the specific safety-critical elementscovered by the programme were more encouraging but TR HVAC, TR Doors andDeluge still gave significant cause for concern. These were key issues identified atthe time of Piper Alpha.
Note: Where a ‘red traffic light’ was recorded which meant the inspector had identifieda non-compliance with legislation, a major failing of a system (hardware ormanagement) or partial failure with a history of failure then appropriate action wastaken in line with HSE’s enforcement policy.
7 of 71 pagesKey Programme 3: Asset Integrity Programme
Health and Safety Executive

Underlying issues identified as contributing to poor performance
n Leadership
Senior management set priorities between investment in field development, assetmaintenance and profit on the basis of health, safety and financial risks. Thefindings indicate that the priority given to asset maintenance in the past has beentoo low. Whilst most senior management currently get information on certainaspects of maintenance performance such as backogs and deferrals this providesonly a limited picture on SCE status. To better understand the relative prioritiessenior managers must improve their understanding of the safety and business risksarising from continuing to operate with degraded SCEs and safety-relatedequipment. This may require a simplification of the reporting arrangements forbacklogs, deferrals, corrective maintenance, SCE performance etc and a clearunderstanding of the key performance indicators associated with asset integrity.
n The engineering function
A key element in balancing priorities is to ensure that the engineering function hassufficient authority to put forward the case for major hazard control and act as abackstop against degraded SCEs and safety related equipment and structure. Theinfluence of the engineering function has, in many companies, declined to a worryinglevel. This may be partly attributable to changes in the structure of companies.
n Learning
KP3 has demonstrated that there is considerable variation in the performance ofmanagement systems and delivery of appropriate standards, across the UKCS andoften in the same company. A significant factor in this is an underlying weakness inmany companies’ audit arrangements to ensure compliance with procedures. Theseare not being used effectively to share learning arising from the audits and to promoteand learn best practise within the company and between companies. Improvedarrangements for auditing and monitoring performance are needed in most companies.
Moreover, learning is not just achieved by identifying and sharing best practice, butalso by having process to enable the learning to be embedded.
2 Introduction
Background
The offshore oil and gas industry in the UK Continental Shelf (UKCS) is a matureproduction area. Much of the offshore infrastructure is at, or has exceeded, itsintended design life. During the 1990s low oil prices and initiatives to reduce costsled to a reduction in the offshore workforce. This in turn led to reductions in levelsof maintenance and, as a result, an overall decline in the integrity of fabric,structures, plant and systems. The harsh operating environment on the UKCS hasexacerbated the rate of degradation.
In 2000 HSE’s Offshore Division launched a major programme KP1 aimed atreducing hydrocarbon releases and focusing in particular on process plant. This ranuntil 2004 and resulted in a considerable reduction in the number of major andsignificant hydrocarbon releases. During this time, however, the above factors,together with two fatalities in 2002 arising directly from integrity failure issues,served to reinforce concerns that the risk of major accidents on the UK continental
8 of 71 pagesKey Programme 3: Asset Integrity Programme
Health and Safety Executive

shelf appeared to be rising. HSE therefore decided to initiate Key Programme 3(KP3), Asset Integrity Inspection, which formally commenced in 2004.
The decision was made to focus the programme on the effective management andmaintenance of safety critical elements (SCEs). These are the parts of an installationand its plant (including computer programmes) the purpose of which are to prevent,control or mitigate major accident hazards (MAH) and the failure of which couldcause or contribute substantially to a major accident. The relationship between majorhazards, development of SCEs and their maintenance management is shown below.
The SCEs represent the barriers which prevent, control or mitigate the majoraccident scenarios. The maintenance management strategy must be developed toprovide assurance that they will be available when required, they will operate withthe required reliability and they be able, as necessary, to survive incidents againstwhich they are designed to protect.
The full background to the programme and overall aims and objectives of KP3 aredescribed in detail in the KP3 Handbook and summarised in Appendix 1 and 2.The Handbook3 gives a detailed account of the development of the programme. Itcan be found on the HSE’s offshore oil and gas website address underProgrammes of Work at: http://www.hse.gov.uk/offshore/kp3handbook.pdf.
As part of the overall KP3 Programme, HSE inspectors carried out onshore andoffshore visits to nearly 100 installations and over 33 dutyholders.
The approach taken in KP3 of a coordinated programme of inspections with acommon template has provided significant benefits. These include consistency ofapproach, and the collation and analysis of all reports by a central managementgroup, enabling identification of common areas of good and poor practice acrossthe industry. The most significant outcome has been the ability to report on anindustry wide basis. This has facilitated engagement and been very effective inraising the profile of integrity management across the industry.
The analysis and conclusions are described in Sections 3 and 4 with the descriptionof results contained in Appendix 3. Section 3 describes specific areas whereperformance has been found to be poor and common themes which have led topoor performance. It also identifies practices adopted by dutyholders which led togood performance. Several examples of general good practice are also given which,if adopted more widely, would assist in improving overall industry performance.
9 of 71 pagesKey Programme 3: Asset Integrity Programme
Health and Safety Executive
Major hazardanalysis
MaintenanceManagement:- Availability- Reliability
Are theysuitable?
Identify SCEs:Performance standards
- Availability- Reliability- Functionality- Survivability
Will SCEs work whenrequired?
Are they beingmaintained properly?

This report has been placed on HSE’s offshore oil and gas website4 at:http://www.hse.gov.uk/offshore/.
The results
For each inspection, the individual elements of the inspection template were givena green amber or red traffic light (see Appendix 2). These traffic lights were thentransferred to a matrix from which a picture of overall industry performance couldbe built up (See Appendix 2.8.). The internet version of this report will also includea downloadable version of the numbered traffic light matrix at:http://www.hse.gov.uk/offshore/information.htm.
Individual companies have been provided with the information to be able to identifytheir platforms on this matrix and carry out their own analyses as required.
More detail on the analysis of the KP3 inspection reports and traffic lightdistributions is being prepared in a Health and Safety Laboratory (HSL) report5.When completed, this report will be available under Research Reports (RR) onHSE’s website at: http://www.hse.gov.uk/research/rrhtm/index.htm.
Additional workstreams
In addition to the inspection activities parallel themes of work have been running aspart of the overall programme. Improved communication and raised awareness ofinstallation integrity issues was a key objective of the programme. This wasachieved by participation in industry seminars and conferences and presentationsto industry groups. These have included presentation to the UKOOA Asset IntegritySeminars in 2005 and 2006, regular presentations to the UKOOA Step ChangeLeadership Team, Process Managers Group and Installation Integrity Workgroup.
The latter group was set up by the industry as a direct result of KP3 and involvedover 30 oil companies, contractor organisations and independent verificationbodies. HSE took a full part in this workgroup. The group was set up to work at atactical level to share information and develop tools.
The group developed the Asset Integrity Toolkit, which is a comprehensive guidancedocument describing industry good practice in SCE maintenance management. Thetoolkit also provides a basis for benchmarking performance in the future. The groupalso developed new Key Performance Indicators (KPI) in 20066. The three KPIsdeveloped are now being used to measure industry and company performance.
More recently the industry safety initiative ‘Step Change’ made an important strategicchange in emphasis by forming a high-level influential Asset Integrity LeadershipTeam. The team has set itself a challenging agenda, describing asset integrity as theindustry’s biggest single challenge. HSE and industry will continue to work together tosecure continuing improvement in the management of asset integrity on the UKCS.
3 Analysis of results
This section provides an analysis of the results derived from the KP3 inspectionprogramme given in Appendix 3. The section is structured to give:
10 of 71 pagesKey Programme 3: Asset Integrity Programme
Health and Safety Executive

n an overview of the issues summarised in terms of management systems;hardware, system testing and communications;
n performance differences between mobiles, fixed and FPs;n specific template element issues;n supplementary factors affecting performance.
A view on possible underlying reasons for successes or failures is given in Section 4.
3.1 Overview of findings (Appendix A 3.1.1)
3.1.1 Maintenance management systems (Appendix A3.1.1)
Management systems covers:
n the structure of the maintenance system;n definitions of backlogs, deferrals;n competence to supervise and deliver the maintenance system;n reporting and recording data;n measuring the effectiveness.
Inspection of the maintenance management system has revealed both good andpoor practice.
The structure and diversity of the maintenance management systems foundoffshore is often very complex. Measuring performance is difficult as the definitionsfor backlog, deferrals, overdue maintenance, corrective maintenance, safety-criticaland critical often lack clarity. This makes it time-consuming for senior onshoremanagers to be absolutely clear on the size of the maintenance task at any onetime and maintenance performance which can lead to poor managementprioritisation. Add to this the task of inspection and verification and the levels ofcomplexity rise. The variance in definitions across industry also makes it difficult toproduce detailed performance indicators and benchmarking.
Management prioritisation is made more difficult when the companies have tobalance maintenance requirements and upgrade proposals because there aresevere bed space/resource constraints. More recently this issue has beenincreasingly recognised with tough commercial decisions being taken to enablemaintenance backlogs to be addressed. However, there has been evidence ofinstallations starting shutdowns with several hundred hours of safety-criticalbacklog and having carried out a tieback programme completing the shutdownwith the deficit increased to several thousand hours safety-critical backlog.
A further issue has been that where safety-critical elements are degraded due tooutstanding corrective maintenance there is a need to put contingency plans inplace following operational risk assessments (ORAs). Some installations have beenfound to have very high numbers of ORAs in place at one time. In some casesthese ORAs have little formal approval and onshore management have not beenaware of the scale and scope of the contingency arrangements.
Poor performance in maintenance systems has been further exacerbated by aworkforce that is depleted in experience. The pressures arising from shortages ofcompetent manpower and skills have become severe over recent years. This issueimpacts on all areas of SCE maintenance management. It has been giventhroughout the programme by many dutyholders as a reason for:
n high backlog;n poor adherence to procedures;
11 of 71 pagesKey Programme 3: Asset Integrity Programme
Health and Safety Executive

n general management issues related to high staff turnover such as weak riskassessment and implementation of mitigation measures on SCE failure.
There is also a shortage of materials and pressure on onshore manufacturingfacilities which frequently cannot deliver to realistic timescales.
A key onshore function that is not delivering its intended role is the TechnicalAuthority responsible for evaluating and making engineering and other technicaljudgements on the safety and production implications arising from offshoreoperational issues. This appears to be due to several reasons including lack ofresources, insufficient time spent offshore due to lack of bed space and inability toinfluence senior management. What is clear is that much needs to be done tostrengthen this function and wider consideration needs to be given as to the role ofthe engineering function at senior levels in companies.
There were also many examples where senior onshore management receivedinformation on maintenance effectiveness based solely on indicators such asequipment downtime. Less frequently did senior managers receive analysis reportsshowing compliance of safety-critical element performance with safety caseperformance standards. Maintenance management systems have the functionalityto provide such reports but often the quality of data is poor. The industry assetintegrity team recognised this as an important issue and developed, in conjunctionwith the verifiers, a surrogate measure of major hazard safety, ie the number of‘anomalies’ in tests of safety-critical elements, outstanding at the end of the month.The industry, however, has been slow to supply comprehensive data for thisimportant leading indicator.
3.1.2 Performance of the maintenance management system
The overall inspection matrix clearly identifies areas of good and bad performance.The picture is very mixed with some elements showing improvement, someshowing consistently poor performance and some consistently good performanceover the past three years. There are also differences in performance betweeninstallation types which must be taken into account (see Section 3.2).
Just over 60% of traffic lights assigned were green. The 8% of red traffic lightsassigned are considered to be the most significant issues with some involvingformal enforcement action, usually in the form of an Improvement Notice. Rankingthe assigned traffic light numbers highlights the areas of maintenance managementwhere performance was most consistently good or bad.
Poor performance
The weakest management systems based on numbers of red traffic lights wereMaintenance of SCEs, Backlog, Deferrals, Measuring Compliance withPerformance Standards, and Corrective Maintenance.
Based on the number of ambers assigned, Maintenance Recording was ranked asthe worst performer with Maintenance of SCEs second and Technical Supervision/Competence (ie competence assurance of technicians and supervisors) third.Backlog was ranked fourth and Corrective Maintenance ranked fifth.
The issues related to Measuring Compliance with Performance Standards weresimilar to those of Maintenance of SCEs, ie poor risk assessment on SCE failure,lack of involvement of relevant technical resources in risk assessment andconsideration of mitigation measures and an incomplete understanding of thestatus of SCEs.
12 of 71 pagesKey Programme 3: Asset Integrity Programme
Health and Safety Executive

The reasons for this poor performance are considered most likely to be due to:
n poor understanding of the function of SCEs as barriers to MAHs and ensuringthat maintenance assures their functionality;
n absence of or, poor post maintenance function testing;n failure to carry out risk assessment and implementation of mitigation measures
on failure of SCEs;n poor quality of procedures for deferral management and their implementation;n high levels of corrective maintenance creating an impact on planned
maintenance.
The issues are discussed in greater detail below in Sections 3.4 and 3.5.
Good performance
Overall, twice as many green traffic lights were assigned than amber and 7.5 timesas many green than red. The five best performing areas were:
n reporting to senior management;n key company specific indicators of maintenance effectiveness;n communications between onshore and offshore;n supervision;n defined life repairs.
Preparation of reports on the maintenance system status and reporting to SeniorManagement were consistently the best performing areas. Information derived fromthe maintenance management systems in the majority of cases appeared to beclear and extensive. This must be qualified by the fact that maintenancemanagement systems can contain large amounts of spurious data. This canobscure true levels of backlog and corrective maintenance. In addition, correctivebacklog figures generally do not reflect the level of ongoing breakdown and repairswhich are completed relatively quickly. In some cases maintenance crews operatein a ‘fire fighting’ mode due to high levels of breakdown which are not reported ormade clear to senior management.
Key indicators for maintenance system effectiveness appear to be well recognisedacross the industry and in general companies are collecting and collating this data.
Day-to-day communication between onshore and offshore for technical andmanagement support appears to be working effectively in the majority of cases.This has been facilitated in recent years by conference call facilities which are usedextensively across the industry for daily morning meetings and calls. Generally,communication between offshore supervisors and maintenance technicians, withonshore Technical Authorities (TA) appears to be working well. It is essential thatTAs are given regular access to their installations in order to strengthen theirrelationships with their discipline technicians and ensure familiarity with the plantand systems. Where problems have been found, they relate to the ability of TAs tocarry out offshore visits regularly due to pressure on bed space from project worketc. As a result TA visits lose familiarity with the installation and this underminestheir contribution to risk assessment.
Supervision is generally of a high standard. However, there are problems related totime available for supervisors to spend on the plant. This is reflected in the relativelyhigh number of ambers scored. There are problems on some installations due tostaff turnover but generally offshore supervision appears to be good in most cases.There is, however, a lack of lead technicians on many installations reducing theamount of monitoring of the quality of work for individual disciplines. As a result theonly indicator of performance is an indirect one, the number of post maintenance
13 of 71 pagesKey Programme 3: Asset Integrity Programme
Health and Safety Executive

breakdowns. Also, the detailed planning of all maintenance tasks and MMS datainput checking falls to the Maintenance Supervisor, leaving him less time availablefor high level planning and walkabouts.
Management of defined life repairs was adequate in the majority of cases. Industryhad focused on Defined Life Repairs after the Brent B tragedy which may accountfor the good performance in this respect. Some companies used defined liferepairs for hydrocarbon lines and most were well documented. There were,however, examples of very poor use of the ‘wrap’ type of repair. There can be moreuncertainty in inspecting such repairs making the detection of internal corrosionmore problematical. Some companies have set a policy not to use defined liferepairs for hydrocarbon lines to remove the uncertainty in the level of safety. This isa practical example of best practice and leadership in major hazards.
3.1.3 Physical state of plant (Appendix A3.1.2)
This section of the report discusses the physical state of the plant by giving anoverview and then examples of specific issues and possible underlying reasons forpoor performance.
This template element was based on slightly different criteria to others on thematrix. Whereas management system elements were related solely to SCEs, thiselement was based on the inspector’s opinion of the condition of the installationoverall ie including fabric, structure, safety-critical and non-safety-critical plant andsystems. In the final year of the programme a guidance booklet was produced byOSD Corrosion Specialist Group8. It was intended to assist inspectors in makingjudgements about the condition of plant and improve consistency.
For more than 50 per cent of installations inspected the State of Plant element wasconsidered to be poor. Companies often justified the situation with the claim that theplant, fabric and systems were non-safety-critical and a lower level of integrity wasjustified. This claim disguises a poor understanding across the industry of potentialinteraction of degraded non-safety-critical plant and utility system with safety-criticalelements in the event of a major accident. In addition, as the scale of plant degradationincreases the pressures on resources increases creating tensions between the need toremedy basic fabric problems and carry out repairs critical to integrity.
The human factor effects of the degradation of structures, hand rails, steps,gratings, piping, vessels, nuts and bolts on crew motivation, morale and their rolein preventing major accidents, appears not to be properly understood or, ignoredby senior management. Fabric maintenance is very poor on many platforms,showing inadequate long term planning by the operators for the lifetime ofinstallations, a lack of regard for the working environment of offshore workers andthe risks to the individual of injury. The poor condition of many platforms hasincreased the risks of injury to personnel from dropped objects, hand lacerationsand falling through gratings.
High levels of project work, drilling programmes and ongoing problems related toageing plant reliability have often put severe pressure on bed space. Paintingteams will often be the first to be removed and it is now unusual to find paintersemployed full time on many installations. As a result, painting programmes havediminished or ceased with a corresponding increase in levels of corrosion.
Many companies have not employed inspection engineers permanently offshoreover recent years. When combined with a lack of painting programmes, the
14 of 71 pagesKey Programme 3: Asset Integrity Programme
Health and Safety Executive

subsequent high rates of corrosion have led to rapid deterioration, which has notbeen monitored or addressed. Where inspections have been taking place, a lack ofonshore specialist corrosion resource has at times prevented data being analysed.Consequently coherent corrosion management programmes have not beendeveloped and implemented. The result is a continual increase in inspection andcorrosion problems which the industry is struggling to break through.
On the positive side, where there are defects in primary structure their extent is wellknown and documented and limited to very few installations. However, someinstallations had extensive corrosion to tertiary structure, eg cable tray supports,and some safety-related kit, eg fire doors, gratings and bulkheads. As indicatedabove, this type of corrosion, whilst not of immediate safety concern, sends anundesirable message to the workforce on lack of investment and underminesefforts to engage the workforce in health and safety.
Where Inspection Engineers have been employed offshore on a permanent basis,improved performance has been noted provided that resources are in placeonshore to assess the data, formulate corrosion management plans and implementthem. Many operators have introduced integrity management teams with access tosenior management, who meet regularly to discuss corrosion issues and how theyshould be managed and to prioritise resolution of problems in accordance with theprinciples of risk assessment.
The introduction of corrosion risk assessment (CRA) and risk based inspection(RBI) has offered an opportunity for operators to apply sound corrosion scienceand engineering to the identification of potential problem areas and to targetinspection in an intelligent and defined manner. The corrosion community hasdeveloped the methodology to a high level, providing innovative solutions to acomplex and often stochastic process. The application of computer software tomanage the risks and inspection of thousands of pipe lengths and dozens ofpressure vessels has further improved the process.
Whilst CRA and RBI are good in theory, inspection programmes can fail to deliverthe required performance due to lack of commitment by the company to provideonshore and offshore resources, and to free up bed space on the platform toenable the required number of inspectors to implement the plan.
Use of duplex stainless steels to manage harsh environments has not always gonewell, with numerous incidents of internal and external stress corrosion cracking oftopsides pipework, and hydrogen embrittlement. More rigorous testing and greaterunderstanding of the performance envelope of duplex stainless steels appears tobe required.
An additional factor over recent years has been the process of asset shedding. Theinstallations involved have generally been seen as nearing the end of theirproduction lives or, have fallen below what is considered financially viable in thebusiness models of larger oil companies. As a result, levels of fabric maintenancehad declined, often over several years before the disposal. The new dutyholdershave found that the levels of integrity in relation to inspection and corrosionprevention are low and a significant amount of refurbishment work has beenrequired. In addition, maintenance records have not been as extensive orcomprehensive as expected at handover.
Design life extension is a major issue that also places an extra burden on the levelof refurbishment required. Some companies have begun to address this situationby implementing policies such as spool replacement rather than temporary repair. Itis encouraging to note that there are several major integrity improvementprogrammes ongoing now involving a significant financial commitment. Whilst these
15 of 71 pagesKey Programme 3: Asset Integrity Programme
Health and Safety Executive

are to be commended it should not be forgotten that on their completion they willonly bring back installations to the standards they could and should have beenachieving with effective integrity maintenance arrangements.
3.1.4 Safety critical system testing (Appendix A3.1.3)
A successful test of the performance of the hardware is an indication that themanagement arrangements such as the maintenance system, the competenceassurance programmes, and monitoring programmes are functioning. For example,when HSE carries out a test of the functioning of an HVAC damper there will havebeen maintenance and testing by the duty holder, and as part of the verificationprocess the verifier will have arrangements to ensure that this maintenance andtesting is delivering integrity. HSE tested only a sample of SCEs to ensure thatthere is not excessive overlap with the verifier. Of the 15 potential system tests, ofwhich several were selected on each inspection, TR HVAC, deluge systems, firepumps and ESD were most frequently tested.
TR HVAC Tests
TR HVAC systems were the most extensively safety-critical system tested. Despiteconsiderable publicity at the UKOOA integrity workshops subsequent KP3inspections revealed failures in HVAC dampers.
The Cullen Report into the Piper Alpha disaster10 recommended that a TR shouldbe provided on all offshore installations. The TR is required to have a definedperformance standards related to its survivability, primarily against ingress of smoke(comprised of CO, CO2 and hot soot), flammable and toxic gas.
The ability of the TR to exclude smoke and gas relies heavily upon the integrity of itsouter skin or fabric, the effectiveness of external door sealing and sealing ofpenetrations for cables, services etc. In addition, it is essential that the HVACsystems can be shut down, either immediately following an incident or, automaticallyon detection of smoke or gas at the inlets. HVAC shutdown will involve the closureof fire dampers at the inlet and exhaust ducts and fan shutdown.
The survival time of the TR depends upon the level of air leakage after shutdown. Ifthe HVAC does not shut down effectively, ie fans do not stop and dampers do notclose as required, the performance standard for survival time will not be met.
Companies often test TR HVAC shutdown as a series of discrete tasks, ie:
n initiating fan shutdown and damper closure from the control panel in the fan orcontrol room;
n testing of the inlet smoke and gas detectors without initiating a system trip;n checking inlet and exhaust damper position by observation of indicator lights
on a panel or display screen.
Similar tests have been carried out by verifiers.
OSD inspectors, however, have required that ‘full loop testing’ be performed, ie theapplication of smoke or test-gas to the detectors at the HVAC inlets in order toinitiate an automatic shutdown of the fans and closure of the inlet and exhaustdampers. In addition, the actual position of the inlet and exhaust dampers wasrequired to be confirmed by direct visual observation. It appears that this form oftesting has not been routinely carried out as part of Verification or of themaintenance management arrangements. HVAC system testing often appears tobe carried out piecemeal in order to avoid shutdown and the question must beasked if such deficiencies also exist in the testing of other SCEs and Systems.
16 of 71 pagesKey Programme 3: Asset Integrity Programme
Health and Safety Executive

The results shown in Appendix A3.1.3 shows the distribution of traffic light coloursscored for all 56 of the systems tested. With 64% of tests showing some form offailure there is a picture of inadequate testing and very poor reliability for TR HVACshutdown systems.
The poor performance in this area was raised with industry at an early stage in theinspection programme through the IIWG. As a result, an HSE/Industry sub groupwas set up to address the issue and produce a good practice guide formaintenance and testing. This has been published in the form of an HSE SemiPermanent Circular (SPC)11 and Information Note 2006/112.
One likely cause of the poor performance of HVAC systems is that manyinstallations no longer employ full-time HVAC technicians and rely on their ownmechanical discipline resources or intermittent visits from technicians shared withother platforms. As a result, understanding of the systems by offshore personnelhas declined, levels of maintenance have decreased and test intervals have beenincreased. This is reduction in emphasis on TR HVAC maintenance (and as a result,TR integrity overall) is considered to be a major failing and an indication thatindustry has lost sight of the potential for major loss of life during major hazardincidents. OSD has actively engaged the industry on this matter and has providednew guidance to raise awareness and improve industry testing procedures.
Deluge
Deluge systems are often specified in safety cases as the key mitigation measure inthe event of fire. Of the 20 Deluge system tested 10 had red or amber traffic lightsassigned. This poor performance is a reflection of, in many cases, corrosion ofcarbon steel deluge pipework. Maintenance of many systems is a continuingstruggle against corrosion which blocks pipework and nozzles. The primary reasonfor continuing problems has been a general reluctance to replace corroded delugesystems with low corrosion materials due to the costs involved. Corrosion removaland inhibition techniques are now available but they require a level of monitoringand maintenance themselves.
However, many systems were designed and installed under the requirements SI 611for general area deluge. Since then there has been a significant improvement in theunderstanding of the effects of deluge on oil fires, gas jet fires and explosions.Dutyholders in many cases are attempting to maintain their existing deluge systemswithout having had a design reappraisal in light of current knowledge. Corrodedcarbon steel deluge systems have been replaced with like for like material over gastreatment plant or, general area deluge has been maintained where plant has beendecommissioned or removed. A reappraisal in such areas could potentially allow theremoval of the deluge with a corresponding reduction in the maintenance burden.
In light of current knowledge of major hazard mitigation and the level of design lifeextension being seen across the UKCS a new approach is required to delugesystem performance and maintenance basis. These issues are covered in depth innew guidance on fire and explosion hazards associated with ageing offshore oiland gas platforms9. Maintenance management of deluge systems should bedeveloped in light of this guidance.
Fire pumps
Fire pumps performed generally well with 76% of tests proving successful and 7% oftests giving major failures, ie 2 out of 30 tests. This reflects a general practice across theindustry of frequent testing although any failures should be regarded as of concern. Thefailures found in KP3 generally related to changeover between main and back up pumps
17 of 71 pagesKey Programme 3: Asset Integrity Programme
Health and Safety Executive

where pressure trips or changeover valves failed. The maintenance and testing of theseancillary systems and equipment appears to be an area of weakness. As with the testingof HVAC systems this reflects an inadequacy in testing and verification activities offshore,where systems are tested on a piecemeal basis (mainly for production convenience).Whenever possible, systems should be subject to full loop tests to ensure that all partsof the instrumentation and control are operating as required.
ESDV tests
Results were generally very good with no red traffic lights assigned and 63% greenalthough the number of tests carried out was relatively few.
3.2 Overview of performance according to installation type
Sorting the traffic light matrix by installation type illustrates some differences inperformance.
Mobiles perform markedly better than all other types of installation overManagement System template elements other than for Maintenance of SCEs (theoverall worst performer).
Performance of fixed installations was in a middle category.
Floating production installations (FPs) include semi-submersible rigs converted forproduction and FPSOs. They performed poorly compared to mobile rigs and fixedinstallations.
3.2.1 Mobiles (Appendix A3.3.1)
The 10 mobile installations performed better in all template elements other than formaintenance of SCEs and maintenance basics. For these elements the issues wererelated to:
n lack of a formal maintenance strategy;n poor implementation of maintenance change requests;n weak links between performance standards (PS) and work orders (WO);n differences in function testing requirements between the WOs and PS;n generic performance standards which were not measurable.
Mobiles also performed better than other installation types in relation to physicalstate of plant with only one red traffic light related to cranes.
Two deluge tests failures recorded related to lack of a performance standard for firepump and blocked and miss-aligned nozzles. The HVAC red traffic light related tofailure of damper closure. Both of these failures are common to other installation types.
The stronger overall performance of mobiles can be attributed to the fact that theyoperate under a different regime to FP and fixed installations, namely:
n a less complex and smaller overall installation size;n no major oil and gas processing systems and so in practice present a less
complex maintenance task;n fixed installations have a design life, with no market value at end of life. Mobiles
have a market value for resale and so encourage good upkeep of rigequipment;
n a rig is not continuously drilling, whilst a platform is continuously producing(apart from shutdowns). This gives opportunity window (eg during rig move, or
18 of 71 pagesKey Programme 3: Asset Integrity Programme
Health and Safety Executive

when engaged in coiled tubing or well intervention work) to do maintenancework on equipment not in use at that time;
n client companies will audit mobiles extensively before and during hire periods;n there is a strong commercial incentive to keep rig downtime to a minimum.
Contracts will be negotiated on this basis;n all mobiles will have a close relationship with their classification authority. Rigs
will require regular inspection of structure and equipment (seawater systems,fire fighting, power generation etc) by classification society surveyor to keep therig ‘classed’;
n Mobiles have smaller, leaner management teams and usually a more direct andcloser relationship with senior management than is the case with productioninstallations;
n often the dutyholder employs most of the key crew on a mobile. On a fixedinstallation there may typically be very few direct employees of the dutyholder.
Many of the above factors are not applicable to fixed and FP installations. However,several factors could be transferred with significant benefits to integrityperformance, ie:
n close, detailed management oversight;n greater interaction with senior management, a more intimate knowledge of the
assets they manage and the risks they are subject to;n extensive, frequent integrity-related audits.
The weakest area of performance related to maintenance of SCEs is common toboth FP and fixed installations and are discussed in Section 3.3 below.
3.2.2 Floating production installations (Appendix A3.3.2)
The number of FPs inspected (8) was approximately 9% of the overall number ofinspections carried out and this small sample size should be born in mind wheninterpreting performance. There did not appear to be a significant difference inperformance between FPSOs and floating production platforms (ie semi-submersibles converted for production). FPs performed well in:
n maintenance basics;n communications onshore/offshore;n reporting to senior management;n key indicators of effectiveness.
The five poorest performing areas overall (Section 3.2. above) were reflected in FPsperformance but with a significantly higher proportion of red traffic lights assignedthan for fixed installations and mobiles. In addition both Maintenance SystemEvaluation and Measuring Quality of Maintenance work performed poorly with asignificant of amber lights assigned. This is in contrast to mobiles and fixedinstallations where performance in these areas was relatively good.
Reasons for this relatively poor overall performance may relate to the differentnature of their operation compared to mobiles and mixed installations. FPs havegenerally similar levels of process equipment to fixed installations. However, theiroperation can differ in many ways and can be more complex, Moreover weatherconditions have a much greater effect on their operations. They also have featuresrelated to marine operation which contribute to maintenance managementproblems. For example, some FPSOs rely on thrusters to maintain their orientation,which must be replaced from time to time requiring additional personnel and bedspace. Accommodation provision is often lower on FPSOs than on many fixedinstallations and increasing it for such work may be impractical. While it may bepossible to do the work in-situ, the additional manpower required for the task will
19 of 71 pagesKey Programme 3: Asset Integrity Programme
Health and Safety Executive

affect bed space and hence impact on maintenance. They are also much moreprone to the effect of weather on their operations and provision of flotelaccommodation is impractical.
Issues related to the elements showing poor performance are discussed in Section3.3 below.
3.2.3 Fixed installations (A3.3.3. Fixed installations)
Inspection of fixed installations dominates the overall matrix with areas of poorestperformance common to Mobiles and FPs (although FPs performed poorly acrossmore areas of the matrix). They are, in order of ranking;
i) maintenance of SCEs;ii) backlog;iii) deferrals;iv) review of ICP Recommendations/Verification;v) corrective maintenance.
The poor performance of Review of ICP Recommendations/Verification wasexclusive to fixed installations. Issues here related to the ICP being seen as aninternal inspection tool rather than independent assurance resource, deferral of ICPrelated work orders, poor follow-up of actions and lack of review of ICP findings.
The two worst performing elements in terms of red traffic lights also had a highnumber of amber lights assigned.
Key indicators for Maintenance Effectiveness, Reporting to Senior Management,Communication and Supervision were the best performing areas which arecommon to all installation types.
A detailed discussion on the areas of poor performance is contained in Section 3.3below.
3.3 Specific template element issues (Appendix A3.4)
This section is based on the HSL analysis of inspection reports5. The templateelements discussed below are the most poorly performing in relation to assignation ofred and amber traffic lights throughout the inspection programme. They are commonto both fixed and floating production installations, and to a lesser extent mobiles. Theissues are those occurring most frequently across the inspection reports.
3.3.1 Maintenance of SCEs and measuring compliance with performancestandards
As discussed earlier in the report SCEs underpin major hazard control. It isimperative that the systems for managing SCEs are robust and show high levels ofachievement of performance standards.
The template element maintenance of SCEs consistently ranked with the highestnumber of reds and ambers. This element related to:
n reference to the relevant SCE performance standard in the work order;n a description of tests to be conducted prior to post-maintenance
commissioning;n a demonstration that the relevant performance standards has been met;
20 of 71 pagesKey Programme 3: Asset Integrity Programme
Health and Safety Executive

n recording of test results (eg pass/fail/remedied);n what should be done if the test does not meet the acceptance criteria.
The issues involved were common to measuring compliance with performancestandards.
Common problems related to a lack of any link in the work order to performancestandards and no formal requirement for testing or, high level, generic testrequirements. Acceptance criteria that would enable the maintenance technician toknow whether the performance standard has been met were often absent. As aresult onshore management have been unable to monitor that their SCEs actuallymet their performance standards.
In a number of inspections it was found that performance standards were generic innature without being specific and measurable. Examples of measurable criteria arevalve maximum closure times and maximum allowable leak rates. An example of notbeing specific was where a dutyholder used the same performance standard acrossall their installations and there were differences in the actual systems on theinstallation that required changes to functionality. In these cases and others, thisinformation was poorly used in planned maintenance routines to assure the dutyholder that the SCE functioned as required. Thus the maintenance system did notclearly advise those concerned as to the functionality status of the SCE.
There is evidence that the offshore workforce do not understand link between thesafety case, MAH analysis, identification of SCEs and development of theirperformance standards. The workforce is the last and critical line of defenceagainst the occurrence of many incidents. Their full understanding of the role of theequipment they work with in providing barriers against MAH is therefore essential.
Good practices found in relation to maintenance of SCEs are;
n ensuring a clear link to the performance standard on the work order. This canbe made either by a reference to the PS number or, if on the MMS itself, anelectronic link to the performance standard. The easier it is to access therelevant performance standard the more likely the maintenance technician andsupervisor are to reference it and understand its intended functionalrequirements;
n ensuring that the post-function system tests relate to the performance standardrequirements and are clear and equipment specific (rather than generic). Clearpass/fail acceptance criteria with clarity on what to do if these are not met;
n the offshore workforce in particular, including management, being provided withtraining in what functions SCEs have in preventing, controlling or mitigatingMAH. This relates to hazard control elements rather than QRA aspects andmakes clear the purpose of testing.
3.3.2 Backlog
A simple analysis of the traffic light matrix shows that the backlog element of theinspections was consistently one of the weakest areas of performance. High levelsof both safety- and non-safety-critical backlog and poor backlog managementhave been found across the industry.
The definition of ‘backlog’ has been found to vary across the industry, withincompanies and between onshore and offshore. Typically, it may be defined as,among other things:
n any work past the due by date generated by the MMS or;n any work not completed within say one month of the due date or;
21 of 71 pagesKey Programme 3: Asset Integrity Programme
Health and Safety Executive

n any work not completed within a defined period after say, one month of thedue date. Here the defined period can depend upon the maintenance intervalor the criticality of the equipment.
For this reason the assessment of industry performance in relation to Backlog canbe difficult. There appear to be no specific reasons why backlog should be defineddifferently across the industry. It can result in confusion and, in light of this, somedutyholders have simplified their definitions to try to provide a more understandablemeasure. This is an issue which may be contributing to the apparent lack ofunderstanding of maintenance issues by industry senior management.
Maintenance intervals are initially based on the calculated reliability of the equipmentoften derived from manufacturer's data, which can be conservative. It is possible toover maintain equipment and the resulting burden placed on the maintenancemanagement system and resources can be high. Maintenance intervals can bemodified (ie extended) if justified by historical data. If maintenance intervals are extendedwithout justification the potential for breakdown, or failure on demand, can potentiallyincrease. At some point beyond the designated maintenance point, reliability will beexpected to be lower, indicating reduced integrity. This has been clearly demonstratedin KP3 in the case of TR HVAC maintenance and testing. The level of maintenance hasbeen decreased, resulting in longer test intervals, lower reliability and increased failures.
If maintenance is not carried out at or near the designated interval it will normallyeither be placed on a ‘backlog’ work order list or will go through a deferral processwhich is discussed below. If equipment is in backlog, it does not necessarily meanthat it is not working, or will not be available when required. However, the amountof equipment in backlog can be viewed as an indication of potentially reliability andavailability of the plant and equipment.
For SCEs and systems the level of backlog reflects their effectiveness as barriersagainst major accident hazards events. Assuming the maintenance dates havebeen set appropriately, low backlog is an indicator of high reliability and ultimately,integrity. HSE’s position is that while some non-safety-critical maintenance backlogmay be acceptable, the target for SCE backlog should be zero hours. It isacknowledged that this may not always be fully achievable but a ‘zero’ targetshould be the aim.
KP3 focused on safety-critical maintenance including backlog, both planned andcorrective (breakdown and repair). Safety-critical planned maintenance is oftensubdivided into several categories based on perceived criticality. Non-safety-criticalmaintenance will be recorded as a separate category and generally managed witha lower priority. The interaction of non-safety-critical with safety-critical systems isan area which is not well understood. High, non-safety-critical backlog couldpotentially have an impact on safety-critical systems. While management of non-safety-critical backlog is not directly within the scope of KP3, the high levels foundacross the industry are of concern to HSE.
High levels of SCE backlog and its poor management have been found to have thefollowing common themes:
n lack of sufficient technical resources to complete the maintenance;n lack of bed space to accommodate sufficient resources;n large amounts of spurious data within MMS preventing a clear picture of
backlog to be obtained;n large amounts of spurious data within MMS preventing prioritisation of critical
maintenance tasks;n lack of planning resources onshore and offshore resulting in overload of
offshore management and supervision;
22 of 71 pagesKey Programme 3: Asset Integrity Programme
Health and Safety Executive

n separation of maintenance planning from overall project and resource planning.
The examples given below should be considered as good practice which areevident on installations where maintenance backlog is low:
i) Key performance Indicators (KPIs) supported by high quality data are apowerful tool for giving a focus to backlog reduction.
ii) The use of a target for backlog levels which is moveable (downwards) willassist in providing achievable goals for improvement in backlog management.
iii) Setting of Trigger Points for backlog levels, which when hit, initiatemanagement actions such as;
n providing additional resources; orn some form of campaign maintenance; or n examining current project related workloads which are impinging on planned
safety-critical maintenance; orn assessing the effects projects may have in terms of taking up bed space,
drawing resources away from maintenance, giving an additional load tomaintenance teams in equipment refurbishment and repairs.
iv) Provision of dedicated planning resources both onshore and offshore whichinteract closely with all areas of the operation. The planners should be tasked withintegrating maintenance planning with operational issues, equipment shutdowns(eg rotating equipment refurbishment) and provision of all associated resources(eg scaffolders, riggers, high line work etc.) In this way pinch points in the planningin relation to resources, equipment and beds space can be planned out.
v) a MMS which has been cleansed of spurious maintenance data, allowing aclear prioritisation of maintenance tasks,
3.3.3 Deferrals
Deferral of maintenance and testing is needed when management system has notprovided resources for the task. The deferral process is recognition that there ispotential for degradation of the SCE. It should provide the means to compensatefor the degradation and the potential increase in risk. The deferral process is anadditional demand on resources and an unnecessary cost to the company.Therefore management should aim to eliminate the factors that give rise todeferrals.
Deferred maintenance is an area where performance was found to be consistentlyweak. Issues concerned unclear processes and procedures for deciding whetherand when to defer maintenance. This situation is exacerbated where backlogdefinition is complicated and not well understood.
Adequate deferral procedures existed in some cases but were not being followed,procedures were not understood, could not be explained by TAs or managementand an absence of audit failed to identify deficiencies. Deferral records were foundto be inadequate with some deferred equipment having been ‘lost’ in the MMSrecords for some considerable time.
Due to weak deferral procedures decisions to defer maintenance were often basedon poor assessment with inadequate involvement of management and TAs, poorassessment risk and mitigation measures where appropriate and infrequentinspection of deferred equipment. In several inspections crews had been operatingwith draft procedures which had never been finalised or fully approved.
23 of 71 pagesKey Programme 3: Asset Integrity Programme
Health and Safety Executive

Lack of available resources and bed space, together with pressure to continueproduction, were cited as reasons for deferral. In one case it appeared that deferralwas being used to reduce backlog figures with no clear justification forimplementation of the procedure.
Where deferral appeared to be operating appropriately, procedures were clear withstrong involvement of TAs and management both onshore and offshore. The riskassessment process was strong and implemented fully. ICPs were informed andinspection frequencies for the equipment were increased. Oversight bymanagement was essential with auditing of deferred equipment records andapprovals in place.
3.3.4 Corrective maintenance
Corrective maintenance is frequently reported in relation to ‘corrective backlog’, iebreakdown and repair work that cannot be completed within a specified timeperiod. The definition of corrective backlog may again be complicated by complexbacklog definitions. Reporting only corrective backlog will give a distorted picture ofplant reliability as it will not include information on day-to-day breakdown and repairactivities and the consequent level of resource required to keep the plant operating.The reporting of this day-to-day work can be affected by poor recording of workactivities by maintenance personnel offshore.
High levels of breakdown and insufficient resources were frequently cited as issueswhich impacted heavily on planned maintenance. A lack of a strong planningresource led to ‘fire fighting’ situations with subsequent stress for supervisors andtechnicians.
An absence of formal procedures laying down requirements for consultation withTAs, implementation of risk assessment and mitigation measures/additional barriersand management approval was an additional issue.
3.4 Supplementary factors affecting performance
3.4.1 Company performance and communication (Appendix A3.5)
OSD carried out inspections in teams of three or four assigning traffic lights byteam consensus. In addition, peer review external to the team was applied by HSEto each report, to ensure objectivity in reporting.
Sorting the matrix in relation to the number of red and amber traffic lights assignedgives a broad indication of installation performance. However, while poorperformers and good performers are clear, there is insufficient precision todiscriminate between adjacent installations in the ranking. The reason being thatwhile the assignation of red traffic lights is clear (a major failing of system hardwareor management or partial failure with a history of failure), amber traffic lights couldrange from a little poorer than green (tested or inspected but with no significantissues found) to just better then red. This spread in the significance of amber trafficlights means that the location of an installation on the matrix should be taken as abroad indication of good, mid-range or poor performance.
Variation in maintenance management performance between companies and withinindividual companies is wide. This applies to all company types, from multi-nationals, to lean companies with only one or two installations, to drillingcompanies. However, the evidence is less clear for drilling companies as only singleinstallations were inspected in the majority of cases.
24 of 71 pagesKey Programme 3: Asset Integrity Programme
Health and Safety Executive

The reasons for the variations are acknowledged to be complex depending upon awide range of factors including design, original equipment specification, age,process complexity and size. Analysis shows that there is no simple relationshipbetween variation in maintenance performance between assets and any of thesefactors. Original equipment specification can be a factor in relation to reliability andobsolescence with variations in performance between platforms of similar age. Agecan be a factor where the installations have been allowed to degrade significantly,but some older installations have performed well.
Where installations are performing well the good practices involved, which are notdependent on installation design, are not, in many cases, being shared. This hasbeen found not only with respect to the sharing of good practice and solutionsbetween companies but also within individual companies.
Large companies may have ‘asset groups’ operating in different parts of the UKCSwith their own management teams and systems. While operating under an overallmanagement umbrella, they often work in relative isolation in relation to systems ofwork, procedures and resourcing. Asset or field mangers often have autonomy andthe authority to give their interpretation of federal standards and systems. This isaccepted to be appropriate and healthy in that it can encourage innovation andimprovement. However, without an overarching system of audit and review, poorpractices can persist and, importantly, good practices will not be shared across theorganisation. For example, inspectors found different asset groups within largecompanies had different definitions of backlog and definitions of safety-criticalequipment. These have had a significant effect, between platforms, on the levels ofsafety-critical maintenance work orders generated and subsequent levels ofbacklog.
A further complication relates to the level of asset disposal over recent years. KP3inevitably provides a snapshot of performance. As a result, where an acquisitivecompany has taken over a range of ageing assets from different operators, thevariation in performance may in part be due to differences in performance of theoriginal operator. Rationalisation of maintenance management systems, practicesand performance across asset groups can take some time to effect.
3.4.2 Change management
Sharing of good practice within companies has been observed during theprogramme resulting in a corresponding improvement in performance acrossassets. However, sustained improvement can be very susceptible to changes inorganisational structure and personnel movement.
For example, a dutyholder took onboard recommendations arising from a first KP3inspection and transferred these across its installations. These related to:
n clarification of backlog definition and understanding between onshore andoffshore;
n rationalisation of data in the MMS to give a true picture of SCE backlog andallow prioritisation of maintenance tasks;
n clarification and strengthening of the risk assessment process for correctivesand deferrals; and
n clarification of lines of responsibilities on and offshore for decision making withrespect to risk assessment and identification of mitigation measures.
A second KP3 inspection on another of their installations showed a markedimprovement. Procedures had been improved, responsibilities clarified and themaintenance system database had been cleansed and rationalised. As a result
25 of 71 pagesKey Programme 3: Asset Integrity Programme
Health and Safety Executive

backlog was being managed downwards and effectiveness of their MMS hadimproved. The lessons learned had been implemented across their other platformswith corresponding improvement, demonstrating good communication, transfer ofknowledge and learning.
However, following the second inspection the company went through a change infacilities support contractor which involved significant changes in the managementstructure. At the same time personnel changes occurred and there was an overallloss of knowledge and experience. As a result the performance in the third KP3inspection dropped and the gains made earlier were lost. In particular, the fieldbacklog appeared to be increasing and implementation of a new deferralmanagement process had been affected. The reasons for the decline inperformance were attributed to changes in management structure and personnelaffecting the efficient implementation of systems and procedures. Whilemanagement were aware of the issues and were addressing them, the progressmade by the company had been put back by at least a year.
3.4.3 Impact of project work on maintenance
Project work for well or field development usually has a higher onshoremanagement profile than routine maintenance work and as a result receives ahigher priority. This priority is realised in the allocation of bedspace, specialistresources etc, therefore having a significant impact on maintenance of safety-critical elements. The situation can be greatly exacerbated if project overrunsoccur.
3.4.4 Verification
Independent verification bodies have valued KP3 and stated that it hasstrengthened their position by raising the profile of integrity management of SCEs.The industry has employed several verification bodies to carry out their own internalKP3 inspections using HSE’s templates and traffic light system. Some dutyholdershave shared this information with HSE, thus demonstrating a proactive approachand a readiness to rectify deficiencies.
An example of one of the stronger good practices in the verification area is therobust management of the ICP findings to close out within a short time period. Forproblems with hardware on the platform the platform personnel tried and in manycases succeeded to clear them before the ICP left so that he could witness theresolution of the problem. Those ICP findings that required onshore personnel inputor for them to resolve were again actively managed with timescales and seniormanagement involvement to clear quickly.
One further area of concern to HSE has been the continued and extensive poorperformance of TR HVAC System testing. This has raised doubts about the waythe verification system is specified and the depth and quality of testing.
26 of 71 pagesKey Programme 3: Asset Integrity Programme
Health and Safety Executive

4 Possible underlying issues and considerationfor improvement
This chapter outlines possible underlying issues and common failures and identifieslessons the industry should be learning, or is already in the process of tackling.
Leadership
Leadership is a key function in improving understanding, simplification, challengeand learning in major hazard control and ultimately in performance. During theprogramme a number of issues have been identified which are capable of beingaddressed by improved leadership at senior level. The complexity of manymaintenance systems and the quality of maintenance data is hindering the ability ofmanagement to gain a clear understanding of the state of the plant and equipment.This report indicates that the number of red and amber traffic lights assigned toinstallations during the each year of the programme did not show any downwardtrend, ie there was no significant overall learning in maintenance managementsystems during the project (section 3.1.1).
The physical condition of installations (section 3.3.3) has been of concern throughoutthe programme. Although UKOOA had driven the issue of integrity forward centrally.this has been largely at tactical/practitioner level through specific work groups. Therehad been no senior management driven central approach until the first quarter of2007. Moreover, industry senior management appears to have been slow to give fullsupport for and begin using the newly developed industry performance indicators.
There is no doubt that senior managers were aware of HSE’s concerns on assetintegrity and KP3 has shown that they were receiving performance data on issuessuch as backlogs. However, many managers have failed to improve standards byprioritising resources for maintenance work at the expense of other projects. TheIndustry Asset Integrity Leadership team has concluded that the industry needs toimprove senior management understanding in this area.
HSE believes that there are clear safety and business risks associated with poorintegrity. Consequently, the lack of progress in asset integrity must be as a result ofsenior management’s level of understanding or appreciation of the major hazardrisk control model described in section 2. The level of understanding must extendto the detail of their maintenance management systems and key performanceindicators associated. Industry leaders have agreed that asset integrity is a priorityand perhaps increased understanding of major hazard control will lead to morepractical leadership. This issue is reflected in the Baker Report into the Texas CityRefinery incident7. The impact on safety of long-term strategy and decision makingby senior and executive mangers depends on their understanding and awarenessof the risks posed by their operations (especially major hazard risks).
The industry Asset Integrity team has taken the step to try to develop better leadingindicators for integrity. The industry should now take the bold step of setting anindustry objective using a common definition of backlog and strive to ensure allmaintenance is completed before the due date or report total hours outstanding.
Industry could also take the positive step of embracing the performance indicatorthat uses Verifier anomalies as a surrogate measure of major hazard safety. There isa wealth of information to be obtained by extending this approach to report andcategorise all anomalies. Currently a rather limited approach has been taken.
27 of 71 pagesKey Programme 3: Asset Integrity Programme
Health and Safety Executive

Understanding the major hazard control loop
SCEs are the major barriers to the realisation of MAHs. SCEs are developed fromthe safety case by analysing the major hazard scenarios, identifying the importantcontrols and developing performance standards. The evidence from the programmeis that this is not well appreciated or understood at all levels in the company. Thewhole workforce from offshore technician to CEO needs to understand and committo ensuring that this major hazard control loop is applied rigorously. Action is neededto address the lack of understanding and commitment at all levels.
The prominence of the engineering function
Data from hardware and system tests provide a very good indicator of theeffectiveness of the whole maintenance systems. It can be used to aidmaintenance planning and improve plant efficiency improving ‘up time’ as well asmajor hazard safety. All available evidence indicates that an efficient, productiveand well managed business will also have high safety performance. This data isonly of value if it is of good quality and there is the capability for good onshoreanalysis. The amount of data in maintenance management systems is extensive.The quality is often inconsistent, particularly in recording the ‘as found’ conditionrather than the ‘maintained’ condition and in reporting the cause of failure. Theseweaknesses significantly undermine the primary objectives for improving companysafety and production performance. It is perhaps significant that there was anincrease in unplanned downtime for the industry as a whole during in the last yearfor which performance results were available.
The owner of this data is the engineering function. It is, therefore, probably notcoincidental that in the last 10 years or so the prominence of the engineering functionhas declined both offshore (offshore maintenance manager) and onshore (chiefengineer). Currently the technical authority function is under pressure often resortingto fire fighting rather than its strategic role to provide expertise and judgement on keyoperational engineering issues. The voice for the engineering function which canprovide the backstop on asset integrity lacks the appropriate authority in manycompanies and the industry needs to reflect on how this can be addressed.
Skill shortage
Skills shortages in engineering disciplines is without doubt a worldwide problemaffecting the whole spectrum of industries. However, the oil industry skills shortageis, in part, a problem of the industry’s own making. As a result of low oil prices inthe 1990s industry shed significant numbers of onshore and offshore workers withthe resultant loss of skills and experience. Resourcing and staffing of themaintenance functions frequently was a target for cost reduction which hasresulted in a lack of confidence that the industry is a reliable long-term careerprospect for skilled workers. The situation has been exacerbated by the generalreduction in skilled labour as the declining onshore heavy industries, which haveprovided ready sources of skilled labour in the past, are no longer available.
The industry has taken action over recent years and put various schemes in place toattract more people into the industry, eg graduate schemes, innovative web-basedsystems and the excellent modern apprenticeship scheme. HSE is concerned thatthese schemes may not meet industry demands and there is increasing anxiety inthe offshore workforce about competence, skills and lack of experience.
There is some good practice of contracting companies taking on and training staffbut the financial and contractual arrangement can make it difficult to provide
28 of 71 pagesKey Programme 3: Asset Integrity Programme
Health and Safety Executive

offshore training. It is essential that the industry works cooperatively to provide theskills, training and competences required to enable the workforce to be capable ofdelivering the standards of integrity required in a high-hazard industry.
Investment
The low oil price in the 1990s impacted on investment in several ways. CostReduction In the New Era (CRINE) saw capital investment in design cut to aminimum to cope with the relative cost of lifting oil and the oil price. One result wasthat the size of topsides for installations was minimised and CAPEX reduced oftenat the expense of future OPEX. In addition, investment in maintenance and crewson existing plant was minimised based on reduced economic life expectancy ofinstallations. However, the oil and gas high prices in the next decade has seen theeconomic life expectancy of many installations extended by between 10 and 25years. The increase in activities has resulted in greater demand for skilled humanresources and a shortage in availability of accommodation vessels to supportmaintenance and investment. The reduced provisions for accommodation oninstallations which was a feature of CRINE developments has further exacerbatedthe difficulties of delivering both increased levels of maintenance on aginginstallations and the necessary upgrades to maximise output. Those companiesthat had the foresight to take the longer-term view in the 90s and continued withmaintenance and resisted short-term solutions are currently benefiting from thosedecisions.
Some companies looked at the economic life expectancy during this period andset a strategy to sell assets. In many cases this resulted in short-termism inmaintenance planning impacting on overall condition of the plant in particular thefabric. This short-term approach also fails to recognise that some assets have astrategic use that may be of value to others in future tiebacks. This raises bothsafety and sustainability questions as to whether there is sufficient investment inmaintenance of key installation to provide long-term sustainability.
Learning and communication
It is clear that there are some examples of good communication between individualassets but overall across the industry there is considerable room for improvementin information sharing and consistency of implementation of management systemsbetween assets and between companies
Learning is achieved by identifying and sharing best practice, and by havingprocess to enable the learning to be embedded,
Companies audit and review arrangements provide mechanisms to identify goodand bad performance and share learning. Current work in OSD has confirmed thatcompany audit arrangements in many cases are not being used effectively to learnabout performance and share these learnings. Without the intelligence tounderstand how they are performing, companies cannot address poorperformance and share good performance. The industry needs to consider howaudit can be used more effectively.
It is unlikely that improved learning can be successful driven from an individualinstallation and needs to be company driven. Trade associations play an importantrole in facilitating learning but companies must provide the drive and the process toenable learning to be embedded. It is probably not coincidental that the industryhas over the last decade dismantled many of the technical work groups thatcontributed to the initial learning on major hazard control. HSE’s phase 2 project on
29 of 71 pagesPublished by the Health and Safety Executive 02/07
Health and Safety Executive

asset integrity is examining company’s internal audit arrangements and their roleand effectiveness in facilitating cross-organisational learning.
5 Good practice
Although the programme revealed that throughout the industry there wasconsiderable room for improvement, there were examples of good practice foundin many companies. To capture these and aid cross-industry learning, goodpractice observed during inspections was recorded and a list is provided on theHSE website at:http://www.hse.gov.uk/offshore/goodpracticelist.pdf.
Several of the ‘stronger’ good practices that will assist in achieving effectivemaintenance management are described below.
Some of the good practices listed may be considered merely normal practice bymany operators. However, standards are not uniform across the industry. Whatmight be considered weaker examples of good practice have also been includedas they are not universally applied. Information and good practice sharing, bothbetween companies and within them, has been found to be poor.
The good practices observed tend to fall into specific categories. These are listedin Table 1 below along with the practices that lie within them.
30 of 71 pagesKey Programme 3: Asset Integrity Programme
Health and Safety Executive

CAT
EG
OR
YIS
SU
ES
GO
OD
PR
AC
TIC
E F
OU
ND
MM
S d
ata
qual
ityM
any
MM
S h
ave
larg
e am
ount
s of
spu
rious
dat
a as
a r
esul
t of
‘dau
ghte
r’ w
ork
orde
rs, w
ork
com
plet
ed b
ut n
ot s
igne
d of
f, in
adeq
uate
or
inap
prop
riate
clas
sific
atio
n of
saf
ety-
and
non
-saf
ety-
criti
cal e
quip
men
t.
Ded
icat
ed re
sour
ces
wer
e pr
ovid
ed to
cle
an d
ata
in th
e M
MS
and
ens
ure
clas
sific
atio
n of
SC
Es/n
on-S
CE
as a
ppro
pria
te. W
here
MM
S d
ata
has
been
cle
anse
dba
cklo
g fig
ures
hav
e be
en s
een
to re
duce
as
a re
sult
of th
e re
mov
al o
f spu
rious
wor
kor
ders
. Prio
ritis
atio
n of
wor
k, fo
rwar
d pl
anni
ng o
f res
ourc
es m
aint
enan
ce ta
sks
and
man
agin
g ba
cklo
g do
wnw
ards
bec
omes
pos
sibl
e.
Sup
ervi
sion
The
issu
e of
sup
ervi
sion
falls
into
thr
ee a
reas
:
nth
e re
gula
r pr
esen
ce o
f offs
hore
man
agem
ent
on t
he p
lant
is v
ery
impo
rtan
t; n
regu
lar
visi
ts b
y on
shor
e se
nior
man
agem
ent
with
an
agen
da t
o ch
alle
nge
maj
or h
azar
d co
ntro
l;n
regu
lar
visi
ts b
y TA
s of
fsho
re.
Sen
ior
and
exec
utiv
e m
anag
emen
t m
akin
g re
gula
r vi
sits
to
all o
f the
ir as
sets
,co
mm
unic
atin
g co
mpa
ny s
trat
egie
s an
d pl
ans,
list
enin
g to
issu
es d
irect
ly fr
om t
hew
orkf
orce
, gai
ning
an
unde
rsta
ndin
g of
pro
blem
s w
ith S
CE
s, t
estin
g an
d ve
rific
atio
nle
ads
to im
prov
ed p
erfo
rman
ce.
Tech
nica
l aut
horit
ies
visi
ting
thei
r in
stal
latio
ns o
n a
regu
lar
basi
s. T
hey
get
invo
lved
in t
he w
ork
goin
g on
on
the
plan
t, be
com
e kn
own
to t
he s
uper
viso
rs a
ndte
chni
cian
s, im
prov
e co
mm
unic
atio
ns, t
heir
know
ledg
e of
the
pla
nt a
nd s
yste
ms
for
whi
ch t
hey
are
resp
onsi
ble
and
thei
r ef
fect
iven
ess
in s
olvi
ng p
robl
ems
and
invo
lvem
ent
in in
cide
nt m
anag
emen
t.
Com
mun
icat
ion
of s
tatu
sof
SC
Es/
mai
nten
ance
syst
em d
ata
and
repo
rtin
g
Com
mun
icat
ion
of m
aint
enan
ce s
yste
m d
ata
to t
he o
ffsho
re w
orkf
orce
. The
grea
test
dem
otiv
ator
is t
o fe
el t
hat
you
are
wor
king
in a
vac
uum
with
no
know
ledg
e or
und
erst
andi
ng o
f how
goo
d or
bad
thi
ngs
are.
Pro
visi
on o
f ‘un
ders
tand
able
’ dat
a on
mai
nten
ance
sys
tem
and
SC
E st
atus
to th
eof
fsho
re w
orkf
orce
. Thi
s ca
n in
clud
e:n
grap
hs s
how
ing
back
log
trend
s, le
vels
of b
reak
dow
ns a
nd c
orre
ctiv
es e
tc a
ndpr
ogre
ss t
owar
ds t
arge
ts;
nba
r ch
arts
sho
win
g ba
cklo
g, b
reak
dow
ns e
tc b
y di
scip
line
area
;n
stat
us o
f SC
Es,
ie im
paire
d w
ith c
urre
nt m
itiga
tion
mea
sure
s in
pla
ce;
nin
form
atio
n gi
ving
rea
sons
for
poor
per
form
ance
.
Tab
le 1
:Goo
d pr
actic
es
31 of 71 pagesKey Programme 3: Asset Integrity Programme

CAT
EG
OR
YIS
SU
ES
GO
OD
PR
AC
TIC
E F
OU
ND
Rep
ortin
gR
epor
ting
the
stat
us o
f the
mai
nten
ance
sys
tem
effe
ctiv
enes
s an
d S
CE
inte
grity
. S
enio
r man
agem
ent e
nsur
eth
at th
e re
ports
pro
vide
d in
clud
e th
e ap
prop
riate
met
rics
togi
ve a
full
pict
ure
of m
aint
enan
ce s
yste
m s
tatu
s, e
g da
ta o
n no
t onl
y co
rrect
ive
wor
k in
back
log,
but
the
leve
l of d
ay to
day
bre
akdo
wns
whi
ch im
pact
on
plan
ned
mai
nten
ance
or d
ata
on p
ipew
ork
insp
ectio
n pr
ogra
mm
es a
nd c
orro
sion
man
agem
ent s
tatu
s. T
his
impr
oves
und
erst
andi
ng o
f the
sys
tem
per
form
ance
.
Reg
ular
aud
its o
f int
egrit
y m
anag
emen
t sy
stem
s in
clud
ing
SC
E m
aint
enan
cem
anag
emen
t w
ill as
sist
in e
nsur
ing
that
the
rep
ortin
g sy
stem
s ar
e ef
fect
ive.
Ana
lysi
s of
ava
ilabi
lity
Rel
ativ
ely
few
dut
yhol
ders
mea
sure
ava
ilabi
lity
and
ensu
re t
hat
the
syst
ems
are
mee
ting
thei
r pe
rform
ance
sta
ndar
ds. T
he a
naly
sis
of a
vaila
bilit
ies
is im
port
ant
inth
at m
aint
enan
ce in
terv
als
are
base
d on
ava
ilabi
lity
and
relia
bilit
y da
ta fo
r th
eeq
uipm
ent.
Whe
rem
aint
enan
ce b
ackl
og is
hig
h th
is is
an
indi
catio
n th
at t
he o
vera
llre
liabi
lity
of S
CE
s m
ay b
e lo
wer
tha
n re
quire
d.
Ava
ilabi
litie
s ca
n be
mea
sure
d by
a o
nce
year
ly, m
onth
ly, w
eekl
y or
dai
ly o
n lin
ean
alys
is. I
n or
der
to a
chie
ve a
n on
line
anal
ysis
, rat
her
than
by
revi
ewin
g lo
ng t
ext
onw
ork
orde
rs, a
faul
t co
de s
yste
m is
pro
vide
d. S
uch
anal
ysis
has
bee
n sh
own
to b
epr
actic
able
and
sho
uld
be t
he a
im o
f all
SC
E a
ssur
ance
str
ateg
ies
(see
exa
mpl
esbe
low
). M
easu
ring
avai
labi
litie
s w
ill no
t on
ly a
ssur
eth
e pe
rform
ance
of t
hese
syst
ems
but
it w
ill as
sist
in id
entif
ying
spe
cific
com
pone
nts
and
equi
pmen
t th
at a
refa
iling.
Ris
k as
sess
men
t an
dm
itiga
tion
mea
sure
sLa
ck o
r ris
k as
sess
men
t an
d fo
rmal
aut
horit
y fo
r co
ntin
ued
oper
atio
n w
hen
SC
Es
are
foun
d to
be
degr
aded
Afo
rmal
, rob
ust m
anag
emen
t pro
cedu
re e
xist
s w
hich
out
lines
the
risk
asse
ssm
ent
proc
ess,
leve
ls o
f aut
horit
y an
d te
chni
cal e
xper
tise
requ
ired
to b
e in
volv
ed a
nd re
view
requ
irem
ents
. The
risk
ass
essm
ent i
s ba
sed
on th
e ro
le th
at th
e S
CE
play
s in
pro
vidi
ng a
barri
er a
gain
st M
AH
s an
d pr
ovid
es a
sou
nd b
asis
for t
he im
plem
enta
tion
of a
ny m
itigat
ion
mea
sure
s or
add
itiona
l bar
riers
requ
ired.
A re
gist
er o
f the
ass
essm
ents
is m
aint
aine
d an
dau
dite
d on
a re
gula
r bas
is.
It is
pos
sibl
e th
at in
divi
dual
ope
ratio
nal r
isk
asse
ssm
ents
may
be
adeq
uate
but
ove
rall,
the
com
bine
d ris
ks p
osed
may
be
too
high
. It i
s es
sent
ial t
hat a
pro
cess
is in
pla
ce to
carry
out
per
iodi
c ov
eral
l rev
iew
s. It
is e
ssen
tial t
hat a
n ap
prop
riate
leve
l of e
xper
tise
isin
clud
ed in
the
proc
ess
and
that
the
resp
onsi
bilit
y do
es n
ot a
lway
s lie
sol
ely
with
offs
hore
man
agem
ent.
The
part
play
ed b
y th
e fa
iled
SC
E as
a b
arrie
r to
a m
ajor
haz
ard
inci
dent
,w
ith re
fere
nce
to th
e m
ajor
haz
ard
anal
ysis
in th
e sa
fety
cas
e, s
houl
d be
refe
renc
ed if
nece
ssar
y.
32 of 71 pagesKey Programme 3: Asset Integrity Programme

CAT
EG
OR
YIS
SU
ES
GO
OD
PR
AC
TIC
E F
OU
ND
Pla
nnin
gTh
e ab
ility
to p
lan
is u
nder
min
ed b
y co
mpl
exiti
es in
the
leve
ls o
f bre
akdo
wns
,de
ferr
als,
pro
ject
wor
k re
quiri
ng r
esou
rces
, bed
spa
ce a
nd m
anpo
wer
ava
ilabi
lity.
Com
pute
rised
mai
nten
ance
man
agem
ent
syst
ems
(MM
S) c
an b
e sl
ow t
o op
erat
e,ha
ve p
oor
func
tiona
lity,
con
tain
hig
h le
vels
of s
purio
us d
ata
and
be p
oorly
unde
rsto
od b
y th
e m
aint
enan
ce p
erso
nnel
.
Whe
re m
aint
enan
ce b
ackl
og is
low
or b
eing
driv
en d
own,
a c
omm
on c
hara
cter
istic
isth
e ex
iste
nce
of a
stro
ng p
lann
ing
func
tion.
Thi
s w
ill in
clud
e bo
th o
nsho
re a
nd o
ffsho
rere
sour
ces
who
not
onl
y ex
tract
mai
nten
ance
sch
edul
es fr
om th
e M
MS
but
cat
egor
ise
and
prio
ritis
e it.
The
y de
velo
p on
goin
g pl
ans
(7 d
ay, 1
4 da
y, 1
mon
th, 3
mon
th) w
hich
incl
udes
con
side
ratio
n of
pro
ject
wor
k, d
rillin
g pr
ogra
mm
es, p
erip
hera
l res
ourc
ere
quire
men
ts (e
g sc
affo
ldin
g, ro
pe a
cces
s), b
ed a
vaila
bilit
y, m
anpo
wer
leve
ls. T
hese
plan
s ar
e th
en im
plem
ente
d by
the
offs
hore
man
agem
ent a
nd p
robl
ems/
pinc
h po
ints
can
be p
rope
rly m
anag
ed. T
his
also
has
the
effe
ct o
f im
prov
ing
the
qual
ity o
f rep
ortin
gan
d ov
eral
l ins
talla
tion
man
agem
ent o
nsho
re.
The
offs
hore
pla
nnin
g ro
le is
impo
rtant
in e
nsur
ing
coor
dina
tion
with
bot
h op
erat
ions
,pr
ojec
ts a
nd m
aint
enan
ce m
anag
emen
t. Th
e pl
anni
ng fu
nctio
n is
als
o es
sent
ial i
nas
sist
ing
in m
anag
ing
corre
ctiv
e w
ork
and
redu
cing
its
impa
ct o
n pl
anne
d m
aint
enan
ce.
Insp
ectio
nA
s in
stal
latio
ns a
ge, t
he le
vel a
nd r
ate
of d
egra
datio
n of
pla
nt, s
truc
ture
s an
d fa
bric
incr
ease
s ra
pidl
y. In
spec
tion
prog
ram
mes
can
qui
ckly
fall
behi
nd a
nd r
educ
ing
the
back
log
in t
his
resp
ect
will
beco
me
diffi
cult.
In a
dditi
on, t
he le
vels
of d
ata
prod
uced
can
be h
igh
and
if no
t m
anag
ed c
aref
ully
to
ensu
re c
ontin
uity
, ons
hore
res
ourc
esca
n be
ove
rwhe
lmed
to
the
poin
t w
here
the
y ca
nnot
kee
p up
.
The
pres
ence
of i
nspe
ctio
n en
gine
ers
back
-to-
back
has
bee
n se
en to
con
trib
ute
toef
fect
ive
corr
osio
n an
d in
tegr
ity m
anag
emen
t. Th
eir
know
ledg
e of
the
plan
t and
syst
ems
is s
een
to im
prov
e, a
ssis
ting
them
in e
nsur
ing
that
thei
r pr
ogra
mm
es a
reco
mpr
ehen
sive
and
that
line
dia
gram
s et
c ar
e up
to d
ate.
The
ir pe
rman
ent p
rese
nce
on th
e in
stal
latio
n ca
n he
lp e
nsur
es th
at th
e m
anag
emen
t and
ana
lysi
s of
the
data
prod
uced
in e
ffect
ive
and
that
act
ions
gen
erat
ed fr
om it
are
car
ried
out.
Def
initi
on o
f bac
klog
Bac
klog
is d
efin
ed in
man
y di
ffere
nt w
ays
acro
ss t
he in
dust
ry. M
aint
enan
ce c
an b
esh
ifted
into
bac
klog
bas
ed o
n, s
ay, a
fixe
d pe
riod
afte
r th
e du
e da
te o
r a
‘win
dow
’af
ter
the
fixed
per
iod.
The
win
dow
can
be
base
d on
the
mai
nten
ance
inte
rval
or
equi
pmen
t cr
itica
lity.
Ons
hore
and
offs
hore
per
sonn
el m
ay h
ave
diffe
rent
unde
rsta
ndin
gs o
f the
def
initi
on. T
he m
ore
com
plex
def
initi
ons
mak
e de
cisi
ons
defe
rral
dec
isio
ns m
ore
com
plex
and
man
agem
ent
of b
ackl
og m
ore
diffi
cult.
The
abilit
y to
man
age
back
log
dow
nwar
ds h
as b
een
seen
to b
e ac
com
pani
ed b
y a
deci
sion
to s
impl
ify it
s de
finiti
on to
‘any
mai
nten
ance
not
com
plet
ed w
ithin
a fi
xed
perio
d of
the
due
date
. Thi
s pe
riod
will
be b
ased
on
a co
mbi
natio
n of
fact
ors
incl
udin
g eq
uipm
ent c
ritic
ality
and
mai
nten
ance
inte
rval
. The
def
initi
on m
akes
sche
dulin
g an
d ov
eral
l pla
nnin
g si
mpl
er a
nd a
ssis
ts in
ran
king
by
criti
calit
y.
Asi
mpl
e de
finiti
on o
f bac
klog
will
assi
st s
enio
r m
anag
emen
t in
thei
r un
ders
tand
ing
ofm
aint
enan
ce m
anag
emen
t iss
ues
and
clar
ify r
esou
rce
requ
irem
ents
.
33 of 71 pagesKey Programme 3: Asset Integrity Programme

CAT
EG
OR
YIS
SU
ES
GO
OD
PR
AC
TIC
E F
OU
ND
Com
pete
nce
Com
pete
nce
enco
mpa
sses
not
onl
y te
chni
cal q
ualifi
catio
ns b
ut th
e kn
owle
dge
and
abilit
y to
wor
k w
ithin
com
pany
pro
cedu
res
effe
ctiv
ely.
Man
y op
erat
ors
have
ext
ensi
vean
d ad
equa
te m
aint
enan
ce m
anag
emen
t pro
cedu
res
for d
efer
ral m
anag
emen
t, ris
kas
sess
men
t on
SC
E br
eakd
own
or im
pairm
ent,
impl
emen
tatio
n of
risk
redu
ctio
n an
dm
itiga
tion
mea
sure
s. K
now
ledg
e of
the
proc
edur
es a
nd th
eir i
mpl
emen
tatio
n ca
n be
wea
k, e
spec
ially
offs
hore
.
Offs
hore
per
sonn
el h
ave
been
giv
en tr
aini
ng in
the
part
SC
Es p
lay
in p
rovi
ding
bar
riers
to M
AH
(see
Com
mun
icat
ion
and
Ris
k as
sess
men
t/m
itiga
tion
mea
sure
s ab
ove)
. The
resu
lt is
that
they
are
muc
h m
ore
likel
y to
app
reci
ate
the
reas
ons
behi
nd p
roce
dure
s.Th
ey w
ere
mor
e aw
are
of th
e im
porta
nce
of e
nsur
ing
MM
AS
dat
a qu
ality
,co
nsid
erat
ion
of ri
sk re
duct
ion
and
miti
gatio
n in
the
even
t of S
CE
failu
re.
ICP
invo
lvem
ent
ICP
s pl
ay a
crit
ical
rol
e in
ass
urin
g th
e pe
rform
ance
of S
CE
s. H
owev
er, t
heir
invo
lvem
ent
in a
spec
ts o
f mai
nten
ance
man
agem
ent
incl
udin
g de
ferr
als,
cons
ider
atio
n of
ris
k re
duct
ion
and
miti
gatio
n m
easu
res
and
prov
isio
n of
add
ition
alba
rrie
rs a
gain
st M
AH
in t
he e
vent
of S
CE
failu
re o
r de
grad
atio
n is
ofte
n lim
ited.
Whi
le IV
Bs
wer
e no
t alw
ays
dire
ctly
invo
lved
in d
ecis
ion-
mak
ing
proc
esse
s, th
ey d
idpr
ovid
e a
very
use
ful c
ontri
butio
n ba
sed
on th
eir k
now
ledg
e of
the
perfo
rman
cest
anda
rds
and
pote
ntia
l int
erac
tions
bet
wee
n sy
stem
s. It
is e
ssen
tial t
hat t
hey
rem
ain
fully
app
rais
ed o
f fai
lure
or d
egra
datio
n of
the
SC
Es a
nd s
yste
ms
in o
rder
to e
nsur
e th
ein
tegr
ity o
f the
ver
ificat
ion
sche
me
and
arra
ngem
ents
. The
ir in
volv
emen
t ens
ured
that
the
stat
us o
f ver
ificat
ion
anom
alie
s is
pro
perly
mon
itore
d an
d re
cord
ed.
Sup
ervi
sion
– u
se o
f lea
dte
chni
cian
s Th
e in
abilit
y to
ver
ify t
he q
ualit
y of
com
plet
ed m
aint
enan
ce w
ork
in a
reas
out
side
disc
iplin
e of
the
sup
ervi
sior
/lead
tec
nici
an. T
hey
have
to
rely
on
the
com
pete
nce
ofth
e te
chni
cian
s to
sel
f che
ck a
nd m
ust
use
post
mai
nten
ance
bre
akdo
wns
as
anin
dire
ct m
easu
re o
f qua
lity
of w
ork.
The
y ca
nnot
pro
perly
fulfi
l the
rol
es o
fm
aint
enan
ce m
anag
emen
t/pl
anni
ng a
nd s
uper
visi
on a
dequ
atel
y.
Lead
tech
nici
ans
have
bee
n us
ed a
s a
valu
able
reso
urce
in th
at th
ey w
ill be
com
pete
nt to
verif
y m
aint
enan
ce w
ork
in th
eir d
isci
plin
e ar
eas
and
can
play
a ro
le in
day
-to-
day
supe
rvis
ion
of th
eir t
eam
s. T
hey
have
allo
wed
mai
nten
ance
sup
ervi
sors
to fu
lfil th
eir r
ole
inm
aint
enan
ce p
lann
ing
and
can
assi
st th
e de
cisi
on-m
akin
g pr
oces
ses
follo
win
geq
uipm
ent b
reak
dow
n. T
hey
have
pro
vide
d an
effe
ctiv
e co
ndui
t for
com
mun
icat
ion
with
onsh
ore
TAs
and
can
prov
ide
a va
luab
le re
sour
ce in
the
even
t of a
bsen
ce o
r sic
knes
s of
supe
rvis
ors.
34 of 71 pagesKey Programme 3: Asset Integrity Programme

5.1 Specific good practice examples
Example 1
This example relates to the analysis of maintenance data and its presentation insuch a way that it is understandable by all levels of the workforce from non-technical offshore personnel to executives. The information provides a clear pictureof the health of safety-critical equipment onboard and the performance and statusof maintenance management.
Safety Critical Element Impairment Risk Assessments (SCEIRA):
These are conducted when operations, inspection, test and maintenance and/orindependent verification activities reveal asset condition that potentially affect safety-critical element performance and therefore an asset's ability to respond to majoraccident scenarios described in asset safety cases.
Conducting a SCEIRA involves multi-disciplined teams in:
n assessing SCE impairment risks;n identifying pre (as found) and post mitigation risk levels;n specifying the actions required to restore SCE integrity to an acceptable standard.
Completed SCEIRA are subject to technical authority and management review at alevel dependent on the level of risk presented by the impairment.
All SCEIRAs are registered and subject to periodic review based on risk. Status isreported weekly to asset managers. The SCEIRAs are referenced on SCE risksstatus posters issued monthly for display on the offshore asset.
Example 2
This example relates to a global analysis of the health of diverse systems in relation tothe integrity of hydrocarbon containment. Its strength is that it is capable of identifyinginteractions, deficiencies and gaps where cumulative risks can arise, and providingthe opportunity to properly address them.
Gap analysis process
A gap analysis tool has been developed called OGRE (Oil and Gas ReleaseElimination). This assesses the health of all the essential elements of hydrocarboncontainment programme. OGRE involves small, cross-functional operations teamssystematically assessing the health of programmes and procedures key tohydrocarbon containment. These include programmes and procedures categorisedas inspection, test, maintenance, operations intervention, management of change.
The OGRE process identifies gaps in key programmes not easily revealed by audit.OGRE relates all containment plant and equipment to their programmes andprocedures, identifies gaps, assesses risks and establishes risk reduction actions,which are assigned to responsible individuals and are tracked to closure.
Example 3
This example relates to the communication of key information which will raise andmaintain the awareness of SCE status to all levels of the workforce.
35 of 71 pagesKey Programme 3: Asset Integrity Programme
Health and Safety Executive

Communicating key asset and operating integrity (A&OI) risks
A&OI risks are depicted using the corporate risk matrix. A&OI risk is communicatedvia A&OI posters depicting OGRE risks and SCE condition risks, together withdescriptions of risk reduction measures and their status.
The benefits of these systems include:
n systematic methods of revealing SCE related risks;n communication of risk to all levels of the operations organisation;n heightened awareness of SCE issues with operations management, technical
groups, OIMs, supervision and workforce.
Example 4
Operational and maintenance metrics – measuring efficiency and effectiveness
The operational and maintenance metrics were used which targeted measures ofleading and lagging parameters to aid improvement in safety and operationalefficiency/effectiveness. These metrics are split in to two sections, the prioritisationmetrics and the general asset status metrics and are displayed on a single sheet.The metrics are compiled monthly and displayed on a company web page for allemployees to view and challenge.
Prioritisation metrics
Key systems on the installation are split into columns, each column is thenconstructed from a variety of parameters, including equipment availability, PMRbacklog, number of corrective maintenance activities completed, cost to maintain etc.
The status of each of these parameters for each of the systems being monitored isassessed and a simple traffic light system is used to indicate one of three possibleoutcomes:
Red The trend of the parameter being assessed is opposite to that desired(for example the number of backlog work orders has increased), and thedesired target has not been met.
Green The trend of the parameter being assessed meets that desired (forexample the number of backlog work orders has decreased), and thedesired target has been met.
Orange The trend of the parameter being assessed meets that desired (forexample the number of backlog work orders has decreased), howeverthe desired target has not been met
The numbers of red, orange and green traffic lights are then used, in combinationwith the pre-determined criticality of the system and a pre-defined rule-set, toascertain a prioritisation. The system with the highest score is reviewed to establishwhy it has that score and appropriate remedial actions implemented.
Note: A red is not an indication of a bad performance. It is a vehicle for promotingreview and discussion.
General status metrics
In addition to the prioritisation metrics, a collection of ‘general status’ parameters arecompiled. These metrics provide an overview of the status of work order control on the
36 of 71 pagesKey Programme 3: Asset Integrity Programme
Health and Safety Executive

plant, taking into account all PMR and corrective work scopes and the rules defined inthe work order control procedures employed.
As a whole, the general status metrics, combined with the prioritisation metrics providethe reviewer with a snapshot of the performance of the installation and key equipmentin terms of operating and maintenance effectiveness and efficiency on a single page.
37 of 71 pagesKey Programme 3: Asset Integrity Programme
Health and Safety Executive

Example 5
Planning
A strong onshore and offshore planning process that includes all relevant aspectsof offshore operations (project work, drilling programmes, peripheral resourcerequirements, bed availability, manpower levels) is critical in providing effective andcoherent maintenance management. The example below describes how it fits intothe overall SCE assurance process.
The company safety-critical element management relies on a number ofkey inter-related elements:
1. System custodianship
Every SCE has a designated system custodian who is responsible for ensuring thatthe SCE remains fit for service by ensuring that its performance standard is met,that maintenance and inspections are up-to date and issues are managed and risksproperly mitigated until resolved. System custodianship is not necessarily thetechnical authority; to avoid overloading or bottlenecks the role is deliberately sharedmore widely within each functional team.
2. Maintenance management system
SAP is used to detail, schedule, execute and record all maintenance activities. Allsafety-critical maintenance tasks are cross-referenced to the relevant performancestandard and are given a Category 1 priority code. The due dates for all majorworkscopes are recorded within SAP and these are used for planning, schedulingand backlog management.
3. Planning process
An 18-month plan is used to identify major workscopes and outages. A 90-daylook-ahead plan is used for maintenance, inspection and projects work planning.Both of these are developed by the onshore planner. A 14-day detailed workplan isthen developed by the offshore planner, from which the weekly and daily workplansare developed, reacting to ongoing local issues (manning, over-runs, unforeseendelays etc) as necessary.
4. Deferral and rescheduling process
A deferral and rescheduling procedure is used to authorise and track changes tothe SAP scheduled dates for maintenance activities. The intention is to defer workas early as possible, ideally in the 90-day plan if tasks need to be aligned tooutages, vendor availability etc. The system custodian must approve any deferral ofCAT 1 (ie SCE) maintenance and identify any mitigation to ensure that the ongoingsafety and integrity of the plant is assured. Deferred tasks do not appear in backlogas these are considered to have been executed and controlled through a riskassessed process. The bow-wave of work created by deferrals is, however,tracked and reported.
5. Backlog management
System custodians are responsible for reviewing any safety-critical tasks which arein backlog and confirming the new due date for completion. Any interim mitigationto allow ongoing safe operation until the task is completed is also identified andrecorded.
38 of 71 pagesKey Programme 3: Asset Integrity Programme
Health and Safety Executive

6. Downgraded situations
Any SCE which cannot meet its performance standard or which has an unresolvedissue which materially affects its performance is tracked via the downgradedsituations register. This requires the impairment to be risk assessed in order todemonstrate the case to operate. Where mitigation is required in order todemonstrate the case to operate then these are recorded and their implementationand effectiveness tracked via formal regular review. Downgraded situations are alsosubject to regular review, and are signed off by, the asset leadership team.
7. System Custodian Reporting
Each system custodian produces an annual report detailing the performance oftheir SCE against the WSV. The report, which includes a complete review of theentire maintenance history for the preceding 12 months, identifies any issues orfailures of the systems and reviews the accuracy and appropriateness of thecurrent WSV. They all end with a statement of fitness for purpose of the system.Reports are distributed internally as well as to the ICP.
8. Interface with ICP
The ICP visits the engineering office once a month. One-to-one meetings withsystem custodians are arranged for those systems with observations or anomaliesagainst them.
6 References
1 KP1 Loss Containment Manualhttp://www.hse.gov.uk/offshore/lossofcontainmen.pdf
2 Offshore Hydrocarbon Release Statistics 1992 to 2002http://www.hse.gov.uk/offshore/statistics/hsr2002/index.htm
3 Key Programme 3 Asset Integrity Handbook, May 2007,http://www.hse.gov.uk/offshore/kp3handbook.pdf
4 HSE offshore oil and gas website: http://www.hse.gov.uk/offshore/
5 HSL interim report on KP3: http://www.hse.gov.uk/research/rrhtm/index.htm(yet to be published)
6 UKOOA Integrity Toolkit,http://www.ukooa.co.uk/issues/health/docs/hydrocarbontoolkit.pdf
7 The Report of the BP US Refineries Independent Safety Review Panel (TheBaker Report) http://www.safetyreviewpanel.com/cmtfiles/charter_related/Panel%20Report%20-%20January%202007.pdf
8 Offshore External Corrosion Guide HSE 2007http://www.hse.gov.uk/offshore/corrosion.pdf
9 Guidance on fire and explosion hazards associated with ageing offshore oil andgas platforms, PS/06/24, T Roberts et al. 2007
39 of 71 pagesKey Programme 3: Asset Integrity Programme
Health and Safety Executive
10 The Public enquiry into the Piper Alpha disaster, Rt Hon Lord Cullen, HMSO,Nov 1990
11 Testing Regime for Offshore TR-HVAC Fire Dampers & TR PressurisationRequirements, SPC/Enforcement/122
12 Testing Regime for Offshore TR-HVAC Fire Dampers & TR PressurisationRequirements Offshore Information Sheet No. 1/2006 (Revised and reissuedJanuary 2007) HSE 2007 http://www.hse.gov.uk/offshore/trhvac.pdf
13 PILOT Website Vision for 2010,http://www.pilottaskforce.co.uk/data/pvision.cfm
14 A guide to the Offshore Installations (Safety Case) Regulations 2005 L30 Thirdedition HSE Books 2006 ISBN 978 0 7176 6184 8
40 of 71 pagesKey Programme 3: Asset Integrity Programme
Health and Safety Executive

Appendix 1
Aims and objectives
The aim of KP3 is to ensure that dutyholders effectively manage the risk of anyfailure of structure, plant, equipment or systems, which could either cause orcontribute to, or prevent or limit the effect of, a major accident and/or causefatalities, ie the maintenance management of SCEs.
This is linked to the ten-year strategy of the UK offshore industry and Governmentco-operation, as expressed through the PILOT Vision13; that by 2010 the North Sea(and the UKCS in particular) will be the safest place to work in the worldwide oiland gas industry. KP3 was intended to make a major contribution to achieving thisoutcome.
The KP3 Handbook3 defines the objective of the programme, to:
‘Ensure that dutyholders effectively manage the risk of any failure of structure,plant, equipment or systems, which could either cause or contribute to, or preventor limit the effect of, a major accident and/or cause fatalities’.
The KP3 objective is to contribute to the process of ‘creating an environment inwhich dutyholders manage the integrity of plant and structure to ensure risks areas low as reasonably practicable (ALARP)’.
A1.1 Programme drivers
Evidence from inspection and investigation had shown that, while not applying toall companies or all installations:
n there were weaknesses in the implementation of statutory provisions forindependent verification designed to assure dutyholders that theirarrangements for securing the integrity of safety-critical elements areadequate;
n cost control, reduced offshore manning, and multitasking could - if poorlymanaged - have adverse effects on health and safety performance;
n some backlogs of maintenance was too high;n a number of significant incidents had been due to maintenance or integrity
failures;n in addition there was a need to maintain the level of improvement in reducing
the numbers of major and significant hydrocarbon leaks and reverse the risingtrend in minor releases.
A1.2 Alignment with industry organisations and initiatives
Step Change in Safety is industry initiative intended to deliver the PILOT Visionmentioned above, to improve safety performance, awareness and behavioursthroughout the UK oil and gas industry. It has focused its strategy on three criticalareas shown as their ‘Temple Model’ (Figure A1). The ‘third pillar’ in the StepChange Temple model is asset integrity which underlines the alignment of KP3 withindustry objectives.
41 of 71 pagesKey Programme 3: Asset Integrity Programme
Health and Safety Executive

Other stakeholders who have been involved with KP3 include:
n International Association of Drilling Contractors (IADC)n British Rig Owners Association (BROA)n Offshore Contractors Association (OCA)n Independent Verification Bodies (IVBs)
Figure A1 Step Change Temple Model
42 of 71 pagesKey Programme 3: Asset Integrity Programme
Health and Safety Executive
Assetintegrity
Recognisehazards andreduce risk
Personalownership for
safety
Identifying,understanding and
dealing withhazards
Making safetypersonal by
demonstratingcommitment and
competencethroughout the
organisation
Maintaininghardware to be
safe, reliable andefficient
Ownership and involvement at all levelsLeadership - Communication - Cooperation
In 2010,
the UK is the safest
place to work in the worldwide
Oil and Gas Industry

Appendix 2
Inspection programme
A2.1 Scope
The management of asset integrity is a very wide-ranging subject which coversvirtually all aspects offshore operations. From a Health and Safety Executiveperspective, asset integrity relates to any aspect of offshore operations whichprovides a barrier against the occurrence of major accident hazards (MAHs)14 orassists in preventing death or injury to personnel. The IIWG agreed a definition ofintegrity as follows, which aligns with KP3;
‘Asset integrity’ is the ability of the asset to perform its required function effectivelyand efficiently whilst safeguarding life and the environment.
‘Asset integrity management’ is the means of ensuring that the people, systems,processes and resources which deliver the integrity, are in place, in use and fit forpurpose over the whole lifecycle of the asset.
Dutyholders, through their major hazard analyses, are required to identify safety-critical elements (SCEs) whose failure will either cause, contribute to or, limit theeffect of a major accident. In light of current knowledge of MAH (eg jet and poolfires, gas explosions) some SCEs may not now be entirely suitable or fit for purpose.This issue has, and is, being addressed through HSE’s ongoing strategic inspectionprogramme, duty holder re-evaluations of MAH and general upgrade of hardwareand systems. This issue of SCE suitability was therefore beyond the scope of KP3.
KP3 has focused primarily on inspection of the maintenance management of SCEsand systems. That is, to inspect integrity management of SCEs and systems thatare in place offshore to ensure that they will be available when required and willprovide the expected level of reliability.
A2.2 Inspection methodology
KP3 was aimed at inspecting the effectiveness of the maintenance management ofSCEs and systems on offshore installations. In carrying out the programme theHSE was required to achieve the following3:
n to use all OSD specialist resources to make an in-depth appraisal of dutyholders' ability to manage the integrity of their installations in a manner thattakes adequate account of health and safety;
n to identify deficiencies in maintenance and other activities that underpin life-cycle integrity;
n to use HSE influence and, where necessary, formal enforcement powers, toensure that legal requirements are met and that any deficiencies threateningintegrity are speedily remedied;
n to work with industry in a way that encourages good practice in integritymanagement, continuous improvement, and a minimisation of the potential foraccidents.
This translates into the following two specific components:
n a 3-year inspection programme focussed on key integrity/maintenancemanagement issues (KP3/3);
n coordination of other OSD topic/specialist work against the aim of the keyprogramme.
43 of 71 pagesKey Programme 3: Asset Integrity Programme
Health and Safety Executive

Following 11 pilot inspections carried out during October 2003 and November2003, the full programme was initiated. This was developed on a year-by-yearbasis using feedback and intelligence from inspection management teams (IMTs)and input from specialist inspectors.
It should be borne in mind that the KP3 inspections were effectively a ‘snapshot’ ofthe installation performance at the time of the inspection which could subsequentlyimprove or decline.
A2.3 Inspection templates
To assist in ensuring focused inspections and a consistent approach by theinspection teams, templates were developed for both onshore and offshore use.The templates consist of question sets covering all aspects of safety-criticalmaintenance management including backlog, deferral, corrective maintenance,supervision and verification issues.
The questions were used as the basis for interviews both on and offshore, in whichthe effectiveness of all areas of SCE maintenance management was challenged.They were aimed at management and technical authorities (TA) onshore andoffshore team leaders (OTL), and were made freely available to the industry on theHSE KP3 website at: http://www.hse.gov.uk/offshore/programme.htm.
A2.4 System tests
In addition, in order to obtain first-hand data on the physical performance of SCEs,a number of systems were identified which could be tested while offshore. Itproved more practicable to test some systems, primarily for operational reasons.For example, the testing of emergency shutdown valves or blowdown systemswould be likely to shut down production (with its associated hazards). However,testing of deluge or TR integrity could be carried out with minimal disruption orpotential hazard.
A2.5 Traffic lights
The KP3 Steering Group devised a simple traffic light system to summarise theresults from each inspection and to simplify the presentation of KP3 findings toinspectors and to the industry. Each section of the template is provided with atraffic light box for the inspection team to complete, as shown below.
The inspection team then ‘scored’ each section GREEN, AMBER or RED asappropriate. The definition of the traffic light colours is defined as follows:
44 of 71 pagesKey Programme 3: Asset Integrity Programme
Health and Safety Executive
NONCOMPLIANCE/
MAJORFAILING
ISOLATEDFAILURE/
INCOMPLETESYSTEM
IN COMPLIANCE/OK
NOT TESTED/NO EVIDENCE

Non-compliance with legislationMajor failing of system (hardware or management) or partialfailure with a history of failureMinded to serve notice
Issues in this category must be expressed in the letter to the dutyholder, eg:
(a) no system for authorising deferrals of SCE maintenance;(b) complete failure of SCE to meet performance standard;(c) multiple failure of SCE;(d) no competence system for supervisors or TA’s;(e) no clear system for review of effectiveness of SC maintenance performance
(PUWER Reg 5).
Isolated failure of a well-defined systemIncomplete procedures/systems.Partial failure of SCE, eg:a) fire pump starts but back up fails, or vice versa;b) ESDV closes two seconds longer than required byperformance standard.
Issues in this category should be expressed as recommendations in the letter tothe dutyholder.
IN COMPLIANCE/OKTested or inspected but with no significant issues foundComplies with regulations etc.
Not tested or no evidence
The function of the traffic light is to indicate failings and/or compliance for analysisand presentation purposes. Where enforcement action has been taken, the trafficlight was scored amber or more usually red. These were then transferred to a matrixfrom which a picture of overall industry performance could be built up (see A2.9.)
A2.6 Reporting
During the offshore inspection feedback on any issues, key findings and goodpractices was provided to offshore management and safety representatives. Feedbackwas also subsequently provided to management onshore. All red traffic light issues,and some more critical amber issues, were communicated to the dutyholders,followed up by an inspection letter and enforcement action where appropriate.
A2.7 Inspection follow-up
As part of the KP3 inspection process, follow-up of all red traffic light issues by theKP3 inspection team or, IMT inspector was monitored by KP3 the manager andany subsequent changes to traffic light scoring was recorded. While some issues
45 of 71 pagesKey Programme 3: Asset Integrity Programme
Health and Safety Executive
NONCOMPLIANCE/
MAJORFAILING
ISOLATEDFAILURE/
INCOMPLETESYSTEM
IN COMPLIANCE/OK
NOT TESTED/NO EVIDENCE

could be addressed relatively quickly others have required significantly longer,eg backlog or structural problems related to manpower can take some time torectify. In the case of enforcement involving Improvement Notices a timescalewould be imposed for completion.
A2.8 Consistency
The inspection programme involved nearly 40 Specialist and 25 IMT inspectorsoverall. To ensure consistency between inspections and assignation of traffic lightsan analysis group was formed consisting of Specialist and IMT inspectors. Theyreviewed the reports and challenged traffic light assignations which appeared to beinconsistent with other inspections. Their analyses were referred back to theinspection teams for review and possible change where appropriate.
A2.9 KP3 matrix
All traffic lights were transferred to a matrix showing the inspection results for eachinstallation as individual lines (Figure A2.1).
Figure A2.1 KP3 traffic light matrix
46 of 71 pagesKey Programme 3: Asset Integrity Programme
Health and Safety Executive

This format enabled areas of good and poor performance to be highlighted as theinspection programme progressed. It has proved to be a very powerful means ofdisplaying and comparing industry performance.
By sorting the matrix (eg by dutyholder, installation type, ranking of red traffic lights)conclusions have been drawn concerning overall industry performance. In addition,by analysing the details of the inspection reports which lie behind the traffic lights,common themes related to areas of good and poor performance have beenidentified.
47 of 71 pagesKey Programme 3: Asset Integrity Programme
Health and Safety Executive

Appendix 3
Results
These results cover the period 2004 up to July 2007. There are 32 inspectionsincluded in this analysis for the 2006/2007 inspection year with a total of 36 to becompleted by December 2007. The additional inspections are not expected tochange the overall conclusions to a significant extent. Additional results frominspections going on at the time of writing will be added to the internet version ofthe report which will be updated as appropriate.
All traffic lights generated from KP3 inspections were recorded on a ‘Traffic LightMatrix’. The matrix has been split here, to show Management System results(Figure A3.1) and System Tests results (Figure A3.2). The results of several furtherinspections are outstanding and will be included in the internet version of thisreport. They are not expected to change the main conclusions.
Issues related to management systems and system tests are discussed separately,as is Physical State of Plant (the left-hand column in Figure A3.2).
Figure A3.1 KP3 management system matrix
48 of 71 pagesKey Programme 3: Asset Integrity Programme
Health and Safety Executive

Figure A3.2 KP3 system test matrix
Each line of the matrix is numbered and represents an inspection. Severalinstallations were inspected several times in light of ownership changes and KP3follow-up. The matrix has been anonymised but each installation’s traffic lights willbe provided to their dutyholder together with pie charts showing the distribution ofgreens, ambers, and reds for each template element. This has already been carriedout for inspections completed up to April 2006.
The internet version of this report will include a downloadable version of thenumbered matrix as an Excel spreadsheet at:http://www.hse.gov.uk/offshore/information.htm.
Dutyholders will be informed of their installations number(s) and will be able toidentify their platforms on this matrix and carry out their own analyses as required.
Completed traffic light template scripts form part of the overall inspection reports, whichare not for publication. However, they have been analysed in detail by the Health andSafety Laboratory with the main conclusions summarised in this report. A finalisedresearch report will be available, when all inspections have been included, at:http://www.hse.gov.uk/research/rrhtm/index.htm.5
49 of 71 pagesKey Programme 3: Asset Integrity Programme
Health and Safety Executive

Installations have not been ranked against another based on their traffic lightscores. Consistency between inspection teams was addressed as far as possibleby the Analysis Group but a level of subjectivity was inevitable as reliance on theinspector’s opinion was an integral part of the process. Amber traffic lights inparticular covered a range of performance, from bordering on green to borderingon red. Also, some elements of the matrix will be more significant than others inoverall maintenance effectiveness and ultimately provision of barriers against MAHs.It was therefore considered that a direct ranking of one installation against anotherwas inappropriate.
A3.1 Overall traffic light scoring
The overall proportion of green, amber and red traffic lights for managementsystem is shown in Figure A3.3.
Proportion of red amber and green management system traffic lights assigned
Figure A3.3 Overall traffic light scoring – management systems
It can be seen that the proportion of management system green lights (61%)assigned outweighs ambers and reds combined. However, the level of poorperformance related to amber and red traffic lights (39%) was significant. Theoverall proportion of amber and red traffic lights (58%) for physical state of plantoutweighed the number of greens (Section A3.1.2 below).
A3.1.1 Management system elements
Figures A3.1 and A3.2 above, show inspection traffic lights recorded in the order inwhich they were analysed (ie approximately in date order). Figure A3.4 shows thepercentage of green, amber and red traffic lights scored during each year of theprogramme for the management system elements.
Figure A3.4 Yearly traffic light distributions (%)
50 of 71 pagesKey Programme 3: Asset Integrity Programme
Health and Safety Executive
8%
31% 61%
2006/20072005/20062004/2005

Year on year the proportion of green traffic lights assigned has been higher thanamber plus red combined, with an improvement in performance in 2005/2006. Theimprovement in performance in 2005/2006 can be clearly see in Figure A3.1 whereconsistent good performance is apparent to the right of the corrective maintenanceelement. Over this period four mobiles were inspected (discussed below) and threefixed installations from a single company.
The number of red and amber traffic lights assigned over the latter part of2005/2006 and 2006/2007 was similar to that of 2004/2005 with no overallimprovement over the programme lifetime.
A3.1.2 Physical state of plant
This element was based on the inspection team’s opinion of the overall condition ofthe installation overall ie including fabric, structure, safety-critical and non-safety-critical plant and systems. Figure A3.5 shows that over half of those reported(58%) were scored amber or red. Figure A3.2 shows that over the lifetime of theprogramme this was one of the poorer performing elements. However, towards itsend there appeared to be a slight improvement in the number of greens scored.
Distribution of traffic lights for physical state of plantFigure A3.5 Physical state of plant (%)
A3.1.3 System testing
Figure A 3.2 shows the range of system tests carried out during the inspectionprogramme. Deluge, fire pumps, ESD valves and (TR) HVAC dampers were testedmost extensively.
From 20 tests carried out on deluge systems 7 (35%) scored red, 3 (15%) scoredamber and 10 (50%) scored green (Figure A3.6)
51 of 71 pagesKey Programme 3: Asset Integrity Programme
Health and Safety Executive
16%
42%
42%
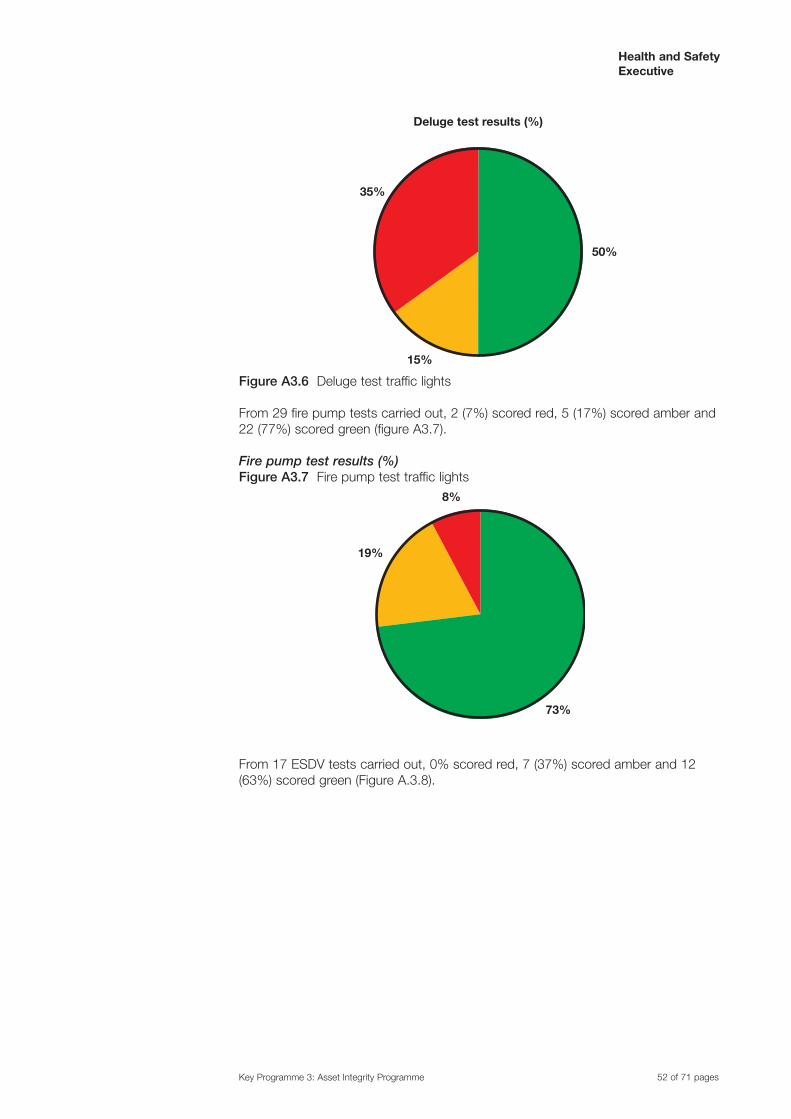
Figure A3.6 Deluge test traffic lights
From 29 fire pump tests carried out, 2 (7%) scored red, 5 (17%) scored amber and22 (77%) scored green (figure A3.7).
Fire pump test results (%)Figure A3.7 Fire pump test traffic lights
From 17 ESDV tests carried out, 0% scored red, 7 (37%) scored amber and 12(63%) scored green (Figure A.3.8).
52 of 71 pagesKey Programme 3: Asset Integrity Programme
Health and Safety Executive
35%
15%
50%
Deluge test results (%)
8%
19%
73%

ESDV system tests results (%)
Figure A3.8 ESDV test traffic lights
TR HVAC was the most extensively tested system. The distribution of traffic lightsrecorded for HVAC system tests are 35% red, 29% amber and 36% green (FigureA.3.9). It can be seen from Figure A3.2 that there was no improvement in the testresults for HVAC throughout the programme lifetime.
HVAC system tests results (%)
Figure A3.9 HVAC test traffic lights
53 of 71 pagesKey Programme 3: Asset Integrity Programme
Health and Safety Executive
35%
65%
35% 36%
29%
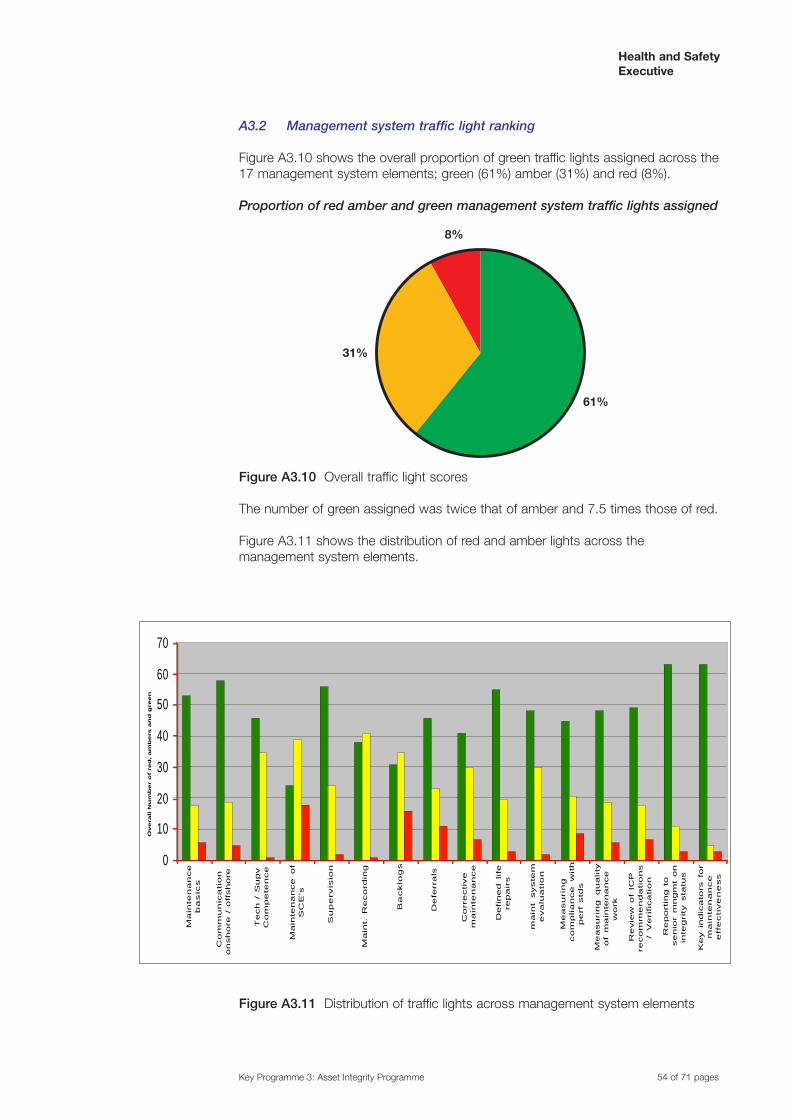
A3.2 Management system traffic light ranking
Figure A3.10 shows the overall proportion of green traffic lights assigned across the17 management system elements; green (61%) amber (31%) and red (8%).
Proportion of red amber and green management system traffic lights assigned
Figure A3.10 Overall traffic light scores
The number of green assigned was twice that of amber and 7.5 times those of red.
Figure A3.11 shows the distribution of red and amber lights across themanagement system elements.
Figure A3.11 Distribution of traffic lights across management system elements
54 of 71 pagesKey Programme 3: Asset Integrity Programme
Health and Safety Executive
8%
31%
61%
0
10
20
30
40
50
60
70
Ma
inte
na
nce
ba
sic
s
Co
mm
un
ica
tio
n
on
sh
ore
/
off
sh
ore
Te
ch
/
Su
pv
Co
mp
ete
nce
Ma
inte
na
nce
o
f
SC
E's
Su
pe
rvis
ion
Ma
int.
R
eco
rd
ing
Ba
cklo
gs
De
ferra
ls
Co
rre
ctive
ma
inte
na
nce
De
fin
ed
life
re
pa
irs
ma
int
syste
m
eva
lua
tio
n
Me
asu
rin
g
co
mp
lia
nce
w
ith
pe
rf
std
s
Me
asu
rin
g q
ua
lity
of
ma
inte
na
nce
wo
rk
Re
vie
w o
f IC
P
re
co
mm
en
da
tio
ns
/ V
erific
atio
n
Re
po
rtin
g to
se
nio
r m
ng
mt
on
inte
grity sta
tus
Ke
y in
dic
ato
rs fo
r
ma
inte
na
nce
effe
ctiv
en
ess
Overall N
um
ber o
f r
ed
, am
bers a
nd
green

The elements with highest number of red and amber traffic lights are discussedbelow. Table A3.2 summarises the ranking of the top five elements for red, amberand red and amber assignations.
Table A3.2 Ranking of template elements
While the criterion for red traffic lights was clearly defined in the methodology as a‘serious’ issue, potentially requiring enforcement, amber traffic lights inevitablycovered a wider range of significance from higher than green to lower than red. Forthis reason more weight has been placed on red traffic lights ranking in theanalysis. However, for both red and red plus amber traffic light ranking,maintenance of SCEs and backlog are the two weakest performing elments. Foramber traffic lights alone, backlog is the fouth highest ranked with maintenancerecording ranked second highest.
A3.2.1 Ranked green traffic lights
Table A3.3 and Figure A3.12 below show management system template elementsranked by green traffic light scores, with associated amber and reds. For 12 of theof the 16 management system elements, the number of green traffic lightsexceeded the number of red and amber combined.
Table A3.3 Green traffic light ranking
55 of 71 pagesKey Programme 3: Asset Integrity Programme
Health and Safety Executive
RANKING RED AMBER RED+AMBER
1 Maintenance of SCEs Maintenance Recording Maintenance of SCEs
2 Backlog Maintenance of SCEs Backlog
3 Deferrals Technical Supervision Maintenance Recording
4 Measuring compliancewith PS
Backlog Corrective Maintenance
5 Corrective Maintenance Corrective Maintenance Technical Supervision

Figure A3.12 Green traffic light ranking
Several matrix elements have performed consistently well in relation to assignationof green traffic lights throughout the inspection programme, namely:
n reporting to senior management on integrity status;n key indicators of maintenance effectiveness;n communications between onshore and offshore;n supervision;n defined life repairs.
A3.2.2 Ranked red traffic lights
Table A3.4 and Figure A3.13 show management system template elements rankedby red traffic lights scored. The worst performing areas are:
n maintenance of SCEs;n backlog;n deferrals;n measuring compliance with performance standards;n corrective maintenance.
Table A3.4 Red traffic light ranking
56 of 71 pagesKey Programme 3: Asset Integrity Programme
Health and Safety Executive
OVERALL NUMBER OF RANKED GREENS
0
10
20
30
40
50
60
70
80
90
Re
po
rtin
g t
o s
en
ior
mn
gm
t
on
in
teg
rity
sta
tus
Ke
y i
nd
ica
tors
fo
r
ma
inte
na
nce
eff
ective
ne
ss
Co
mm
un
ica
tio
n o
nsh
ore
/
off
sh
ore
Su
pe
rvis
ion
De
fin
ed
life
re
pa
irs
Ma
inte
na
nce
b
asic
s
Re
vie
w o
f IC
P
reco
mm
en
da
tio
ns /
Ve
rifica
tio
n
ma
int
syste
m e
va
lua
tio
n
Me
asu
rin
g q
ua
lity o
f
ma
inte
na
nce
wo
rk
Te
ch
/ S
up
v C
om
pe
ten
ce
De
ferr
als
Me
asu
rin
g c
om
plia
nce
with
pe
rf s
tds
Co
rre
ctive
m
ain
ten
an
ce
Ma
int.
Re
co
rdin
g
Ba
cklo
gs
Ma
inte
na
nce
of
SC
E's
NU
MB
ER
AS
SIG
NE
D

Figure A3.13 Red traffic light ranking
Reporting to senior management and key indicators for maintenance effectivenessperformed the best overall with the lowest number of combined reds and ambers.Maintenance recording, technical supervision/competencies and maintenancesystem evaluation scored the lowest number of reds but also scored a relativelyhigh number of ambers.
A3.2.3 Ranked amber traffic lights
Table A3.5 and Figure A3.14 show management system template elements rankedby amber traffic lights scored.
Table A3.5 Ranked amber traffic lights
57 of 71 pagesKey Programme 3: Asset Integrity Programme
Health and Safety Executive
OVERALL NUMBER OF RANKED REDS
0
10
20
30
40
50
60
70
80
90
Ma
inte
na
nce
of
SC
E's
Ba
cklo
gs
De
ferr
als
Me
asu
rin
g co
mp
lia
nce
with
pe
rf s
tds
Co
rre
ctive
m
ain
ten
an
ce
Re
vie
w o
f IC
P
reco
mm
en
da
tio
ns /
Ve
rifica
tio
n
Ma
inte
na
nce
b
asic
s
Co
mm
un
ica
tio
n o
nsh
ore
/
off
sh
ore
Me
asu
rin
g q
ua
lity o
f
ma
inte
na
nce
w
ork
Re
po
rtin
g t
o s
en
ior
mn
gm
t
on
in
teg
rity
sta
tus
Ke
y i
nd
ica
tors
fo
r
ma
inte
na
nce
eff
ecti
ve
ne
ss
Su
pe
rvis
ion
De
fin
ed
life
re
pa
irs
ma
int
syste
m e
va
lua
tio
n
Te
ch
/ S
up
v C
om
pe
ten
ce
Ma
int.
Re
co
rdin
g
NU
MB
ER
AS
SIG
NE
D

Figure A3.14 Ranked amber traffic lights
The four worst performing elements were:
n maintenance recording;n maintenance of SCEs;n technical supervision; and n backlog.
Best performing elements in relation to number of ambers assigned were:
n key indicators of maintenance effectiveness;n reporting to senior management;n review of ICP recommendations.
A3.2.4 Ranked red and amber traffic lights
While serious issues giving red traffic lights required immediate attention, ambertraffic lights covered a range of criticality from almost green to almost red. TableA3.6 shows management system template elements ranked for combined red andamber traffic lights plotted on Figure A3.15.
Table A3.6 Red and amber traffic light ranking
58 of 71 pagesKey Programme 3: Asset Integrity Programme
Health and Safety Executive
OVERALL NUMBER OF RANKED AMBERS
0
10
20
30
40
50
60
70
80
90
Ma
int.
Re
co
rdin
g
Ma
inte
na
nce
of
SC
E's
Te
ch
/ S
up
v C
om
pe
ten
ce
Ba
cklo
gs
Co
rre
ctive
m
ain
ten
an
ce
ma
int
syste
m e
va
lua
tio
n
Su
pe
rvis
ion
De
ferr
als
Me
asu
rin
g c
om
plia
nce
with
pe
rf s
tds
De
fin
ed
life
re
pa
irs
Co
mm
un
ica
tio
n o
nsh
ore
/
off
sh
ore
Me
asu
rin
g q
ua
lity o
f
ma
inte
na
nce
w
ork
Ma
inte
na
nce
b
asic
s
Re
vie
w o
f IC
P
reco
mm
en
da
tio
ns /
Ve
rifica
tio
n
Re
po
rtin
g t
o s
en
ior
mn
gm
t
on
in
teg
rity
sta
tus
Ke
y i
nd
ica
tors
fo
r
ma
inte
na
nce
eff
ective
ne
ss
NU
MB
ER
AS
SIG
NE
D

Figure A3.15 Red and amber traffic light panking
Worst performing elements were:
n maintenance of SCEs;n backlog;n maintenance recording;n corrective maintenance.
Best performing elements were:
n key indicators of maintenance effectiveness;n reporting to senior management.
A3.3 Performance by installation type
The traffic light matrix sorted by installation type is shown in Figure A3.16. Mobileinstallations, floating production and fixed installations are discussed separatelybelow. Common themes related to good and bad performance across allinstallations are discussed in Section A3.3.
Here, floating production installations include both FPSOs and converted semi-submersibles.
59 of 71 pagesKey Programme 3: Asset Integrity Programme
Health and Safety Executive
OVERALL NUMBER OF RANKED RED PLUS AMBER
0
10
20
30
40
50
60
70
Ma
inte
na
nce
of
SC
E's
Ba
cklo
gs
Ma
int.
Re
co
rdin
g
Co
rre
ctive
m
ain
ten
an
ce
Te
ch
/ S
up
v C
om
pe
ten
ce
De
ferr
als
ma
int
syste
m e
va
lua
tio
n
Me
asu
rin
g c
om
plia
nce
with
pe
rf s
tds
Su
pe
rvis
ion
Re
vie
w o
f IC
P r
eco
mm
en
da
tio
ns /
Ve
rifica
tio
n
Ma
inte
na
nce
b
asic
s
Co
mm
un
ica
tio
n o
nsh
ore
/ o
ffsh
ore
Me
asu
rin
g q
ua
lity o
f m
ain
ten
an
ce
wo
rk
De
fin
ed
life
re
pa
irs
Re
po
rtin
g t
o s
en
ior
mn
gm
t o
n in
teg
rity
sta
tus
Ke
y i
nd
ica
tors
fo
r m
ain
ten
an
ce
eff
ective
ne
ss
NU
MB
ER
AS
SIG
NE
D
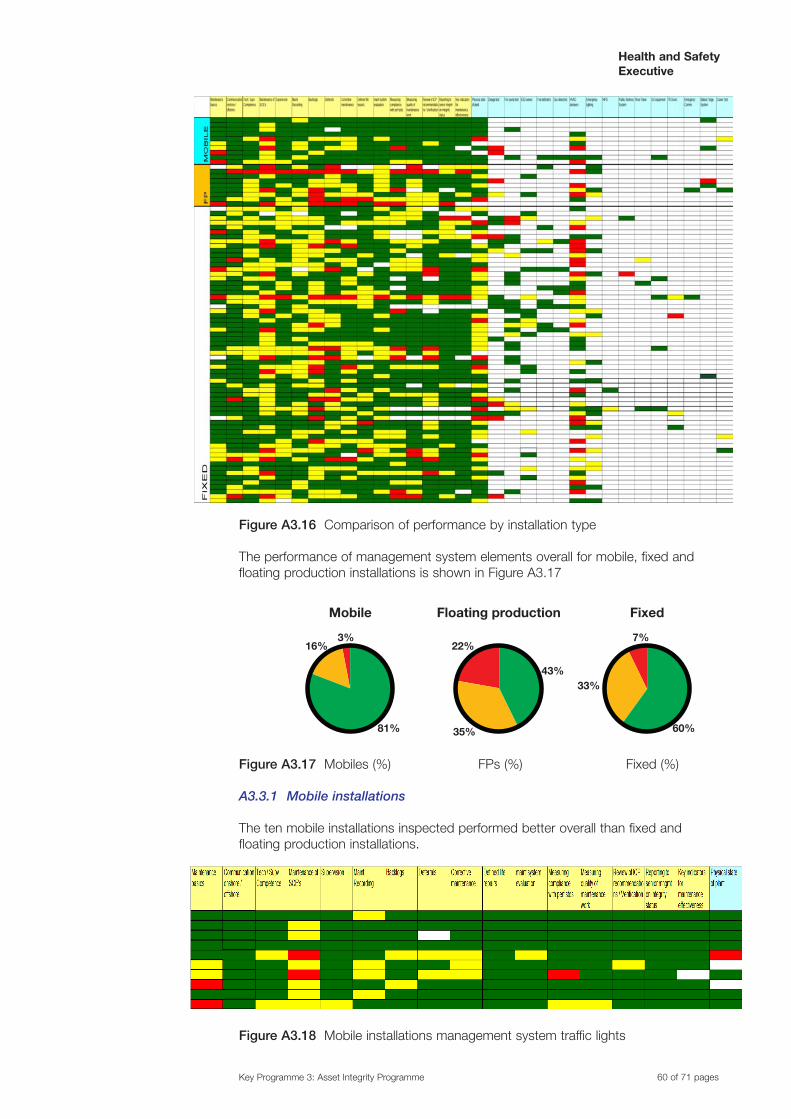
Figure A3.16 Comparison of performance by installation type
The performance of management system elements overall for mobile, fixed andfloating production installations is shown in Figure A3.17
Figure A3.17 Mobiles (%) FPs (%) Fixed (%)
A3.3.1 Mobile installations
The ten mobile installations inspected performed better overall than fixed andfloating production installations.
Figure A3.18 Mobile installations management system traffic lights
60 of 71 pagesKey Programme 3: Asset Integrity Programme
Health and Safety Executive
FixedFloating productionMobile
3%16%
81%
7%
33%
60%35%
22%
43%

Figure A3.19 Mobile installations state of plant and system test traffic lights
Maintenance of SCEs, maintenance basics and maintenance recording were theworst performing areas. Eight of the ten installations inspected performed well inthe area of backlog management, reporting to senior management on integritystatus, communications, defined life repairs and key indicators for maintenanceeffectiveness. Poor performance in maintenance of SCEs was common to all othertypes of installation.
Both deluge systems tested that were assigned red traffic lights related to blockednozzles. Two of the six TR HVAC systems tested were assigned red traffic lights.
A3.3.2 FP installations
Nine FP installations were inspected (Figure A3.20 and 21). The number of templateelements where performance was poor exceeded that for fixed installations.
Figure A3.20 Floating production installation management system traffic lights
Figure A3.21 Floating production system test traffic lights
61 of 71 pagesKey Programme 3: Asset Integrity Programme
Health and Safety Executive

FPs generally scored more poorly than all other types of installation. Areas of poorperformance were as follows:
n Backlog; 5 red and 2 ambern Maintenance of SCEs; 4 red and 2 ambern Deferrals; 3 red and 4 ambern Maintenance system evaluation; 1 red and 7 ambern Correctives; 3 red and 3 ambern Measuring compliance with PS; 3 red and 1 ambern Measuring quality of maintenance work; 2 red and 5 amber
The percentage of reds assigned to FPs was consistently higher than for fixedinstallations (Table A3.6) although the sample size of nine inspections was small.
Table A3.6 Comparison of percentage of red and amber traffic lights For FPs andfixed installations
Issues lying behind the areas of poor performance listed above are common toboth FP and fixed installations. These are discussed in Section A3.4 below.
Key indicators of maintenance effectiveness and reporting to senior managementagain scored relatively well with maintenance of SCEs, backlog and deferralsscoring poorly.
A3.3.3 Fixed installations
Sixty four fixed installations were inspected to the writing of this report whichcomprised the majority of the inspections in the programme. There were widevariations in performance which could not be attributed to any single factor.However, the analysis of the background inspection reports has identified commonthemes which relate to specific issues. These are discussed below in relation to theindividual matrix elements. They can also be applied to poorer performing areas formobiles and floating production installations.
62 of 71 pagesKey Programme 3: Asset Integrity Programme
Health and Safety Executive
Maintenanceof SCEs
Backlog Deferrals Correctives Measuringcompliancewith PS
Maintenancesystemevaluation
Measuringquality ofmaintenancework
FP %red/amber
37%red
25%A
40%red
25%A
25%red
50%A
25%red
38%A
25%red
12%A
12%red
75%A
12%red
62%A
Fixed% red/amber
20%red
48%A
19%red
50%A
14%red
27%A
8%red
38%A
10%red
26%A
2%red
33%A
8%red
38%A

Figures A3 22 and 23 shows fixed installation traffic lights
Figure A3.22 Fixed installations management system traffic lights
Figure A3.23 Fixed installation system test traffic lights
63 of 71 pagesKey Programme 3: Asset Integrity Programme
Health and Safety Executive

Green traffic light ranking (Figure A3.24) is very similar to the overall ranking withkey indicators of maintenance effectiveness and reporting to senior managementbeing the best-performing elements.
Figure A3.24 Fixed installation green traffic light ranking
Red traffic light ranking for fixed installations show in Figure A3.25 givesmaintenance of SCEs, backlogs, deferrals and review of ICP recommendationswith the highest scores.
Figure A3.25 Fixed installation red traffic light ranking
64 of 71 pagesKey Programme 3: Asset Integrity Programme
Health and Safety Executive
FIXED INSTALLATION GREEN TRAFFIC LIGHT RANKING
0
10
20
30
40
50
60
70K
ey in
dic
ato
rs f
or
main
tenance
Report
ing to
senio
r m
ngm
t on
Com
munic
atio
n
on
sh
ore
/
Superv
isio
n
Defined life
rep
air
s
Main
tenance
ba
sic
s
main
t syste
m
evalu
ation
Measuring q
ualit
y
of m
ain
tenance
De
ferr
als
Revie
w o
f IC
P
recom
mendatio
ns
Tech / S
upv
Com
pete
nce
Measuring
com
plia
nce w
ith
Corr
ective
main
tenance
Main
t. R
ecord
ing
Backlo
gs
Main
tenance o
f
SC
E's
FIXED INSTALLATION RED TRAFFIC LIGHT RANKING
0
10
20
30
40
50
60
70
Main
tenance
of
SC
E's
Ba
cklo
gs
Defe
rrals
Revi
ew
of I
CP
reco
mm
endatio
ns
Measu
ring
com
plia
nce
with
Com
munic
atio
n
onsh
ore
/ o
ffsh
ore
Corr
ect
ive
main
tenance
Measu
ring q
ualit
y
of m
ain
tenance
Main
tenance
ba
sics
Defin
ed li
fe r
epairs
Report
ing to
senio
r m
ngm
t on
Ke
y in
dic
ato
rs f
or
main
tenance
Superv
isio
n
ma
int
syst
em
eva
luatio
n
Tech
/ S
upv
Com
pete
nce
Main
t. R
eco
rdin
g

The two best performing elements in terms of highest number of greens, andlowest number of combined red and ambers were reporting to senior managementand key indicators for maintenance effectiveness, having the highest number ofgreens and lowest number of reds and ambers.
Amber traffic light ranking for fixed installations show in Figure A3.26 givesbacklogs and maintenance of SCEs with the highest scores. The third and fourthranked elements, maintenance recording and technical supervision/competence,were based ambers with only one red assigned in each case.
Figure A3.25 Fixed installation amber traffic light ranking
The above ranking of the top four elements for both red and amber traffic lights reflectsthe performance of all installation types combined. However, for fixed installations alonereview of ICP recommendations is ranked fourth rather then correctives.
A3.4 Issues behind areas of poor performance
This section is based on the HSL analysis of inspection reports5. The template elementsdiscussed below are the most poorly performing in relation to assignation of red andamber traffic lights throughout the inspection programme. They are common to bothfixed and floating production installations, and to a lesser extent mobiles. The issues arethose occurring most frequently across the inspection reports.
A3.4.1 Maintenance of safety-critical elements and measuring compliancewith performance standards
Work orders (WO) were found to contained a statement of, or reference to, therelevant SCE performance standard (PS) in slightly less than 50% of the installationsand acceptance criteria for function tests in just below 60% of the installationsinspected. Failure to meet a PS was recorded on MMS but the amount of informationentered on the system was often insufficient quality and detail to be of use.
65 of 71 pagesKey Programme 3: Asset Integrity Programme
Health and Safety Executive
FIXED INSTALLATION AMBER TRAFFIC LIGHT RANKING
0
10
20
30
40
50
60
70
Main
t. R
ecord
ing
Main
tenance o
f
SC
E's
Back
logs
Te
ch
/ S
up
v
Com
pete
nce
Corr
ectiv
e
main
tenance
main
t syste
m
eva
luatio
n
Superv
isio
n
Measu
ring
com
plia
nce
with
Defin
ed li
fe r
epairs
Main
tenance
basi
cs
Com
munic
atio
n
onshore
/ o
ffshore
Defe
rrals
Revie
w o
f IC
P
reco
mm
endatio
ns
Measu
ring q
ualit
y
of m
ain
tenance
Report
ing to
senio
r m
ngm
t on
Key indic
ato
rs for
main
tenance

The review and implementation of risk controls and specification ofcontingency/mitigation measures occurred on the minority of installationsinspected. Formal review processes involving onshore TAs were not always inplace. The generic nature of performance standards, which were not measurableor auditable, in some cases prevented specification of clear and achievablefunction test criteria.
A3.4.2 Backlog
The computerised maintenance management systems in use differ, with somesystems allowing a window for implementation rather than a specific date afterwhich a backlog is raised. The window was typically one month but was oftenrelated to the maintenance intervals. The latter specification can result ininappropriately long ‘windows’ for critical equipment.
Reporting systems were found to measure performance in different ways withsome systems reporting the number of outstanding work orders rather than actualhours, thus causing distortion of backlog figures.
Backlog levels ranged from approximately 150 hours to a worst case of 26 000hours. The maximum figure quoted covered non-routine maintenance only with thetotal backlog (including planned maintenance) higher still.
The split between safety-critical and non-safety-critical planned maintenance wasnot always clearly defined. An example was seen of 60 000 hours of which 15 000hours related to safety-critical maintenance (planned and corrective). This datacovered seven installations including NUIs but was being managed under a singlemaintenance management system.
The majority of installations prioritised maintenance on safety-critical equipment.However, in some cases, lower priority safety-critical corrective maintenance(eg fabric maintenance, emergency light fittings etc) was not being liquidatedeffectively.
Separation of inspection management from planned maintenance was common,potentially gave a distorted view of backlog. For example, outstanding inspection ofEX equipment was not included in backlog figures but in inspection data, whichwas not reported as part of the MMS.
There were examples of maintenance deferrals with questionable justificationleading to reduced backlog figures.
For non-routine corrective maintenance, generally all outstanding work wasconsidered as backlog. Reactive (corrective) work often appeared to be managedat the expense of preventative maintenance. Where breakdowns were rectifiedimmediately they were not included in maintenance management data, with onlycorrective backlog being reported. This gave a distorted picture of the reliability ofthe plant.
Common causes
Lack of bed space was identified as a significant cause of backlogs on a largenumber of installations. The situation could also be exacerbated by project andconstruction work resulting in competing demands for very limited bed space.Another major issue was the lack of access to equipment due to the pressure tocontinue production. Backlog, including safety-critical work (eg ESDV tests) andremedial work resulting from corrosion damage reports, required shutdown to
66 of 71 pagesKey Programme 3: Asset Integrity Programme
Health and Safety Executive

complete. Management of work and prioritisation of tasks during scheduledshutdown was also identified as a problem area. On some installations, shutdownhad been delayed resulting in increased backlog.
A number of installations reported difficulties in recruitment and/or retention ofexperienced technicians (mechanical, electrical, instrumentation). Companies weretherefore compelled to employ less experienced technicians. Completion of workorders took longer than planned, due to the need for supervision of new personnel.As a result, rates of backlog liquidation were reduced.
Misalignment of the tour patterns of core crew (2 weeks on, 3 weeks off) andmaintenance support team (2 weeks on, 2 weeks off) was considered to becausing difficulties on some installations.
Lack of planning and prioritisation or effective management of backlog in correctivemaintenance was reported. Increases in corrective maintenance, due to ageingequipment, were also noted on some installations.
Backlog reduction measures
Campaign maintenance appeared to be used extensively as a means of reducingbacklog. Some dutyholders expressed reservations about the effectiveness of thismethod, as campaign teams tended to lack familiarity with the installation. Inaddition, problems with bed space and a high handover to core staff of unfinishedwork orders were experienced.
Discrete work programs in areas such as ex inspection were, however, regarded aseffective on some installations.
Several companies are moving away from campaign maintenance as teams havebeen seen to pick off ‘easy targets’ and at the same time tie up core personnel.The new strategy is a ‘spread out’ campaign crew that completes work orders andat the same time develops platform competence, enabling them to carry out morecomplex tasks without supervision.
Other methods included a concerted effort, both onshore and offshore, to reducebacklog by the provision of flotels, appointment of additional supervision andtechnicians and dedicated backlog teams.
A number of dutyholders recognised that backlog could be reduced by improvementsin planning and scheduling. Proposals for software tools, pilot schemes, risk-basedwork selection, workshops and additional training have been described. Root causeanalysis of major plant failures was also proposed to prevent ‘fire-fighting’.
A number of installations had recently upgraded their computerised maintenancemanagement systems. This involved the transfer of numerous plannedmaintenance routines. Rationalisation and removal of duplicate procedures haveresulted in significant reductions in backlog work orders in some cases.
Comparison by installation type
There were significant variations in the levels of backlog on fixed installations. Withsome exceptions, backlog numbers on the ‘amber/red’ installations appeared to bereducing slowly, but levels remained high.
Backlog levels on the floating production, storage and offloading vessels (FPSOs)also varied. Red/amber traffic lights were generally assigned where backlog levelsremained static due to lack of targeted resources.
67 of 71 pagesKey Programme 3: Asset Integrity Programme
Health and Safety Executive

With the exception of one installation, backlog levels on the mobile units inspectedwere low. Staff appeared to be well aware of backlog levels, which were discussedregularly. Maintenance management system on one mobile unit displayed alloutstanding maintenance activities every time an individual logged onto the system.Backlogs were also reviewed monthly by senior staff and additional resourcesallocated where required. The amber traffic light resulted from a postponement ofpreventative maintenance routines in order to undertake repair and survey work.Management were aware and appeared to be taking appropriate action.
A3.4.3 Deferrals
Deferral procedures for safety-critical elements (SCE) appeared to be wellunderstood, which was not always the case for non-safety-critical items.
Deferral levels ranged from zero to worst cases of 196, 153 and 139 WOs with themajority of installations reporting less than 40 items of deferred work.
A trend is difficult to determine but records indicated that levels were reducing orwere consistently low. Company policy of strong challenges from onshore technicalauthority discouraged requests for deferrals on some installations.
Deferrals were increasing on other installations due to, for example:
n delays in planned shutdown;n competing demands (such as project work) during the shutdown period;n adverse weather conditions (preventing or reducing time on installation).
The split between deferral of safety-critical and other work was not evident in anumber of cases. Some installations differentiated between deferrals of plannedand corrective maintenance, others did not allow deferral of reactive work.
Planned shutdowns were generally the focus for planning and executing deferredmaintenance activities.
Authorisation
Where green ‘traffic lights’ have been allocated, deferral of safety-critical work wasgenerally authorised by onshore technical authorities, with the involvement of theindependent competent person, where required. This was not, however, alwaysimplicit in the deferrals procedure. Cases were noted where deferrals were not sentto ICP, who should have been involved (eg ESDV’s and PSV’s).
On a number of installations, the authorisation procedure was dependent upon thecategory of the item in question. Offshore authorisation was permitted for lowercategory deferments or non-safety-critical items. An area of concern related todecisions to defer tests being taken at the wrong level on some installations.
Additional issues
Some installations recorded uncompleted maintenance (during shutdown orcampaign maintenance) as deferred work items, instead of backlog. This processled to artificially low backlogs, which do not reflect a ‘true’ backlog status. Deferralswere issued to bring the work into line with the next scheduled shutdown or visit toplatform. Concern was expressed over perceived pressure to defer safety-criticalequipment maintenance during shutdown due to the large ‘man hour’ demandfrom project work.
68 of 71 pagesKey Programme 3: Asset Integrity Programme
Health and Safety Executive

It was felt that submission of deferral requests on the maintenance ‘due date’indicated a pressure to prevent non-compliances rather than assess each request(and particular piece of equipment) on its merits.
Although generally required by the deferral procedures, evidence of riskassessment and identification of additional measures was limited in some cases. Inaddition, identified measures were not always implemented following deferrals(eg increases in inspection frequency).
The competence of staff carrying out risk assessments was unclear and some TAswere not trained in risk assessment. On other installations, no formal disciplineadvice was available for input to RAs. The deferral procedure adopted by onedutyholder failed to assess the cumulative risks arising from multiple safety-criticalequipment failures. Operational risk assessments were looked at in isolation.
It was found on one installation that, where there was no history of pastperformance, it was assumed that the SCE in question had passed the last threeassurance routines. Therefore the perceived risk factor defaulted to a lower value.In addition, subsequent to approval, the time period for the deferral could bealtered.
Recording of deferrals
As with backlog, there is no single method across the industry of recording andmanaging deferrals. Some dutyholders recorded deferred items within backlogfigures, others separated them out. Tracking of deferrals and their managementand review by senior management was in some cases used as a KPI. Where targetdates are moved from deferred equipment it is considered essential that there ismanagement oversight.
Trigger point
Many of the installations reported no formal action date for the consideration ofdeferral. In some cases, this was due to consistently low levels of deferredmaintenance. The trigger point for action on deferrals varied across dutyholders.
Comparison by installation type
Deferral procedures (and allocated traffic lights) differed fairly significantly throughoutthe fixed installations and it was therefore difficult to determine a trend. Deferralprocedures (and allocated traffic lights) on FPs appeared to be improving over time.
Mobile units in general had very low deferral rates. As a result of this, someoperators did not have a formal system in place to record the process involved inthe deferral of maintenance. Where maintenance of a SCE was deferred (drillingprogramme at a critical point, for example), the majority of dutyholders carried outrisk assessment and introduced additional safety measures, where required.
A3.4.4 Corrective maintenance
Issues such as insufficient staff and bed space were frequently raised ascontributing factors to the issues related to corrective maintenance. These arecommon to issues in other template elements including backlog and deferrals.
Consultation with onshore TAs and provision of technical support was patchy.Formal procedures for initiating risk assessment were absent in several casesleading to absence of or inadequate implementation of mitigation measures andadditional barriers.
69 of 71 pagesKey Programme 3: Asset Integrity Programme
Health and Safety Executive

The level of breakdown appeared to be a primary problem. This impacted on theoverall ability to manage planned maintenance. An additional issue related toreporting only corrective backlog rather than ongoing levels of breakdown. Thisgave a distorted picture of the reliability of the plant and the level of maintenanceresource required to keep it running and safe.
A3.5 General issues
A3.5.1 Communication
Figure A3.26 shows the management system matrix ranked by the number of redand amber traffic lights with no weighting for traffic light colour. Poorestperformance in relation to the number of reds and ambers assigned is shown atthe top of the matrix with worst performing elements (again in terms of reds andambers) ranked from left (poor) to right (good).
Each numbered column to the left of the matrix indicates a company, with allinstallations inspected identified. This illustrates the variation in performance withincompanies of different types. It does not include all companies included in theprogramme as several had only a single installation inspected.
Overall, reporting to senior management on integrity status and key indicators ofmaintenance system effectiveness performed best and maintenance of SCEs andbacklog performed worst.
Figure A3.26 Matrix ranked by red and amber management system traffic lights
70 of 71 pagesKey Programme 3: Asset Integrity Programme
Health and Safety Executive

Colour coding for the left-hand columns is as follows:
International companies
In the international company category a wide variation in performance can be seenwithin individual companies. Performance within a particular organisation can rangefrom very good to poor (columns 1, 2, 3, 5, 6, 7, 9) or, grouped over a particularpart of the matrix (columns 4, 8, 10).
Within the integrated services category (column 12; a single company) a singleinstallation accounted for the two worst performing traffic lights. The second, betterperforming inspection was carried out to follow up red issues arising in the initialinspection. The level of improvement can be clearly seen.
The best performing installation in this category, which was one of the bestperforming overall, is an older platform with low production system pressures andrates. Within the ‘small lean’ company category (columns 13 to 15) performancerange is smaller with pairs of installations grouped closer together.
Columns 16 show results for mobile installations covering a range of companies.While mobiles generally performed better than other categories a wide variation inperformance can be seen between them.
Published by the Health and Safety Executive 11/07
Health and Safety Executive
71 of 71 pages
INTERNATIONAL
INTEGRATED SERVICES
SMALL LEAN
DRILLING


Health and Safety Executive
Key Programme 3Asset Integrity Programme
2 of 27 pages