multicontaminant air pollution in chinese cities - who.int · lijian han,a weiqi, zhou a steward ta...
TRANSCRIPT
Bull World Health Organ 2018;96:233–242E | doi: http://dx.doi.org/10.2471/BLT.17.195560
Research
233
Multicontaminant air pollution in Chinese citiesLijian Han,a Weiqi Zhou,a Steward TA Pickett,b Weifeng Lia & Yuguo Qiana
IntroductionAir pollution in cities is a major concern worldwide, irre-spective of a country’s level of development. In high-income countries, air quality has improved substantially since the 1970s; however, the adverse health effects of exposure to relatively low-level pollution remains a public concern.1 In contrast, air quality in some middle- and low-income coun-tries, such as China and India, has seriously deteriorated.2 Before the 1920s, the main cause of urban air pollution in high-income countries was the rapid spread of coal-fired in-dustry during the second phase of the Industrial Revolution. The major contaminants produced by coal combustion are particulate matter and sulfur dioxide (SO2). After the1920s, a new source of air pollution emerged with the widespread use of the automobile, which emits particulate matter, nitrogen dioxide (NO2), lead and other contaminants. However in some middle- and low-income countries, e.g. China, the de-velopment of coal-fired industries and increased automobile use have overlapped, which has resulted in the emission of a complex mix of air contaminants.3,4
Most studies of the health effects of air pollution have focused on individual contaminants, such as particulate matter, NO2, SO2, ozone (O3) and carbon monoxide, with each considered to have an independent impact.5–7 However, in reality the urban atmosphere is never confronted with a single contaminant but is actually exposed to a complex mix of different contaminants at varying times of the day and year. Consequently, people are more likely to be exposed to a mixture of contaminants than to a single substance, the resultant impact on human health can be highly varied.8 For instance, some contaminants (e.g. NO2 and O3) affect the respiratory system, some (e.g. particulate matter) affect the circulatory system and cause heart disease and others (e.g. SO2) affect the skin and mucous membranes. Although few
epidemiological studies have looked at the combined effect of several air contaminants, it can be assumed that they will have an impact on different parts of human body. For example, the combination of NO2 and particulate matter pollution will affect both respiratory and cardiovascular systems.5,6 As it can lead to these complex conditions, exposure to multicon-taminant air pollution is important and should be quantified, especially in rapidly urbanizing developing countries where mixtures of contaminants are common.4,9
Previous research has paid particular attention to un-derstanding how specific contaminants affect public health in developing countries. Although important, this approach may underestimate the actual impact of urban air pollution on public health. In fact, there have been calls for a shift from a single-contaminant to a multicontaminant approach to countering the health effects of air pollution.5 The aims of this study were: (i) to document the mixture of air contami-nants in Chinese cities both annually and diurnally; (ii) to determine the proportion of the urban population affected by multicontaminant air pollution; and (iii) to investigate the relationship between the size of the urban population and the frequency of occurrence of high levels of multicontaminant air pollution.
MethodsWe obtained data on air quality for 155 cities (including all 31 provincial capitals and 124 major prefectural cities) from China’s urban air quality monitoring network, which reports concentrations of air contaminants under the newly upgraded ambient air quality standard GB3095–2012. For this study, we used hourly concentrations of fine particu-late matter less than or equal to 2.5 μm in diameter (PM2.5), coarse particulate matter with a diameter between 2.5 and 10 μm (PM10), NO2, SO2 and O3 for the whole of 2014. To
Objective To investigate multicontaminant air pollution in Chinese cities, to quantify the urban population affected and to explore the relationship between air pollution and urban population size.Methods We obtained data for 155 cities with 276 million inhabitants for 2014 from China’s air quality monitoring network on concentrations of fine particulate matter measuring under 2.5 μm (PM2.5), coarse particulate matter measuring 2.5 to 10 μm (PM10), nitrogen dioxide (NO2), sulfur dioxide (SO2) and ozone (O3). Concentrations were considered as high, if they exceeded World Health Organization (WHO) guideline limits.Findings Overall, 51% (142 million) of the study population was exposed to mean annual multicontaminant concentrations above WHO limits – east China and the megacities were worst affected. High daily levels of four-contaminant mixtures of PM2.5, PM10, SO2 and O3 and PM2.5, PM10, SO2 and NO2 occurred on up to 110 days in 2014 in many cities, mainly in Shandong and Hebei Provinces. High daily levels of PM2.5, PM10 and SO2 occurred on over 146 days in 110 cities, mainly in east and central China. High daily levels of mixtures of PM2.5 and PM10, PM2.5 and SO2, and PM10 and SO2 occurred on over 146 days in 145 cities, mainly in east China. Surprisingly, multicontaminant air pollution was less frequent in cities with populations over 10 million than in smaller cities.Conclusion Multicontaminant air pollution was common in Chinese cities. A shift from single-contaminant to multicontaminant evaluations of the health effects of air pollution is needed. China should implement protective measures during future urbanization.
a State Key Laboratory of Urban and Regional Ecology, Research Centre for Eco-Environmental Sciences, Chinese Academy of Sciences, Beijing 100085, China.b Cary Institute of Ecosystem Studies, Millbrook, United States of America. Correspondence to Weiqi Zhou (email: [email protected]).(Submitted: 11 April 2017 – Revised version received: 2 November 2017 – Accepted: 23 November 2017 – Published online: 5 February 2018 )
Research
Bull World Health Organ 2018;96:233–242E| doi: http://dx.doi.org/10.2471/BLT.17.195560234
ResearchMulticontaminant air pollution in China Lijian Han et al.
assess pollution levels and their poten-tial impact on public health, we used guideline values for annual and daily ambient air quality provided by the World Health Organization (WHO; Table 1).10 We averaged hourly con-centrations to obtain annual means for all contaminants, 24-hour means for PM2.5, PM10 and SO2 and 8-hour means for O3. For the NO2 concentra-tion, we retained the hourly values. Finally, we determined how frequently annual and daily multicontaminant air pollution due to various combinations of three, four and five contaminants (Table 2; available at: http://www.who.int/bulletin/volumes/96/4/17-195560) exceeded the values in Table 1 for individual substances. We obtained the size of the population in each of the 155 cities, as reported in the 2010 census, from the National Bureau of Statistics of China.11 In total, these cities
accounted for 41.2% of China’s urban population in 2010.
The main variable of interest in our study was exposure to a high level of multicontaminant air pollution, which was defined as occurring when the con-centration of a contaminant exceeded the relevant WHO value in Table 1. Annual exposure to multicontaminant air pollution was assessed for combi-nations of two or three contaminants and daily exposure was assessed for combinations of two, three, four or five contaminants (Table 2). To investigate the impact of urbanization on air pol-lution, we determined whether there was a correlation between the size of the urban population and the propor-tion of days in 2014 during which the concentration of specific contaminants exceeded WHO guideline values. For this analysis, cities were divided into five groups by population size,
according to China’s new urban size standard:12 (i) less than 0.5 million; (ii) 0.5 to less than 1 million; (iii) 1 to less than 5 million; (iv) 5 to less than 10 million; and (v) 10 million or more. The correlation between the population size and the percentage of days in 2014 with a high level of multicontaminant air pollution was determined using nonlinear regression analysis.
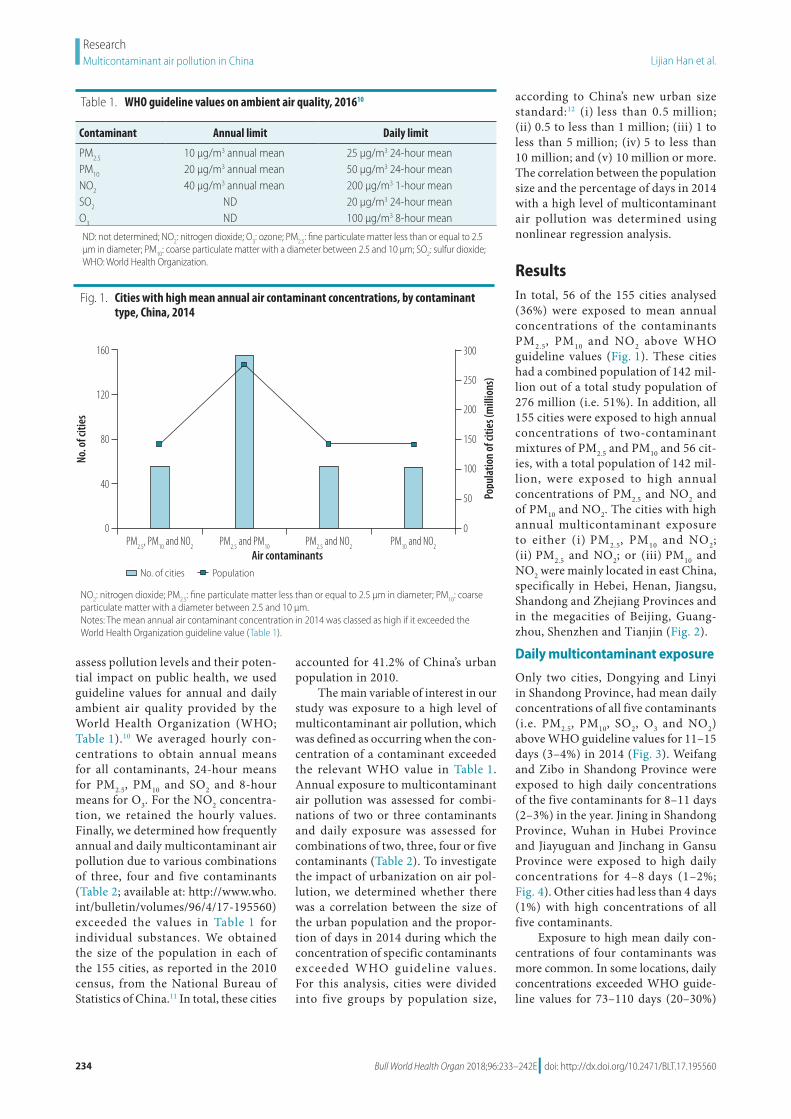
ResultsIn total, 56 of the 155 cities analysed (36%) were exposed to mean annual concentrations of the contaminants PM2.5, PM10 and NO2 above WHO guideline values (Fig. 1). These cities had a combined population of 142 mil-lion out of a total study population of 276 million (i.e. 51%). In addition, all 155 cities were exposed to high annual concentrations of two-contaminant mixtures of PM2.5 and PM10 and 56 cit-ies, with a total population of 142 mil-lion, were exposed to high annual concentrations of PM2.5 and NO2 and of PM10 and NO2. The cities with high annual multicontaminant exposure to either (i) PM2.5, PM10 and NO2; (ii) PM2.5 and NO2; or (iii) PM10 and NO2 were mainly located in east China, specifically in Hebei, Henan, Jiangsu, Shandong and Zhejiang Provinces and in the megacities of Beijing, Guang-zhou, Shenzhen and Tianjin (Fig. 2).
Daily multicontaminant exposure
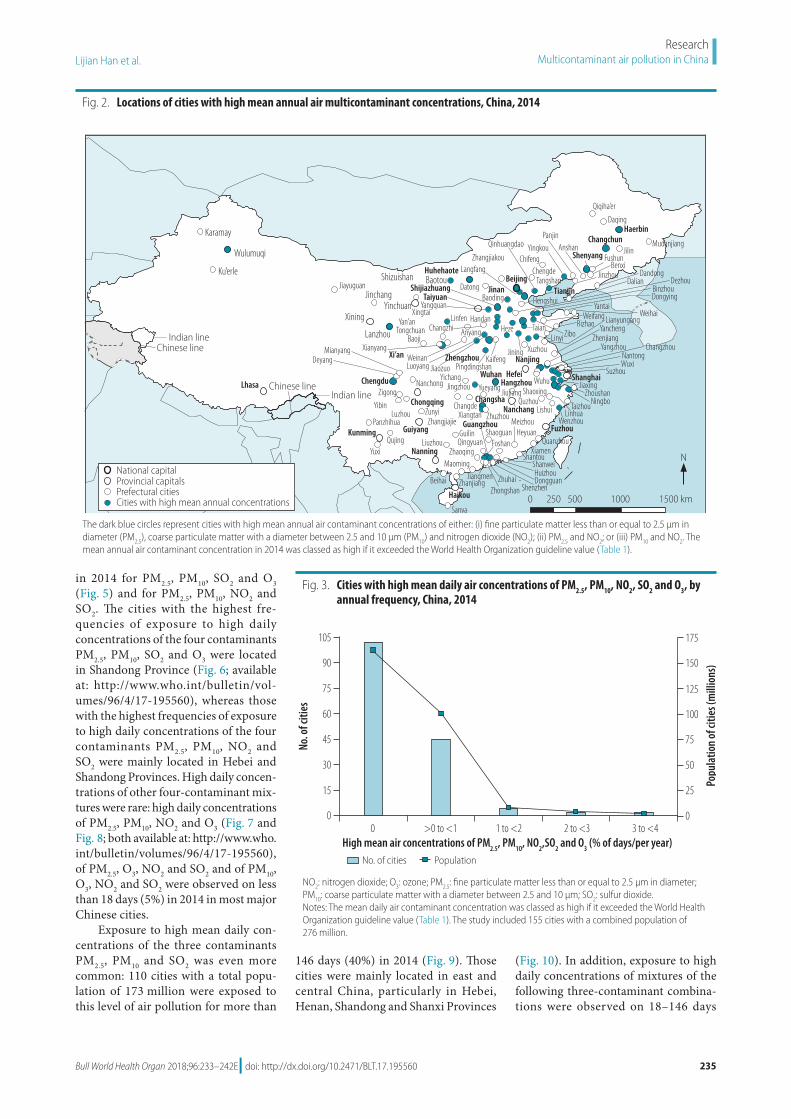
Only two cities, Dongying and Linyi in Shandong Province, had mean daily concentrations of all five contaminants (i.e. PM2.5, PM10, SO2, O3 and NO2) above WHO guideline values for 11–15 days (3–4%) in 2014 (Fig. 3). Weifang and Zibo in Shandong Province were exposed to high daily concentrations of the five contaminants for 8–11 days (2–3%) in the year. Jining in Shandong Province, Wuhan in Hubei Province and Jiayuguan and Jinchang in Gansu Province were exposed to high daily concentrations for 4–8 days (1–2%; Fig. 4). Other cities had less than 4 days (1%) with high concentrations of all five contaminants.
Exposure to high mean daily con-centrations of four contaminants was more common. In some locations, daily concentrations exceeded WHO guide-line values for 73–110 days (20–30%)
Table 1. WHO guideline values on ambient air quality, 201610
Contaminant Annual limit Daily limit
PM2.5 10 μg/m3 annual mean 25 μg/m3 24-hour meanPM10 20 μg/m3 annual mean 50 μg/m3 24-hour meanNO2 40 μg/m3 annual mean 200 μg/m3 1-hour meanSO2 ND 20 μg/m3 24-hour meanO3 ND 100 μg/m3 8-hour mean
ND: not determined; NO2: nitrogen dioxide; O3: ozone; PM2.5: fine particulate matter less than or equal to 2.5 μm in diameter; PM10: coarse particulate matter with a diameter between 2.5 and 10 μm; SO2: sulfur dioxide; WHO: World Health Organization.
Fig. 1. Cities with high mean annual air contaminant concentrations, by contaminant type, China, 2014
No. o
f citi
es
160
120
80
40
0
Popu
latio
n of
citie
s (m
illio
ns)
300
250
200
150
100
50
0
Air contaminantsNo. of cities
PM2.5
, PM10
and NO2
PM2.5
and PM10
PM2.5
and NO2
PM10
and NO2
Population
NO2: nitrogen dioxide; PM2.5: fine particulate matter less than or equal to 2.5 μm in diameter; PM10: coarse particulate matter with a diameter between 2.5 and 10 μm.Notes: The mean annual air contaminant concentration in 2014 was classed as high if it exceeded the World Health Organization guideline value (Table 1).
Bull World Health Organ 2018;96:233–242E| doi: http://dx.doi.org/10.2471/BLT.17.195560 235
ResearchMulticontaminant air pollution in ChinaLijian Han et al.
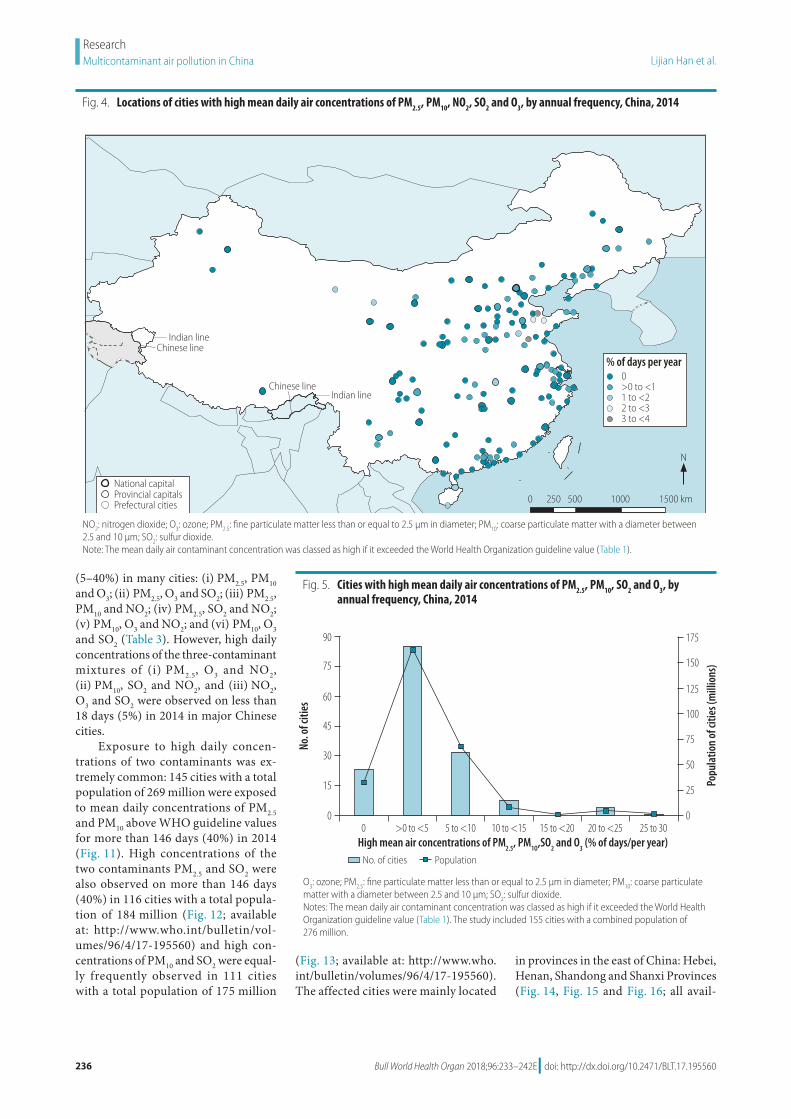
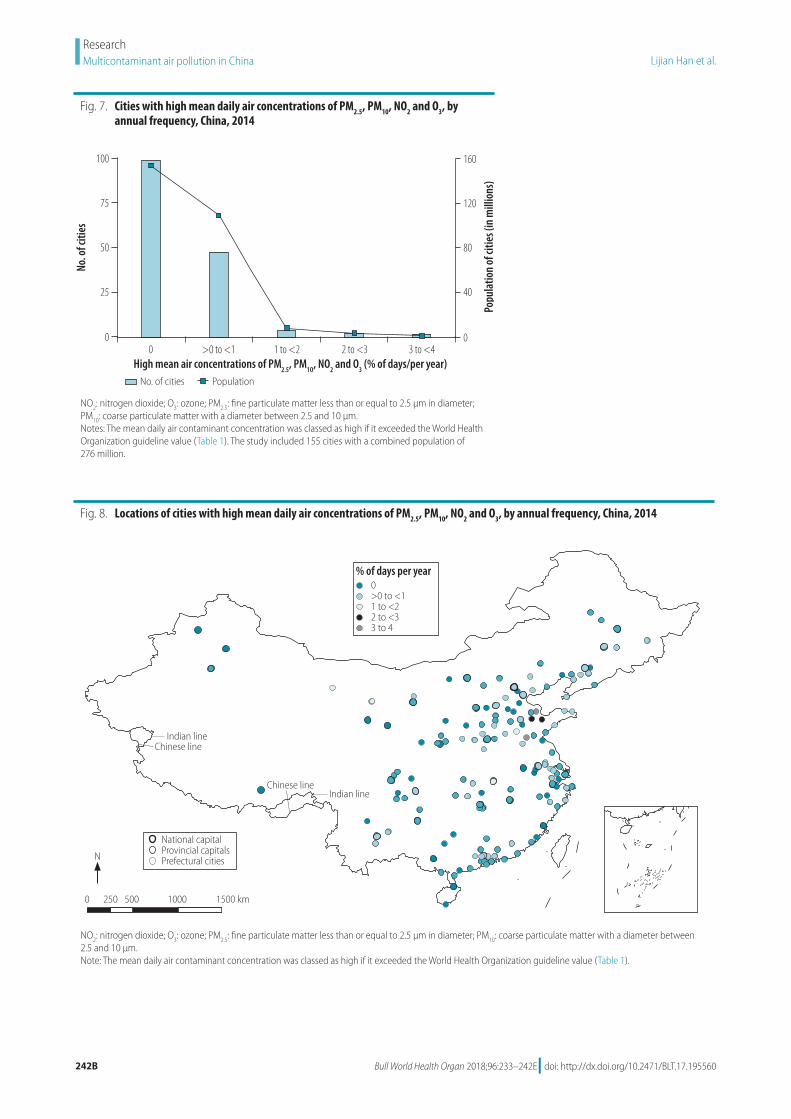
in 2014 for PM2.5, PM10, SO2 and O3 (Fig. 5) and for PM2.5, PM10, NO2 and SO2. The cities with the highest fre-quencies of exposure to high daily concentrations of the four contaminants PM2.5, PM10, SO2 and O3 were located in Shandong Province (Fig. 6; available at: http://www.who.int/bulletin/vol-umes/96/4/17-195560), whereas those with the highest frequencies of exposure to high daily concentrations of the four contaminants PM2.5, PM10, NO2 and SO2 were mainly located in Hebei and Shandong Provinces. High daily concen-trations of other four-contaminant mix-tures were rare: high daily concentrations of PM2.5, PM10, NO2 and O3 (Fig. 7 and Fig. 8; both available at: http://www.who.int/bulletin/volumes/96/4/17-195560), of PM2.5, O3, NO2 and SO2 and of PM10, O3, NO2 and SO2 were observed on less than 18 days (5%) in 2014 in most major Chinese cities.
Exposure to high mean daily con-centrations of the three contaminants PM2.5, PM10 and SO2 was even more common: 110 cities with a total popu-lation of 173 million were exposed to this level of air pollution for more than
146 days (40%) in 2014 (Fig. 9). Those cities were mainly located in east and central China, particularly in Hebei, Henan, Shandong and Shanxi Provinces
(Fig. 10). In addition, exposure to high daily concentrations of mixtures of the following three-contaminant combina-tions were observed on 18–146 days
Fig. 2. Locations of cities with high mean annual air multicontaminant concentrations, China, 2014
National capitalProvincial capitalsPrefectural citiesCities with high mean annual concentrations
Karamay
Wulumuqi
JiayuguanJinchang
Shizuishan BaotouHuhehaote
Datong
Zhangjiakou
BeijingTianjinJinan
ChengdeChifeng Shenyang
ChangchunHaerbin
FushunJilin
Mudanjiang
Daqing
Qiqiha’er
BenxiDandong
Qinhuangdao
TangshanLangfang
Yangquan
Yan’an LinfenChangzhi
HengshuiBaodingTaiyuanShijiazhuang
Dalian
AnshanPanjin
Weihai
BinzhouDezhou
Rizhao
Linyi
LianyungangYancheng
ZhenjiangYangzhou
Wuhu
WuxiHefeiWuhan
Hangzhou
NanchangChangshaChongqing
ChengduLhasa Nanchong
LuzhouYibin
Zigong
DeyangMianyang
ZunyiPanzhihua
YuxiQujing
GuilinQingyuan
Zhaoqing
HuizhouDongguan
Shenzhen
HeyuanFoshan
Zhongshan
Liuzhou
ZhanjiangJiangmen Zhuhai
ShanweiShantou
XiamenQuanzhou
FuzhouMeizhou
Maoming
Beihai
Sanya
Shaoguan
NantongChangzhou
Suzhou
ZhoushanNingboTaizhou
WenzhouLishui Linhua
QuzhouJiujiang
YichangJingzhou Yueyang
ChangdeXiangtan
ZhangjiajieZhuzhou
JiaxingShaoxing
Xuzhou
ZiboTaian
Handan
Anyang Heze
JiningKaifeng
PingdingshanJiaozuoLuoyang
TongchuanBaoji
XianyangWeinan
Xingtai WeifangYantai
Dongying
Yingkou
Jinzhou
Yinchuan
Lanzhou
Xining
Ku’erle
ZhengzhouXi’an Nanjing
Shanghai
GuiyangKunming
Nanning
Haikou
Guangzhou
Indian lineChinese line
Indian lineChinese line
0 250 500 1000 1500 km
N
The dark blue circles represent cities with high mean annual air contaminant concentrations of either: (i) fine particulate matter less than or equal to 2.5 μm in diameter (PM2.5), coarse particulate matter with a diameter between 2.5 and 10 μm (PM10) and nitrogen dioxide (NO2); (ii) PM2.5 and NO2; or (iii) PM10 and NO2. The mean annual air contaminant concentration in 2014 was classed as high if it exceeded the World Health Organization guideline value (Table 1).
Fig. 3. Cities with high mean daily air concentrations of PM2.5, PM10, NO2, SO2 and O3, by annual frequency, China, 2014
No. o
f citi
es
105
90
75
60
45
30
15
0
Popu
latio
n of
citie
s (m
illio
ns)
175
150
125
100
75
50
25
0
High mean air concentrations of PM2.5
, PM1O
, NO2,SO
2 and O
3 (% of days/per year)
No. of cities
0 >0 to <1 1 to <2 2 to <3 3 to <4
Population
NO2: nitrogen dioxide; O3: ozone; PM2.5: fine particulate matter less than or equal to 2.5 μm in diameter; PM10: coarse particulate matter with a diameter between 2.5 and 10 μm; SO2: sulfur dioxide.Notes: The mean daily air contaminant concentration was classed as high if it exceeded the World Health Organization guideline value (Table 1). The study included 155 cities with a combined population of 276 million.
Bull World Health Organ 2018;96:233–242E| doi: http://dx.doi.org/10.2471/BLT.17.195560236
ResearchMulticontaminant air pollution in China Lijian Han et al.
(5–40%) in many cities: (i) PM2.5, PM10 and O3; (ii) PM2.5, O3 and SO2; (iii) PM2.5, PM10 and NO2; (iv) PM2.5, SO2 and NO2; (v) PM10, O3 and NO2; and (vi) PM10, O3 and SO2 (Table 3). However, high daily concentrations of the three-contaminant mixtures of (i) PM2.5, O3 and NO2, (ii) PM10, SO2 and NO2, and (iii) NO2, O3 and SO2 were observed on less than 18 days (5%) in 2014 in major Chinese cities.
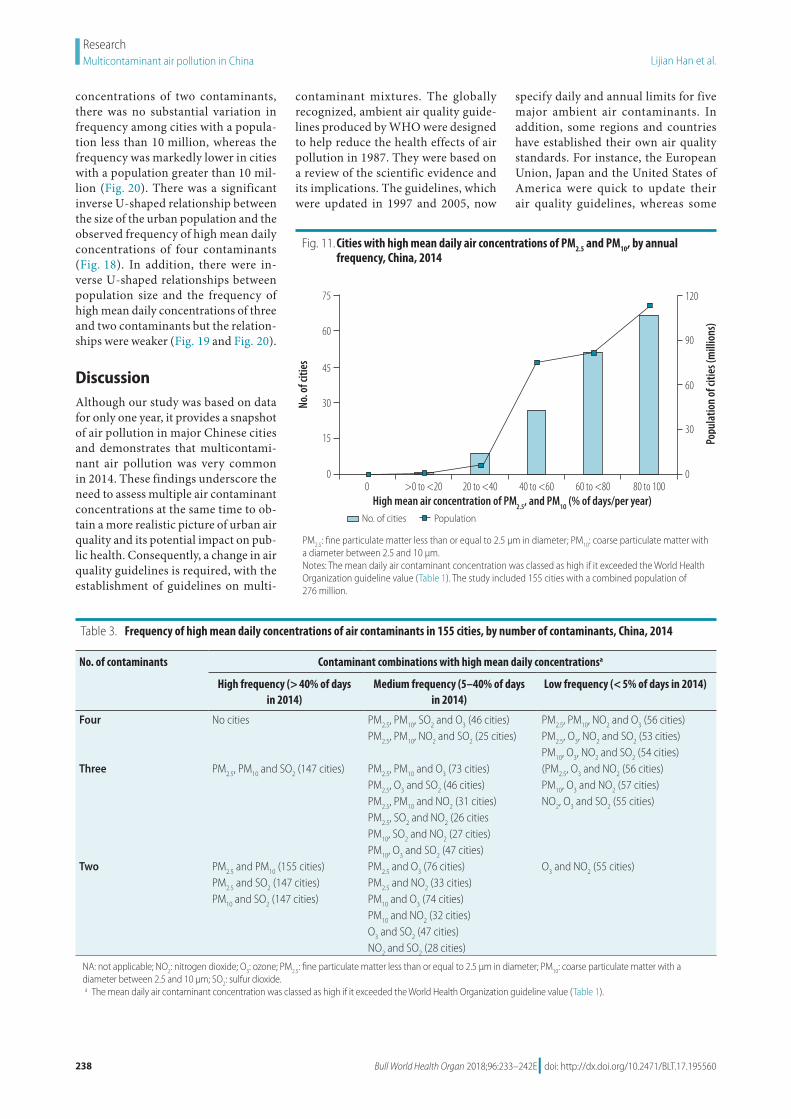
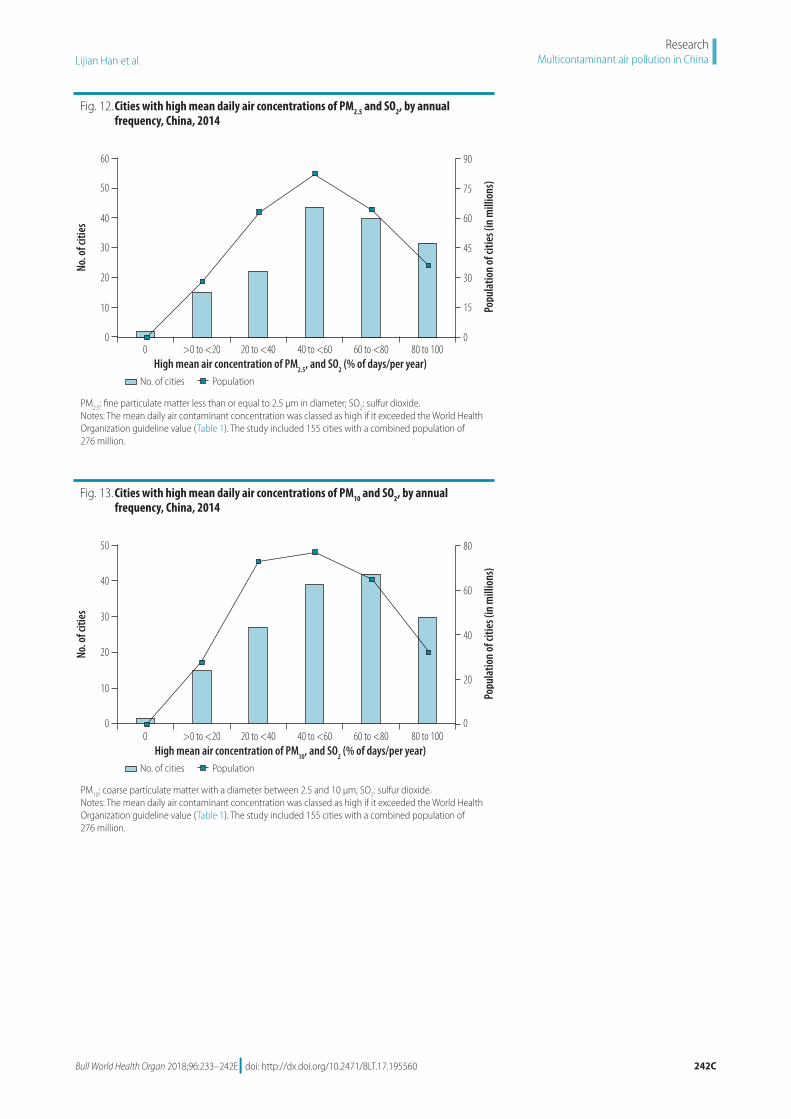
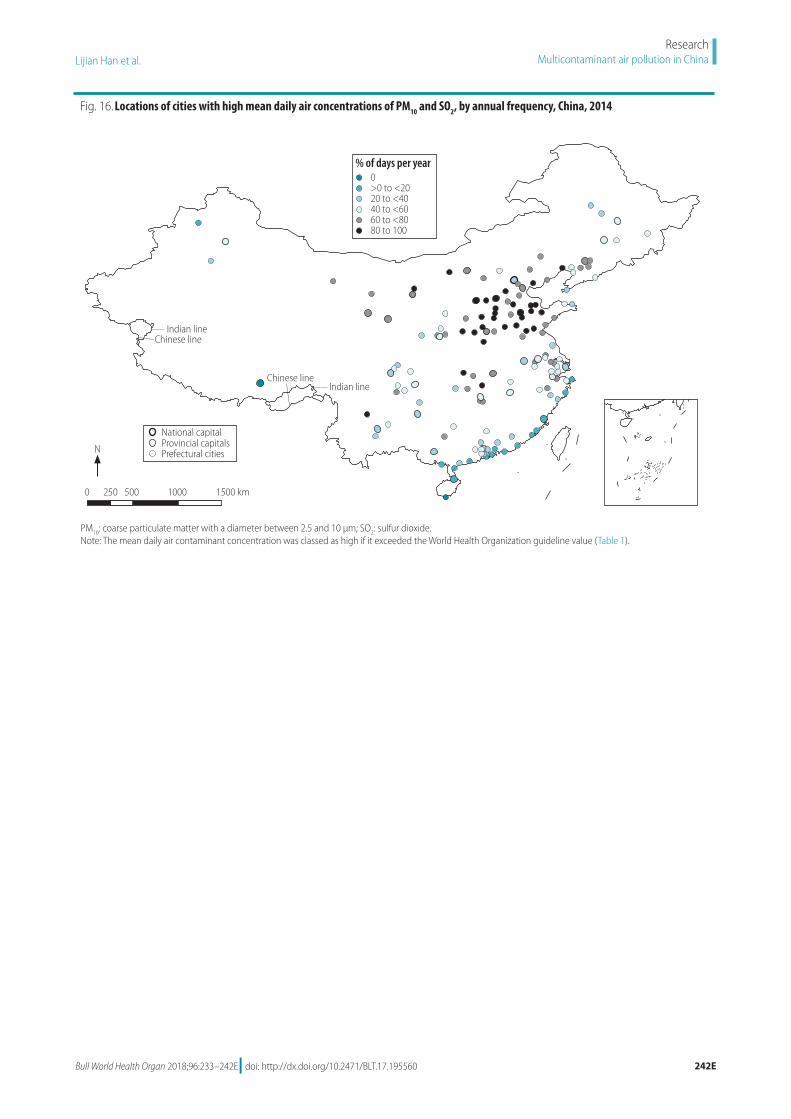
Exposure to high daily concen-trations of two contaminants was ex-tremely common: 145 cities with a total population of 269 million were exposed to mean daily concentrations of PM2.5 and PM10 above WHO guideline values for more than 146 days (40%) in 2014 (Fig. 11). High concentrations of the two contaminants PM2.5 and SO2 were also observed on more than 146 days (40%) in 116 cities with a total popula-tion of 184 million (Fig. 12; available at: http://www.who.int/bulletin/vol-umes/96/4/17-195560) and high con-centrations of PM10 and SO2 were equal-ly frequently observed in 111 cities with a total population of 175 million
(Fig. 13; available at: http://www.who.int/bulletin/volumes/96/4/17-195560). The affected cities were mainly located
in provinces in the east of China: Hebei, Henan, Shandong and Shanxi Provinces (Fig. 14, Fig. 15 and Fig. 16; all avail-
Fig. 4. Locations of cities with high mean daily air concentrations of PM2.5, PM10, NO2, SO2 and O3, by annual frequency, China, 2014
0 250 500 1000 1500 km
N
National capitalProvincial capitalsPrefectural cities
0>0 to <11 to <22 to <33 to <4
% of days per year
Indian lineChinese line
Indian lineChinese line
NO2: nitrogen dioxide; O3: ozone; PM2.5: fine particulate matter less than or equal to 2.5 μm in diameter; PM10: coarse particulate matter with a diameter between 2.5 and 10 μm; SO2: sulfur dioxide.Note: The mean daily air contaminant concentration was classed as high if it exceeded the World Health Organization guideline value (Table 1).
Fig. 5. Cities with high mean daily air concentrations of PM2.5, PM10, SO2 and O3, by annual frequency, China, 2014
No. o
f citi
es
90
75
60
45
30
15
0
Popu
latio
n of
citie
s (m
illio
ns)
175
150
125
100
75
50
25
0
High mean air concentrations of PM2.5
, PM1O
,SO2 and O
3 (% of days/per year)
No. of cities
0 >0 to <5 5 to <10 10 to <15 15 to <20 20 to <25 25 to 30
Population
O3: ozone; PM2.5: fine particulate matter less than or equal to 2.5 μm in diameter; PM10: coarse particulate matter with a diameter between 2.5 and 10 μm; SO2: sulfur dioxide.Notes: The mean daily air contaminant concentration was classed as high if it exceeded the World Health Organization guideline value (Table 1). The study included 155 cities with a combined population of 276 million.

Bull World Health Organ 2018;96:233–242E| doi: http://dx.doi.org/10.2471/BLT.17.195560 237
ResearchMulticontaminant air pollution in ChinaLijian Han et al.
able at: http://www.who.int/bulletin/volumes/96/4/17-195560).
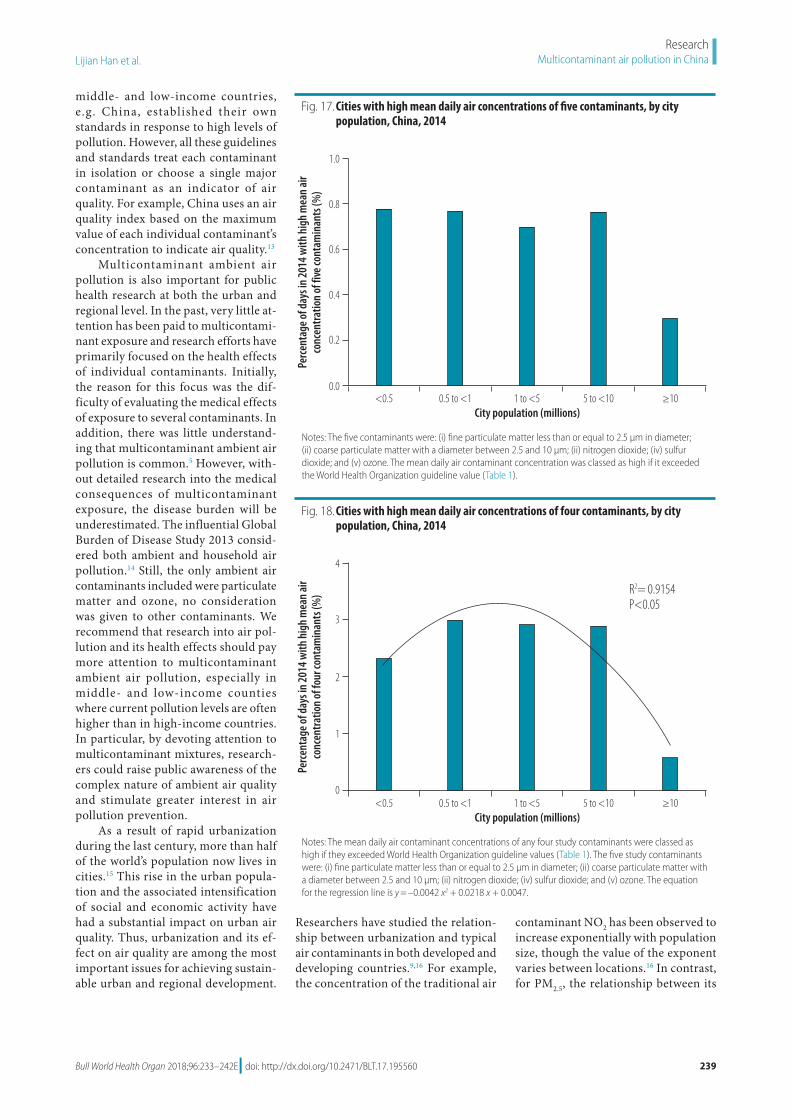
Population size
In general, daily multicontaminant air pollution was less frequent in cities with a population greater than 10 mil-lion than in smaller cities in our study. For example, the proportion of days in 2014 during which the mean daily concentrations of all five contaminants exceeded WHO guideline values was not significantly affected by population size in cities with fewer than 10 million inhabitants but the portion was sub-stantially lower in cities with a popula-tion greater than 10 million (Fig. 17). Similarly, the frequency of exposure to high mean daily concentrations of four contaminants was comparable among cities with populations ranging from 0.5 to 10 million but was lower in cities with a population less than 0.5 million or greater than 10 million (Fig. 18). This variation was also observed for high mean daily concentrations of three contaminants: the frequency was similar in cities with populations rang-
ing from 0.5 to 10 million but lower in those with a population less than
0.5 million or greater than 10 million (Fig. 19). For exposure to high daily
Fig. 9. Cities with high mean daily air concentrations of PM2.5, PM10 and SO2, by annual frequency, China, 2014
No. o
f citi
es
50
40
30
20
10
0
Popu
latio
n of
citie
s (m
illio
ns)
90
75
60
45
30
15
0
High mean air concentrations of PM2.5
, PM1O
and SO2 (% of days/per year)
No. of cities
0 >0 to <20 20 to <40 40 to <60 60 to <80 80 to 100
Population
PM2.5: fine particulate matter less than or equal to 2.5 μm in diameter; PM10: coarse particulate matter with a diameter between 2.5 and 10 μm; SO2: sulfur dioxide.Notes: The mean daily air contaminant concentration was classed as high if it exceeded the World Health Organization guideline value (Table 1). The study included 155 cities with a combined population of 276 million.
Fig. 10. Locations of cities with high mean daily air concentrations of PM2.5, PM10 and SO2, by annual frequency, China, 2014
National capitalProvincial capitalsPrefectural cities
0>0 to <2020 to <4040 to <6060 to <8080 to 100
% of days per year
Indian lineChinese line
Indian lineChinese line
0 250 500 1000 1500 km
N
PM2.5: fine particulate matter less than or equal to 2.5 μm in diameter; PM10: coarse particulate matter with a diameter between 2.5 and 10 μm; SO2: sulfur dioxide.Note: The mean daily air contaminant concentration was classed as high if it exceeded the World Health Organization guideline value (Table 1).
Bull World Health Organ 2018;96:233–242E| doi: http://dx.doi.org/10.2471/BLT.17.195560238
ResearchMulticontaminant air pollution in China Lijian Han et al.
concentrations of two contaminants, there was no substantial variation in frequency among cities with a popula-tion less than 10 million, whereas the frequency was markedly lower in cities with a population greater than 10 mil-lion (Fig. 20). There was a significant inverse U-shaped relationship between the size of the urban population and the observed frequency of high mean daily concentrations of four contaminants (Fig. 18). In addition, there were in-verse U-shaped relationships between population size and the frequency of high mean daily concentrations of three and two contaminants but the relation-ships were weaker (Fig. 19 and Fig. 20).
DiscussionAlthough our study was based on data for only one year, it provides a snapshot of air pollution in major Chinese cities and demonstrates that multicontami-nant air pollution was very common in 2014. These findings underscore the need to assess multiple air contaminant concentrations at the same time to ob-tain a more realistic picture of urban air quality and its potential impact on pub-lic health. Consequently, a change in air quality guidelines is required, with the establishment of guidelines on multi-
contaminant mixtures. The globally recognized, ambient air quality guide-lines produced by WHO were designed to help reduce the health effects of air pollution in 1987. They were based on a review of the scientific evidence and its implications. The guidelines, which were updated in 1997 and 2005, now
specify daily and annual limits for five major ambient air contaminants. In addition, some regions and countries have established their own air quality standards. For instance, the European Union, Japan and the United States of America were quick to update their air quality guidelines, whereas some
Table 3. Frequency of high mean daily concentrations of air contaminants in 155 cities, by number of contaminants, China, 2014
No. of contaminants Contaminant combinations with high mean daily concentrationsa
High frequency (> 40% of days in 2014)
Medium frequency (5–40% of days in 2014)
Low frequency (< 5% of days in 2014)
Four No cities PM2.5, PM10, SO2 and O3 (46 cities) PM2.5, PM10, NO2 and O3 (56 cities)PM2.5, PM10, NO2 and SO2 (25 cities) PM2.5, O3, NO2 and SO2 (53 cities)
PM10, O3, NO2 and SO2 (54 cities)Three PM2.5, PM10 and SO2 (147 cities) PM2.5, PM10 and O3 (73 cities) (PM2.5, O3 and NO2 (56 cities)
PM2.5, O3 and SO2 (46 cities) PM10, O3 and NO2 (57 cities)PM2.5, PM10 and NO2 (31 cities) NO2, O3 and SO2 (55 cities)PM2.5, SO2 and NO2 (26 citiesPM10, SO2 and NO2 (27 cities)PM10, O3 and SO2 (47 cities)
Two PM2.5 and PM10 (155 cities) PM2.5 and O3 (76 cities) O3 and NO2 (55 cities)PM2.5 and SO2 (147 cities) PM2.5 and NO2 (33 cities)PM10 and SO2 (147 cities) PM10 and O3 (74 cities)
PM10 and NO2 (32 cities)O3 and SO2 (47 cities)NO2 and SO2 (28 cities)
NA: not applicable; NO2: nitrogen dioxide; O3: ozone; PM2.5: fine particulate matter less than or equal to 2.5 μm in diameter; PM10: coarse particulate matter with a diameter between 2.5 and 10 μm; SO2: sulfur dioxide.a The mean daily air contaminant concentration was classed as high if it exceeded the World Health Organization guideline value (Table 1).
Fig. 11. Cities with high mean daily air concentrations of PM2.5 and PM10, by annual frequency, China, 2014
No. o
f citi
es75
60
45
30
15
0
Popu
latio
n of
citie
s (m
illio
ns)
120
90
60
30
0
High mean air concentration of PM2.5
, and PM1O
(% of days/per year)No. of cities
0 >0 to <20 20 to <40 40 to <60 60 to <80 80 to 100
Population
PM2.5: fine particulate matter less than or equal to 2.5 μm in diameter; PM10: coarse particulate matter with a diameter between 2.5 and 10 μm.Notes: The mean daily air contaminant concentration was classed as high if it exceeded the World Health Organization guideline value (Table 1). The study included 155 cities with a combined population of 276 million.
Bull World Health Organ 2018;96:233–242E| doi: http://dx.doi.org/10.2471/BLT.17.195560 239
ResearchMulticontaminant air pollution in ChinaLijian Han et al.
middle- and low-income countries, e.g. China, established their own standards in response to high levels of pollution. However, all these guidelines and standards treat each contaminant in isolation or choose a single major contaminant as an indicator of air quality. For example, China uses an air quality index based on the maximum value of each individual contaminant’s concentration to indicate air quality.13
Multicontaminant ambient air pollution is also important for public health research at both the urban and regional level. In the past, very little at-tention has been paid to multicontami-nant exposure and research efforts have primarily focused on the health effects of individual contaminants. Initially, the reason for this focus was the dif-ficulty of evaluating the medical effects of exposure to several contaminants. In addition, there was little understand-ing that multicontaminant ambient air pollution is common.5 However, with-out detailed research into the medical consequences of multicontaminant exposure, the disease burden will be underestimated. The influential Global Burden of Disease Study 2013 consid-ered both ambient and household air pollution.14 Still, the only ambient air contaminants included were particulate matter and ozone, no consideration was given to other contaminants. We recommend that research into air pol-lution and its health effects should pay more attention to multicontaminant ambient air pollution, especially in middle- and low-income counties where current pollution levels are often higher than in high-income countries. In particular, by devoting attention to multicontaminant mixtures, research-ers could raise public awareness of the complex nature of ambient air quality and stimulate greater interest in air pollution prevention.
As a result of rapid urbanization during the last century, more than half of the world’s population now lives in cities.15 This rise in the urban popula-tion and the associated intensification of social and economic activity have had a substantial impact on urban air quality. Thus, urbanization and its ef-fect on air quality are among the most important issues for achieving sustain-able urban and regional development.
Researchers have studied the relation-ship between urbanization and typical air contaminants in both developed and developing countries.9,16 For example, the concentration of the traditional air
contaminant NO2 has been observed to increase exponentially with population size, though the value of the exponent varies between locations.16 In contrast, for PM2.5, the relationship between its
Fig. 17. Cities with high mean daily air concentrations of five contaminants, by city population, China, 2014
Perc
enta
ge o
f day
s in
2014
with
hig
h m
ean
air
conc
entra
tion
of fi
v e co
ntam
inan
ts (%
)
1.0
0.8
0.6
0.4
0.2
0.0
City population (millions)<0.5 0.5 to <1 1 to <5 5 to <10 ≥10
Notes: The five contaminants were: (i) fine particulate matter less than or equal to 2.5 μm in diameter; (ii) coarse particulate matter with a diameter between 2.5 and 10 μm; (ii) nitrogen dioxide; (iv) sulfur dioxide; and (v) ozone. The mean daily air contaminant concentration was classed as high if it exceeded the World Health Organization guideline value (Table 1).
Fig. 18. Cities with high mean daily air concentrations of four contaminants, by city population, China, 2014
Perc
enta
ge o
f day
s in
2014
with
hig
h m
ean
air
conc
entra
tion
of fo
ur co
ntam
inan
ts (%
)
4
3
2
1
0
City population (millions)<0.5 0.5 to <1 1 to <5 5 to <10 ≥10
R2= 0.9154P<0.05
Notes: The mean daily air contaminant concentrations of any four study contaminants were classed as high if they exceeded World Health Organization guideline values (Table 1). The five study contaminants were: (i) fine particulate matter less than or equal to 2.5 μm in diameter; (ii) coarse particulate matter with a diameter between 2.5 and 10 μm; (ii) nitrogen dioxide; (iv) sulfur dioxide; and (v) ozone. The equation for the regression line is y = –0.0042 x2 + 0.0218 x + 0.0047.

Bull World Health Organ 2018;96:233–242E| doi: http://dx.doi.org/10.2471/BLT.17.195560240
ResearchMulticontaminant air pollution in China Lijian Han et al.
concentration and urban population size is much more variable across con-tinents and countries.9 In our study, we found an inverse U-shaped relationship between urban population size and the frequency of high daily concentra-tions of three contaminants, whereas other researchers have demonstrated no clear relationship. Furthermore, we discovered that a high level of mul-ticontaminant air pollution was less common in cities with a population of more than 10 million than in smaller cities, which is contrary to general expectations that larger cities would be more polluted. The likely explanation is that large cities have implemented extensive environmental protection measures and that many polluting in-dustries have been relocated to smaller cities.3 This observation casts new light on multicontaminant air pollution and its relationship to urbanization. We suggest that future research should pay more attention to the process of urbanization and its impact on mul-ticontaminant ambient air pollution, particularly in middle- and low-income countries. Our findings highlight the varied pattern of multicontaminant air pollution in Chinese cities and confirm the view that pollution in developing countries should be expected to vary greatly across both time and space. Consequently, the results of this re-search should be relevant not only to China but also to other middle- and low-income countries facing similar challenges with multicontaminant air pollution. ■
Funding: This research was supported by the National Natural Science Founda-tion of China (grant numbers 41590841 and 41771201) and the Key Research Program of Frontier Sciences, Chinese Academy of Sciences (grant number QYZDB-SSW-DQC034–2).
Competing interests: None declared.
ملخصتلوث اهلواء بفعل امللوثات املتعددة يف املدن الصينية
املتعددة يف امللوثات بفعل اهلواء تلوث بشأن الغرض االستقصاء الصني، وقياس مدى تأثر سكان احلرض، واستكشاف العالقة بني
تلوث اهلواء وحجم سكان احلرض.
نوعية رصد شبكة من 2014 لعام بيانات عىل حصلنا الطريقة اهلواء الصينية وذلك لعدد 155 مدينة يسكنها 276 مليون نسمة، وتدور البيانات حول تركيزات اجلسيامت الناعمة الدقيقة التي تقل
Fig. 19. Cities with high mean daily air concentrations of three contaminants, by city population, China, 2014
Perc
enta
ge o
f day
s in
2014
with
hig
h m
ean
air
conc
entra
tion
of th
ree c
onta
min
ants
(%)
16
12
8
4
0
City population (millions)<0.5 0.5 to <1 1 to <5 5 to <10 ≥10
R2= 0.9781P<0.05
Notes: The mean daily air contaminant concentrations of any three study contaminants were classed as high if they exceeded World Health Organization guideline values (Table 1). The five study contaminants were: (i) fine particulate matter less than or equal to 2.5 μm in diameter; (ii) coarse particulate matter with a diameter between 2.5 and 10 μm; (ii) nitrogen dioxide; (iv) sulfur dioxide; and (v) ozone. The equation for the regression line is y = –0.0184 x2 + 0.1219 x – 0.0644.
Fig. 20. Cities with high mean daily air concentrations of two contaminants, by city population, China, 2014
Perc
enta
ge o
f day
s in
2014
with
hig
h m
ean
air
conc
entra
tion
of tw
o co
ntam
inan
ts (%
)
30
20
10
0
City population (millions)<0.5 0.5 to <1 1 to <5 5 to <10 ≥10
R2= 0.9674P<0.05
Notes: The mean daily air contaminant concentrations of any two study contaminants were classed as high if they exceeded World Health Organization guideline values (Table 1). The five study contaminants were: (i) fine particulate matter less than or equal to 2.5 μm in diameter; (ii) coarse particulate matter with a diameter between 2.5 and 10 μm; (ii) nitrogen dioxide; (iv) sulfur dioxide; and (v) ozone. The equation for the regression line is y = –0.0216 x2 + 0.1086 x + 0.1266.

Bull World Health Organ 2018;96:233–242E| doi: http://dx.doi.org/10.2471/BLT.17.195560 241
ResearchMulticontaminant air pollution in ChinaLijian Han et al.
التي اخلشنة واجلسيامت ،)PM2.5( ميكرومرت 2.5 عن أقطارها يرتاوح قطرها من 2.5 إىل 10 ميكرومرت )PM10(، وثنائي أكسيد النيرتوجني )NO2(، وثنائي أكسيد الكربيت )SO2(، واألوزون )O3(. واعتربت الرتكيزات مرتفعة يف حالة جتاوزها حلدود املبادئ
التوجيهية ملنظمة الصحة العاملية.النتائج كان %51 )142 مليون نسمة( من السكان الذين شملتهم الدراسة عرضة بوجه عام لرتكيزات من امللوثات املتعددة يتجاوز
العاملية، الصحة ملنظمة املقررة احلدود السنوي حجمها متوسط وكان رشق الصني واملدن الكربى هي األماكن األكثر ترضًرا.
االستنتاج يشيع تلوث اهلواء الناتج عن امللوثات املتعددة يف املدن امللوثات تقييامت من التقييامت تغيري إىل حاجة وثمة الصينية. املنفردة إىل تقييامت للملوثات املتعددة للوقوف عىل اآلثار الصحية الناجتة عن تلوث اهلواء. وينبغي عىل الصني أن تقوم بتنفيذ التدابري
الوقائية خالل التطور احلرضي املستقبيل.
摘要中国城市多污染物空气污染目标 调查中国城市多污染物空气污染情况,以量化受影响的城市人口,并探讨城市人口规模与空气污染之间的关系。方 法 我 们 从 中 国 空 气 质 量 监 测 网 获 得了 2014 年 155 个 城 市 2.76 亿 居 民 的 数 据, 包括 2.5 μm (PM2.5) 以下的细颗粒物质、2.5 至 10 μm (PM10) 的 粗 颗 粒 物 质、 二 氧 化 氮 (NO2)、 二 氧 化硫 (SO2) 和臭氧 (O3) 浓度。如果其浓度超过世界卫生组织指南上限,会认为其过高。结果 总体而言,51% (1.42 亿)被研究人群暴露在高于世界卫生组织规定的年平均浓度的多污染物空气污染中——华东地区和特大城市受到的影响最大。在许多城市,主要集中在山东省和河北省,
2014 年中有 110 天,PM2.5、PM10、SO2、O3 和 PM2.5、PM10、SO2 和 NO2 四 种 污 染 混 合 物 的 日 均 含 量 过高。 在 110 个 城 市 中, 主 要 集 中 在 华 东 和 华 中地 区,PM2.5、PM10、SO2 日 均 含 量 过 高 的 天 数 超过 146 天。在 145 个城市中,主要集中在华东地区,PM2.5 和 PM10、PM2.5 和 SO2、PM10 和 SO2 日均含量过高的天数超过 146 天。令人惊讶的是,多污染物空气污染在 1000 万以上人口城市的发生频次比较小规模城市要少得多。结论 多污染物空气污染在中国城市很常见。评估空气污染对健康的影响需要从单一污染物向多污染物转变。中国应该在未来城市化进程中采取保护措施。
Résumé
Pollution de l’air par plusieurs contaminants dans les villes chinoisesObjectif Étudier la pollution de l’air par plusieurs contaminants dans les villes chinoises, quantifier la population urbaine touchée, et analyser la relation entre la pollution de l’air et la taille de la population urbaine.Méthodes Nous avons recueilli des données auprès du réseau de surveillance de la qualité de l’air de la Chine sur les concentrations de matières particulaires fines mesurant moins de 2,5 μm (PM2.5), de matières particulaires grossières mesurant de 2,5 à 10 μm (PM10), de dioxyde d’azote (NO2), de dioxyde de soufre (SO2) et d’ozone (O3) dans 155 villes comptant un total de 276 millions d’habitants pour l’année 2014. Les concentrations étaient considérées comme élevées lorsqu’elles dépassaient les limites indicatives fixées par l’Organisation mondiale de la Santé.Résultats En tout, 51% (142 millions) de la population étudiée a été exposée à des concentrations annuelles moyennes de plusieurs contaminants supérieures aux limites définies par l’OMS, l’est de la Chine et les mégalopoles étant les plus touchés. En 2014, des concentrations quotidiennes élevées de mélanges de quatre contaminants – PM2.5,
PM10, SO2 et O3, et PM2.5, PM10, SO2 et NO2 – ont été mesurées pendant 110 jours dans de nombreuses villes principalement situées dans les provinces du Shandong et du Hebei. Des concentrations quotidiennes élevées de PM2.5, PM10 et SO2 ont été mesurées pendant 146 jours dans 110 villes principalement situées à l’est et au centre de la Chine. Des concentrations quotidiennes élevées de mélanges de PM2.5 et PM10, PM2.5 et SO2, et PM10 et SO2 ont été mesurées pendant 146 jours dans 145 villes principalement situées à l’est de la Chine. Étonnamment, la pollution de l’air par plusieurs contaminants était moins fréquente dans les villes comptant plus de 10 millions d’habitants que dans les villes de plus petite taille.Conclusion La pollution de l’air par plusieurs contaminants s’est révélée courante dans les villes chinoises. Les évaluations des effets de la pollution de l’air sur la santé ne doivent plus tenir compte d’un seul contaminant, mais de plusieurs contaminants. Il est essentiel que la Chine mette en application des mesures de protection dans le cadre de l’urbanisation à venir.
Резюме
Многокомпонентное загрязнение воздуха в городах КитаяЦель Изучить многокомпонентное загрязнение воздуха в городах Китая, дать количественную оценку доли городского населения, находящегося под воздействием загрязненного воздуха, и изучить взаимосвязь между загрязнением воздуха и численностью городского населения.Методы Мы получили данные 155 городов с 276 миллионами жителей за 2014 год из сети мониторинга качества воздуха в Китае по концентрациям тонкодисперсных частиц размером
менее 2,5 μм (ТЧ2,5), крупнодисперсных частиц размером от 2,5 до 10 μм (ТЧ10), двуокиси азота (NO2), диоксида серы (SO2) и озона (O3). Концентрации считались высокими, если они превышали предельные величины, рекомендуемые Всемирной организацией здравоохранения (ВОЗ).Результаты В целом 51% исследуемой популяции (142 миллиона человек) подвергался воздействию среднегодовых концентраций многокомпонентных загрязнений, которые превышали
Bull World Health Organ 2018;96:233–242E| doi: http://dx.doi.org/10.2471/BLT.17.195560242
ResearchMulticontaminant air pollution in China Lijian Han et al.
рекомендуемые ВОЗ пределы, — в наибольшей степени такому воздействию подверглись Восточный Китай и мегаполисы. В 2014 году во многих городах, главным образом в провинциях Шаньдун и Хэбэй, до 110 дней наблюдались высокие среднесуточные уровни четырехкомпонентных смесей ТЧ2,5, ТЧ10, SO2 и O3 и ТЧ2,5, ТЧ10, SO2 и NO2. Высокий среднесуточный уровень ТЧ2,5, ТЧ10 и SO2 наблюдался в течение 146 дней в 110 городах, главным образом в Восточном и Центральном Китае. Высокие среднесуточные уровни смесей ТЧ2,5 и ТЧ10, ТЧ2,5 и SО2, ТЧ10 и SО2 наблюдались в течение 146 дней в 145 городах,
главным образом в Восточном Китае. Неожиданным было то, что многокомпонентное загрязнение воздуха встречалось реже в городах с населением более 10 миллионов человек, чем в небольших городах.Вывод Многокомпонентное загрязнение воздуха было распространено в городах Китая. При оценке воздействия загрязнения воздуха на здоровье необходим переход от однокомпонентного к многокомпонентному загрязнению. Китай должен принять защитные меры во время будущей урбанизации.
Resumen
Contaminación del aire con múltiples contaminantes en las ciudades chinasObjetivo Investigar la contaminación atmosférica con múltiples contaminantes en las ciudades chinas, cuantificar la población urbana afectada y explorar la relación entre la contaminación del aire y el tamaño de la población urbana.Métodos Se obtuvieron datos de 155 ciudades con 276 millones de habitantes de 2014 de la red de seguimiento de la calidad del aire de China sobre las concentraciones de partículas finas que miden menos de 2,5 μm (PM2,5), partículas gruesas que miden 2,5 a 10 μm (PM10), dióxido de nitrógeno (NO2), dióxido de azufre (SO2) y ozono (O3). Las concentraciones se consideraron altas si superaban los límites de las directrices de la Organización Mundial de la Salud (OMS).Resultados En general, el 51% (142 millones) de la población del estudio estuvo expuesta a unas concentraciones de múltiples contaminantes medias anuales por encima de los límites de la OMS: el este de China y las megaciudades se vieron más afectadas. Hasta en 110 días en 2014, hubo
altos niveles diarios de mezclas de cuatro contaminantes de PM2,5, PM10, SO2 y O3, y PM2,5, PM10, SO2 y NO2 en muchas ciudades, principalmente en las provincias de Shandong y Hebei. Hubo altos niveles diarios de PM2,5, PM10 y SO2 durante más de 146 días en 110 ciudades, principalmente en el este y el centro de China. Hubo altos niveles diarios de mezclas de PM2,5 y PM10, PM2,5 y SO2, y PM10 y SO2 durante más de 146 días en 145 ciudades, principalmente en el este de China. Sorprendentemente, la contaminación del aire con múltiples contaminantes fué menos frecuente en las ciudades con poblaciones de más de 10 millones que en las ciudades más pequeñas.Conclusión La contaminación del aire con múltiples contaminantes es habitual en las ciudades chinas. Se necesita un cambio en las evaluaciones de los efectos de la contaminación del aire en la salud de un solo contaminante a múltiples contaminantes. China debería implementar medidas de protección en futuras urbanizaciones.
References1. McNeill J. An environmental history of the twentieth-century world.
Something new under the sun. New York: W. W. Norton & Company, Inc.; 2010.2. Han L, Zhou W, Li W. City as a major source area of fine particulate (PM2.5) in
China. Environ Pollut. 2015 Nov;206:183–7. doi: http://dx.doi.org/10.1016/j.envpol.2015.06.038 PMID: 26176632
3. Han L, Zhou W, Li W. Fine particulate (PM2.5) dynamics during rapid urbanization in Beijing, 1973-2013. Sci Rep. 2016 03 31;6(1):23604. doi: http://dx.doi.org/10.1038/srep23604 PMID: 27031598
4. Wang S, Hao J. Air quality management in China: issues, challenges, and options. J Environ Sci (China). 2012;24(1):2–13. doi: http://dx.doi.org/10.1016/S1001-0742(11)60724-9 PMID: 22783610
5. Dominici F, Peng RD, Barr CD, Bell ML. Protecting human health from air pollution: shifting from a single-pollutant to a multipollutant approach. Epidemiology. 2010 Mar;21(2):187–94. doi: http://dx.doi.org/10.1097/EDE.0b013e3181cc86e8 PMID: 20160561
6. Billionnet C, Sherrill D, Annesi-Maesano I; GERIE study. Estimating the health effects of exposure to multi-pollutant mixture. Ann Epidemiol. 2012 Feb;22(2):126–41. doi: http://dx.doi.org/10.1016/j.annepidem.2011.11.004 PMID: 22226033
7. Peng J, Chen S, Lü H, Liu Y, Wu J. Spatiotemporal pattern of remotely sensed PM2.5 concentration in China from 1999 to 2011. Remote Sens Environ. 2016;174:109–21. doi: http://dx.doi.org/10.1016/j.rse.2015.12.008
8. Kampa M, Castanas E. Human health effects of air pollution. Environ Pollut. 2008 Jan;151(2):362–7. doi: http://dx.doi.org/10.1016/j.envpol.2007.06.012 PMID: 17646040
9. Han L, Zhou W, Pickett STA, Li W, Li L. An optimum city size? The scaling relationship for urban population and fine particulate (PM(2.5)) concentration. Environ Pollut. 2016 Jan;208 Pt A:96–101. doi: http://dx.doi.org/10.1016/j.envpol.2015.08.039 PMID: 26467192
10. Ambient (outdoor) air quality and health. Geneva: World Health Organization; 2016. Available from: http://www.who.int/mediacentre/factsheets/fs313/en/ [cited 2017 Nov 5].
11. Urban populations, 2010 census. Beijing: National Bureau of Statistics of China; 2017 (in Chinese). Available from: http://www.stats.gov.cn/tjsj/pcsj/rkpc/6rp/indexch.htm [cited 2017 Nov 5].
12. China’s new urban size standard. Beijing: The State Council of the People’s Republic of China; 2014 (in Chinese). Available from: http://www.gov.cn/zhengce/content/2014-11/20/content_9225.htm [cited 2017 Nov 5].
13. Technical regulation on ambient air quality index (on trial). Beijing: Ministry of Environmental Protection of the People’s Republic of China; 2012 (in Chinese). Available from: http://kjs.mep.gov.cn/hjbhbz/bzwb/jcffbz/201203/W020120410332725219541.pdf [cited 2017 Nov 5].
14. Forouzanfar MH, Alexander L, Anderson HR, Bachman VF, Biryukov S, Brauer M, et al.; GBD 2013 Risk Factors Collaborators. Global, regional, and national comparative risk assessment of 79 behavioural, environmental and occupational, and metabolic risks or clusters of risks in 188 countries, 1990-2013: a systematic analysis for the Global Burden of Disease Study 2013. Lancet. 2015 Dec 5;386(10010):2287–323. doi: http://dx.doi.org/10.1016/S0140-6736(15)00128-2 PMID: 26364544
15. World urbanization prospects. The 2011 revision. New York: Population Division, Department of Economic and Social Affairs, United Nations; 2012. Available from: http://www.un.org/en/development/desa/population/publications/pdf/urbanization/WUP2011_Report.pdf [cited 2017 Nov 30].
16. Lamsal LN, Martin RV, Parrish DD, Krotkov NA. Scaling relationship for NO2 pollution and urban population size: a satellite perspective. Environ Sci Technol. 2013 Jul 16;47(14):7855–61. doi: http://dx.doi.org/10.1021/es400744g PMID: 23763377

Bull World Health Organ 2018;96:233–242E| doi: http://dx.doi.org/10.2471/BLT.17.195560 242A
ResearchMulticontaminant air pollution in ChinaLijian Han et al.
Table 2. Combinations of contaminants evaluated, air pollution study, China, 2014
No. of contami-nants
Combinations of air contaminants
Annual concentrations evaluated
Daily concentrations evaluated
Five N/A PM2.5, PM10, NO2, SO2 and O3
Four N/A (i) PM2.5, PM10, NO2 and O3; (ii) PM2.5, PM10, SO2 and O3; (iii) PM2.5, PM10, NO2 and SO2; (iv) PM2.5, O3, NO2 and SO2; and (v) PM10, O3, NO2 and SO2
Three PM2.5, PM10 and NO2 (i) PM2.5, PM10 and O3; (ii) PM2.5, O3 and NO2; (iii) PM2.5, O3 and SO2; (iv) PM2.5, PM10 and NO2; (v) PM2.5, PM10 and SO2; (vi) PM10, SO2 and NO2; (vii) PM2.5, O3 and NO2; (viii) PM10, O3 and NO2; (ix) PM10, O3 and SO2; and (x) NO2, O3 and SO2
Two (i) PM2.5 and PM10; (ii) PM2.5 and NO2; and (iii) PM10 and NO2
(i) PM2.5 and PM10; (ii) PM2.5 and O3; (iii) PM2.5 and NO2; (iv) PM2.5 and SO2; (v) PM10 and O3; (vi) PM10 and NO2; (vii) PM10 and SO2; (viii) O3 and NO2; (ix) O3 and SO2; and (x) NO2 and SO2
N/A: not applicable; NO2: nitrogen dioxide; O3: ozone; PM2.5: fine particulate matter less than or equal to 2.5 μm in diameter; PM10: coarse particulate matter with a diameter between 2.5 and 10 μm; SO2: sulfur dioxide.
Fig. 6. Locations of cities with high mean daily air concentrations of PM2.5, PM10, SO2 and O3, by annual frequency, China, 2014
0 250 500 1000 1500 km
N
0>0 to <55 to <1010 to <1515 to <2020 to <2525 to 30
% of days per year
National capitalProvincial capitalsPrefectural cities
Indian lineChinese line
Indian lineChinese line
O3: ozone; PM2.5: fine particulate matter less than or equal to 2.5 μm in diameter; PM10: coarse particulate matter with a diameter between 2.5 and 10 μm; SO2: sulfur dioxide.Note: The mean daily air contaminant concentration was classed as high if it exceeded the World Health Organization guideline value (Table 1).
Bull World Health Organ 2018;96:233–242E| doi: http://dx.doi.org/10.2471/BLT.17.195560242B
ResearchMulticontaminant air pollution in China Lijian Han et al.
Fig. 7. Cities with high mean daily air concentrations of PM2.5, PM10, NO2 and O3, by annual frequency, China, 2014
No. o
f citi
es
100
75
50
25
0
Popu
latio
n of
citie
s (in
mill
ions
)
160
120
80
40
0
High mean air concentrations of PM2.5
, PM1O
, NO2 and O
3 (% of days/per year)
No. of cities
0 >0 to <1 1 to <2 2 to <3 3 to <4
Population
NO2: nitrogen dioxide; O3: ozone; PM2.5: fine particulate matter less than or equal to 2.5 μm in diameter; PM10: coarse particulate matter with a diameter between 2.5 and 10 μm.Notes: The mean daily air contaminant concentration was classed as high if it exceeded the World Health Organization guideline value (Table 1). The study included 155 cities with a combined population of 276 million.
Fig. 8. Locations of cities with high mean daily air concentrations of PM2.5, PM10, NO2 and O3, by annual frequency, China, 2014
0 250 500 1000 1500 km
N
0>0 to <11 to <22 to <33 to 4
% of days per year
National capitalProvincial capitalsPrefectural cities
Indian lineChinese line
Indian lineChinese line
NO2: nitrogen dioxide; O3: ozone; PM2.5: fine particulate matter less than or equal to 2.5 μm in diameter; PM10: coarse particulate matter with a diameter between 2.5 and 10 μm.Note: The mean daily air contaminant concentration was classed as high if it exceeded the World Health Organization guideline value (Table 1).
Bull World Health Organ 2018;96:233–242E| doi: http://dx.doi.org/10.2471/BLT.17.195560 242C
ResearchMulticontaminant air pollution in ChinaLijian Han et al.
Fig. 12. Cities with high mean daily air concentrations of PM2.5 and SO2, by annual frequency, China, 2014
No. o
f citi
es
60
50
40
30
20
10
0
Popu
latio
n of
citie
s (in
mill
ions
)
90
75
60
45
30
15
0
High mean air concentration of PM2.5
, and SO2 (% of days/per year)
No. of cities
0 >0 to <20 20 to <40 40 to <60 60 to <80 80 to 100
Population
PM2.5: fine particulate matter less than or equal to 2.5 μm in diameter; SO2: sulfur dioxide.Notes: The mean daily air contaminant concentration was classed as high if it exceeded the World Health Organization guideline value (Table 1). The study included 155 cities with a combined population of 276 million.
Fig. 13. Cities with high mean daily air concentrations of PM10 and SO2, by annual frequency, China, 2014
No. o
f citi
es
50
40
30
20
10
0
Popu
latio
n of
citie
s (in
mill
ions
)
80
60
40
20
0
High mean air concentration of PM10
, and SO2 (% of days/per year)
No. of cities
0 >0 to <20 20 to <40 40 to <60 60 to <80 80 to 100
Population
PM10: coarse particulate matter with a diameter between 2.5 and 10 μm; SO2: sulfur dioxide.Notes: The mean daily air contaminant concentration was classed as high if it exceeded the World Health Organization guideline value (Table 1). The study included 155 cities with a combined population of 276 million.

Bull World Health Organ 2018;96:233–242E| doi: http://dx.doi.org/10.2471/BLT.17.195560242D
ResearchMulticontaminant air pollution in China Lijian Han et al.
Fig. 14. Locations of cities with high mean daily air concentrations of PM2.5 and PM10, by annual frequency, China, 2014
0 250 500 1000 1500 km
N
National capitalProvincial capitalsPrefectural cities
Indian lineChinese line
Indian lineChinese line
020 to <4040 to <6060 to <8080 to 100
% of days per year
PM2.5: fine particulate matter less than or equal to 2.5 μm in diameter; PM10: coarse particulate matter with a diameter between 2.5 and 10 μm.Note: The mean daily air contaminant concentration was classed as high if it exceeded the World Health Organization guideline value (Table 1).
Fig. 15. Locations of cities with high mean daily air concentrations of PM2.5 and SO2, by annual frequency, China, 2014
0 250 500 1000 1500 km
N
National capitalProvincial capitalsPrefectural cities
Indian lineChinese line
Indian lineChinese line
0>0 to <2020 to <4040 to <6060 to <8080 to 100
% of days per year
PM2.5: fine particulate matter less than or equal to 2.5 μm in diameter; SO2: sulfur dioxide.Note: The mean daily air contaminant concentration was classed as high if it exceeded the World Health Organization guideline value (Table 1).
Bull World Health Organ 2018;96:233–242E| doi: http://dx.doi.org/10.2471/BLT.17.195560 242E
ResearchMulticontaminant air pollution in ChinaLijian Han et al.
Fig. 16. Locations of cities with high mean daily air concentrations of PM10 and SO2, by annual frequency, China, 2014
0 250 500 1000 1500 km
N
National capitalProvincial capitalsPrefectural cities
Indian lineChinese line
Indian lineChinese line
0>0 to <2020 to <4040 to <6060 to <8080 to 100
% of days per year
PM10: coarse particulate matter with a diameter between 2.5 and 10 μm; SO2: sulfur dioxide.Note: The mean daily air contaminant concentration was classed as high if it exceeded the World Health Organization guideline value (Table 1).