aerosol pollution in some chinese cities
TRANSCRIPT

Pure Appl. Chem., Vol. 76, No. 6, pp. 1227–1239, 2004.© 2004 IUPAC
1227
INTERNATIONAL UNION OF PURE AND APPLIED CHEMISTRY
CHEMISTRY AND THE ENVIRONMENT DIVISION*
AEROSOL POLLUTION IN SOME CHINESE CITIES
(IUPAC Technical Report)
Prepared for publication byYUANHANG ZHANG1,‡, XIANLEI ZHU1, SJAAK SLANINA1, MIN SHAO1, LIMIN ZENG1,
MIN HU1, MICHAEL BERGIN2, AND LYNN SALMON2
1Center for Environmental Sciences, Peking University, Beijing 100871, China; 2School of Earth andAtmospheric Sciences, Georgia Institute of Technology, Atlanta, GA 30332, USA
*Membership of the Division Committee during the preparation of this report was as follows:
President: W. Klein (Germany); K. D. Racke (USA); Secretary: P. T. Holland (New Zealand); Titular Members:E. Anklam (Belgium, 2002–2005); H. Behret (Germany, 1998–2001); P. Dysseler (Belgium, 2000–2005); J. Gilbert(UK, 2000–2001); L. Klasinc (Croatia, 2002–2005); W. Klein (Germany, 1994–2005); L. McConnell (USA,2004–2007); J. Miyamoto (Japan, 1990–2001); W. J. G. M. Peijnenburg (Netherlands, 2000–2005); N. Senesi(Italy, 2002–2005); D. Turner (Sweden, 2000–2001); R. D. Wauchope (USA, 2002–2007); Associate Members:R. Battalglia (Switzerland, 2002–2003); W. R. Benson (USA, 2004–2005); R. Cantrill (USA, 2002–2005); A.Felsot (USA, 2002–2003); O. Hertel (Denmark, 2004–2005); P. M. Huang (Canada, 2002–2005); W. Kördel(Germany, 2004–2005); R. P. Martin (France, 1998–2001); S. W. Page (Switzerland, 2000–2001); Y. Shevah(Israel, 2000–2005); K. Tanaka (Japan, 2004–2005); H. P. van Leeuwen (Netherlands, 2002–2003); NationalRepresentatives: P. S. Fedotov (Russia, 2002–2005); M. Fitzgerald (Australia, 2004–2005); R. M. Harrison (UK,2002–2003); S. H. Herve (Finland, 2004–2005); Y. H. Kim (Korea, 2002–2005); J. J. Pienaar (South Africa,2002–2003); E. Resto (Puerto Rico, 2002–2005); J. Scott (Australia, 2002–2003); T. Tavares (Brazil, 2000–2005).
‡Corresponding author
Republication or reproduction of this report or its storage and/or dissemination by electronic means is permitted without theneed for formal IUPAC permission on condition that an acknowledgment, with full reference to the source, along with use of thecopyright symbol ©, the name IUPAC, and the year of publication, are prominently visible. Publication of a translation intoanother language is subject to the additional condition of prior approval from the relevant IUPAC National AdheringOrganization.

Aerosol pollution in some Chinese cities
(IUPAC Technical Report)
Abstract: Emissions caused by the use of coal and by traffic have caused seriousphotochemical smog and aerosol pollution with unique characteristics in mostChinese cities. This report gives an overview of aerosol concentrations in Chinabased on data obtained from both the literature and recent research by the authors.The results show that TSP (total suspended particulate) and PM-10 (particles withaerodynamic diameter 10 µm) concentrations frequently exceed the NationalAmbient Air Quality Standard and that ambient aerosol concentrations constitutea serious air pollution problem. PM-2.5 concentrations are also high and accountfor 60 % of the PM-10 mass. Organic carbon and sulfate are the most abundantcomponents of PM-2.5, while crustal elements represent a minor portion. Nitrateconcentrations are almost the same as sulfate in summertime, which implies thatNOx control is very important in lowering fine particle concentrations and in im-proving air visibility. The chemical mass balance (CMB) method was applied inBeijing to identify the sources of PM-2.5. The main sources include fugitive dust,coal burning/industrial processes, traffic emissions, and secondary aerosol pro-duced by atmospheric chemical conversion.
1. INTRODUCTION
The well-documented [1–3] adverse effects of fine particles on human health have led to increased re-search on the sources and atmospheric behavior of these particles. Penetration into human lungs and itspotential effects depends on the size of the particles, which provides a reason for sampling of particlesas a function of size. The classical total suspended particulate samplers collect aerosol with an aero-dynamic diameter of typically 100 µm or less. PM-10 samplers will collect particles with a diameter ofless than 10 µm, which can enter the human air tract. Particles smaller than 2.5 µm (PM-2.5) will pen-etrate into human lungs.
Ambient aerosol is partly caused by direct emissions of particles into the atmosphere (primaryaerosol), as well as by the oxidation of gaseous compounds such as sulfur dioxide, nitrogen oxides, andvolatile organic compounds to nonvolatile products such as sulfates, nitrate, and low-volatile oxidizedorganic compounds.
Air pollution in China during the past decades has been typically caused by the use of coal, whichis, by far, the most important fuel. SO2 and particulate matter are responsible for serious damage to theenvironment. The air pollution arising from the use of coal burning has not been effectively controlled,and other sources of emissions have also become important, owing to the recent rapid economic devel-opment and urbanization. Fast growth of the number of vehicles in China, especially in mega-cities andeconomically developed regions, such as Beijing, Shanghai, Guangzhou, the Pearl River delta, and theYangtze delta, has caused a sharp increase in concentrations of NOx, volatile organic compounds, par-ticulate matter, and ozone [4–6]. Emissions due to the use of coal and traffic together lead to seriouspollution, characterized by enhanced photochemical smog, high concentration of fine particles, andpoor visibility. These pollution problems not only cause local problems, but also lead to the degrada-tion of regional air quality. As a result, the traditional Chinese control policy that focuses on single citiesis no longer effective to abate urban air pollution, and efforts to reduce emissions in one mega-city onlycannot improve regional air quality of the surrounding areas.
Y. ZHANG et al.
© 2004 IUPAC, Pure and Applied Chemistry 76, 1227–1239
1228

Since the 1990s, a number of projects have been set up to study air pollution, to develop emissioninventories, and to develop monitoring strategies in Beijing, Guangzhou, Qingdao, the Pearl River delta,and the Yangtze delta. This paper gives an overview of the results obtained in those areas with focus onaerosol pollution.
2. STATUS OF AEROSOL POLLUTION
2.1 Mass concentration of aerosol
China, like many other developing countries, is exposed to serious pollution due to high aerosol con-centrations. Total suspended particulate (TSP) has been measured in China for many years, and the datahave revealed that serious pollution problems are encountered in most of the country. Figure 1 presentsTSP pollution in China in 1997 on the basis of annual mean concentrations from 84 monitoring stations.The annual average concentrations of TSP within the state-controlled network ranged from 32 to741 µg/m3, with a national average of 291 µg/m3 [7]. TSP concentrations in 67 cities (72.0 % of themonitored cities) exceeded the Grade II (200 µg/m3) air quality standards for cities of the ChinaNational Ambient Air Quality Standard (NAAQS, GB3095-1996) [8]. Compared with southern China,TSP pollution in northern China is more serious, although a few cities in the south also suffer fromheavy TSP pollution. TSP represents an air quality problem especially in Beijing, Tianjin, Gansu,Xinjiang, and Shanxi. The high TSP concentrations are generally attributed to coal combustion andfugitive soil dust.
The concentrations of PM-10 and PM-2.5 (particles with aerodynamic diameter less than 10 and2.5 µm, respectively) are, however, seen as even more problematic because of their adverse effects onhuman health [1–3,9,10] and atmospheric visibility. Little research on PM-10 and PM-2.5 was con-ducted in China before the 1980s. Since the middle of the 1990s, fine particle pollution has been a con-
© 2004 IUPAC, Pure and Applied Chemistry 76, 1227–1239
Aerosol pollution in some Chinese cities 1229
Fig. 1 Annual mean mass concentration of TSP in China in 1997 (µg/m3).

cern, and projects have been carried out to characterize the ambient PM-10 and PM-2.5 concentrationsand their sources. The sampling sites were located mostly in urban areas of large cities, such as Beijing[11,12], Chongqing [13], Wuhan [13], Lanzhou [13], Guangzhou [13], Qingdao [14], etc. Annual meanconcentrations in some cities and regions are shown in Fig. 2. The concentrations are averages of meas-urements over four seasons of a year (or years) with two-week sampling duration for each season.PM-10 annual mean mass concentrations in the cities range from about 70 to 220 µg/m3, most of whichcannot meet the Grade II (100 µg/m3) of the NAAQS. The highest concentrations are observed inGuangzhou, Lanzhou, and Beijing. PM-2.5 annual mean concentrations vary from about 50 to140 µg/m3; the highest values are found in Guangzhou (in 1996) and lowest in Qingdao. All reportedconcentrations are all much higher than 40 µg/m3 air quality standard for PM-10 in Europe and15 µg/m3, the recommended PM-2.5 standard in the United States. Regional measurements of PM-2.5concentrations were conducted intensively during summer and winter campaigns in the Pearl River andYangtze deltas. PM-2.5 concentrations can be as low as those in U.S. cities under conditions of gooddispersion, as values measured in July of 2000 in the Pearl River delta show, but increased PM-2.5 con-centrations are found under stagnant conditions (e.g., November 2000) owing to emissions from thelarge sources in the area. The concentrations of PM-10 and PM-2.5 shown in Fig. 2 are generally muchhigher than those measured in Hong Kong (55.3 µg/m3 for PM-10) [15], Seoul (South Korea, 75 µg/m3
for PM10) [16], Sapporo (Japan, 24.8 µg/m3 for PM-10) [17], Birmingham (United Kingdom, 47 µg/m3
for PM-10) [18], Coimbra (Portugal, 52.1 µg/m3 for PM-10) [18], São Paulo (Brazil, 30.2 µg/m3 forPM-2.5) [19], and Kangwha (background site for urban area in South Korea, 29.1 µg/m3 for PM-2.5observed from March 1996 to Dec. 1997) [20]. The aerosol concentrations in Wuhan and Chongqingare comparable to those in Kaohsiung (Taiwan, 111 µg/m3 for PM-10 and 68 µg/m3 for PM-2.5) [21].
The PM-2.5/PM-10 ratios (ratio of PM-2.5 mass concentration to PM-10 mass concentration) inChina, ranging between 0.5–0.7 with an average 0.6 as shown by the line in Fig. 2, are about the sameas those observed in Europe or the United States or slightly lower. It can be inferred that Chinese citiesmight suffer from serious PM-2.5 pollution, even though only limited data are available, when the highPM-10 concentrations which have been measured and the PM-2.5/PM-10 ratios in Fig. 2 are consid-ered.
Y. ZHANG et al.
© 2004 IUPAC, Pure and Applied Chemistry 76, 1227–1239
1230
Fig. 2 PM-10 and PM-2.5 average mass concentrations in several cities of China.

2.2 Effect on atmospheric visibility
Probably the most noticeable effect of air pollution is reduction in atmospheric visibility. Pollutants(particles and some gases) scatter and absorb light in the air and cause poor visibility. Those particles,referred to as fine particles, are in general smaller than 2.5 µm in aerodynamic diameter.
The relation between PM-2.5 and visibility in China was studied in Beijing in June 1999 andJanuary 2000 by TEOM (tapered element oscillating microbalance) and Nephelometer, respectively[22]. Figure 3 shows the expected anticorrelation between PM-2.5 and visibility based on hourly meas-urements. The visibility decreases rapidly with the increase in PM-2.5 concentration from 12 to260 µg/m3. The same PM-2.5 mass concentration leads to different visibility in summer and winter, in-dicating that visibility depends on other factors besides PM-2.5 [23,24]. Aerosol particles can grow byuptake of water vapor at higher relative humidity, which leads to decrease of visibility. This growth isa function, among other parameters, of the chemical composition of the particles.
2.3 Regional air pollution
Because of the fast economic and urban development, anthropogenic pollution has extended from theurban to the regional scale in some city-clusters of China. For example, the whole Beijing-Tianjin areaand the Pearl River delta are sometimes covered with large polluted air masses leading to strongly re-duced visibility and adverse effects on ecosystems and human health. Figure 4 presents the PM-2.5 con-centration variation with wind direction in Beijing area and the Pearl River delta [25,26]. In the Beijingarea, four ground-based aerosol sampling sites, i.e., Ming Tomb, Peking University (PKU), Dongsi, andYongledian are positioned along the main wind directions, representing different areas in Beijing. PKUand Dongsi can be characterized as urban aerosol sampling sites. The Ming Tomb sampling site, about40 km away from Beijing city in the northwest, is located at a historical scenic area with feweranthropogenic emissions. Yongledian, approximately 60 km from the city in the southeast, is chosen torepresent the rural area around Beijing. PM-2.5 concentration is lower in the upwind area of Beijing;the concentration increases significantly in the Beijing urban area (represented by the sampling sites ofPKU and Dongsi) owing to large anthropogenic emissions; the PM-2.5 concentration is at about thesame level or slightly lower in the air mass moving down wind of Beijing. A significant increase in
© 2004 IUPAC, Pure and Applied Chemistry 76, 1227–1239
Aerosol pollution in some Chinese cities 1231
Fig. 3 Correlation between PM-2.5 and visibility (hourly mean).

PM-2.5 concentration in downwind areas is observed, compared with upwind areas. The spatial varia-tion of PM-2.5 concentrations at different sites scattered along different wind directions would give ev-idence that the effect of aerosol pollution in Beijing would not be limited to the city area but would ex-tend to a larger area. Air quality in rural areas can occasionally become as affected as that in urbanareas. The same is true in the Pearl River delta, according to the measurements. The concentrations ofPM-10 and PM-2.5 gradually increased along the wind direction, which illustrates regional transport ofaerosol (in Fig. 4, lower picture).
Y. ZHANG et al.
© 2004 IUPAC, Pure and Applied Chemistry 76, 1227–1239
1232
(continues on next page)
(a)

3. CHEMICAL COMPOSITION OF AEROSOL
3.1 Chemical composition of PM-2.5
As shown in Table 1, sulfate and organic carbon (OC) are the major components of PM-2.5. Sulfateconcentrations range between 9.9 and 20.0 µg/m3 with rather small spatial variations in most areas.Sulfate concentrations are relatively low in Beijing, 9.9 µg/m3 in the year 2000, owing to large-scalemeasures for SO2 emission reduction. The contribution of sulfate to PM-2.5 mass varies considerablyin different cities and regions, ranging between 15–30 % of the PM-2.5 mass. In Qingdao, sulfate ac-counted for 32.3 % of PM-2.5 mass, which is almost twice that in other cities. This might be attributedto large emissions from both anthropogenic and natural (seawater) sources [27,28]. OC with concen-trations in the range of 19–41 µg/m3 accounts for 20–40 % of the PM-2.5 mass. The Yangtze delta hasthe highest OC concentrations and the highest fraction of OC in PM-2.5; see the data in Table 1.
Table 1 Main chemical compositions in several locations of China (µg/m3).
Sites Year OC EC SO42– NO3
– NH4+ Mass
Beijing 1994–1995 15.2 5.2 6.5 91.0Beijing [25] 2000 26.1 5.4 9.9 5.6 4.8 105.0Pearl River delta [26] Nov. 2000 19.2 1.7 14.4 2.3 2.4 84.3Qingdao [14] 1997–1999 16.0 6.9 7.9 49.6Yangtze delta [24] Li-an Nov. 1999 27.7 2.8 15.8 6.7 7.1 73.1
Changsu Nov. 1999 40.5 3.0 20.0 11.3 9.4 111.9Sheshan Nov. 1999 33.2 2.0 16.2 9.3 6.6 83.8
Waliguan [29] 1994–1995 0.05–0.6Shangdianzi [30] 1999–2000 0.2–0.3
Note: OC and EC are determined by thermal/optical carbon analysis (TOCA). Ions are determined by ion chromatography (IC).
© 2004 IUPAC, Pure and Applied Chemistry 76, 1227–1239
Aerosol pollution in some Chinese cities 1233
Fig. 4 PM-2.5 concentration variations along wind direction in Beijing (a) (2000) and in the Pearl River delta (b)(November 2000).
(b)

EC concentrations are also high in urban areas if compared with values observed in more remoteareas. The EC concentrations in PM-2.5 are in the range of 1.4–5.4 µg/m3 with the highest value inBeijing. In Waliguan, a global background station in terms of air pollution in Qinghai, west China, ECconcentration is only 0.05–0.6 µg/m3 [29]. At Shangdianzi, a regional background station in Beijing,EC concentration is 0.2–0.3 µg/m3 [30]. The spatial variation of EC concentrations reflects the geo-graphical variation in emissions. The concentration of nitrate is relatively low with large variations.However, it must be pointed out that nitrate concentrations in Beijing, Qingdao and the Pearl Riverdelta could be severely underestimated because of chemical interferences in filter measurements (seeSlanina in this issue). Online measurements by the steam jet aerosol collector (SJAC) have shown thatnitrate is present at almost the same level as sulfate in Beijing during the summer [31]. The filter packmethod underestimates nitrate concentration by some 70 % compared with results obtained by SJAC;see Fig. 5.
The concentrations of OC, SO42–, NO3
–, and NH4+ in other countries are listed in Table 2. The
concentrations of those aerosol components in Chinese cities (see Table 1) are quite high by compari-son. In particular, the concentrations of SO4
2– and NO3– are generally about 2–4 and 5 times higher, re-
spectively. This is mainly due to strong local emissions of SO2 and NOx and the high oxidation capac-ity of the atmosphere. However, the case was not same for EC. The concentrations of EC in China arelower than that in São Paulo and comparable to those in Kaohsiung, Sapporo, and Birmingham.
Table 2 Chemical compositions in other areas (µg/m3).
City Year OC EC SO42– NO3
– NH4+
Kaohsiung (Taiwan) [21] Nov. 1998–April 1999 10.4 4.0 NDb ND NDHong Konga [15] 1990–1994 ND ND 8.5 2.03 2.5Sapporo (Japan)a [17] June 1987–Dec. 1988 ND 3.4 3.9 0.9 0.85Birmingham (UK) [18] Feb. 1992, Aug. 1992 ND 1.2 4.1 1.0 1.6Ankara (Turkey) [32] Feb. 1993–June 1993 ND ND 6.4 2.1Sequoia National Park May 1999–Nov. 1999 ND ND 0.6–1.5 1.1–2.0 1.0–1.9(California, USA) [33]
São Paulo (Brazil) [19] July 1997–Sept. 1997 15.8 7.6 ND ND ND
aChemical components of PM-10.bNot detected.
The averaged chemical compositions of PM-2.5 in Beijing [25] and Guangzhou [26] cities areshown in Fig. 6. In Beijing, organic carbon (OC) is the largest fraction in PM-2.5, accounting for 36 %.
Y. ZHANG et al.
© 2004 IUPAC, Pure and Applied Chemistry 76, 1227–1239
1234
Fig. 5 Comparison of 24-h averages of SO42– and NO3
– by filter pack and SJAC methods in Beijing (2000).

Sulfate, nitrate, ammonium, and EC represent respectively 9, 5, 5, and 5 %. The sum of these speciesrepresents around 65 % of the mass of PM-2.5 while the contribution of crustal components is only12 %. This implies that secondary aerosol is the largest fraction of PM-2.5 owing to fossil fuel emis-sions, and that fugitive dust represents a rather small contribution. Chemical characteristics of PM-2.5are quite similar in Beijing and Guangzhou.
3.2 Diurnal variations of sulfate and nitrate concentrations
The diurnal variations of SO42– and NO3
– concentrations in fine particles in Beijing for different sea-sons of the year 2000 are given in Fig. 7 [25]. Sulfate concentrations in May, June, September, and
© 2004 IUPAC, Pure and Applied Chemistry 76, 1227–1239
Aerosol pollution in some Chinese cities 1235
Fig. 6 Chemical composition of PM-2.5 in Beijing and Guangzhou urban area in 2000.
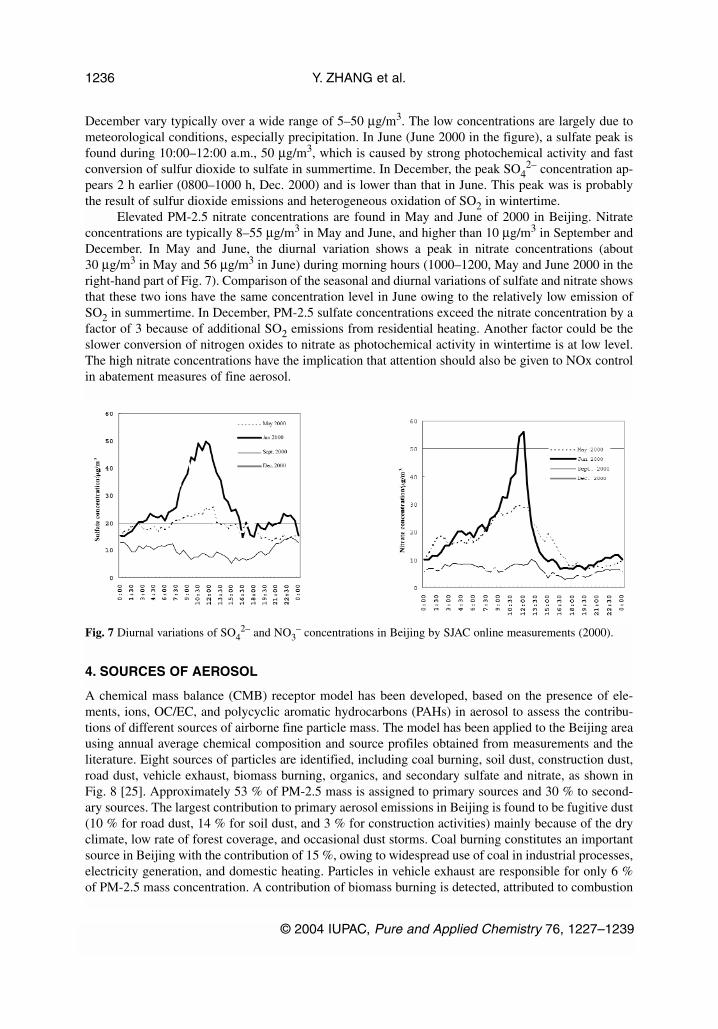
December vary typically over a wide range of 5–50 µg/m3. The low concentrations are largely due tometeorological conditions, especially precipitation. In June (June 2000 in the figure), a sulfate peak isfound during 10:00–12:00 a.m., 50 µg/m3, which is caused by strong photochemical activity and fastconversion of sulfur dioxide to sulfate in summertime. In December, the peak SO4
2– concentration ap-pears 2 h earlier (0800–1000 h, Dec. 2000) and is lower than that in June. This peak was is probablythe result of sulfur dioxide emissions and heterogeneous oxidation of SO2 in wintertime.
Elevated PM-2.5 nitrate concentrations are found in May and June of 2000 in Beijing. Nitrateconcentrations are typically 8–55 µg/m3 in May and June, and higher than 10 µg/m3 in September andDecember. In May and June, the diurnal variation shows a peak in nitrate concentrations (about30 µg/m3 in May and 56 µg/m3 in June) during morning hours (1000–1200, May and June 2000 in theright-hand part of Fig. 7). Comparison of the seasonal and diurnal variations of sulfate and nitrate showsthat these two ions have the same concentration level in June owing to the relatively low emission ofSO2 in summertime. In December, PM-2.5 sulfate concentrations exceed the nitrate concentration by afactor of 3 because of additional SO2 emissions from residential heating. Another factor could be theslower conversion of nitrogen oxides to nitrate as photochemical activity in wintertime is at low level.The high nitrate concentrations have the implication that attention should also be given to NOx controlin abatement measures of fine aerosol.
4. SOURCES OF AEROSOL
A chemical mass balance (CMB) receptor model has been developed, based on the presence of ele-ments, ions, OC/EC, and polycyclic aromatic hydrocarbons (PAHs) in aerosol to assess the contribu-tions of different sources of airborne fine particle mass. The model has been applied to the Beijing areausing annual average chemical composition and source profiles obtained from measurements and theliterature. Eight sources of particles are identified, including coal burning, soil dust, construction dust,road dust, vehicle exhaust, biomass burning, organics, and secondary sulfate and nitrate, as shown inFig. 8 [25]. Approximately 53 % of PM-2.5 mass is assigned to primary sources and 30 % to second-ary sources. The largest contribution to primary aerosol emissions in Beijing is found to be fugitive dust(10 % for road dust, 14 % for soil dust, and 3 % for construction activities) mainly because of the dryclimate, low rate of forest coverage, and occasional dust storms. Coal burning constitutes an importantsource in Beijing with the contribution of 15 %, owing to widespread use of coal in industrial processes,electricity generation, and domestic heating. Particles in vehicle exhaust are responsible for only 6 %of PM-2.5 mass concentration. A contribution of biomass burning is detected, attributed to combustion
Y. ZHANG et al.
© 2004 IUPAC, Pure and Applied Chemistry 76, 1227–1239
1236
Fig. 7 Diurnal variations of SO42– and NO3
– concentrations in Beijing by SJAC online measurements (2000).

of corn straw in summer and autumn and biofuel in other seasons, and estimated to be 5 % on an an-nual basis. About 30 % of the mass of fine particles can be attributed to secondary formation of sulfate,nitrate, and organics. The large contribution of secondary aerosol would reflect fast conversion ofgaseous primary emissions as sulfur dioxide, nitrogen oxides, and gaseous organic compounds to sec-ondary products as sulfates, nitrates, and nonvolatile oxidized organics in Beijing.
5. CONCLUSION
Some data sets for aerosol mass and composition, obtained both in our recent research and from the lit-erature, are presented and evaluated. The results give an overview on status and characteristics ofaerosol pollution in major cities in China.
• TSP and PM-10 mass concentrations are so high in many areas of China that the national stan-dards are exceeded significantly and frequently. PM-2.5 concentration is also very high, and theannual mean concentration varies from about 50 to 140 µg/m3 in different areas.
• According to some studies, PM-2.5 constitutes about 60 % of the PM-10 mass on average. Thisfraction of fine particles affects the visibility and causes air pollution on a regional scale.
• Organic carbon and sulfate are the most abundant components of PM-2.5, while crustal elementsconstitute a minor part of PM-2.5. In summertime, nitrate is present in almost same concentrationlevels as sulfate, which implies that NOx control should be emphasized to abate fine particle pol-lution and to improve visibility.
• Results of source apportionment by CMB show that fugitive dust, coal burning, industrialprocesses, and vehicle exhaust are the main sources of primary aerosol. Secondary aerosol as rep-resented by nitrate and sulfate contributes 16 % to PM-2.5 mass concentration, and organic car-bon aerosol 14 %. This indicates fast conversion of primary emissions in Beijing.
6. ACKNOWLEDGMENT
The report was funded by IUPAC project and China National Basic Research and DevelopmentProgram-2002CB410801.
© 2004 IUPAC, Pure and Applied Chemistry 76, 1227–1239
Aerosol pollution in some Chinese cities 1237
Fig. 8 Source apportionment of ambient PM-2.5 in Beijing (2000).

7. REFERENCES
1. B. D. Ostro, S. Hurley, M. J. Lipsett. Environ. Res. 81, 231–238 (1999).2. D. E. Abbey, R. J. Burchette, S. F. Knutsen, W. F. McDonnell, M. D. Lebowitz, P. L. Enright. Am.
J. Respir. Crit. Care Medicine 158, 289–298 (1998).3. W. E. Wilson and H. H. Suh. J. Air Waste Manage. Assoc. 47, 1238–1249 (1997).4. X. Tang, J. Li, D. Chen. Pure Appl. Chem. 67, 1465–1468 (1995).5. Y. Zhang, M. Shao, M. Hu. Air quality in Beijing and its transition from coal burning caused
problems to traffic exhaust related pollution. 90th Annual Meeting of Air & Waste ManagementAssociation, Toronto, Canada, June 1997.
6. Y. Zhang, K. Shao, X. Tang, J. Li. Acta Sci. Nat. Univ. Pekin. (Beijing Daxue Xuebao, ZiranKexuebas) 34 (2–3), 392–400 (1998) (in Chinese).
7. State Environmental Protection Administration of China. Report on the State of the Environmentin China (1997) (in Chinese).
8. State Environmental Protection Administration of China. Ambient Air Quality Standard ofPeople’s Republic of China (GB3095-1996).
9. F. Wei, W. Hu, E. Teng, G. Wu, J. Zhang, R. S. Chapman. China Environ. Sci. 20 (3), 220–224(2000) (in Chinese).
10. G. Wu, W. Hu, E. Teng, F. Wei. Environ. Monitor. China 17 (7), 33–38 (2001) (in Chinese).11. Y. Song, X. Tang, C. Fang, Y. Zhang, M. Hu, L. Zeng. China Environ. Sci. 23 (6), 11–16 (2002)
(in Chinese).12. Y. Song, X. Tang, Y. Zhang, M. Hu, C. Fang, L. Zeng, W. Wang. Chin. Environ. Sci. 23 (4) 33–36
(2002) (in Chinese).13. F. Wei, E. Teng, G. Wu, W. Hu, W. E. Wilson, R. S. Chapman, J. C. Pau, J. Zhang. Environ. Sci.
Technol. 33, 4188–4193 (1999).14. M. Wang and M. Hu. China Environ. Sci. 22 (1), 6–9 (2002) (in Chinese).15. Y. Qin, C. K. Chan, L. Y. Chan. Sci. Total Environ. 206, 25–37 (1997).16. Y. Hashimoto, Y. Sekine, H. K. Kim, Z. L. Chen, Z. M. Yang. Atmos. Environ. 28, 1437–1445
(1994).17. N. Kaneyasu, S. Ohta, N. Murao. Atmos. Environ. 29, 1559–1568 (1995).18. R. M. Harrison, D. J. T. Smith, C. A. Pio, L. M. Castro. Atmos. Environ. 31, 3309–3321 (1997).19. A. D. A. Castanho and P. Artaxo. Atmos. Environ. 35, 4889–4902 (2001).20. J. H. Lee, Y. P. Kim, K. Moon, H. Kim, C. B. Lee. Atmos. Environ. 35, 635–643 (2001).21. J. K. Lin and H. Tai. Atmos. Environ. 35, 2627–2636 (2001).22. M. H. Bergin, G. R. Cass, J. Xu, C. Fang, L. Zeng, T. Yu, L. G. Salmon, C. Kiang, X. Tang, Y.
Zhang, W. Chameides. J. Geophys. Res.; [Atmos.] 106, 17969–17980 (2001).23. J. Qiu and L.Yang. Atmos. Environ. 34, 603–609 (2000).24. J. Xu, M. H. Bergin, X. Yu, G. Liu, J. Zhao, C. M. Carrico, K. Baumann. Atmos. Environ. 36,
161–173 (2002).25. X. Tang. Source analysis for PM10, PM2.5 and other pollutants, Chap. 5 in: Study on Cause and
Sources of Air Pollution in Beijing. Final report (2001).26. Y. Zhang. Pollution status of photochemical smog and fine particles in Pearl River Delta, Chap.
3 in: Study on Regional Air Quality in Pearl River Delta. Final report (2002).27. M. Hu, X. Tang, J. Li, Z. Yu. Acta Sci. Circumstantiae (Huanjing Kexue Xuebao) 17, 110–115
(1997) (in Chinese).28. D. Zhang, G. Shi, Y. Iwasaka, M. Hu. Atmos. Environ. 34, 2669–2679 (2000).29. J. Tang, Y. Wen, L. Zhou, D. Qi, M. Zheng, T. Neil, W. Erika. J. Appl. Meteor. Sci. 10 (2),
160–170 (1999) (in Chinese).30. S. Qing, J. Tang, Y. Wen. Meteorology 27 (11), 3–7 (2001) (in Chinese).31. F. Zhou, K. Shao, M. Hu, X. Tang. China Environ. Sci. 23 (1), 11–15 (2002) (in Chinese).
Y. ZHANG et al.
© 2004 IUPAC, Pure and Applied Chemistry 76, 1227–1239
1238
32. M. Yantin, S. Tuncel, N. K. Aras, I. Olmez, S. Aygun, G. Tuncel. Atmos. Environ. 34, 1305–1318(2000).
33. A. Bytnerowicz, M. Tausz, R. Alonso, D. Jones, R. Johnson, N. Grulke. Environ. Pollut. 118,187–203 (2002).
© 2004 IUPAC, Pure and Applied Chemistry 76, 1227–1239
Aerosol pollution in some Chinese cities 1239