health costs of air pollution in european cities and the
TRANSCRIPT
Health costs of air
pollution in European
cities and the linkage
with transport
Ø
1 190272 - Health costs of air pollution in European cities and the linkage with transport – October 2020
Health costs of air pollution in
European cities and the linkage with
transport
CE Delft
Committed to the Environment
Through its independent research and consultancy work CE Delft is helping build a sustainable world. In the
fields of energy, transport and resources our expertise is leading-edge. With our wealth of know-how on
technologies, policies and economic issues we support government agencies, NGOs and industries in pursuit of
structural change. For 40 years now, the skills and enthusiasm of CE Delft’s staff have been devoted to
achieving this mission.
This note is prepared by: Sander de Bruyn and Joukje de Vries
Delft, CE Delft, October 2020
Publication code: 20.190272.134
Air Polution / Cities / Transport / Health / Costs / Analysis
Client: A consortium of public interest NGOs in ten European countries ( ES, FR, DE, PL, SI, HU, RO, BG, NL, IT)
led by the umbrella organisation European Public Health Alliance (EPHA) commissioned this report
Publications of CE Delft are available from www.cedelft.eu
Further information on this study can be obtained from the contact person Sander de Bruyn (CE Delft)
© copyright, CE Delft, Delft
2 190272 - Health costs of air pollution in European cities and the linkage with transport – October 2020
Content
Acronyms 4
Executive Summary 5
1 Introduction 7 1.1 Introduction 7 1.2 Project aims 7 1.3 Delineation and caveats 8 1.4 Relation to other research in this area 9 1.5 Reading guide 9
2 Concepts and methods 10 2.1 Introduction 10 2.2 Health impacts from air pollution 10 2.3 The concept of social costs 15 2.4 Calculation of social costs in this research 19
3 Results 23 3.1 Introduction 23 3.2 Total social costs 23 3.3 Social costs in perspective (relative numbers) 28
4 Estimating the impact of transport on social costs 32 4.1 Introduction 32 4.2 Description of the method 32 4.3 Results 34
5 Conclusions 38 5.1 General findings 38 5.2 Research Findings 39 5.3 Recommendations 39
Literature 41
A Description of data 44 A.1 Pollution data 44 A.2 Population data 45 A.3 Economically active population data 45 A.4 GDP data 46 A.5 List of cities included in this research 46
B The impact-pathway framework 51
3 190272 - Health costs of air pollution in European cities and the linkage with transport – October 2020
B.1 Indicators of physical incidence 51 B.2 Valuation of impacts 51 B.3 Mortality impacts 52 B.4 Impact tables and adjustments to NEEDS 54 B.5 More information 55
C City results per country 56
D Country totals and averages of damage costs 85
4 190272 - Health costs of air pollution in European cities and the linkage with transport – October 2020
Acronyms
Acrony
m
Explanation
AF Attributable Fraction
AGF Age group fraction
CO2 Carbon dioxide
COPD Chronic Obstructive Pulmonary Disease
CRF Concentration Response Function
CVD Cardiovasculair disease
DALY Disability-adjusted life year
EEA European Environmental Agency
EPHA European Public Health Alliance
GDP Gross Domestic Product
HEI Health Effects Institute
ICCT The International Council on Clean Transportation
MRAD Minor restricted activity days
NEEDS New Energy Externalities Development for Sustainability, a European funded research program
netRADs netto Restricted activity days
NH3 Ammonia
NMVOC Non-methane volatile Organic Compounds
NO2 Nitrogen Dioxide
NOx Nitrogen Oxide
OECD Organisation for Economic Co-operation and Development
PPP Purchasting Power Parities
QALY Qualtiy-adjusted life year
RGF Risk Group Fraction
RR Relative Risk
SO2 Sulphur Dioxide
SOMO35 Sum of Ozone Means Over 35 ppb, an indicator of 8-h ozone concentrations exceeding 35 parts per
billion
UBA German Federal Environmental Agency
VOC Volatile Organic Compounds
VOLY Value of Life Years
VSL Value of Statistical Life
WHO World Health Organisation
WLD Work loss days
WTP Willingness to Pay
YOLL Years of Life Lost
5 190272 - Health costs of air pollution in European cities and the linkage with transport – October 2020
Executive Summary
This study investigates the health-related social costs of air pollution in 432 European cities
in 30 countries (the EU27 plus the UK, Norway and Switzerland). Social costs are costs
affecting welfare and comprise both direct health care expenditures (e.g. for hospital
admissions) and indirect health impacts (e.g. diseases such as COPD, or reduced life
expectancy due to air pollution). These impacts affect welfare because people have a clear
preference for healthy life years in a good and clean environment. As a clean environment
is not something that can be bought in the marketplace, however, a robust methodology is
required to monetize them in order to quantify the wider public health impacts.
Environmental economists have performed numerous studies to quantify the impacts of air
pollution on health and monetize these as social costs. These studies were used to develop
the methodological framework adopted in the present study, which encompasses sixteen
health impacts attributable to air pollution by fine particulate matter, ozone and nitrogen
oxides (Table 2, Page 15). Using data on reported air quality in the Urban Audit statistics
and the EEA Air Quality network, the physical impacts on human health were quantified
using concentration-response functions based on the recommendations of the World Health
Organization (WHO). The physical impacts were subsequently monetized using a valuation
framework developed in the peer-reviewed Handbook of External Costs published by the
European Commission’s Directorate General for Mobility and Transport, DG MOVE. The
resulting social costs incurred in a specific city were then determined from the air pollution
levels reported there and the size, age structure and living standards of the population in
that particular city.
For all 432 cities in our sample (total population: 130 million inhabitants), the social costs
quantified were over € 166 billion in 2018. In absolute terms, London is the city with the
highest social costs. In 2018, the loss in welfare for its 8.8 million inhabitants totalled
€ 11.38 billion. London is followed by Bucharest, with an annual loss in welfare of
€ 6.35 billion and Berlin, with an annual loss of € 5.24 billion. City size is a key factor
contributing to total social costs: all cities with a population over 1 million feature in the
Top 25 cities with the highest social costs due to air pollution (see Table 1).
In 2018, on average every inhabitant of a European city suffered a welfare loss of over
€ 1,250 a year owing to direct and indirect health losses associated with poor air quality.
This is equivalent to 3.9% of income earned in cities. It should be noted that there is a
substantial spread in these figures among cities: in the Romanian capital Bucharest total
welfare loss amounts to over € 3,000 per capita/year, while in Santa Cruz de Tenerife in
Spain it is under € 400/cap/yr. In many cities in Bulgaria, Romania and Poland the health-
related social costs are between 8-10% of income earned. Most of these costs relate to
premature mortality: for the 432 cities investigated, the average contribution of mortality
to total social costs is 76.1%. Conversely, the average contribution of morbidity (diseases) is
23.9%.
6 190272 - Health costs of air pollution in European cities and the linkage with transport – October 2020
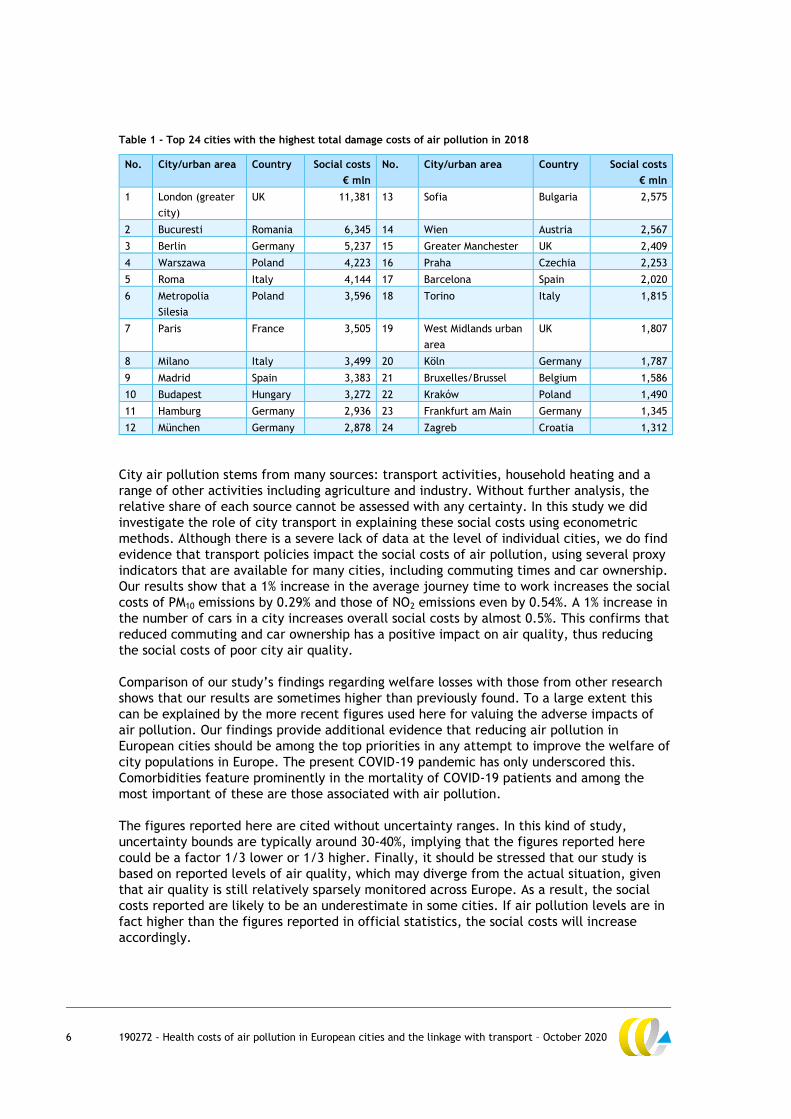
Table 1 - Top 24 cities with the highest total damage costs of air pollution in 2018
No. City/urban area Country Social costs
€ mln
No. City/urban area Country Social costs
€ mln
1 London (greater
city)
UK 11,381 13 Sofia Bulgaria 2,575
2 Bucuresti Romania 6,345 14 Wien Austria 2,567
3 Berlin Germany 5,237 15 Greater Manchester UK 2,409
4 Warszawa Poland 4,223 16 Praha Czechia 2,253
5 Roma Italy 4,144 17 Barcelona Spain 2,020
6 Metropolia
Silesia
Poland 3,596 18 Torino Italy 1,815
7 Paris France 3,505 19 West Midlands urban
area
UK 1,807
8 Milano Italy 3,499 20 Köln Germany 1,787
9 Madrid Spain 3,383 21 Bruxelles/Brussel Belgium 1,586
10 Budapest Hungary 3,272 22 Kraków Poland 1,490
11 Hamburg Germany 2,936 23 Frankfurt am Main Germany 1,345
12 München Germany 2,878 24 Zagreb Croatia 1,312
City air pollution stems from many sources: transport activities, household heating and a
range of other activities including agriculture and industry. Without further analysis, the
relative share of each source cannot be assessed with any certainty. In this study we did
investigate the role of city transport in explaining these social costs using econometric
methods. Although there is a severe lack of data at the level of individual cities, we do find
evidence that transport policies impact the social costs of air pollution, using several proxy
indicators that are available for many cities, including commuting times and car ownership.
Our results show that a 1% increase in the average journey time to work increases the social
costs of PM10 emissions by 0.29% and those of NO2 emissions even by 0.54%. A 1% increase in
the number of cars in a city increases overall social costs by almost 0.5%. This confirms that
reduced commuting and car ownership has a positive impact on air quality, thus reducing
the social costs of poor city air quality.
Comparison of our study’s findings regarding welfare losses with those from other research
shows that our results are sometimes higher than previously found. To a large extent this
can be explained by the more recent figures used here for valuing the adverse impacts of
air pollution. Our findings provide additional evidence that reducing air pollution in
European cities should be among the top priorities in any attempt to improve the welfare of
city populations in Europe. The present COVID-19 pandemic has only underscored this.
Comorbidities feature prominently in the mortality of COVID-19 patients and among the
most important of these are those associated with air pollution.
The figures reported here are cited without uncertainty ranges. In this kind of study,
uncertainty bounds are typically around 30-40%, implying that the figures reported here
could be a factor 1/3 lower or 1/3 higher. Finally, it should be stressed that our study is
based on reported levels of air quality, which may diverge from the actual situation, given
that air quality is still relatively sparsely monitored across Europe. As a result, the social
costs reported are likely to be an underestimate in some cities. If air pollution levels are in
fact higher than the figures reported in official statistics, the social costs will increase
accordingly.
7 190272 - Health costs of air pollution in European cities and the linkage with transport – October 2020
1 Introduction
1.1 Introduction
In many European cities, air pollution poses a significant threat to human health. For
Europe, the WHO estimate for the number of premature deaths attributed to air pollution is
over 500,000 (WHO Europe, 2018), with 400,000 early deaths in the EU28. Other studies
conclude that the WHO figures represent an underestimation and conclude that the factual
number of excess mortality is even higher (Lelieveld et al., 2019). Globally, air pollution is
considered as the 4th highest cause of death among all health risks, exceeded only by high
blood pressure, diet and smoking (HEI, 2018).
Outdoor air quality exceeds the WHO Air Quality Guidelines in many European cities and
public health and environmental action groups, citizens and politicians have called for
stricter air quality standards and policies to reduce emissions, especially from traffic. An
earlier study by CE Delft (CE Delft, 2018a) estimated that the total social costs of road
traffic related air pollution in the EU28 in 2016 was equivalent to € 67- 80 billion depending
on the emissions factors that were used. The share of diesel vehicles in these costs amounts
to 83% (CE Delft, 2018a). However, an integral calculation of the social costs of air pollution
in specific European cities so far has been lacking. This research aims to fill the gap by
calculating the social costs of air pollution at the level of individual cities through a
common methodology.
Cities are especially interesting from the policy perspective of improving the air quality.
Through planning, organizing and regulating various modes of transport, city governments
can have decisive influence on the air quality. While the study by CE Delft (CE Delft, 2018a)
primarily investigated social costs and policies at the national scale, the present study aims
to investigate this from the perspective of individual cities.
Text box 1 - Air pollution and the COVID-19 crisis
Recently, air quality has gained interest during the COVID-19 pandemic. Some initial research (see e.g. (Cole,
2020 #7993) has suggested that air pollution is a relevant contributor to COVID-19 mortality as it (i) may
increase the risk of infection, and (ii) result in a higher mortality from the disease. The first impact relates to
the fact that aerosols containing the virus may be more easily spread in areas where there are more aerosols
from air pollution. The second impact relates to the fact that air pollution can cause hypertension, diabetes
and respiratory diseases: conditions that doctors are linking to higher mortality rates for COVID-19. The
correlation between air pollution and COVID-19 mortality could also be explained with reference to the
negative impact air pollution has on the immune system. More fundamental research on the relationship
between COVID-19 mortality and air pollution is, however, beyond the scope of the present study.
1.2 Project aims
The present project has the following aim:
To estimate for European cities, provided data availability, the social costs of outdoor air
pollution and to assess the impact of the design of transport in those cities on air quality.
The project thus tackles two different questions:
1. What are the health related damage costs from air pollution in European Cities?
2. What is the contribution of transport to these health costs?
8 190272 - Health costs of air pollution in European cities and the linkage with transport – October 2020
1.3 Delineation and caveats
There are a number of limitations in our methodology that should be well understood:
— The study focusses only on outdoor pollution. Indoor pollution, such as in houses or
metro’s, is not considered in this study.
— The project focuses only on three causes of air pollution: (i) PM10 and PM2.5
concentrations; (ii) Ozone formation above the 35ppb; (iii) NO2 concentrations. There
are many other pollutants that have adverse impacts on human health, such as
polycyclic aromatic hydrocarbons, or trace heavy metals: these have not been included
in the research. There are also other classifications of particulate matter concentrations
that may have a more direct link with damage from air pollution, such as ultrafines or
black carbon. However, these have not been included in this research either for reasons
of lack of data. Therefore our study typically presents a lower estimate of the social
costs of air pollution.
— The research estimates social costs from reported air quality. Therefore, our research
uses data from Eurostat, Urban Audit, to estimate the social costs of air pollution.
The Urban Audit data are basically reported by the cities themselves. We did not check
in this research if the reported data of air quality was correct, or representing the true
situation of pollution in a particular city. Therefore our results are entirely contingent
on the quality of the data and our procedures to update the data of Eurostat’s Urban
Audit to more recent years. In Paragraph 2.4 and Annex A we describe our data
procedure in more detail.
— The use of data from the Urban Audit also implied that cities in this research should
be read as ‘urban areas’ as in some cases areas are input in the calculations rather
than administrative cities. We did not take a decision here but took the administrative
unit that was reported in the Urban Audit statistics as our point of entry in this
research. If not a city but an area was reported, we use the prefix Greater to the city
name unless the administrative unit has its own name, such as the Górnośląsko-
Zagłębiowska Metropolia in Poland that was named by us with its popular name
‘Metropolia Silesia’.
— In this research we use concentration response functions that have been
recommended by the WHO. The WHO recommended values (WHO, 2013) are based on
studies that are now slightly outdated. Recent research has indicated convincing
evidence for a variety of other adverse health impacts of air pollution. However, our
research does not address any impacts beyond those recommended by the WHO.
Paragraph 2.2. identifies which impacts have been considered in this study and which
impacts have not been quantified.
— In this research we only focus on health related costs. There may be other costs from
air pollution, such as ecosystems degradation or adverse impacts on buildings and
materials that have to be maintained more often (e.g. the loss of the quality of paint
due to ambient ozone or soiling of building stones). Such impacts have not been
included in this study.
— In this research we do not differentiate between anthropogenic and natural PM
emissions. The European Commission (EC, 2011) recommended that natural fractions,
such as sea salt and desert dust fractions, should be subtracted from the annual mean
of concentration. However, this proved not to be possible in this research as this would
imply that we would have to determine the natural contribution to every measuring
station used in this research.
— There have been many research papers quantifying the social costs at the level of
individual cities including spatial modelling of emission and dispersion. We immediately
recognize that such approach is superior over our method based on reported values of
air quality. Therefore, our results should not be seen as an update or improvement
over more detailed studies (see Paragraph 1.4). Such studies also tend to take other
9 190272 - Health costs of air pollution in European cities and the linkage with transport – October 2020
subtleties into account, such as the various components in PM concentrations and these
have not been incorporated here as well due to lack of data. The advantage of our
study, however, is the sheer size of cities to be included, as this study provides a
monetary estimate of the social costs of air pollution in 432 cities through a harmonized
methodology. However, the results from this study should always be regarded as
indicative and detailed future research on the individual city level is to be preferred
from a scientific perspective.
1.4 Relation to other research in this area
Adverse impacts of air pollution on health in European cities has been the subject of a
growing number of studies. These studies often show the incidence of air pollution on
mortality and morbidity endpoints for single cities or a group of cities in one country.
Examples are, for example, Garrett and Casimiro (2011) for Lisboa, Bañeras et al. (2018) for
Barcelona, Badyda et al. (2017) for 11 Polish cities and Fang et al. (2016) for 74 cities in
China.
A few studies have done this in particular for transport related emissions, such as ICCT
(2019) that has estimated the global burden of disease from transport related emissions and
developed specific factsheets for e.g. Paris, London and Germany. Sometimes these studies
also offer monetization of the impacts on air quality. E.g. Kings College (King's College,
2015) has quantified in-depth the costs of air pollution in London while other studies have
conducted such research for Thessaloniki (Vlachokostas et al., 2012) or Skopje (Martinez et
al., 2018). Although the literature on this topic is thus relatively abundant, they can be
poorly compared to each other due to differences in methods, coverage (i.e. the impacts
taken into account) and data.
Our study is different in this respect in the sense that it provides an overview of social costs
of air pollution in 432 cities using a comprehensive common methodology that has been
developed in peer-reviewed work for the European Commission (CE Delft and INFRAS,
2019).1 In this way cities can be compared with each other and conclusions can be drawn on
the question in which cities air pollution has the most adverse impacts. Moreover, we aim
to connect this information with the structure of transport and other activities in a city to
investigate to what extent air pollution can be reduced by transport related policies.
1.5 Reading guide
Chapter 2 describes concepts used in this study. Chapter 3 contains the results of the
estimation of the social costs of air pollution in 432 cities. Chapter 4 contains the results of
the estimation of the impact of transport to these costs. Chapter 5 concludes.
________________________________ 1 We applied some adaptations to this methodology to be able to apply it at the city level. See also Chapter 2.
10 190272 - Health costs of air pollution in European cities and the linkage with transport – October 2020
2 Concepts and methods
2.1 Introduction
In this chapter we introduce the concept of social costs that is central in this research and
outline the methodology that we have been using for estimating the health costs from air
pollution in European cities. First in Paragraph 2.2 we present an overview of known health
impacts from air pollution and discuss health impacts that have been included in our
research. Then, in Paragraph 2.3, we introduce the concept of social costs as a way to
monetize these health impacts. Subsequently, in Paragraph 2.4, we will outline the
methodology followed in this research to estimate damage costs to human health from air
pollution.
2.2 Health impacts from air pollution2
Since a long time air pollution is known to have adverse impacts on human health. In the
1950s many cities were heated with coal fired stoves. For example, in London, the great
smog of December 1952, killed 3-4,000 citizens according to official statistics — a figure
that in later research has been upscaled to over 12’000 when comorbidity impacts were
properly taken into account (Bell et al., 2004). The WHO published in 1958 their first
monograph on adverse health impacts from pollution and since then evidence of air
pollution on a variety of health related endpoints has been growing.
In general four major impacts can be considered stemming from air pollution:
1. Concentration of primary and secondary aerosols (PM2.5/PM10).
2. Concentration of ozone ambient levels (O3).
3. NO2 concentrations.
4. Other toxic substances.
Below we will elaborate on these impacts in more detail.
2.2.1 Concentration of particulate matter
Particulate matter is a collective term for liquid and solid particles in the air (also known as
aerosols). Different particulates are commonly classified by their size: PM10, PM2.5 and
PM0.1 (the latter called ultrafine particles). The numeric number means the maximum
diameter size of these particles. PM2.5 relate thus to all particles with an aerodynamic
diameter of 2.5µm and smaller. PM2.5 is sometimes called “fine particulates” and PM0.1
‘ultrafine particulates’.
All three size groups of PM are associated with transport emissions. All three categories of
particulate matter contain exhaust emissions from transport. PM10 also includes the wear of
brakes, tires and roads; PM2.5 and PM0.1 are primarily related to the exhaust emissions from
the tailpipe of diesel vehicles and other modes of transport. Aviation can also be an
important emitter of PM0.1.
Next to primary PM directly emitted by diesel vehicles, secondary PM is mainly formed
through chemical reactions between SO2, NH3, NOx and VOCs. Such particles are being
________________________________ 2 This chapter is partly based and recycled from CE Delft (2018).
11 190272 - Health costs of air pollution in European cities and the linkage with transport – October 2020
formed under influence of sunlight, weather conditions and general atmospheric conditions.
WHO (2013) has concluded that secondary particles are just as harming as primary particles
so the distinction only refers to the different origin, not to the relative harm caused by the
aerosols.3
Ambient particulate matter (PM) is ranked as the 6th risk factor for total deaths globally,
through cancer, lower- and chronic respiratory diseases and cardiovascular diseases (HEI,
2018). This makes it the most harmful element of diesel exhaust to the human health. The
reason for this is that the most dominant way the human body takes up air pollutants is by
breathing. The severance of the harm caused is largely determined by how far a certain
pollutant can penetrate into the human body through inhalation. The smaller a pollutant is,
the further into the tissue of the lungs it can get. That’s the reason why the particulate
matter from diesel exhaust is so harmful: it mainly consists of fine and ultrafine particulate
matter.
Diseases which have been proven to be causally relatable to PM2.5 are ischemic heart
disease, stroke, lung cancer, lower respiratory infections, and chronic obstructive
pulmonary disease (COPD) (HEI, 2018). Both long- and short-term exposure to PM2.5 has
negative respiratory and cardiovascular effects, including acute (out of hospital cardiac
arrests) and chronic cardiovascular mortality. Other impacts include neurological disorders
and diabetes, out of hospital cardiac arrests and birth defects. However, these latter
diseases have not yet been recommended by the WHO to be included in cost-benefit
analysis as more research would be required to quantify their precise impact.
There is some evidence that smaller particles, such as PM0.1 (ultrafine particles), contain the
most dangerous fractions that cause most of the adverse health impacts. However, ultrafine
particles are presently not frequently measured in monitoring stations. To some extent,
PM2.5 can serve as a proxy for the impacts of ultrafine particles (see also Text box 2).
Text box 2 - Health effects of ultrafine particles
In general, the smaller the particles the larger the health impacts. However, the question whether ultrafine
particles (UFP) have an additional health damage to other pollutants such as PM2.5 is still subject to scientific
debate. Theoretically, UFP have the potential to cause more harm than bigger particles, since it can penetrate
deeper into the body. Potential conditions that are linked with UFP are i.a. systemic inflammation, endothelial
dysfunction, cardiovascular disease, diabetes, cancer, and cerebral and autonomic dysfunction. Therefore the
potential health cost of UFP is therefore substantial. However, the precise role of UFP in such illnesses is still
unknown(Schraufnagel, 2020).
There are some recent studies that demonstrate the effects of ultrafine particles on aspects of health,
independent of other sizes of particles. For instance, (Lavigne et al., 2019) find that the onset of asthma in
children can be linked to exposure to UFP during a critical period of lung development. These results are found
independent of the influence of PM2.5 and NO2. Furthermore, short term exposure to UFP is associated with an
increased heart rate during various physical activities (Rizza et al., 2019). Short term exposure to UFP has also
been found to be associated with decreased lung function and a prolonged QTc interval in healty adults
(Lammers et al., 2020) Moreover, a recent study shows that exposure to UFP is associated with increased risk of
brain tumors in adults, whereas this cannot be said for PM2.5 and NO2 (Weichenthal et al., 2020).
However, there are also studies that cannot conclude that particle size matters for certain health effects, i.e.
that different particle sizes have an independent effect on health. For instance, (Ohlwein et al., 2019) find
some short-term associations of UFP with inflammatory and cardiovascular changes. However, these effects are
________________________________ 3 Currently the WHO is in the process of updating the 2013 recommended values, which may also include a
reassessment of the relative harm of various origins of PM2.5.
12 190272 - Health costs of air pollution in European cities and the linkage with transport – October 2020
only partly independent, and for other health outcomes the results are inconclusive. In a study on the effects of
UFP on respiratory health in adults, (Donaire-Gonzalez et al., 2019) do not find evidence of the relevance of
particle size for the potential to cause respiratory disease.
Overall, although not all effects are proven, the health impacts of ultrafine particles (UFP) could be larger than
the impacts of fine particles (PM2.5). It is also possible that a large part of the health effects of PM2.5 is in fact
caused by the UFP part in PM2.5. However, UFP are not usually monitored in the monitoring stations. Therefore,
PM2.5 is the closest alternative. Moreover, the health effects included in this study are proven to be associated
with exposure to PM2.5. The extent to which PM2.5 and UFP are representative of each other, is, however,
debatable. For instance, (De Jesus and al., 2019) show that measurements of UFP and PM2.5 are not
representative of each other. Consequently, PM2.5 measurements may be somewhat inaccurate when calculating
the cost of health effects.
A relatively large share of transport related emissions contain black carbon (also known as
soot particles or elementary carbon). The health effects associated with them do not only
lie in their small size, but as well in the fact that they can carry traces of heavy metals or
PAHs and NMVOCs on their surface: these enter your body when soot does. Soot has been
characterized as being a carcinogen by the International Cancer Research Organization.
Although there is growing evidence that black carbon is much more dangerous than other
types of particles (WHO, 2012) and that the concentration of these particulates in the air is
a 100% higher in streets with a high amount of traffic than in a street with little traffic
(RIVM, 2013) a separate valuation has not been included in the WHO (2013) guidelines.
2.2.2 Concentration of ozone
Tropospheric (also known as ground-level) ozone (O3) is a secondary air pollutant. It is
formed via multiple reactions between NOx, CO and volatile organic compounds (VOCs), in
the presence of light (e.g. photo-chemically). Under certain weather conditions, a high
concentration of ozone in the air can lead to smog which is especially a problem in warm
urban areas. In some places the occurrence of smog is highly related to the season.
Short-term exposure to ozone has proven to be causally related to respiratory effects such
as inflammation, aggravation of asthmatic symptoms, increase in hospital admissions and
respiratory related acute mortality. Additionally, it is a cause of chronic obstructive
pulmonary disease (COPD) and is probably related to cardiovascular effects and acute
all-cause mortality. In warm weather, acute impacts of elevated ground-level ozone levels
can be experienced by both healthy people and people with already reduced lung function.
Long-term exposure may cause an increase of incidence of asthma amongst children.
Globally, ozone is ranked as the 33th risk factor for total deaths, due to its severe causal
relation to chronic respiratory diseases (HEI, 2018).
2.2.3 Concentration of NO2
Primary nitrogen oxides (NOx) from combustion of fuels is mainly composed of NO which can
be oxidized to secondary NO2 in the presence of oxygen (from air). However, it should be
noted that the share of primary NO2 in diesel vehicle exhaust is higher than in petrol vehicle
exhaust, as NO is already oxidized in the diesel vehicle’s exhaust treatment system. NOx is
part of the gas phase emissions of diesel engines. In a study by Jonson et al. (2017) it is
estimated that 10,000 premature deaths of adults over 30 in 2013 in the EU28 and
Switzerland, can be attributed to NOx emissions from diesel cars and light commercial
vehicles. Of these, 50% could have been avoided if the cars had the same on-the-road NOx
emissions as reported in the laboratory tests.
13 190272 - Health costs of air pollution in European cities and the linkage with transport – October 2020
NOx enters the body by inhalation and is adsorbed through the respiratory system tissue into
the circulation (Finnish Institute for Occupational Health, 2016). The evidence of adverse
health impacts of NOx have long not been attributed to the compounds itself (mainly NO2),
but rather to PM2.5 and ozone as these are formed by NOx. Double-counting of health effects
has to be avoided. However, in recent years experts have stated that substantial evidence
has become available for health effects of both short-term and long-term exposure directly
attributional to NO2 (COMEAP, 2015, EPA, 2016) Now a relation between short-term NO2
exposure and respiratory symptoms such as inflammation, aggravation of symptoms in
asthma patients and aggravation of allergic reactions in the respiratory tract have been
proven. Additionally, the incidence of asthma in children due to long-term exposure to NO2
is probable. WHO (2013) therefore state that NO2 can be included as all-cause mortality but
that double counting with the all-cause mortality of PM2.5 should be avoided. Experts
acknowledge that the discussion about whether or not NO2 is directly accountable for
negative health effects caused by air pollution, is still open. This is illustrated by the
recently published statement of COMEAP on NO2 mortality effects: experts of the COMEAP
group state that they were not able to reach consensus about all the outcomes in the report
(COMEAP, 2018).
2.2.4 Other substances
There is ample evidence that other substances as PAHs (polycyclic aromatic hydrocarbons)
and some NMVOCs are carcinogenic in nature. In addition, non-cancer health effects have
been reported for PAHs. Although important, such elements have not been included in the
WHO (2013) recommendations on including health impacts from air pollution in cost-benefit
analysis. In addition, monitoring stations in Europe for PAHs are still largely absent.
Therefore, such substances have not been included in our study.
2.2.5 Quantification of physical endpoints
The present study uses the WHO (2013) guidelines on including the impacts from air
pollution as a starting point. The WHO WHO (2013) reports the relative risks of various
endpoints. Relative risk is a measure of the impact of a disease measured as the ratio of the
incidence observed at two different exposure levels. The RR thus can be interpreted as the
increase in percentages in the relative risk in the reported impact due to an increase in
exposure levels of 10µg/m3. Both in the handbook on Environmental Prices (CE Delft, 2018b)
as the Handbook of External Costs of Transport (CE Delft et al., 2019) and (CE Delft, 2018a),
these relative risks have been translated to concentration response function.4
In this study we have used a hybrid approach between (i) directly using the RR from the
WHO (2013)with country specific information on incidence rates to calculate the
attributable risks, and (ii) using concentration response functions that provide a direct
translation between concentration of pollution and the impacts that these pollution cause:
1. For mortality from PM2.5, O3 and NO2 we have used the relative risks from WHO (2013)
and applied country specific incidence rates to determine the additional mortality in a
________________________________ 4 A concentration response function TNO, FACIT, VTT, GRAZ, T., PTV, DAI, CLU, VCC, SAFER, UNIS, et al. 2014.
Impact assessment and user perception of cooperative systems : D11.4 of the Drive C2X project. Delft: TNO. is a
function that describes the chance of getting a disease from a certain level of air pollution. To quantify
damages one needs to translate the relative risk (RR) in terms of an concentration response function, also called
exposure response function (Rabl et al., 2014). For this one needs to know the existing risk on these incidents.
So for an RR of 1.046 per 10/µg/m3 for Working Days Loss due to PM2.5 lung diseases, one needs to understand
how often the population already is losing working days from lung diseases. Then the CRF can then be regarded
as the product of the baseline incidence and the Delta RR.
14 190272 - Health costs of air pollution in European cities and the linkage with transport – October 2020
specific city from a certain level of air pollution. These mortality endpoints together
constitute around 70% of total damage because of air pollution.
2. For morbidity impacts plus infant mortality we use concentration response functions as
developed in CE Delft (2019). In the calculation of these concentration response
functions, European average incidence rates have been used (which are thus not
differentiated between countries).5 The morbitidy endpoints cause, in general, around
30% of damage from air pollution. Annex B.1 provides more information on the provided
methods, relevant risks and concentration response functions that have been used.
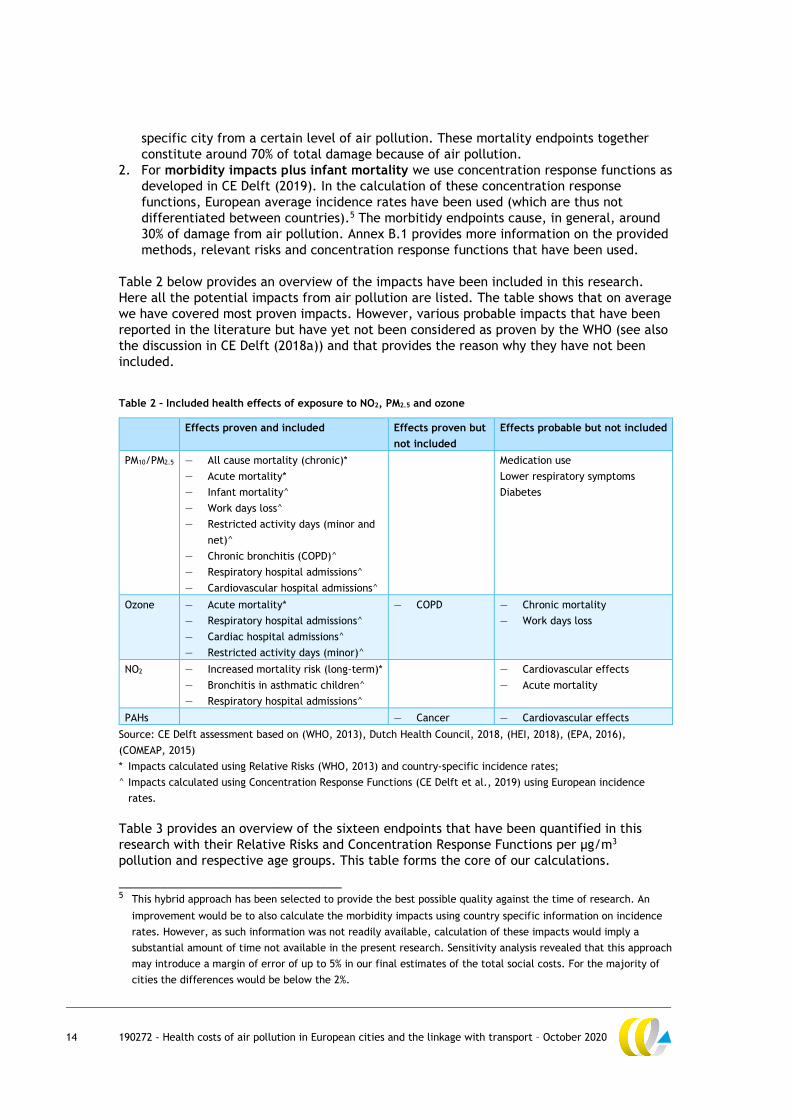
Table 2 below provides an overview of the impacts have been included in this research.
Here all the potential impacts from air pollution are listed. The table shows that on average
we have covered most proven impacts. However, various probable impacts that have been
reported in the literature but have yet not been considered as proven by the WHO (see also
the discussion in CE Delft (2018a)) and that provides the reason why they have not been
included.
Table 2 – Included health effects of exposure to NO2, PM2.5 and ozone
Effects proven and included Effects proven but
not included
Effects probable but not included
PM10/PM2.5 — All cause mortality (chronic)*
— Acute mortality*
— Infant mortality^
— Work days loss^
— Restricted activity days (minor and
net)^
— Chronic bronchitis (COPD)^
— Respiratory hospital admissions^
— Cardiovascular hospital admissions^
Medication use
Lower respiratory symptoms
Diabetes
Ozone — Acute mortality*
— Respiratory hospital admissions^
— Cardiac hospital admissions^
— Restricted activity days (minor)^
— COPD — Chronic mortality
— Work days loss
NO2 — Increased mortality risk (long-term)*
— Bronchitis in asthmatic children^
— Respiratory hospital admissions^
— Cardiovascular effects
— Acute mortality
PAHs — Cancer — Cardiovascular effects
Source: CE Delft assessment based on (WHO, 2013), Dutch Health Council, 2018, (HEI, 2018), (EPA, 2016),
(COMEAP, 2015)
* Impacts calculated using Relative Risks (WHO, 2013) and country-specific incidence rates;
^ Impacts calculated using Concentration Response Functions (CE Delft et al., 2019) using European incidence
rates.
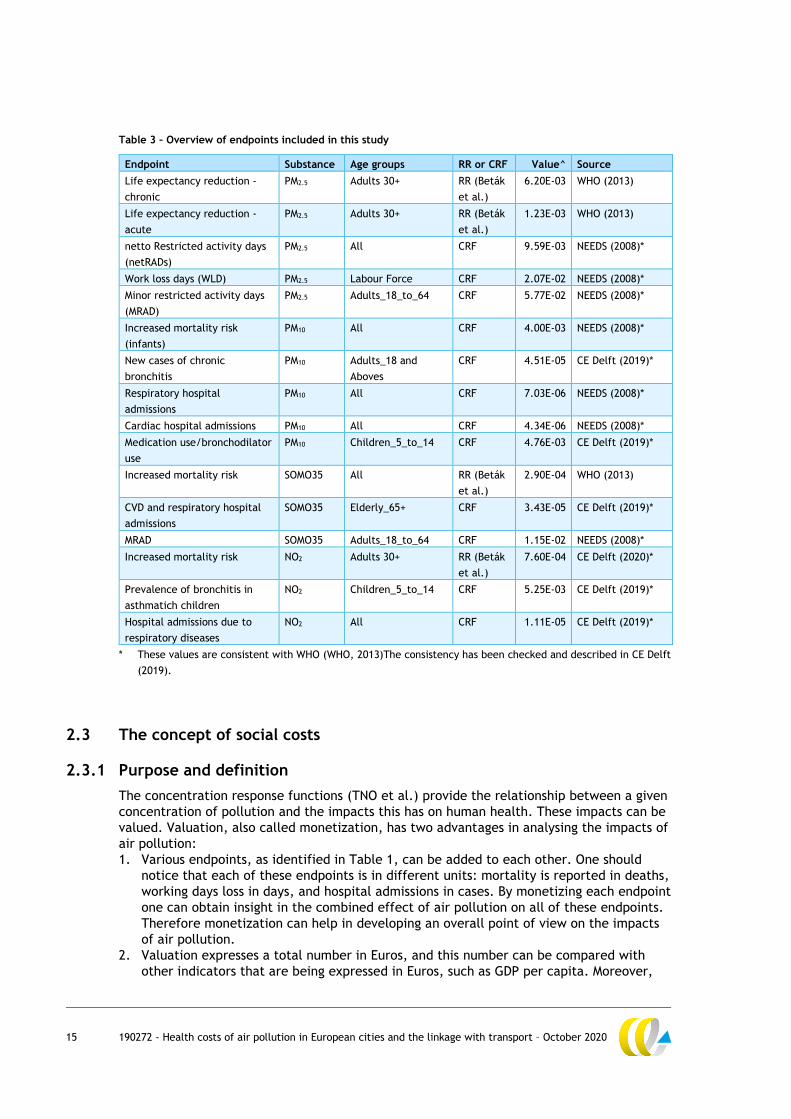
Table 3 provides an overview of the sixteen endpoints that have been quantified in this
research with their Relative Risks and Concentration Response Functions per µg/m3
pollution and respective age groups. This table forms the core of our calculations.
________________________________ 5 This hybrid approach has been selected to provide the best possible quality against the time of research. An
improvement would be to also calculate the morbidity impacts using country specific information on incidence
rates. However, as such information was not readily available, calculation of these impacts would imply a
substantial amount of time not available in the present research. Sensitivity analysis revealed that this approach
may introduce a margin of error of up to 5% in our final estimates of the total social costs. For the majority of
cities the differences would be below the 2%.
15 190272 - Health costs of air pollution in European cities and the linkage with transport – October 2020
Table 3 – Overview of endpoints included in this study
Endpoint Substance Age groups RR or CRF Value^ Source
Life expectancy reduction -
chronic
PM2.5 Adults 30+ RR (Beták
et al.)
6.20E-03 WHO (2013)
Life expectancy reduction -
acute
PM2.5 Adults 30+ RR (Beták
et al.)
1.23E-03 WHO (2013)
netto Restricted activity days
(netRADs)
PM2.5 All CRF 9.59E-03 NEEDS (2008)*
Work loss days (WLD) PM2.5 Labour Force CRF 2.07E-02 NEEDS (2008)*
Minor restricted activity days
(MRAD)
PM2.5 Adults_18_to_64 CRF 5.77E-02 NEEDS (2008)*
Increased mortality risk
(infants)
PM10 All CRF 4.00E-03 NEEDS (2008)*
New cases of chronic
bronchitis
PM10 Adults_18 and
Aboves
CRF 4.51E-05 CE Delft (2019)*
Respiratory hospital
admissions
PM10 All CRF 7.03E-06 NEEDS (2008)*
Cardiac hospital admissions PM10 All CRF 4.34E-06 NEEDS (2008)*
Medication use/bronchodilator
use
PM10 Children_5_to_14 CRF 4.76E-03 CE Delft (2019)*
Increased mortality risk SOMO35 All RR (Beták
et al.)
2.90E-04 WHO (2013)
CVD and respiratory hospital
admissions
SOMO35 Elderly_65+ CRF 3.43E-05 CE Delft (2019)*
MRAD SOMO35 Adults_18_to_64 CRF 1.15E-02 NEEDS (2008)*
Increased mortality risk NO2 Adults 30+ RR (Beták
et al.)
7.60E-04 CE Delft (2020)*
Prevalence of bronchitis in
asthmatich children
NO2 Children_5_to_14 CRF 5.25E-03 CE Delft (2019)*
Hospital admissions due to
respiratory diseases
NO2 All CRF 1.11E-05 CE Delft (2019)*
* These values are consistent with WHO (WHO, 2013)The consistency has been checked and described in CE Delft
(2019).
2.3 The concept of social costs
2.3.1 Purpose and definition
The concentration response functions (TNO et al.) provide the relationship between a given
concentration of pollution and the impacts this has on human health. These impacts can be
valued. Valuation, also called monetization, has two advantages in analysing the impacts of
air pollution:
1. Various endpoints, as identified in Table 1, can be added to each other. One should
notice that each of these endpoints is in different units: mortality is reported in deaths,
working days loss in days, and hospital admissions in cases. By monetizing each endpoint
one can obtain insight in the combined effect of air pollution on all of these endpoints.
Therefore monetization can help in developing an overall point of view on the impacts
of air pollution.
2. Valuation expresses a total number in Euros, and this number can be compared with
other indicators that are being expressed in Euros, such as GDP per capita. Moreover,
16 190272 - Health costs of air pollution in European cities and the linkage with transport – October 2020
most people immediately have an idea how serious the impact is if the effects of air
pollution are being monetized. If these impacts would mount to € 10 per capita per
year, one would know that this is probably relatively small. However, if these impacts
would mount to thousand Euro per capita per year, one can imagine that these impacts
are actually reducing a substantial amount of our welfare.
The value of the impacts of air pollution could be described as ‘social costs’. In economic
terms, social costs are private costs borne by individuals directly involved in a transaction
together with the external costs borne by third parties not directly involved in the
transaction. Social costs imply that total welfare is lower in a market economy because
various market failures exists. Air pollution is a traditional example of such a market
failures when the polluter does not take into account the costs his pollution causes upon the
society. Another typical cause of a market failure is that certain goods, such as a good
health or freedom cannot be bought on a market and that property rights are not well
defined.
Social costs consist of market costs and non-market costs. Market costs are equivalent to
expenditures, non-market costs are impacts on welfare that do not lead to expenses. While
a few impacts of air pollution result in expenditures, such as hospital admissions, most of
the impacts do not result in expenditures but yet deeply impact on welfare. Consider for
example child mortality. While it is clear that a child dying is a nightmare of all parents
that would have to be circumvented against any costs, parents cannot “buy” the health of
their children on a market. Nor can the costs of funerals be representative of the feelings of
grief and loss from the death of a child. Clearly, child mortality deeply impacts on the
happiness and live conditions of their parents. The same applies to sickness of your own
body: while it is clear that your life conditions are much better without COPD, we cannot
buy this in a supermarket and the costs of medication and medical treatment are by no
means indicative of the loss of welfare that someone with an uncurable disease like COPD
experiences.
Therefore, economists have tried to investigate ways to monetize this loss of welfare so
that it can be used in economic tools like cost-benefit analysis. The ‘willingness to pay’ or
‘willingness to accept’ are tools in economics that can determine the value to society of
preventing the impacts on their health from air pollution, or the sum of money they are
wanting to compensate for these impacts.
2.3.2 Social cost estimates of health effects
Monetization of social costs is equivalent to determine the Willingness to Pay (WTP) for
avoiding the impacts of air pollution. In general four methods have been considered in the
economic literature to estimate the WTP for damage avoidance (CE Delft, 2018b)
1. Damage valuation via revealed preferences.
2. Damage valuation via stated preferences.
3. Damage valuation based on restoration costs.
4. Damage valuation based on abatement costs.
In economics there is an order of preference for their application in social cost calculations:
direct damage valuation via revealed or stated preferences is the most accurate method
and valuation based on abatement costs the least preferred.6
________________________________ 6 There may be exceptions to this general rule, though. For example, in the case of climate change, the damage
costs — referred to as the ‘social cost of carbon’ — are so uncertain that the abatement-cost method may
sometimes provide a better price indication.
17 190272 - Health costs of air pollution in European cities and the linkage with transport – October 2020
Valuation through revealed preferences may be based on the salary premiums that are
being paid for jobs that are more risky. In this way we can observe through actual market
behaviour what the implicit price premium is for a higher chance of accidents.
Alternatively, revealed preferences may be obtained through investigation of what people
are willing to pay for houses that have cleaner air. One drawback of this method is that
people have to be informed very well about the risks of living in more polluted areas if this
method is to provide a reliable estimator of the damage costs.7 Therefore, stated
preferences, where people can assign values through questionnaires (contingent valuation
method) or choice experiments, are believed to provide a more true picture of the value
people would attach to attain a higher life expectancy (at the end of their lives). If
respondents are honest, well-informed and rational, stated-preference research is in
principle the most reliable source of information on people’s preferences for environmental
quality (Hoevenagel, 1994). However, this theoretical, ideal situation does not usually hold
in practice. In practice, values are obtained through hypothetical questions and economic
literature shows that people may overestimate their willingness to pay for a certain good if
they do not have to pay for that directly. Moreover, strategic or socially desirable answers
may further diverge the outcomes of stated preference research from the ‘true’ value.
Nowadays, most estimates of the valuation of the impacts of air pollution have been
obtained through meta-analysis of various studies taken together. Valuation of mortality is
nowadays largely based on the overview of the OECD (2012) that has suggested a value of
statistical life (VSL) for air pollution related diseases of around € 2.5 million. As argued in
the NEEDS project (NEEDS, 2008), a valuation of life years lost (VOLY) is probably a better
estimate for air pollution as most impacts occur for elderly people. In CE Delft (2018b and
2019) and UBA (2019)an average value of the VOLY of € 70,000 (in prices 2015/2016) is
suggested as average in the literature. This is considerably higher than the NEEDS (2008)
estimate of € 40,000 (albeit in prices 2005), but still below the annuity of the OECD value of
statistical life of 2.5 million.
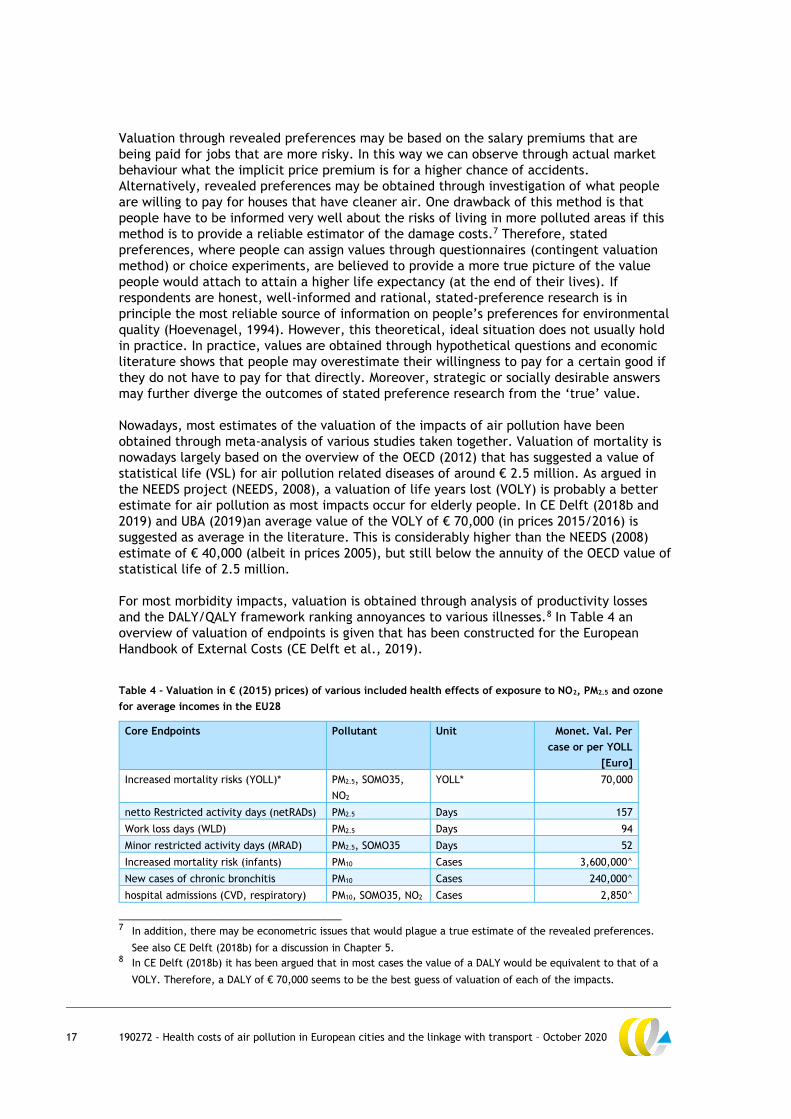
For most morbidity impacts, valuation is obtained through analysis of productivity losses
and the DALY/QALY framework ranking annoyances to various illnesses.8 In Table 4 an
overview of valuation of endpoints is given that has been constructed for the European
Handbook of External Costs (CE Delft et al., 2019).
Table 4 - Valuation in € (2015) prices) of various included health effects of exposure to NO2, PM2.5 and ozone
for average incomes in the EU28
Core Endpoints Pollutant Unit Monet. Val. Per
case or per YOLL
[Euro]
Increased mortality risks (YOLL)* PM2.5, SOMO35,
NO2
YOLL* 70,000
netto Restricted activity days (netRADs) PM2.5 Days 157
Work loss days (WLD) PM2.5 Days 94
Minor restricted activity days (MRAD) PM2.5, SOMO35 Days 52
Increased mortality risk (infants) PM10 Cases 3,600,000^
New cases of chronic bronchitis PM10 Cases 240,000^
hospital admissions (CVD, respiratory) PM10, SOMO35, NO2 Cases 2,850^
________________________________ 7 In addition, there may be econometric issues that would plague a true estimate of the revealed preferences.
See also CE Delft (2018b) for a discussion in Chapter 5. 8 In CE Delft (2018b) it has been argued that in most cases the value of a DALY would be equivalent to that of a
VOLY. Therefore, a DALY of € 70,000 seems to be the best guess of valuation of each of the impacts.
18 190272 - Health costs of air pollution in European cities and the linkage with transport – October 2020
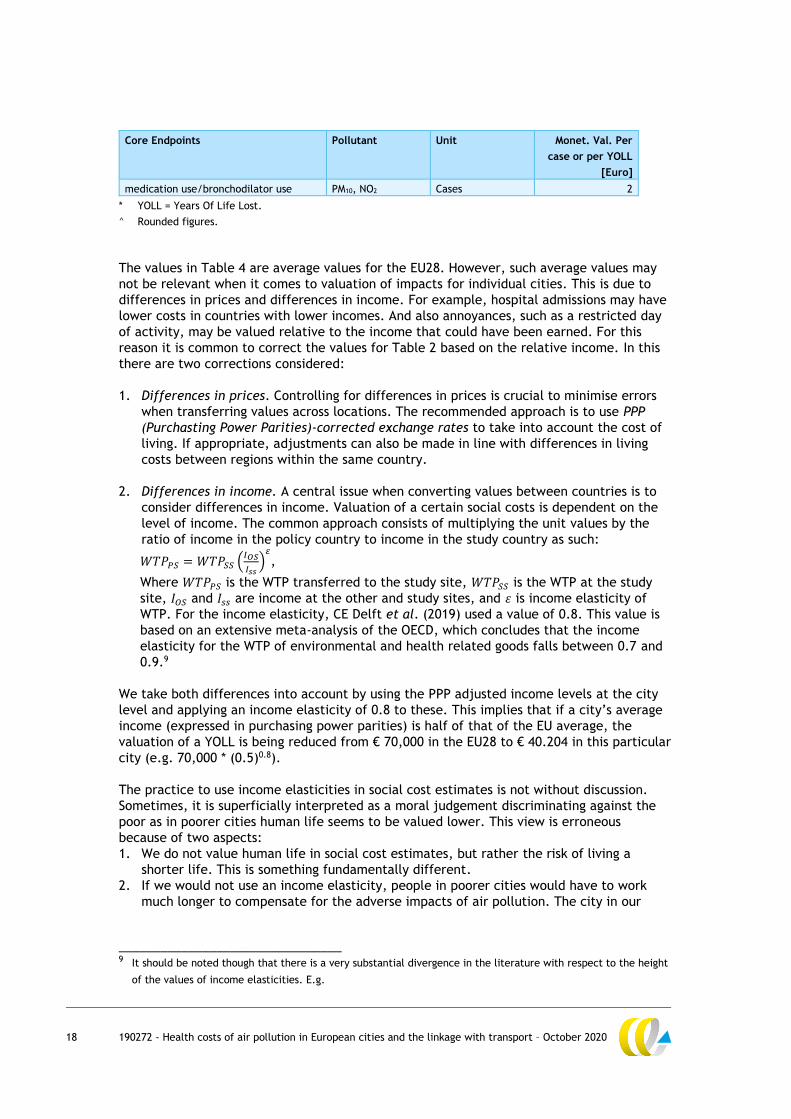
Core Endpoints Pollutant Unit Monet. Val. Per
case or per YOLL
[Euro]
medication use/bronchodilator use PM10, NO2 Cases 2
* YOLL = Years Of Life Lost.
^ Rounded figures.
The values in Table 4 are average values for the EU28. However, such average values may
not be relevant when it comes to valuation of impacts for individual cities. This is due to
differences in prices and differences in income. For example, hospital admissions may have
lower costs in countries with lower incomes. And also annoyances, such as a restricted day
of activity, may be valued relative to the income that could have been earned. For this
reason it is common to correct the values for Table 2 based on the relative income. In this
there are two corrections considered:
1. Differences in prices. Controlling for differences in prices is crucial to minimise errors
when transferring values across locations. The recommended approach is to use PPP
(Purchasting Power Parities)-corrected exchange rates to take into account the cost of
living. If appropriate, adjustments can also be made in line with differences in living
costs between regions within the same country.
2. Differences in income. A central issue when converting values between countries is to
consider differences in income. Valuation of a certain social costs is dependent on the
level of income. The common approach consists of multiplying the unit values by the
ratio of income in the policy country to income in the study country as such:
𝑊𝑇𝑃𝑃𝑆 = 𝑊𝑇𝑃𝑆𝑆 (𝐼𝑂𝑆
𝐼𝑠𝑠)
𝜀
,
Where 𝑊𝑇𝑃𝑃𝑆 is the WTP transferred to the study site, 𝑊𝑇𝑃𝑆𝑆 is the WTP at the study
site, 𝐼𝑂𝑆 and 𝐼𝑠𝑠 are income at the other and study sites, and 𝜀 is income elasticity of
WTP. For the income elasticity, CE Delft et al. (2019) used a value of 0.8. This value is
based on an extensive meta-analysis of the OECD, which concludes that the income
elasticity for the WTP of environmental and health related goods falls between 0.7 and
0.9.9
We take both differences into account by using the PPP adjusted income levels at the city
level and applying an income elasticity of 0.8 to these. This implies that if a city’s average
income (expressed in purchasing power parities) is half of that of the EU average, the
valuation of a YOLL is being reduced from € 70,000 in the EU28 to € 40.204 in this particular
city (e.g. 70,000 * (0.5)0.8).
The practice to use income elasticities in social cost estimates is not without discussion.
Sometimes, it is superficially interpreted as a moral judgement discriminating against the
poor as in poorer cities human life seems to be valued lower. This view is erroneous
because of two aspects:
1. We do not value human life in social cost estimates, but rather the risk of living a
shorter life. This is something fundamentally different.
2. If we would not use an income elasticity, people in poorer cities would have to work
much longer to compensate for the adverse impacts of air pollution. The city in our
________________________________ 9 It should be noted though that there is a very substantial divergence in the literature with respect to the height
of the values of income elasticities. E.g.
19 190272 - Health costs of air pollution in European cities and the linkage with transport – October 2020
example above, would have to work twice as hard to compensate for the negative
impacts from air pollution than the richer city. This may sound unfair as well.
Therefore, we use in this research a modest elasticity of 0.8 at the level of city’s income.
2.4 Calculation of social costs in this research
2.4.1 General calculation
The method to estimate the total health related damage costs (social costs) consists of
three steps:
1. Determine the concentration of air pollutants in an individual city.
2. Calculate unit specific damage costs for this city by applying the CRFs from Paragraph
2.2(and Annex B.3), life cohorts of the city (some endpoints are dependent on the age
structure) and apply the valuation framework as given in Paragraph 2.3 at the level of
individual cities using an income elasticity of 0.8.
3. Obtain a total damage cost figure by multiplying the concentration of pollutants by the
unit specific damage costs and the inhabitants of a city.
Below these are described in more detail.
2.4.2 Step 1: Estimate the reported air quality
The average concentration of pollutants in a city was obtained by combining two datasets:
1. Eurostat, Urban Audit database, for reported concentration of PM10; NO2 and O3. These
provide information for 392 cities for average concentration of pollution of PM10, O3 and
NO2 for the year 2013. More recent years are not available.
2. EEA Air Quality Statistics that provide for over 500 cities information from their
monitoring stations.
Starting point of our analysis has been the Eurostat Urban Audit database with information
from the year 2013. In order to obtain a more recent dataset we have updated the 2013
information from the Urban Audit by calculating for both 2013 and 2018 the average
concentration level of the monitoring stations in a city and using this as a factor to update
the 2013 data from the Urban Audit. The final level of concentration was determined by
using the following formula:
𝐶𝑜𝑛𝑐𝑖,𝑗,2018 = 𝐶𝑜𝑛𝑐(𝑈𝐴)𝑖,𝑗,2013 ∗ ∑ 𝐶𝑜𝑛𝑐(𝐸𝐸𝐴)𝑖,𝑗,2018 /𝑛2018𝑛
∑ 𝐶𝑜𝑛𝑐(𝐸𝐸𝐴)𝑖,𝑗,2013 /𝑛2013𝑛
Where i = pollutant (PM10,O3, NO2), j = city, UA = data from Urban Audit, EEA = data from
monitoring stations in an individual city.
This approach can provide a reliable result update of the reported level of concentration in
the Urban Audit if the reported average concentration level to the Urban Audit matches the
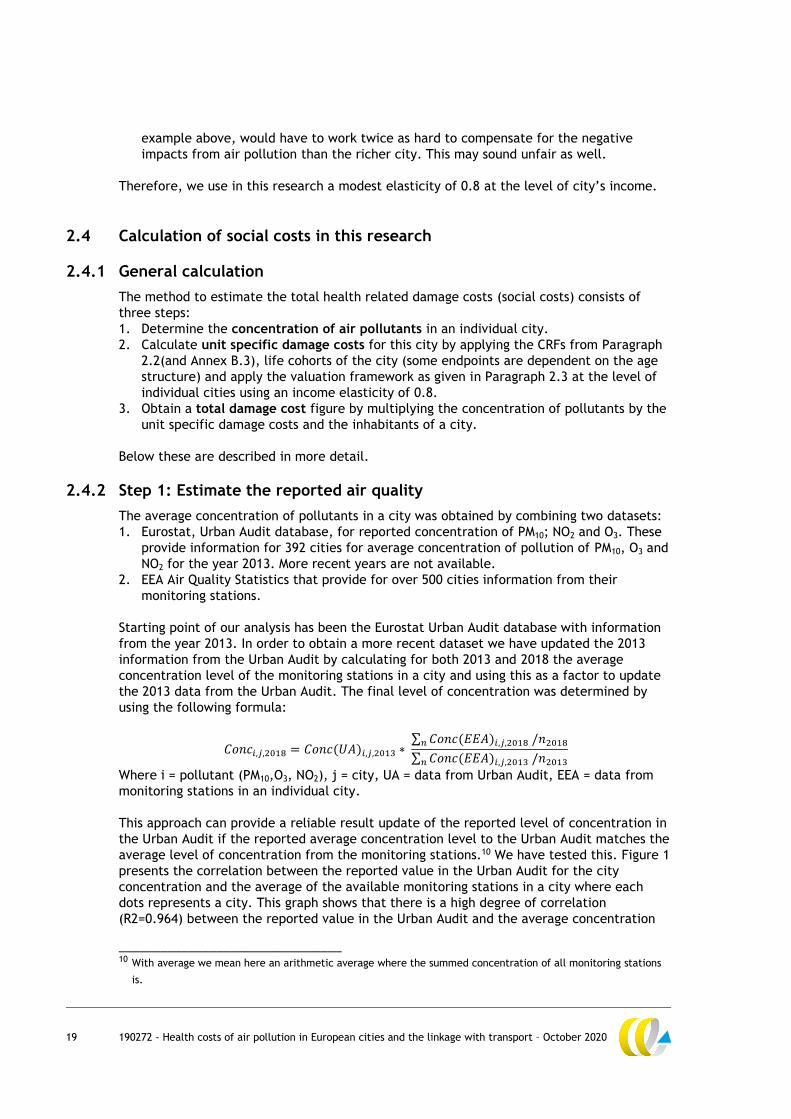
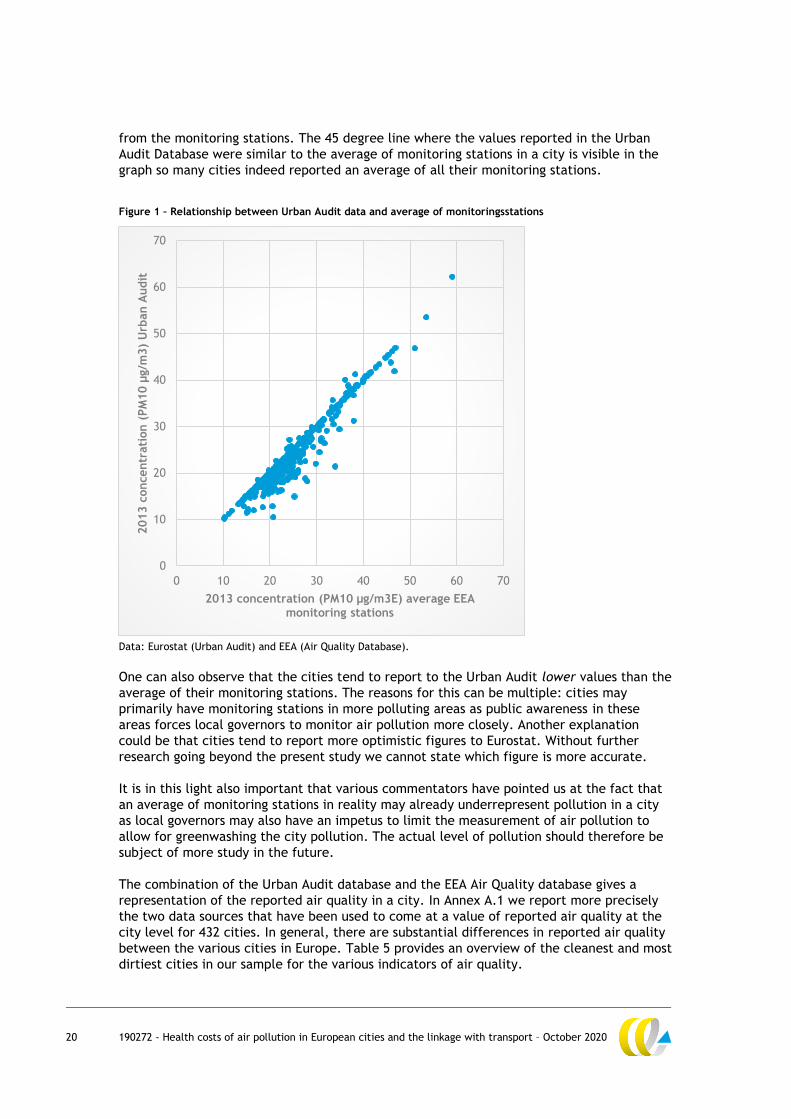
average level of concentration from the monitoring stations.10 We have tested this. Figure 1
presents the correlation between the reported value in the Urban Audit for the city
concentration and the average of the available monitoring stations in a city where each
dots represents a city. This graph shows that there is a high degree of correlation
(R2=0.964) between the reported value in the Urban Audit and the average concentration
________________________________ 10 With average we mean here an arithmetic average where the summed concentration of all monitoring stations
is.
20 190272 - Health costs of air pollution in European cities and the linkage with transport – October 2020
from the monitoring stations. The 45 degree line where the values reported in the Urban
Audit Database were similar to the average of monitoring stations in a city is visible in the
graph so many cities indeed reported an average of all their monitoring stations.
Figure 1 – Relationship between Urban Audit data and average of monitoringsstations
Data: Eurostat (Urban Audit) and EEA (Air Quality Database).
One can also observe that the cities tend to report to the Urban Audit lower values than the
average of their monitoring stations. The reasons for this can be multiple: cities may
primarily have monitoring stations in more polluting areas as public awareness in these
areas forces local governors to monitor air pollution more closely. Another explanation
could be that cities tend to report more optimistic figures to Eurostat. Without further
research going beyond the present study we cannot state which figure is more accurate.
It is in this light also important that various commentators have pointed us at the fact that
an average of monitoring stations in reality may already underrepresent pollution in a city
as local governors may also have an impetus to limit the measurement of air pollution to
allow for greenwashing the city pollution. The actual level of pollution should therefore be
subject of more study in the future.
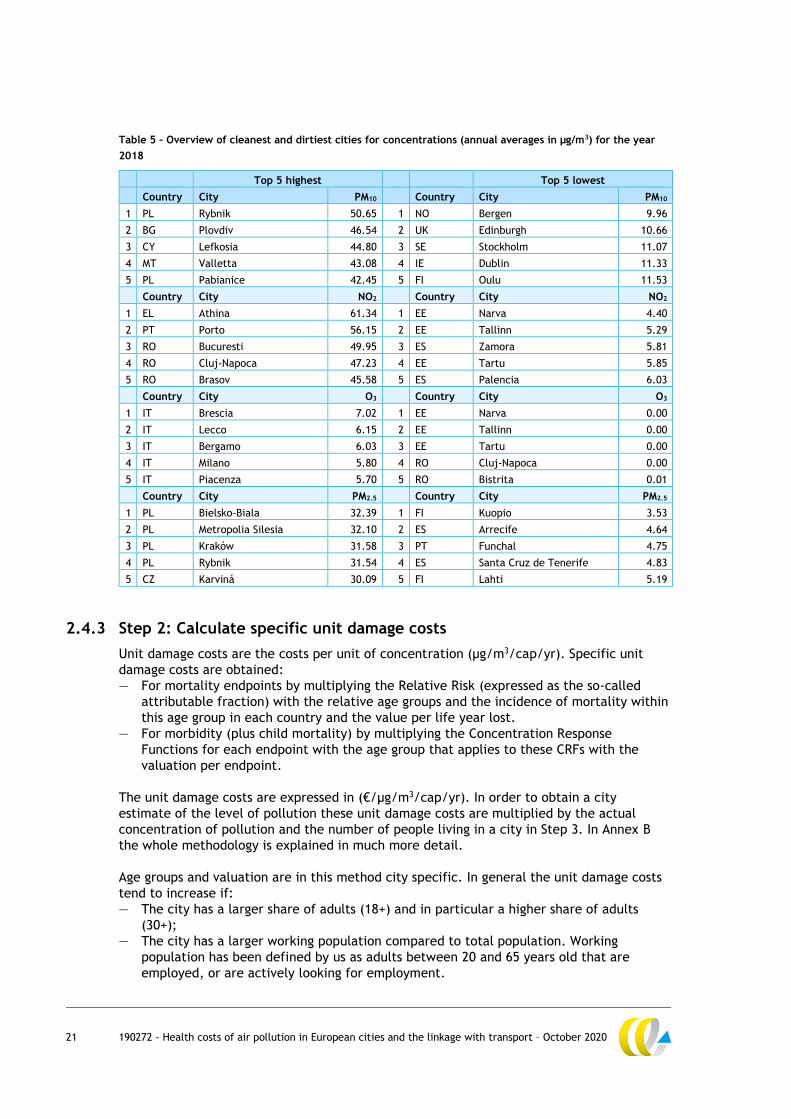
The combination of the Urban Audit database and the EEA Air Quality database gives a
representation of the reported air quality in a city. In Annex A.1 we report more precisely
the two data sources that have been used to come at a value of reported air quality at the
city level for 432 cities. In general, there are substantial differences in reported air quality
between the various cities in Europe. Table 5 provides an overview of the cleanest and most
dirtiest cities in our sample for the various indicators of air quality.
0
10
20
30
40
50
60
70
0 10 20 30 40 50 60 70
2013 c
oncentr
ati
on (
PM
10 µ
g/m
3)
Urb
an A
udit
2013 concentration (PM10 µg/m3E) average EEA monitoring stations
21 190272 - Health costs of air pollution in European cities and the linkage with transport – October 2020
Table 5 – Overview of cleanest and dirtiest cities for concentrations (annual averages in µg/m3) for the year
2018
Top 5 highest Top 5 lowest
Country City PM10 Country City PM10
1 PL Rybnik 50.65 1 NO Bergen 9.96
2 BG Plovdiv 46.54 2 UK Edinburgh 10.66
3 CY Lefkosia 44.80 3 SE Stockholm 11.07
4 MT Valletta 43.08 4 IE Dublin 11.33
5 PL Pabianice 42.45 5 FI Oulu 11.53
Country City NO2
Country City NO2
1 EL Athina 61.34 1 EE Narva 4.40
2 PT Porto 56.15 2 EE Tallinn 5.29
3 RO Bucuresti 49.95 3 ES Zamora 5.81
4 RO Cluj-Napoca 47.23 4 EE Tartu 5.85
5 RO Brasov 45.58 5 ES Palencia 6.03
Country City O3
Country City O3
1 IT Brescia 7.02 1 EE Narva 0.00
2 IT Lecco 6.15 2 EE Tallinn 0.00
3 IT Bergamo 6.03 3 EE Tartu 0.00
4 IT Milano 5.80 4 RO Cluj-Napoca 0.00
5 IT Piacenza 5.70 5 RO Bistrita 0.01
Country City PM2.5
Country City PM2.5
1 PL Bielsko-Biala 32.39 1 FI Kuopio 3.53
2 PL Metropolia Silesia 32.10 2 ES Arrecife 4.64
3 PL Kraków 31.58 3 PT Funchal 4.75
4 PL Rybnik 31.54 4 ES Santa Cruz de Tenerife 4.83
5 CZ Karviná 30.09 5 FI Lahti 5.19
2.4.3 Step 2: Calculate specific unit damage costs
Unit damage costs are the costs per unit of concentration (µg/m3/cap/yr). Specific unit
damage costs are obtained:
— For mortality endpoints by multiplying the Relative Risk (expressed as the so-called
attributable fraction) with the relative age groups and the incidence of mortality within
this age group in each country and the value per life year lost.
— For morbidity (plus child mortality) by multiplying the Concentration Response
Functions for each endpoint with the age group that applies to these CRFs with the
valuation per endpoint.
The unit damage costs are expressed in (€/µg/m3/cap/yr). In order to obtain a city
estimate of the level of pollution these unit damage costs are multiplied by the actual
concentration of pollution and the number of people living in a city in Step 3. In Annex B
the whole methodology is explained in much more detail.
Age groups and valuation are in this method city specific. In general the unit damage costs
tend to increase if:
— The city has a larger share of adults (18+) and in particular a higher share of adults
(30+);
— The city has a larger working population compared to total population. Working
population has been defined by us as adults between 20 and 65 years old that are
employed, or are actively looking for employment.
22 190272 - Health costs of air pollution in European cities and the linkage with transport – October 2020
— The incomes earned in a city are higher as every 10% increase in income results in a 8%
higher valuation of the impacts of air pollution due to the chosen income elasticity of
0.8 (see Paragraph 2.3.2).
2.4.4 Step 3: Calculate total damage costs
In a third step total damage costs are calculated by multiplying the reported concentration
with the unit damage costs and the total population affected. This gives a figure of the
total damage costs for air pollution in a given year. The larger the city, the greater the
social costs all else equal. Therefore we will also present the social costs per capita in
Chapter 3.
The method we employ use information at the level of cities, nations and Europe.
City specific information is used with respect to:
— the level of pollution in a city (see Step 1 above);
— the inhabitants of a city;
— the age cohorts living in a city;
— the average income earned in a city.
Nation specific information has been used with respect to:
— the incidence rates from mortality of different age groups.
European specific information has been used with respect to:
— the recommended relative risks from the WHO (2013),
— concentration response functions that combine relative risks and incidence rates for
morbidity in Europe.
23 190272 - Health costs of air pollution in European cities and the linkage with transport – October 2020
3 Results
3.1 Introduction
This chapter presents the calculated social costs associated with the impact of air pollution
on human health in European cities using the methodological framework identified in
Paragraph 2.4. The results will be presented in two different formats:
1. Absolute number of social costs of all cities (Paragraph 3.2).
2. Relative social costs per capita or per unit of GDP (Paragraph 3.3).
3.2 Total social costs
3.2.1 Total social costs
We have estimated the total social costs for 432 cities in 30 countries (EU28 plus Norway
and Switzerland). In total, over 130 million people live in these cities, with an average of
301,754 inhabitants per city. In 2018, total social costs for all 432 cities trespassed
€ 166 billion. The average cost per city is over € 385 million.
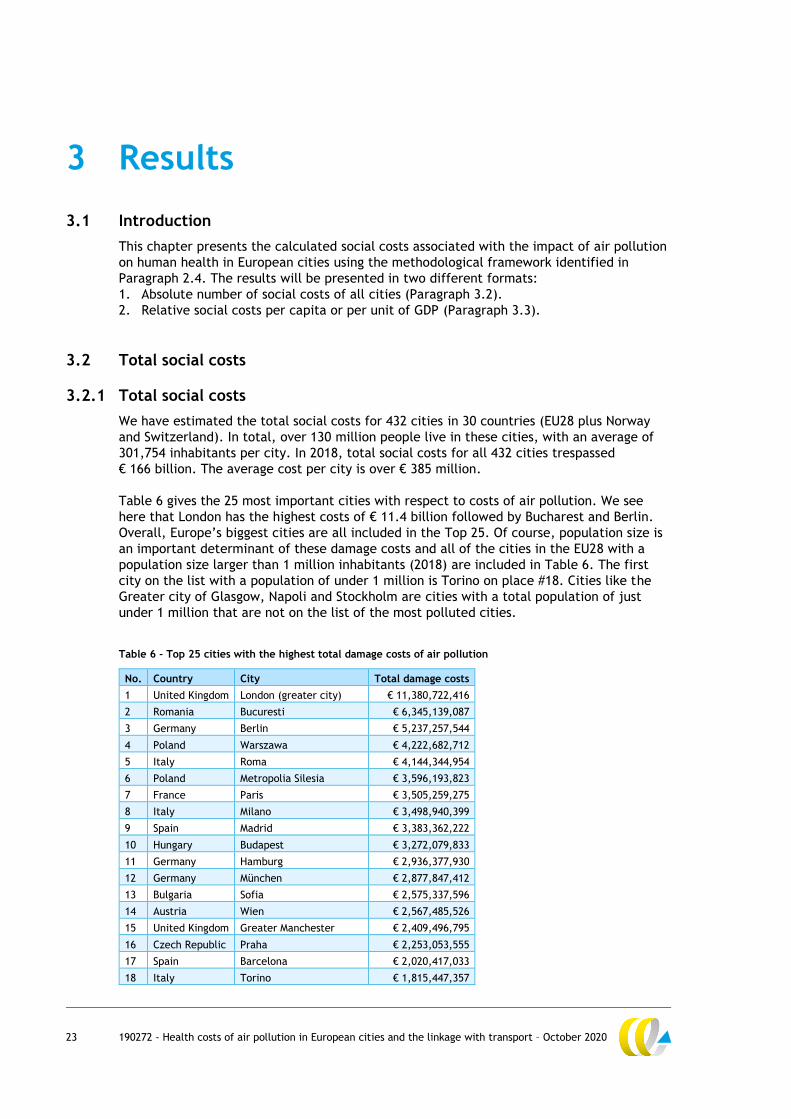
Table 6 gives the 25 most important cities with respect to costs of air pollution. We see
here that London has the highest costs of € 11.4 billion followed by Bucharest and Berlin.
Overall, Europe’s biggest cities are all included in the Top 25. Of course, population size is
an important determinant of these damage costs and all of the cities in the EU28 with a
population size larger than 1 million inhabitants (2018) are included in Table 6. The first
city on the list with a population of under 1 million is Torino on place #18. Cities like the
Greater city of Glasgow, Napoli and Stockholm are cities with a total population of just
under 1 million that are not on the list of the most polluted cities.
Table 6 - Top 25 cities with the highest total damage costs of air pollution
No. Country City Total damage costs
1 United Kingdom London (greater city) € 11,380,722,416
2 Romania Bucuresti € 6,345,139,087
3 Germany Berlin € 5,237,257,544
4 Poland Warszawa € 4,222,682,712
5 Italy Roma € 4,144,344,954
6 Poland Metropolia Silesia € 3,596,193,823
7 France Paris € 3,505,259,275
8 Italy Milano € 3,498,940,399
9 Spain Madrid € 3,383,362,222
10 Hungary Budapest € 3,272,079,833
11 Germany Hamburg € 2,936,377,930
12 Germany München € 2,877,847,412
13 Bulgaria Sofia € 2,575,337,596
14 Austria Wien € 2,567,485,526
15 United Kingdom Greater Manchester € 2,409,496,795
16 Czech Republic Praha € 2,253,053,555
17 Spain Barcelona € 2,020,417,033
18 Italy Torino € 1,815,447,357
24 190272 - Health costs of air pollution in European cities and the linkage with transport – October 2020
No. Country City Total damage costs
19 United Kingdom West Midlands urban area € 1,806,623,126
20 Germany Köln € 1,786,891,554
21 Belgium Bruxelles / Brussel € 1,585,778,013
22 Poland Kraków € 1,490,117,352
23 Germany Frankfurt am Main € 1,344,636,105
24 Croatia Zagreb € 1,312,028,080
25 Poland Wroclaw € 1,239,522,247
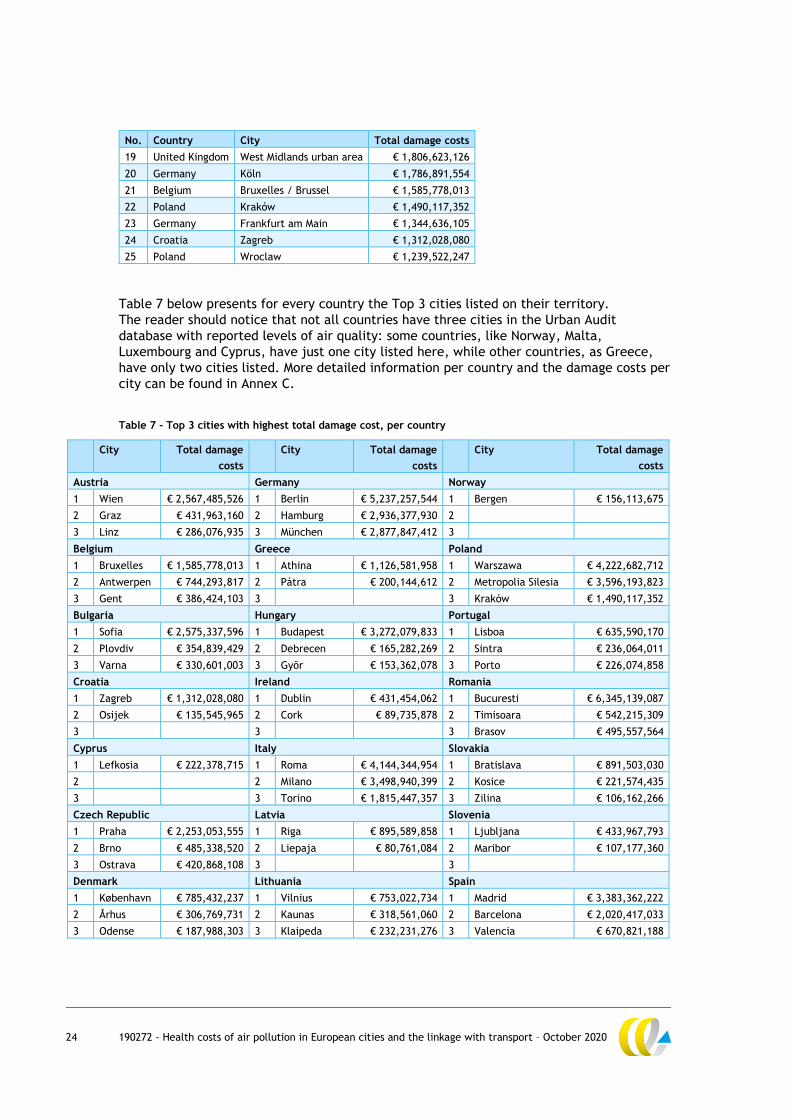
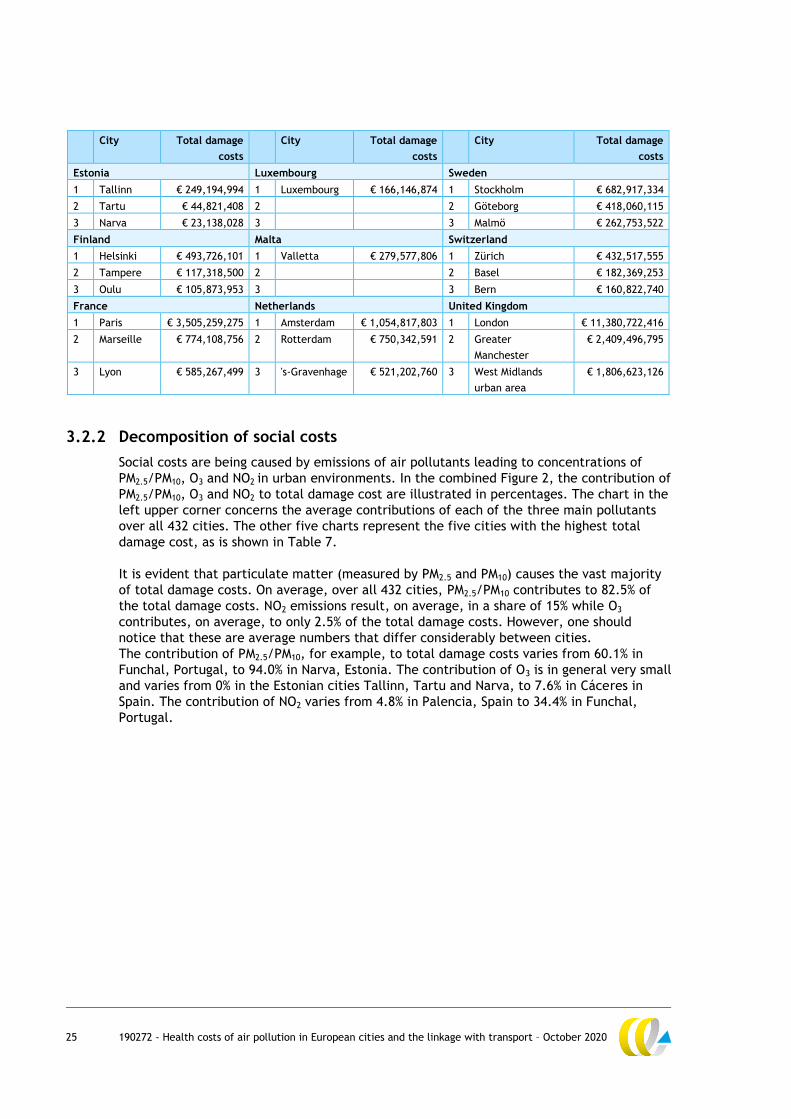
Table 7 below presents for every country the Top 3 cities listed on their territory.
The reader should notice that not all countries have three cities in the Urban Audit
database with reported levels of air quality: some countries, like Norway, Malta,
Luxembourg and Cyprus, have just one city listed here, while other countries, as Greece,
have only two cities listed. More detailed information per country and the damage costs per
city can be found in Annex C.
Table 7 - Top 3 cities with highest total damage cost, per country
City Total damage
costs
City Total damage
costs
City Total damage
costs
Austria Germany Norway
1 Wien € 2,567,485,526 1 Berlin € 5,237,257,544 1 Bergen € 156,113,675
2 Graz € 431,963,160 2 Hamburg € 2,936,377,930 2
3 Linz € 286,076,935 3 München € 2,877,847,412 3
Belgium Greece Poland
1 Bruxelles € 1,585,778,013 1 Athina € 1,126,581,958 1 Warszawa € 4,222,682,712
2 Antwerpen € 744,293,817 2 Pátra € 200,144,612 2 Metropolia Silesia € 3,596,193,823
3 Gent € 386,424,103 3
3 Kraków € 1,490,117,352
Bulgaria Hungary Portugal
1 Sofia € 2,575,337,596 1 Budapest € 3,272,079,833 1 Lisboa € 635,590,170
2 Plovdiv € 354,839,429 2 Debrecen € 165,282,269 2 Sintra € 236,064,011
3 Varna € 330,601,003 3 Gyõr € 153,362,078 3 Porto € 226,074,858
Croatia Ireland Romania
1 Zagreb € 1,312,028,080 1 Dublin € 431,454,062 1 Bucuresti € 6,345,139,087
2 Osijek € 135,545,965 2 Cork € 89,735,878 2 Timisoara € 542,215,309
3
3
3 Brasov € 495,557,564
Cyprus Italy Slovakia
1 Lefkosia € 222,378,715 1 Roma € 4,144,344,954 1 Bratislava € 891,503,030
2
2 Milano € 3,498,940,399 2 Kosice € 221,574,435
3
3 Torino € 1,815,447,357 3 Zilina € 106,162,266
Czech Republic Latvia Slovenia
1 Praha € 2,253,053,555 1 Riga € 895,589,858 1 Ljubljana € 433,967,793
2 Brno € 485,338,520 2 Liepaja € 80,761,084 2 Maribor € 107,177,360
3 Ostrava € 420,868,108 3
3
Denmark Lithuania Spain
1 København € 785,432,237 1 Vilnius € 753,022,734 1 Madrid € 3,383,362,222
2 Århus € 306,769,731 2 Kaunas € 318,561,060 2 Barcelona € 2,020,417,033
3 Odense € 187,988,303 3 Klaipeda € 232,231,276 3 Valencia € 670,821,188
25 190272 - Health costs of air pollution in European cities and the linkage with transport – October 2020
City Total damage
costs
City Total damage
costs
City Total damage
costs
Estonia Luxembourg Sweden
1 Tallinn € 249,194,994 1 Luxembourg € 166,146,874 1 Stockholm € 682,917,334
2 Tartu € 44,821,408 2
2 Göteborg € 418,060,115
3 Narva € 23,138,028 3
3 Malmö € 262,753,522
Finland Malta Switzerland
1 Helsinki € 493,726,101 1 Valletta € 279,577,806 1 Zürich € 432,517,555
2 Tampere € 117,318,500 2
2 Basel € 182,369,253
3 Oulu € 105,873,953 3
3 Bern € 160,822,740
France Netherlands United Kingdom
1 Paris € 3,505,259,275 1 Amsterdam € 1,054,817,803 1 London € 11,380,722,416
2 Marseille € 774,108,756 2 Rotterdam € 750,342,591 2 Greater
Manchester
€ 2,409,496,795
3 Lyon € 585,267,499 3 's-Gravenhage € 521,202,760 3 West Midlands
urban area
€ 1,806,623,126
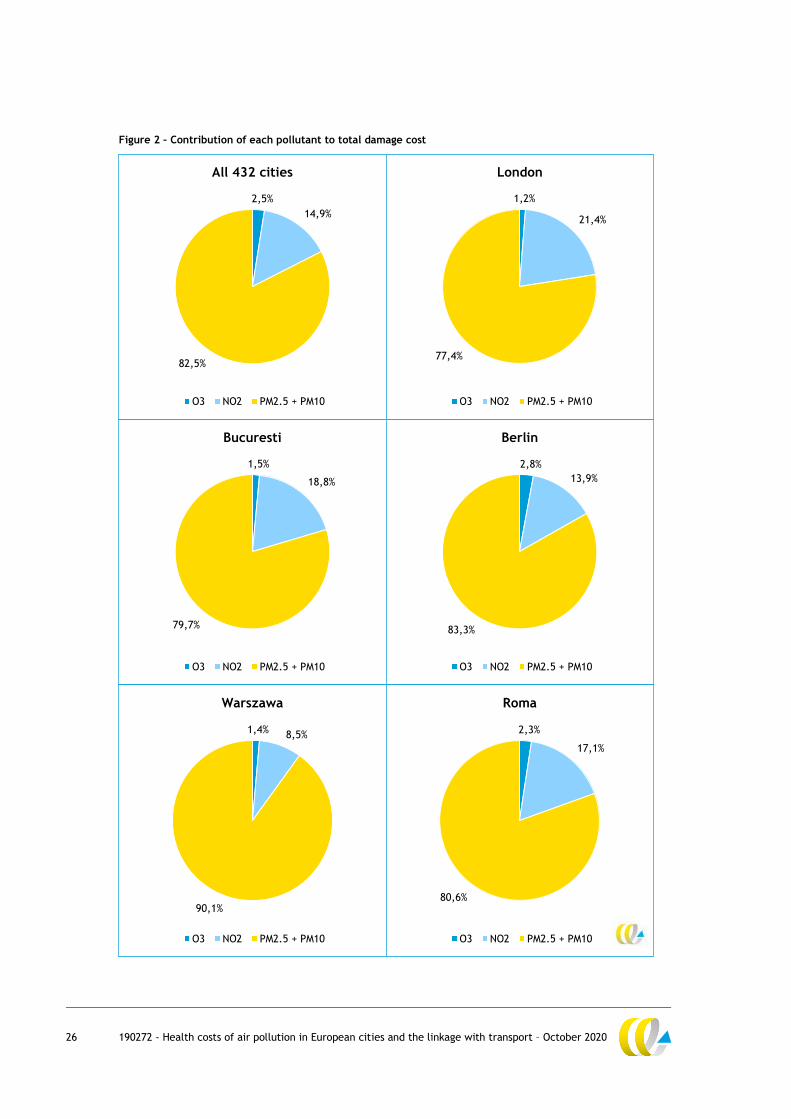
3.2.2 Decomposition of social costs
Social costs are being caused by emissions of air pollutants leading to concentrations of
PM2.5/PM10, O3 and NO2 in urban environments. In the combined Figure 2, the contribution of
PM2.5/PM10, O3 and NO2 to total damage cost are illustrated in percentages. The chart in the
left upper corner concerns the average contributions of each of the three main pollutants
over all 432 cities. The other five charts represent the five cities with the highest total
damage cost, as is shown in Table 7.
It is evident that particulate matter (measured by PM2.5 and PM10) causes the vast majority
of total damage costs. On average, over all 432 cities, PM2.5/PM10 contributes to 82.5% of
the total damage costs. NO2 emissions result, on average, in a share of 15% while O3
contributes, on average, to only 2.5% of the total damage costs. However, one should
notice that these are average numbers that differ considerably between cities.
The contribution of PM2.5/PM10, for example, to total damage costs varies from 60.1% in
Funchal, Portugal, to 94.0% in Narva, Estonia. The contribution of O3 is in general very small
and varies from 0% in the Estonian cities Tallinn, Tartu and Narva, to 7.6% in Cáceres in
Spain. The contribution of NO2 varies from 4.8% in Palencia, Spain to 34.4% in Funchal,
Portugal.
26 190272 - Health costs of air pollution in European cities and the linkage with transport – October 2020
Figure 2 – Contribution of each pollutant to total damage cost
2,5%
14,9%
82,5%
All 432 cities
O3 NO2 PM2.5 + PM10
1,2%
21,4%
77,4%
London
O3 NO2 PM2.5 + PM10
1,5%
18,8%
79,7%
Bucuresti
O3 NO2 PM2.5 + PM10
2,8%
13,9%
83,3%
Berlin
O3 NO2 PM2.5 + PM10
1,4%8,5%
90,1%
Warszawa
O3 NO2 PM2.5 + PM10
2,3%
17,1%
80,6%
Roma
O3 NO2 PM2.5 + PM10
27 190272 - Health costs of air pollution in European cities and the linkage with transport – October 2020
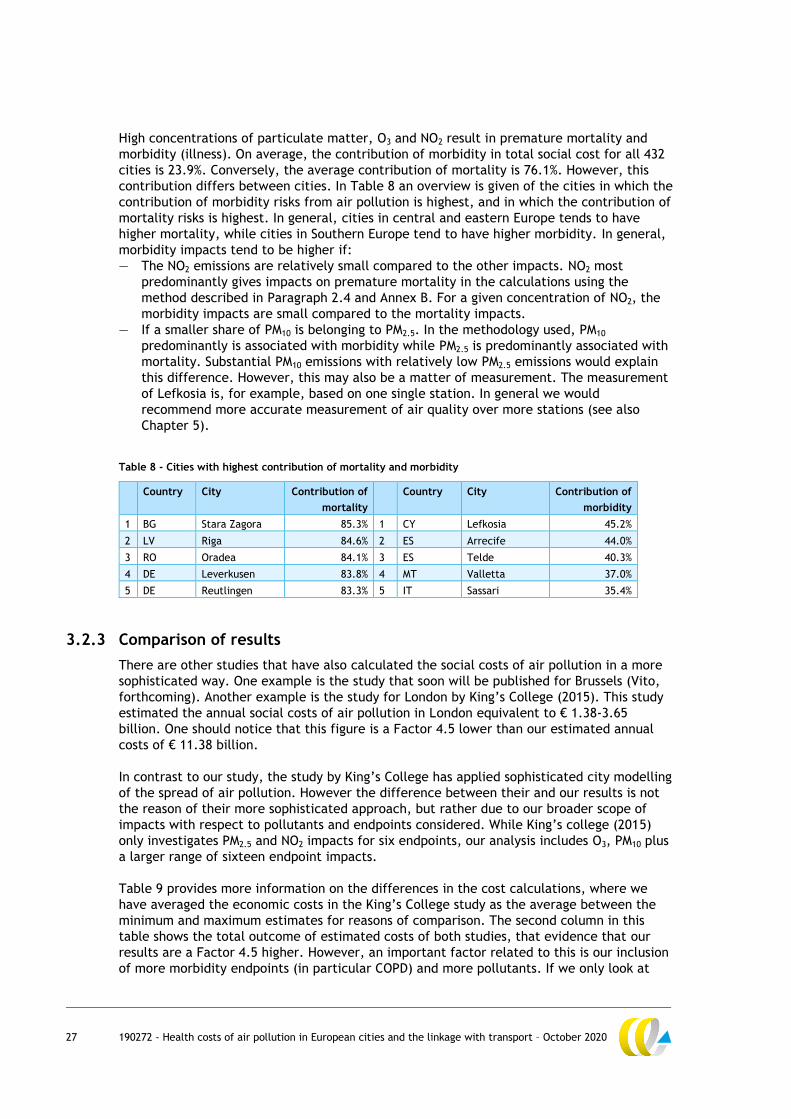
High concentrations of particulate matter, O3 and NO2 result in premature mortality and
morbidity (illness). On average, the contribution of morbidity in total social cost for all 432
cities is 23.9%. Conversely, the average contribution of mortality is 76.1%. However, this
contribution differs between cities. In Table 8 an overview is given of the cities in which the
contribution of morbidity risks from air pollution is highest, and in which the contribution of
mortality risks is highest. In general, cities in central and eastern Europe tends to have
higher mortality, while cities in Southern Europe tend to have higher morbidity. In general,
morbidity impacts tend to be higher if:
— The NO2 emissions are relatively small compared to the other impacts. NO2 most
predominantly gives impacts on premature mortality in the calculations using the
method described in Paragraph 2.4 and Annex B. For a given concentration of NO2, the
morbidity impacts are small compared to the mortality impacts.
— If a smaller share of PM10 is belonging to PM2.5. In the methodology used, PM10
predominantly is associated with morbidity while PM2.5 is predominantly associated with
mortality. Substantial PM10 emissions with relatively low PM2.5 emissions would explain
this difference. However, this may also be a matter of measurement. The measurement
of Lefkosia is, for example, based on one single station. In general we would
recommend more accurate measurement of air quality over more stations (see also
Chapter 5).
Table 8 - Cities with highest contribution of mortality and morbidity
Country City Contribution of
mortality
Country City Contribution of
morbidity
1 BG Stara Zagora 85.3% 1 CY Lefkosia 45.2%
2 LV Riga 84.6% 2 ES Arrecife 44.0%
3 RO Oradea 84.1% 3 ES Telde 40.3%
4 DE Leverkusen 83.8% 4 MT Valletta 37.0%
5 DE Reutlingen 83.3% 5 IT Sassari 35.4%
3.2.3 Comparison of results
There are other studies that have also calculated the social costs of air pollution in a more
sophisticated way. One example is the study that soon will be published for Brussels (Vito,
forthcoming). Another example is the study for London by King’s College (2015). This study
estimated the annual social costs of air pollution in London equivalent to € 1.38-3.65
billion. One should notice that this figure is a Factor 4.5 lower than our estimated annual
costs of € 11.38 billion.
In contrast to our study, the study by King’s College has applied sophisticated city modelling
of the spread of air pollution. However the difference between their and our results is not
the reason of their more sophisticated approach, but rather due to our broader scope of
impacts with respect to pollutants and endpoints considered. While King’s college (2015)
only investigates PM2.5 and NO2 impacts for six endpoints, our analysis includes O3, PM10 plus
a larger range of sixteen endpoint impacts.
Table 9 provides more information on the differences in the cost calculations, where we
have averaged the economic costs in the King’s College study as the average between the
minimum and maximum estimates for reasons of comparison. The second column in this
table shows the total outcome of estimated costs of both studies, that evidence that our
results are a Factor 4.5 higher. However, an important factor related to this is our inclusion
of more morbidity endpoints (in particular COPD) and more pollutants. If we only look at
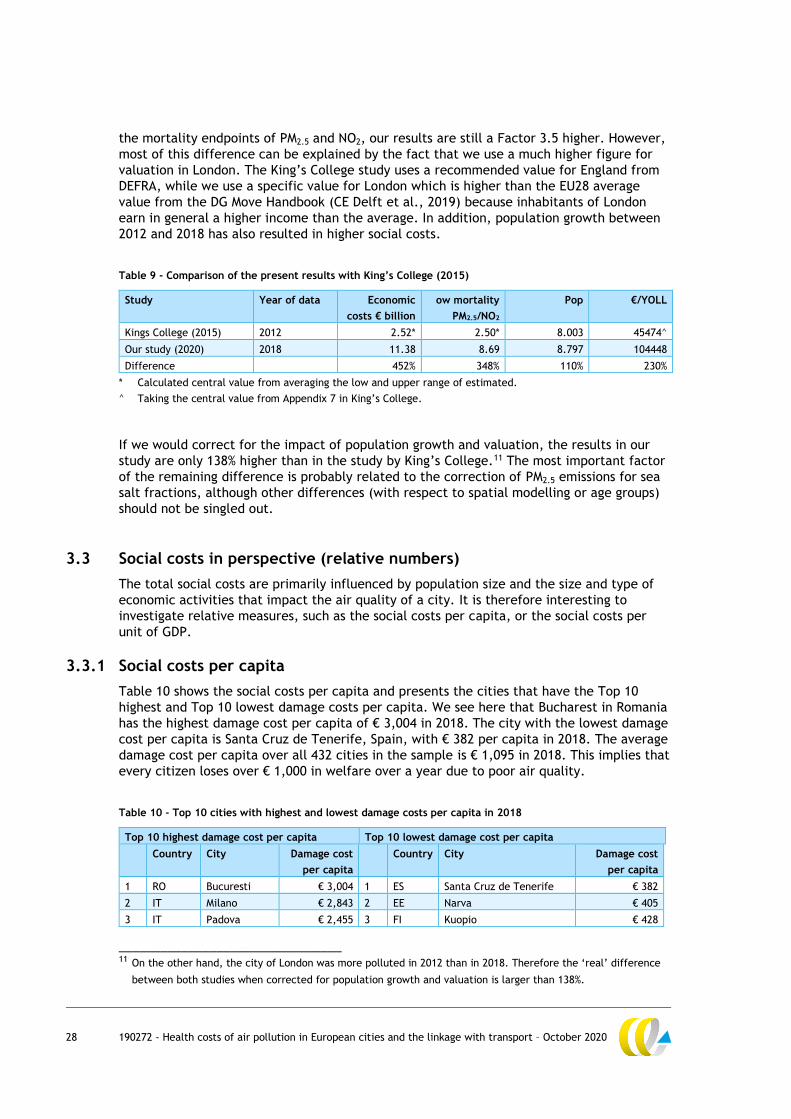
28 190272 - Health costs of air pollution in European cities and the linkage with transport – October 2020
the mortality endpoints of PM2.5 and NO2, our results are still a Factor 3.5 higher. However,
most of this difference can be explained by the fact that we use a much higher figure for
valuation in London. The King’s College study uses a recommended value for England from
DEFRA, while we use a specific value for London which is higher than the EU28 average
value from the DG Move Handbook (CE Delft et al., 2019) because inhabitants of London
earn in general a higher income than the average. In addition, population growth between
2012 and 2018 has also resulted in higher social costs.
Table 9 - Comparison of the present results with King’s College (2015)
Study Year of data Economic
costs € billion
ow mortality
PM2.5/NO2
Pop €/YOLL
Kings College (2015) 2012 2.52* 2.50* 8.003 45474^
Our study (2020) 2018 11.38 8.69 8.797 104448
Difference 452% 348% 110% 230%
* Calculated central value from averaging the low and upper range of estimated.
^ Taking the central value from Appendix 7 in King’s College.
If we would correct for the impact of population growth and valuation, the results in our
study are only 138% higher than in the study by King’s College.11 The most important factor
of the remaining difference is probably related to the correction of PM2.5 emissions for sea
salt fractions, although other differences (with respect to spatial modelling or age groups)
should not be singled out.
3.3 Social costs in perspective (relative numbers)
The total social costs are primarily influenced by population size and the size and type of
economic activities that impact the air quality of a city. It is therefore interesting to
investigate relative measures, such as the social costs per capita, or the social costs per
unit of GDP.
3.3.1 Social costs per capita
Table 10 shows the social costs per capita and presents the cities that have the Top 10
highest and Top 10 lowest damage costs per capita. We see here that Bucharest in Romania
has the highest damage cost per capita of € 3,004 in 2018. The city with the lowest damage
cost per capita is Santa Cruz de Tenerife, Spain, with € 382 per capita in 2018. The average
damage cost per capita over all 432 cities in the sample is € 1,095 in 2018. This implies that
every citizen loses over € 1,000 in welfare over a year due to poor air quality.
Table 10 - Top 10 cities with highest and lowest damage costs per capita in 2018
Top 10 highest damage cost per capita Top 10 lowest damage cost per capita
Country City Damage cost
per capita
Country City Damage cost
per capita
1 RO Bucuresti € 3,004 1 ES Santa Cruz de Tenerife € 382
2 IT Milano € 2,843 2 EE Narva € 405
3 IT Padova € 2,455 3 FI Kuopio € 428
________________________________ 11 On the other hand, the city of London was more polluted in 2012 than in 2018. Therefore the ‘real’ difference
between both studies when corrected for population growth and valuation is larger than 138%.
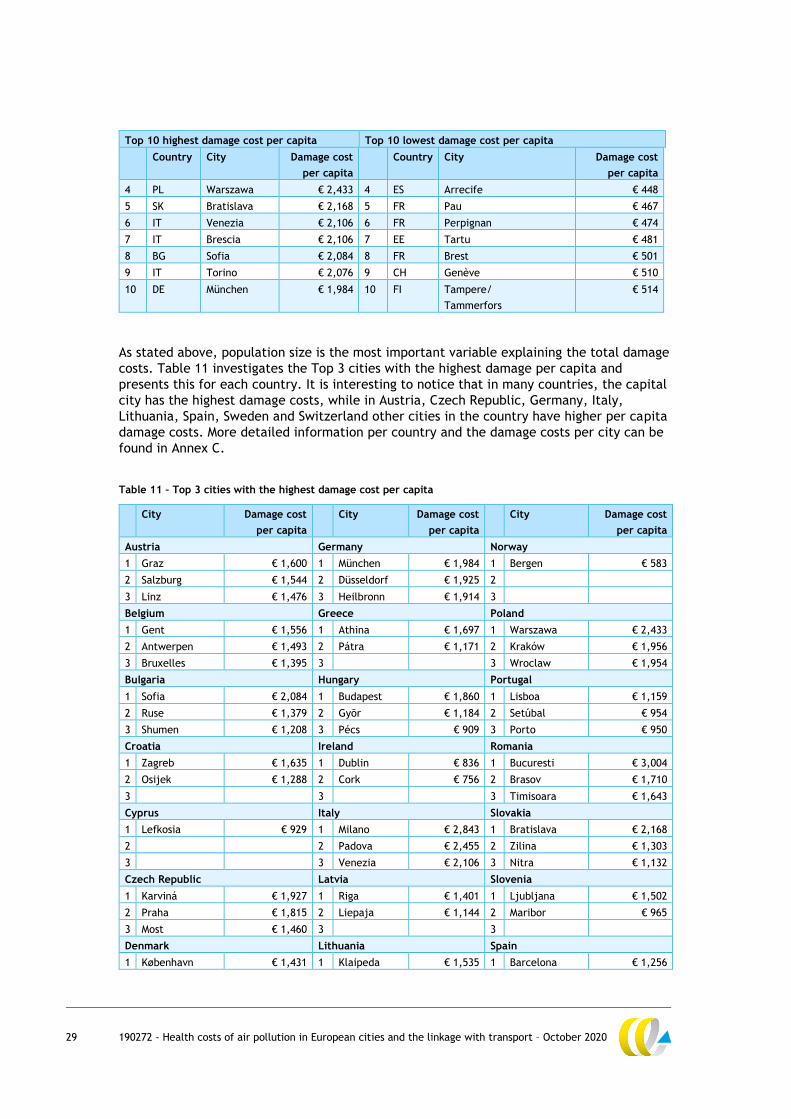
29 190272 - Health costs of air pollution in European cities and the linkage with transport – October 2020
Top 10 highest damage cost per capita Top 10 lowest damage cost per capita
Country City Damage cost
per capita
Country City Damage cost
per capita
4 PL Warszawa € 2,433 4 ES Arrecife € 448
5 SK Bratislava € 2,168 5 FR Pau € 467
6 IT Venezia € 2,106 6 FR Perpignan € 474
7 IT Brescia € 2,106 7 EE Tartu € 481
8 BG Sofia € 2,084 8 FR Brest € 501
9 IT Torino € 2,076 9 CH Genève € 510
10 DE München € 1,984 10 FI Tampere/
Tammerfors
€ 514
As stated above, population size is the most important variable explaining the total damage
costs. Table 11 investigates the Top 3 cities with the highest damage per capita and
presents this for each country. It is interesting to notice that in many countries, the capital
city has the highest damage costs, while in Austria, Czech Republic, Germany, Italy,
Lithuania, Spain, Sweden and Switzerland other cities in the country have higher per capita
damage costs. More detailed information per country and the damage costs per city can be
found in Annex C.
Table 11 – Top 3 cities with the highest damage cost per capita
City Damage cost
per capita
City Damage cost
per capita
City Damage cost
per capita
Austria Germany Norway
1 Graz € 1,600 1 München € 1,984 1 Bergen € 583
2 Salzburg € 1,544 2 Düsseldorf € 1,925 2
3 Linz € 1,476 3 Heilbronn € 1,914 3
Belgium Greece Poland
1 Gent € 1,556 1 Athina € 1,697 1 Warszawa € 2,433
2 Antwerpen € 1,493 2 Pátra € 1,171 2 Kraków € 1,956
3 Bruxelles € 1,395 3
3 Wroclaw € 1,954
Bulgaria Hungary Portugal
1 Sofia € 2,084 1 Budapest € 1,860 1 Lisboa € 1,159
2 Ruse € 1,379 2 Gyõr € 1,184 2 Setúbal € 954
3 Shumen € 1,208 3 Pécs € 909 3 Porto € 950
Croatia Ireland Romania
1 Zagreb € 1,635 1 Dublin € 836 1 Bucuresti € 3,004
2 Osijek € 1,288 2 Cork € 756 2 Brasov € 1,710
3
3
3 Timisoara € 1,643
Cyprus Italy Slovakia
1 Lefkosia € 929 1 Milano € 2,843 1 Bratislava € 2,168
2
2 Padova € 2,455 2 Zilina € 1,303
3
3 Venezia € 2,106 3 Nitra € 1,132
Czech Republic Latvia Slovenia
1 Karviná € 1,927 1 Riga € 1,401 1 Ljubljana € 1,502
2 Praha € 1,815 2 Liepaja € 1,144 2 Maribor € 965
3 Most € 1,460 3
3
Denmark Lithuania Spain
1 København € 1,431 1 Klaipeda € 1,535 1 Barcelona € 1,256
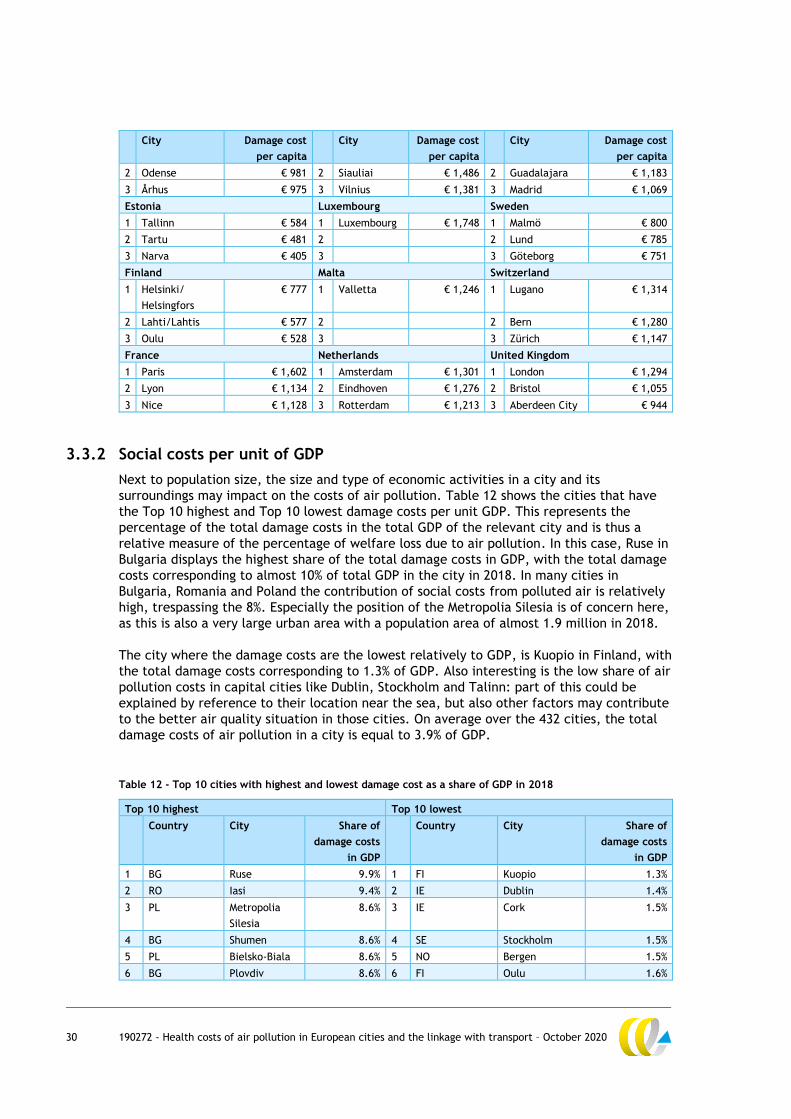
30 190272 - Health costs of air pollution in European cities and the linkage with transport – October 2020
City Damage cost
per capita
City Damage cost
per capita
City Damage cost
per capita
2 Odense € 981 2 Siauliai € 1,486 2 Guadalajara € 1,183
3 Århus € 975 3 Vilnius € 1,381 3 Madrid € 1,069
Estonia Luxembourg Sweden
1 Tallinn € 584 1 Luxembourg € 1,748 1 Malmö € 800
2 Tartu € 481 2
2 Lund € 785
3 Narva € 405 3
3 Göteborg € 751
Finland Malta Switzerland
1 Helsinki/
Helsingfors
€ 777 1 Valletta € 1,246 1 Lugano € 1,314
2 Lahti/Lahtis € 577 2
2 Bern € 1,280
3 Oulu € 528 3
3 Zürich € 1,147
France Netherlands United Kingdom
1 Paris € 1,602 1 Amsterdam € 1,301 1 London € 1,294
2 Lyon € 1,134 2 Eindhoven € 1,276 2 Bristol € 1,055
3 Nice € 1,128 3 Rotterdam € 1,213 3 Aberdeen City € 944
3.3.2 Social costs per unit of GDP
Next to population size, the size and type of economic activities in a city and its
surroundings may impact on the costs of air pollution. Table 12 shows the cities that have
the Top 10 highest and Top 10 lowest damage costs per unit GDP. This represents the
percentage of the total damage costs in the total GDP of the relevant city and is thus a
relative measure of the percentage of welfare loss due to air pollution. In this case, Ruse in
Bulgaria displays the highest share of the total damage costs in GDP, with the total damage
costs corresponding to almost 10% of total GDP in the city in 2018. In many cities in
Bulgaria, Romania and Poland the contribution of social costs from polluted air is relatively
high, trespassing the 8%. Especially the position of the Metropolia Silesia is of concern here,
as this is also a very large urban area with a population area of almost 1.9 million in 2018.
The city where the damage costs are the lowest relatively to GDP, is Kuopio in Finland, with
the total damage costs corresponding to 1.3% of GDP. Also interesting is the low share of air
pollution costs in capital cities like Dublin, Stockholm and Talinn: part of this could be
explained by reference to their location near the sea, but also other factors may contribute
to the better air quality situation in those cities. On average over the 432 cities, the total
damage costs of air pollution in a city is equal to 3.9% of GDP.
Table 12 - Top 10 cities with highest and lowest damage cost as a share of GDP in 2018
Top 10 highest Top 10 lowest
Country City Share of
damage costs
in GDP
Country City Share of
damage costs
in GDP
1 BG Ruse 9.9% 1 FI Kuopio 1.3%
2 RO Iasi 9.4% 2 IE Dublin 1.4%
3 PL Metropolia
Silesia
8.6% 3 IE Cork 1.5%
4 BG Shumen 8.6% 4 SE Stockholm 1.5%
5 PL Bielsko-Biala 8.6% 5 NO Bergen 1.5%
6 BG Plovdiv 8.6% 6 FI Oulu 1.6%
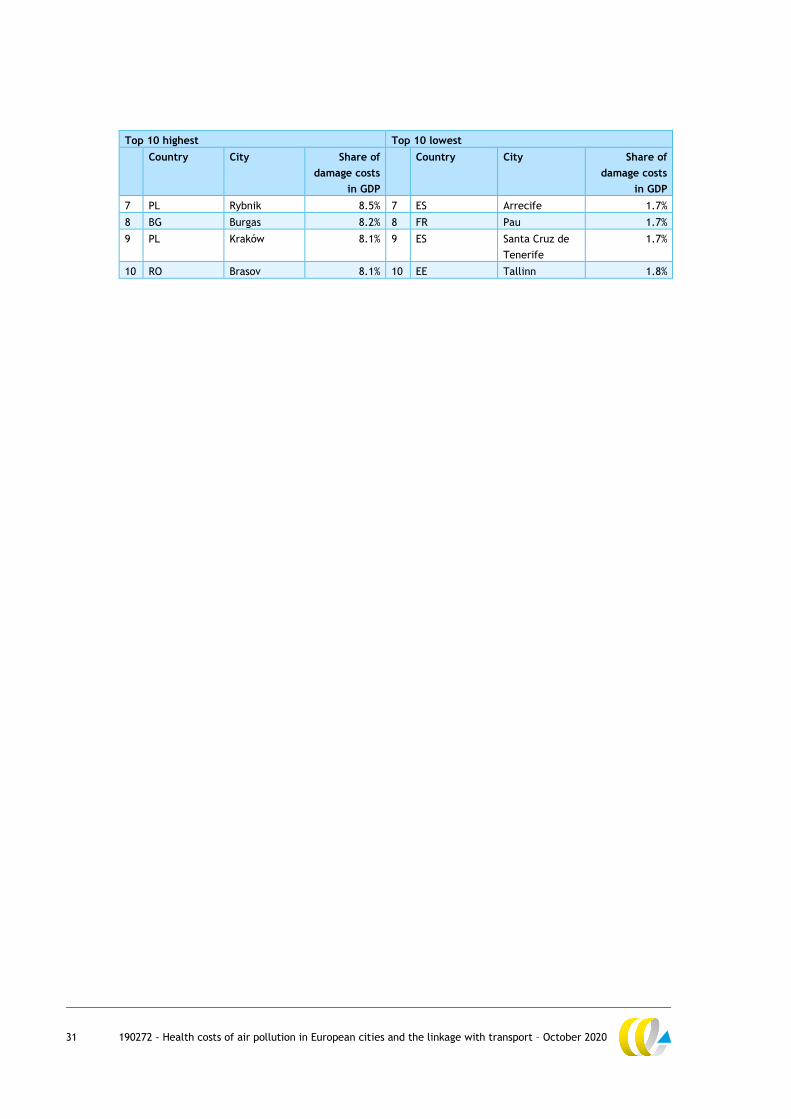
31 190272 - Health costs of air pollution in European cities and the linkage with transport – October 2020
Top 10 highest Top 10 lowest
Country City Share of
damage costs
in GDP
Country City Share of
damage costs
in GDP
7 PL Rybnik 8.5% 7 ES Arrecife 1.7%
8 BG Burgas 8.2% 8 FR Pau 1.7%
9 PL Kraków 8.1% 9 ES Santa Cruz de
Tenerife
1.7%
10 RO Brasov 8.1% 10 EE Tallinn 1.8%

32 190272 - Health costs of air pollution in European cities and the linkage with transport – October 2020
4 Estimating the impact of
transport on social costs
4.1 Introduction
Air quality in cities is dependent on the pollution stemming from economic activities, both
in the city, as in the surrounding areas. The amount of emissions in a certain area is
therefore an important variable to explain urban air quality. The relation from emissions to
concentrations, however, is not straightforward. The increase in concentrations of a given
pollutant is, among others, dependent on the type of pollutant, the height of release of the
pollutant, atmospheric conditions and geomorphological conditions.
Source contributions to urban PM2.5 levels in the EU Member States have for example been
modelled in the GAINS modelling suite (Kiesewetter and Amann, 2014). These reports show
a precise estimation of the contribution to PM2.5 air pollution at the city level. In this
chapter we apply a different method: we try to estimate the impact of the type and
organisation of transport in a city on the air quality in a city through econometric analysis.
First in Paragraph 4.2 we describe the methods that have been employed in this research.
Then in Paragraph 4.3 we estimate the impact of transport related variables on the air
quality in a city.
4.2 Description of the method
4.2.1 General description and data
To estimate the impact of city transport on air pollution, we have conducted an ordinary
least squares (OLS) linear regression where the concentration of pollution is regressed on
variables describing the situation with respect to transport in these cities. We estimated
the model for PM10 concentrations, PM2.5 concentrations and NO2 concentrations as
dependent variables. O3 concentrations were omitted from the analysis as these were
shown to provide only a small contribution to total social costs in Chapter 3.
The transport variables used in this exercise originate from the Urban Audit Statistics from
Eurostat. This dataset covers over 1,000 cities in Europe and monitors a wide range of
indicators, among which various indicators about transport within cities. There are sixteen
variables available in the Urban Audit database on transport indicators. However, many of
these were only included for a limited number of cities. In the end we decided to include
the following data on transport indicators in our analysis for a reasonable number of cities:
— Share of journeys to work by car (%). This indicator tells us which percentage of all
journeys to work within a city are done by car. As use of a car is more polluting than use
of bicycle, public transport or walking, we would expect that the higher this share of
journeys to work by car, the higher the concentration of pollutants in the city becomes.
— Number of cars registered per 1,000 population. This indicator represents relative car
possession; for every 1,000 inhabitants in a city, this variable indicates how many of
them own a car. As a higher number of cars per 1,000 people may imply a higher
amount of car use in the city, we would expect pollution to go up as this indicator rises.
33 190272 - Health costs of air pollution in European cities and the linkage with transport – October 2020
— Average time of journey to work (minutes). This indicator tells us how long it takes on
average to arrive from home to work within a city, in minutes. The higher this indicator,
the longer people are travelling within a city to arrive at their place of employment.
As a longer travelling time would provide longer times to pollute, we expect pollution to
rise as this variable increases.
It should be noted that these variables are not present for each city in the Urban Audit and
the years for which data are available differ with considerable gaps in between years. After
inspection of the data it was concluded that the data quality was too poor to estimate
development over time. So we rather stick to cross-section analysis to investigate if the
differences in reported air quality between cities can be explained with reference to the
underlying transport variables.
For data collection, the year 2013 showed the highest frequency in data availability.
However, to obtain a sufficient sample, we have complemented the 2013 sample with cities
that had data in different years. These alternative years of data range from 2010 to 2016,
with priority given to 2011, 2014 or 2012 if one of these were available. This method has
been used due to the expected lack of variation over time in the variables included in the
regression. As a result, a sample of over 230 cities is available for each estimated model.
The total dataset consists of a cross-sectional sample, and thus includes multiple cities with
data for each variable for one point in time. The sample consists of 259 cities for the
estimation with PM10 as a dependent variable, 257 cities for the estimation with PM2.5 as a
dependent variable, and 239 cities for the estimation with NO2 as a dependent variable.
Data for PM10, PM2.5 and NO2 is taken from the European Environment Agency and Urban
Audit, for the year 201312. Each pollutant is measured as the annual mean concentration in
μg per m3.
4.2.2 Model formulation
In order to isolate the effect of the transport variables, other factors that impact air
pollution in a city must be included in the model. Firstly, population density is included as
an independent variable. The more people live on a square kilometre, the more average
pollution per m3 these people would probably cause. Secondly, GDP per capita (purchasing
power parity) is included. It would be expected that a higher level of GDP per capita is
associated with a higher level of economic activity, which in turn causes higher levels of
pollution. On the other hand, higher income cities may be able to undertake more effort to
improve air quality, for example, by installing environmental zones or subsidizing public
transport. Concern for air quality may be growing when incomes grows. This would result in
a negative relationship between air pollution and income. 13
Although in many Eastern European cities the contribution to air pollution primarily comes
from traffic, the suburbs or cities surrounding the cities are sometimes using coal or
biomass fired stoves for household heating, especially in Central and Eastern Europe.
Therefore, the link with traffic can be relatively weak or absent. For that reason, we have
added a variable in the regression that covers this source of pollution in a country: the
share of solid fossil fuels in total energy consumption by households. This includes the use
of solid fossil fuels by households, as a percentage of total energy consumption by
________________________________ 12 PM10 and NO2 are taken from Urban Audit, consistent with the transportation variables. PM2.5 is not available in
the Urban Audit, therefore this is taken from the EEA. 13 Both population density and GDP per capita are taken from Eurostat. For cities that did not have information
about GDP per capita, we inserted the national average GDP per capita (see also Annex A).

34 190272 - Health costs of air pollution in European cities and the linkage with transport – October 2020
households. This variable comes from Eurostat and is at the country level since it is not
available at the city level. Therefore we assigned the national average to each city in the
sample. We also tested models in which we included consumption of primary solid biofuels
by households in the regressions as well, but this did not result in a significant improvement
of the estimation. Therefore we present here the model with consumption of solid fossil
fuels by households.
All data has been transformed into logarithmic values by taking the natural log of each
variable. This implies that all coefficients can be regarded as elasticities showing the
impact of a x% increase in the variable on ambient air quality.
4.3 Results
4.3.1 Results for PM10 and PM2.5
The results for the estimations of the model with PM10 and PM2.5 concentrations as
dependent variable, are presented in Table 13. Considering the outcome for the model with
PM10 concentrations as a dependent variable, the overall explanatory power of the model is
0.476, as seen by the adjusted R squared. This means that approximately 47.6% of the
variation in PM10 concentrations is explained by the variation of the independent variables
included in the model. All coefficients for the independent variables are statistically
significant at the 1% significance level, except share of journeys by car, which does not
show a significant coefficient. The explanatory power of the model where PM2.5 is the
dependent variable is 32.3%, given by the adjusted R squared of 0.322. In this model, all
coefficients are statistically significant at, at least, the 5% significance level, except for
GDP per capita and share of journeys by car.
Table 13 - Regression results for PM10 and PM2.5
Dependent variable: PM10 (log) PM2.5 (log)
GDP PPP per capita (log) -0.261***
[0.060]
-0.044
[0.071]
Population density (log) 0.067***
[0.012]
0.106***
[0.015]
Share of solid fossil fuels in total energy consumption by households (log) 0.253***
[0.044]
0.261***
[0.052]
Share of journeys by car - % (log) 0.091
[0.068]
0.066
[0.081]
Average time of journey to work – minutes (log) 0.290***
[0.075]
0.185**
[0.092]
Number of registered cars per 1,000 population (log) 0.490***
[0.063]
0.487***
[0.076]
Constant 0.941
[0.854]
-1.529
[1.025]
No. of observations 259 257
Adjusted R squared 0.476 0.322
Note: the table displays the coefficient with standard error in brackets.
Significance levels: *p<0.10 **p<0.05 ***p<0.01.
35 190272 - Health costs of air pollution in European cities and the linkage with transport – October 2020
GDP PPP per capita shows a negative coefficient of -0.261 at the 1% statistical significance
level in the model with PM10 as independent variable. The implication is that when GDP PPP
per capita increases by 1%, PM10 concentration decrease, on average, by 0.26%, all else
equal. In general, one would expect that a higher GDP, implying more economic activities,
would result in a higher concentration of pollutants. That this is not the case could be
indicative of the fact that most of the cities in this sample would lay on the right side of the
Environmental Kuznets Curve that depicts that air quality may improve after certain income
levels have been reached (De Bruyn, 2000). In practice, this could be due to the fact that
the vehicle fleet in richer cities tend to be more clean or that these cities have better
public transport networks. For PM2.5, the coefficient for GDP PPP per capita is also negative,
but not significantly different from zero. Income there does not seem to influence the
concentration of PM2.5 in our sample.
Population density shows a positive coefficient of 0.067 at the 1% statistical significance
level for PM10. This implies that a 1% increase in population density corresponds to a small
(0.067%) increase in PM10 concentrations, all else equal. In the model for PM2.5, the
coefficient of 0.106 for population density is also positive and statistically significant at the
1% significance level. This implies that for every 1% increase in population density, PM2.5
concentrations rise, on average, by 0.1%. Both results support a-priori expectations, namely
that a higher number of people per square kilometre in a city corresponds to a higher
concentration of air pollution.
The share of solid fossil fuels in total energy consumption by households shows a positive
coefficient of 0.253 and 0.261 for PM10 and PM2.5 respectively, being both significant at the
1% level. The values of the coefficients imply that a 1% increase in the share of solid fossil
fuels in total energy consumption by households corresponds, on average, to a 0.25% and
0.26% increase in PM10 and PM2.5 concentrations respectively. Compared to other sources of
energy, solid fossil fuels are more polluting, and thus this result supports the theory that
the more solid fossil fuels are consumed, the worse air quality in cities will be. While we
have included and tested other variables here, such as the share of biomass use by
households, these proved to be not significant and impoverished the overall model
estimation, that’s why they were left out.
Turning to the transport variables in the model for PM10, average time of journey to work
shows a positive coefficient at the 1% statistical significance level. This implies that, on
average, when the average time of journey to work rises by 1%, the annual average
concentration rises by 0.29%, all else equal. Moreover, the number of registered cars per
1,000 population also shows a positive coefficient of 0.490 at the 1% statistical significance
level. This implies that PM10 concentrations increase, on average, by 0.49% for every 1%
increase in the number of registered cars per 1,000 population, all else equal.
The coefficient for share of journeys by car is positive, but is not statistically significant.
Therefore this variable cannot reliably be interpreted as having an impact on PM10
concentrations in cities. Although one would expect that this variable would have a positive
sign on overall air quality as well, the reason why this is not the case may be related to
difficulties in measuring this variable. While most of the variables can be obtained by
standard statistical sources (e.g. number of registered cars), variables like the share of
journeys by cars or the average length of commuting to the work have to be obtained
through questionnaires. If questionnaires differ between cities in set-up, variables may
show up not being significant in our regression analysis.
For the model with PM2.5, the behaviour of the transport variables shows a similar pattern,
although the impact of the chosen transport variables is slightly lower. Average time of
journey to work displays a positive coefficient of 0.185 at the 5% statistical significance
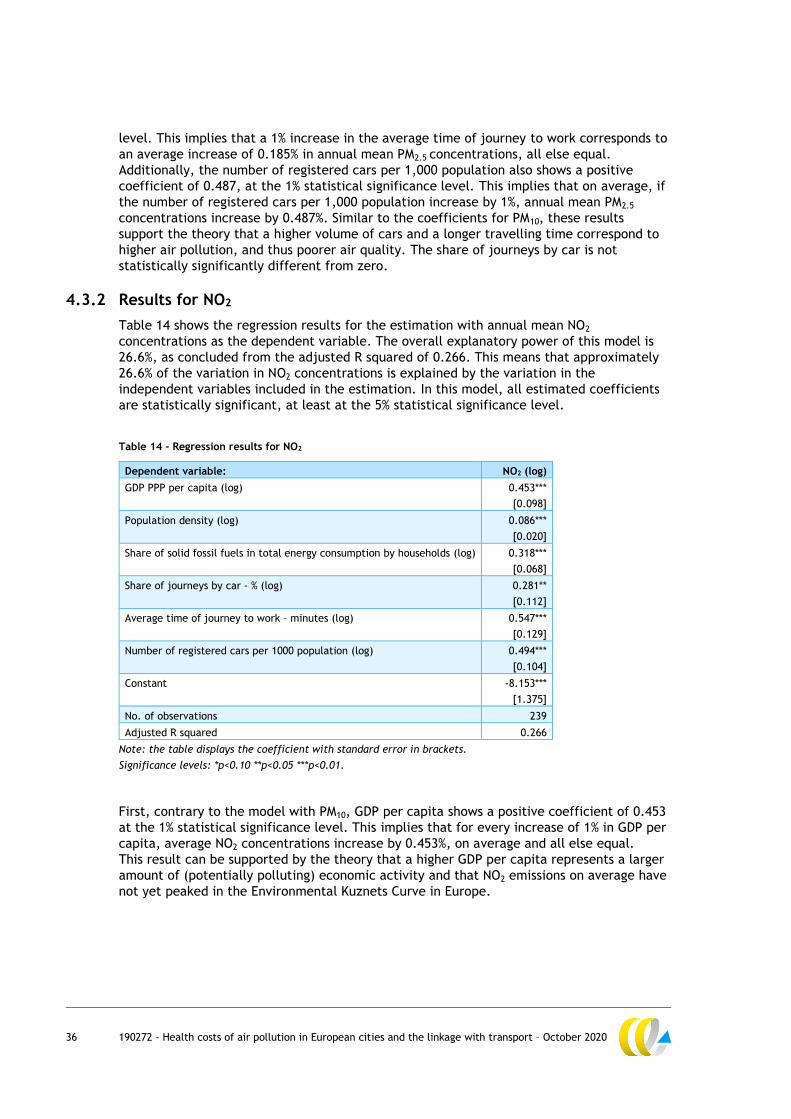
36 190272 - Health costs of air pollution in European cities and the linkage with transport – October 2020
level. This implies that a 1% increase in the average time of journey to work corresponds to
an average increase of 0.185% in annual mean PM2.5 concentrations, all else equal.
Additionally, the number of registered cars per 1,000 population also shows a positive
coefficient of 0.487, at the 1% statistical significance level. This implies that on average, if
the number of registered cars per 1,000 population increase by 1%, annual mean PM2.5
concentrations increase by 0.487%. Similar to the coefficients for PM10, these results
support the theory that a higher volume of cars and a longer travelling time correspond to
higher air pollution, and thus poorer air quality. The share of journeys by car is not
statistically significantly different from zero.
4.3.2 Results for NO2
Table 14 shows the regression results for the estimation with annual mean NO2
concentrations as the dependent variable. The overall explanatory power of this model is
26.6%, as concluded from the adjusted R squared of 0.266. This means that approximately
26.6% of the variation in NO2 concentrations is explained by the variation in the
independent variables included in the estimation. In this model, all estimated coefficients
are statistically significant, at least at the 5% statistical significance level.
Table 14 - Regression results for NO2
Dependent variable: NO2 (log)
GDP PPP per capita (log) 0.453***
[0.098]
Population density (log) 0.086***
[0.020]
Share of solid fossil fuels in total energy consumption by households (log) 0.318***
[0.068]
Share of journeys by car - % (log) 0.281**
[0.112]
Average time of journey to work – minutes (log) 0.547***
[0.129]
Number of registered cars per 1000 population (log) 0.494***
[0.104]
Constant -8.153***
[1.375]
No. of observations 239
Adjusted R squared 0.266
Note: the table displays the coefficient with standard error in brackets.
Significance levels: *p<0.10 **p<0.05 ***p<0.01.
First, contrary to the model with PM10, GDP per capita shows a positive coefficient of 0.453
at the 1% statistical significance level. This implies that for every increase of 1% in GDP per
capita, average NO2 concentrations increase by 0.453%, on average and all else equal.
This result can be supported by the theory that a higher GDP per capita represents a larger
amount of (potentially polluting) economic activity and that NO2 emissions on average have
not yet peaked in the Environmental Kuznets Curve in Europe.
37 190272 - Health costs of air pollution in European cities and the linkage with transport – October 2020
Population density shows a positive coefficient of 0.086 at the 1% statistical significance
level. This implies that a 10% increase in population density corresponds, on average, to a
0.86% increase in NO2 concentrations, all else equal. This result can again be supported by
the theory that a higher number of people per square kilometre inevitably together cause
more pollution.
Also in this model, the share of solid fossil fuels in energy consumption by households has a
positive coefficient of 0.318 at the 1% statistical significance level, implying an average
0.28% increase in NO2 concentrations for every 1% increase in relative solid fossil fuel
consumption by households, all else equal. This again supports the theory that the higher
the share of solid fossil fuel is in the fuel mix in household energy consumption, the more
polluting this energy consumption is, and the poorer the air quality in terms of NO2.
In this model, all three transportation variables are positive and statistically significant.
The coefficient of share of journeys by car is 0.281 at the 5% statistical significance level.
This implies an average 0.281% increase in NO2 concentrations for every 1% increase in share
of journeys by car, all else equal. Contrary to the models with PM10 and PM2.5, this result
supports the theory that a higher share of journeys by car corresponds to a higher level of
pollution, on average.
Average time of journey to work displays a positive coefficient of 0.547 at the 1% statistical
significance level. For every 1% increase in the average time of journey to work, this result
can be interpreted as an average corresponding increase in NO2 concentrations of 0.547%,
all else equal. This, similar to the models with PM10 and PM2.5 supports the theory that
longer journeys to work provide more opportunity to pollute, and therefore aggravates air
quality.
Lastly, the number of registered cars per 1,000 population shows a positive coefficient of
0.494 at the 1% statistical significance level. This implies that when the number of
registered cars per 1,000 population increases by 1%, NO2 concentrations increase, on
average, by 0.494%, all else equal. Again, this supports the theory that the more cars
people own, relatively, the more these cars pollute, and the worse the air quality.
38 190272 - Health costs of air pollution in European cities and the linkage with transport – October 2020
5 Conclusions
5.1 General findings
This study investigates the health-related social costs of air pollution in 432 European cities
in 30 countries (the EU27 plus the UK, Norway and Switzerland). Social costs are costs
affecting welfare and comprise both direct health care expenditures (e.g. for hospital
admissions) and indirect health impacts (e.g. diseases such as COPD, or reduced life
expectancy due to air pollution). These impacts affect welfare because people have a clear
preference for healthy life years in a good and clean environment. Those impacts have been
monetized in economics so that they can be added to actual expenditures to derive a
measure of ‘social costs’.
Environmental economists have performed numerous studies to quantify the impacts of air
pollution on health and monetize these as social costs. These studies were used to develop
the methodological framework adopted in the present study, which encompasses sixteen
health impacts attributable to air pollution by fine particulate matter, ozone and nitrogen
oxides (Table 2, Page 14). Using data on reported air quality in the Urban Audit statistics
and the EEA Air Quality network, the physical impacts on human health were quantified
using concentration-response functions based on the recommendations of the World Health
Organization (WHO). The physical impacts were subsequently monetized using a valuation
framework developed in the peer-reviewed Handbook of External Costs published by the
European Commission’s Directorate General for Mobility and Transport, DG MOVE. The
resulting social costs incurred in a specific city were then determined from the air pollution
levels reported there and the size, age structure and living standards of the population in
that particular city.
For all 432 cities in our sample (total population: 130 million inhabitants), the social costs
quantified were over € 166 billion in 2018. In absolute terms, London is the city with the
highest social costs. In 2018, the loss in welfare for its 8.8 million inhabitants totalled
€ 11.38 billion. London is followed by Bucharest, with an annual loss in welfare of
€ 6.35 billion, Berlin (€ 5.24 billion), Warsaw (€ 4.22 billion) and Rome (€4.11 billion).
City size is a key factor contributing to total social costs: all cities in Europe with a
population over 1 million feature in the Top 25 cities with the highest social costs due to air
pollution (see Table 6, Page 23).
In 2018, on average every inhabitant of a European city suffered a welfare loss of over
€ 1,250 a year owing to direct and indirect health losses associated with poor air quality.
This is equivalent to 3.9% of income earned in cities. It should be noted that there is a
substantial spread in these figures among cities: in the Romanian capital Bucharest total
welfare loss amounts to over € 3,000 per capita/year, while in Santa Cruz de Tenerife in
Spain it is under € 400/cap/yr. In many cities in Bulgaria, Romania and Poland the health-
related social costs are between 8-10% of income earned.
Premature mortality is the largest component in social costs. For the 432 cities
investigated, the average contribution of mortality to total social costs is 76.1%. The largest
share of this is related to pollution of PM2.5. Conversely, the average contribution of
morbidity (diseases) is 23.9%. The development of Chronic Obstructive Pulmonary Disease
(COPD) contribute to the largest morbidity related costs from air pollution.
39 190272 - Health costs of air pollution in European cities and the linkage with transport – October 2020
The figures reported here are cited without uncertainty ranges. In this kind of study,
uncertainty bounds are typically around 30-40%, implying that the figures reported here
could be a factor 1/3 lower or 1/3 higher.
City air pollution stems from many sources: transport activities, household heating and a
range of other activities including agriculture and industry. Without further analysis, the
relative share of each source cannot be assessed with any certainty. In this study we did
investigate the role of city transport in explaining these social costs using econometric
methods. Although there is a severe lack of data at the level of individual cities, we do find
evidence that transport policies impact the social costs of air pollution, using several proxy
indicators that are available for many cities, including commuting times and car ownership.
Our results show that a 1% increase in the average journey time to work increases the social
costs of PM10 emissions by 0.29% and those of NO2 emissions even by 0.54%. A 1% increase in
the number of cars in a city increases overall social costs by almost 0.5%. This confirms that
transport policies reducing commuting time and car ownerships can have important benefits
in reducing the social costs from air pollution.
5.2 Research Findings
Our study relied on data available in official databases. The identified social costs are based
on the reported level of air pollution in these databases, which may diverge from the actual
situation. Given that air quality is still relatively sparsely monitored across Europe, the
social costs reported are likely to be an underestimate in some cities. If air pollution levels
are in fact higher than the figures reported in official statistics, the social costs will
increase accordingly.
Comparison of our study’s findings regarding welfare losses with those from other research
shows that our results are sometimes higher than previously found. To a large extent this
can be explained by the more recent figures used here for valuing the adverse impacts of
air pollution. The present valuation was taken from the update of the peer-reviewed
Handbook of External Costs published by the European Commission’s Directorate General
for Mobility and Transport, DG MOVE.
5.3 Recommendations
This leads to the following recommendations:
— The findings in this research paper show that impacts of poor air quality on human
welfare are very substantial and larger than previously understood. Our findings provide
additional evidence that reducing air pollution in European cities should be among the
top priorities in any attempt to improve the welfare of city populations in Europe.
— The costs calculated in this study are likely to become higher if the costs because of the
COVID-19 pandemic would be properly included. Comorbidities feature prominently in
the mortality of COVID-19 patients and among the most important of these are those
associated with air pollution. Various research papers have evidenced that poor air
quality tends to increase mortality from COVID-19 cases. Therefore, social costs of poor
air quality may be higher than estimated in this research.
— Air quality is, to a large extent, influenced by transportation habits which in turn are
influenced by transport policies, both at the national and the city level. Hence
governments have an important role to play here. Car possession and journey times to
work tend to be positively correlated with higher levels of air pollution. The social costs
should be taken into account by transport policy decisions affecting urban mobility and
they can be assessed when calculating the transition of urban mobility from the internal
40 190272 - Health costs of air pollution in European cities and the linkage with transport – October 2020
combustion engine to zero- and low emission alternatives, including e-mobility. The
relationship between transport policies at the local level and air pollution should be
investigated in more detail in future research. Transport policies improving air quality
can have co-benefits for public health if they stimulate increased physical activity such
as walking or cycling.
— The present analysis is based on reported air quality. In general we also observe that
much could be improved with respect to the monitoring of air quality: some large
European cities have only a limited number of monitoring stations. Without a good
network of monitoring stations, air pollution may seriously be underestimated and social
costs determined in this study may be even modest. Therefore our final
recommendation is to improve the monitoring network so that a more accurate
relationship between human health and air pollution can be assessed.
41 190272 - Health costs of air pollution in European cities and the linkage with transport – October 2020
Literature
Badyda, A. J., Grellier, J. & Dąbrowiecki, P. 2017. Ambient PM2.5 Exposure and Mortality
Due to Lung Cancer and Cardiopulmonary Diseases in Polish Cities. In: Pokorski, M. (ed.)
Respiratory Treatment and Prevention. Cham: Springer International Publishing.
Bañeras, J., Ferreira-González, I., Marsal, J. R., Barrabés, J. A., Ribera, A., Lidón, R. M.,
Domingo, E., Martí, G. & García-Dorado, D. 2018. Short-term exposure to air pollutants
increases the risk of ST elevation myocardial infarction and of infarct-related ventricular
arrhythmias and mortality. International Journal of Cardiology, 250, 35-42.
Barbier, E. B., Czakowsky, M. & Hanley, N. 2015. Is the income elasticity of the willingnes
to pay for pollution control constant.
Bell, M. L., Davis, D. L. & Fletcher, T. 2004. A retrospective assessment of mortality from
the London smog episode of 1952: the role of influenza and pollution. Environmental health
perspectives, 112, 6-8.
Beták, J., Šúri, M., Cebecauer, T. & Skoczek, A. 2012. Solar Resource and Photovoltaic
Electricity Potential in EU-MENA Region. Bratislava: SolarGIS.
CE Delft 2018a. Health impacts and costs of diesel emissions in the EU. Delft: CE Delft.
CE Delft 2018b. Environmental Prices Handbook EU28 version : Methods and numbers for
valuation of environmental impacts. Delft: CE Delft.
CE Delft 2020. Further explanation of methods used for monetizing impacts from air
pollution Delft: CE Delft.
CE Delft, INFRAS, TRT & Ricardo 2019. Handbook on the external costs of transport - version
2018. Delft: CE Delft.
COMEAP 2015. Statement on the evidence for the effects of nitrogen dioxide on health.
Chilton: Committee on the Medical Effects of Air Pollutants (COMEAP).
COMEAP 2018. Associations of long-term average concentrations of nitrogen oxide with
mortality. Chilton: Committee on the Medical Effects of Air Pollutants (COMEAP).
De Bruyn, S. M. 2000. Economic growth and the environment : an empirical analysis,
Boston, Kluwer Academic Publishers.
De Jesus, A. L. & al., e. 2019. Ultrafine particles and PM2.5 in the air of cities around the
world: Are they representative of each other? Environmental International, 129, 118-135.
Donaire-Gonzalez, D., Huss, A., Hoek, G. & Vermeulen, R. 2019. Effects of ultrafine
particles on respiratory health in adults. Environmental Epidemiology, 3, 102.
EC 2011. Commission Staff Working Paper establishing guidelines for demonstration and
subtraction of exceedances attributable to natural sources under the Directive 2008/50/EC
on ambient air quality and cleaner air for Europe Brussels.
EEA 2010. Good practice guide on noise exposure and potential health effects. Copenhagen:
European Environment Agency (EEA).
EPA 2016. Integrated Science Assessment for Oxides of Nitrogen - Health Criteria. North
Carolina: Environmental Protection Agency (EPA).
42 190272 - Health costs of air pollution in European cities and the linkage with transport – October 2020
Fang, D., Wang, Q. g., Li, H., Yu, Y., Lu, Y. & Qian, X. 2016. Mortality effects assessment of
ambient PM2.5 pollution in the 74 leading cities of China. Science of the Total Environment,
569-570, 1545-1552.
Finnish Institute for Occupational Health 2016. 149. Diesel Engine Exhaust. Gothenburg:
Nordic Expert Group & Dutch Expert Committee on Occupational Safety
Garrett, P. & Casimiro, E. 2011. Short-term effect of fine particulate matter (PM2.5) and
ozone on daily mortality in Lisbon, Portugal. Environmental Science and Pollution Research,
18, 1585-1592.
HEI 2018. State of Global Air. Boston: Boston: Health Effects Institute (HEI).
Hoevenagel, R. 1994. The contingent valuation method : scope and validity. Amsterdam:
Free University.
Hubbell, B. J. 2006. Implementing QALYs in the Analysis of Air Polution Regulations.
Environmental &Resource Economics, 34, 365-384.
ICCT 2019. A global snapshot of the air pollution-related health impacts of transportation
sector emissions in 2010 and 2015. he International Council on Clean Transportation (ICCT.
Jonson, J., Borken-Kleefeld, J., Simpson, D., Nyiri, A., Posch, M. & Heyes, C. 2017. Impact
of excess NO x emissions from diesel cars on air quality, public health and eutrophication in
Europe. Environmental Research Letters, 12.
Kiesewetter, G. & Amann, M. 2014. Urban PM2.5 levels under theEU Clean Air Policy
Package. TSAP Report #12. Version 1.0. . International Institute for Applied Systems Analysis
IIASA.
King's College 2015. Understanding the Health Impacts of Air Pollution in London. London
King's College.
Lammers, A., Janssen, N. A. H., Boere, A. J. F., Berger, M., Longo, C., Vijverberg, S. J. H.,
Neerincx, A. H., Maitland-van der Zee, A. H. & Cassee, F. R. 2020. Effects of short-term
exposure to ultrafine particles near an airport in healthy subjects. Environment
International, 141.
Lavigne, E., Donelle, J., Hatzopoulou, M., Van Ryswyk, K., Van Donkelaar, A., Martin, R. V.,
Chen, H., Stieb, D. M., Gasparrine, A., Crighton, E., et al. 2019. Spatiotemporal variations
in ambient ultrafine particles and the incidence of childhood asthma. American Journal of
Respiratory and Critical Care Medicine, 199, 1487-1495.
Lelieveld, J., Klingmüller, K., Pozzer, A., Pöschl, U., Fnais, M., Daiber, A. & Münzel, T.
2019. Cardiovascular disease burden from ambient air pollution in Europe reassessed using
novel hazard ratio functions. European Heart Journal, 40, 1590-1596.
Martinez, G. S., Spadaro, J., Chapizanis, D., Kendrovski, V., Kochubovski, M. & Mudu, P.
2018. Health Impacts and Economic Costs of Air Pollution in the Metropolitan Area of
Skopje. International Journal of Environmental Research and Public Health, 15, 626.
NEEDS 2008a. NEEDS deliverable No 1.1.-RS 3a Report on the procedure and data to
generate averaged/aggregated data. Priority 6.1 (...) Sub-priority 6.1.3.2.5: Socio-
economic tools and cencepts for energy strategy. Brussels: European Commission.
NEEDS 2008c. NEEDS deliverable 6.7 Final report on the monetary valuation of mortality and
morbidity risks from air pollution. Priority 6.1 (...) Sub-priority 6.1.3.2.5.: Socio-economic
tools and concepts for energy strategy. Brussels: European Commission.
OECD 2012. The value of statistical life : a meta analysis ENV/EPOC/WPNEP(2010)9/FINAL,
version 30-Jan-2012. Paris: OECD.
43 190272 - Health costs of air pollution in European cities and the linkage with transport – October 2020
Ohlwein, S., Kappeler, R., Joss, M. K., Künzli, N. & Hoffmann, B. 2019. Health effects of
utlrafine particles: a systematic literature review update of epidemiological evidence.
International Journal of Public Health, 64, 547-559.
Rabl, A., Spadaro, J. V. & Holland, M. 2014. How Much Is Clean Air Worth?: Calculating the
Benefits of Pollution Control. Cambridge: Cambridge University Press.
Ready, R., Malzubris, J. & Senkane, S. 2002. The relationship between environmental values
and income in a transition economy: Surface water quality in Latvia. Environment and
Development Economics, 7, 147-156.
RIVM. 2013. Roet als extra indicator voor de nadelige gezondheidseffecten van deeltjes
naast PM10 en PM2.5 [Online]. RIVM. Available: http://slideplayer.nl/slide/2211029/
[Accessed May 2018].
Rizza, V., Stabile, L., Vistocco, D., Russi, A., Pardi, S. & Buonanno, G. 2019. Effects of the
exposure to ultrafine particles on heart rate in a healthy population. Science of the Total
Environment, 2403-2410.
Schraufnagel, D. E. 2020. The health effects of ultrafine particles. Experimental &
Molecular Medicine, 1-7.
TNO, FACIT, VTT, GRAZ, T., PTV, DAI, CLU, VCC, SAFER, UNIS, et al. 2014. Impact
assessment and user perception of cooperative systems : D11.4 of the Drive C2X project.
Delft: TNO.
UBA 2019. Methodenkonvention 3.0 zur Ermittlung von Umweltkosten - Kostensätze Stand
02/2019. Dessau Roßlau: Umweltbundesamt (UBA).
Vlachokostas, C., Achillas, C., Moussiopoulos, Ν., Kalogeropoulos, K., Sigalas, G.,
Kalognomou, E.-A. & Banias, G. 2012. Health effects and social costs of particulate and
photochemical urban air pollution: a case study for Thessaloniki, Greece. Air Quality,
Atmosphere & Health, 5, 325-334.
Weichenthal, S., Olaniyan, T., Christidis, T., Lavigne, E., Hatzopoulou, M., Van Ryswyk, K.,
Tjepkema, M. & Burnett, R. 2020. Within-city spatial variations in ambient ultrafine particle
concentrations and incident brain tumors in adults. Epidemiology 31, 177-183.
WHO 2012. Health effects of black carbon. Geneva: Health effects of black carbon.
WHO 2013. Health risks of air pollution in Europe – HRAPIE project. Recommendations for
concentration–response functions for cost–benefit analysis of particulate matter, ozone and
nitrogen dioxide. Geneva: World Health Organization (WHO).
WHO Europe. 2018. Over half a million premature deaths annually in the European Region
attributable to household and ambient air pollution [Online]. Available:
http://www.euro.who.int/en/health-topics/environment-and-health/air-
quality/news/news/2018/5/over-half-a-million-premature-deaths-annually-in-the-
european-region-attributable-to-household-and-ambient-air-pollution [Accessed 2020].
44 190272 - Health costs of air pollution in European cities and the linkage with transport – October 2020
A Description of data
A.1 Pollution data
We have used two sources of data for annual concentration means in cities and merged
these:
1. Source: Urban Audit Data, Eurostat.
Data availability in 2013:
— 373 cities with PM10 data;
Of these:
— 329 cities with NO2 data;
— 311 cities with O3 data.
2. Source: Air quality statistics, European Environment Agency
Data availability in 2018:
— 556 cities with PM10 data;
Of these:
— 521 cities with NO2 data in 2018;
— 435 cities with O3 data in 2018;
— 387 cities with PM2.5 data in 2018.
We combined both datasets using an average of all monitoring stations in (2), so that:
— For PM10: 372 cities with data from (1), adjusted to 2018 level using the difference in
2013 and 2018 average from all monitoring stations in a city from (2), and 60 cities using
an average of monitoring stations from (2). The corresponding values are annual means
of µg/m3/year.
— For NO2: 329 cities with data from (1), adjusted to 2018 level using the difference in
2013 and 2018 average from all monitoring stations in a city from (2), and 103 cities
using an average of monitoring stations from (2). The corresponding values are annual
means of µg/m3/year.
— For O3: the unit of measurement differs between (1) and (2). After ample
considerations, it was found that the unit of measurement of (2) was more in line with
the recommended CRFs from WHO, so we took for O3 for 432 cities an average from all
monitoring stations from (2). The corresponding values are µg/m3/day converted to
µg/m3/year.
— For PM2.5, no data have been reported in (1), so we took for 432 cities an average of all
monitoring stations from (2) to create a single data point for each city.
For cities for which PM10 was available, but PM2.5 was not, the PM2.5 data have been imputed
based on the average share of PM2.5 in PM10. This share is calculated as an average based on
the cities for which both data points were available in 2018. The result of this calculation is
an average share of 0.62 PM2.5 in PM10, with a standard deviation of 0.12.
Some commentators asked us if we could adjust a correction figure for cities in central
European countries that may underreport their levels of pollution. However, such
corrections go beyond the scope of the present report that deals with reported levels of air
quality.
45 190272 - Health costs of air pollution in European cities and the linkage with transport – October 2020
A.2 Population data
Source: Population on 1 January by age groups and sex – cities and greater cities, City
statistics, Eurostat: Population on 1 January by age groups and sex - cities and greater cities
For each city (usually grouped by country) the recorded year of data is chosen based on
completeness of data for the cities in the database. The result is a variety of years from
which population data is included for the health cost calculations. For each city, the year
from which population data is used is indicated in the dataset.
The following age cohorts were available: 0-4; 5-9; 10-14; 15-19; 20-24; 25-34; 35-44; 45-
54; 55-64; 65-74; 75+. In the health cost calculations, where a fraction of an age cohort was
needed, a proportional share of the relevant age group is used (e.g. infants aged 0-1 are
20% of the age cohort 0-4).
The following adjustments have been made to the population data in order to fill the gaps:
— German cities: the number of inhabitants aged 0-4 is deduced from total population
minus all other age cohorts, as cohort 0-4 was the only one missing.
— Norway, cities Trondheim, Bergen, Oslo: the number of inhabitants aged 0-4 is deduced
from total population minus all other age cohorts, as cohort 0-4 was the only one
missing.
— Geneva: age cohorts 55-64; 20-24; 25-34; 35-44; 45-54 are calculated based on the
average share of these age cohorts in the total population in the other Swiss cities
available in the database.
— France: for all French cities the total population has been sourced from the following
website due to inaccuracy of the Eurostat data: City Population.
— Subsequently, the age cohorts have been determined based on the average share of
these cohorts in the total population in the Eurostat data available in the database.
— Iceland: for Reykjavik, population data for all age cohorts and total population are
sourced from the following website: Statistics Iceland: Municipalities and urban nuclei
(Statistics Iceland).
A.3 Economically active population data
Source: Labour market — cities and greater cities, City statistics, Eurostat
For each city, the same recorded year of data is used as was used for the population
statistics. Two statistics are recorded for each city: total economically active population
and the economically active population aged 20-64. The latter is used in the health cost
calculations.
The following adjustments have been made to the economically active population data to
fill the gaps:
— Czech Republic: Total economically active population used instead of economically
active population aged 20-64.
— All cities in Romania, Poland, Norway, Luxembourg, Iceland: no data for economically
active population is available. These are filled with the average share of labour force in
total population, as calculated from World Bank data, applied to the total population
from Eurostat.
— Source: Labor force, total, World Bank
— Source: Population, total, World Bank
— The same data is used to calculate average shares of economically active population in
the total population for the UK and Germany, in order to estimate the economically
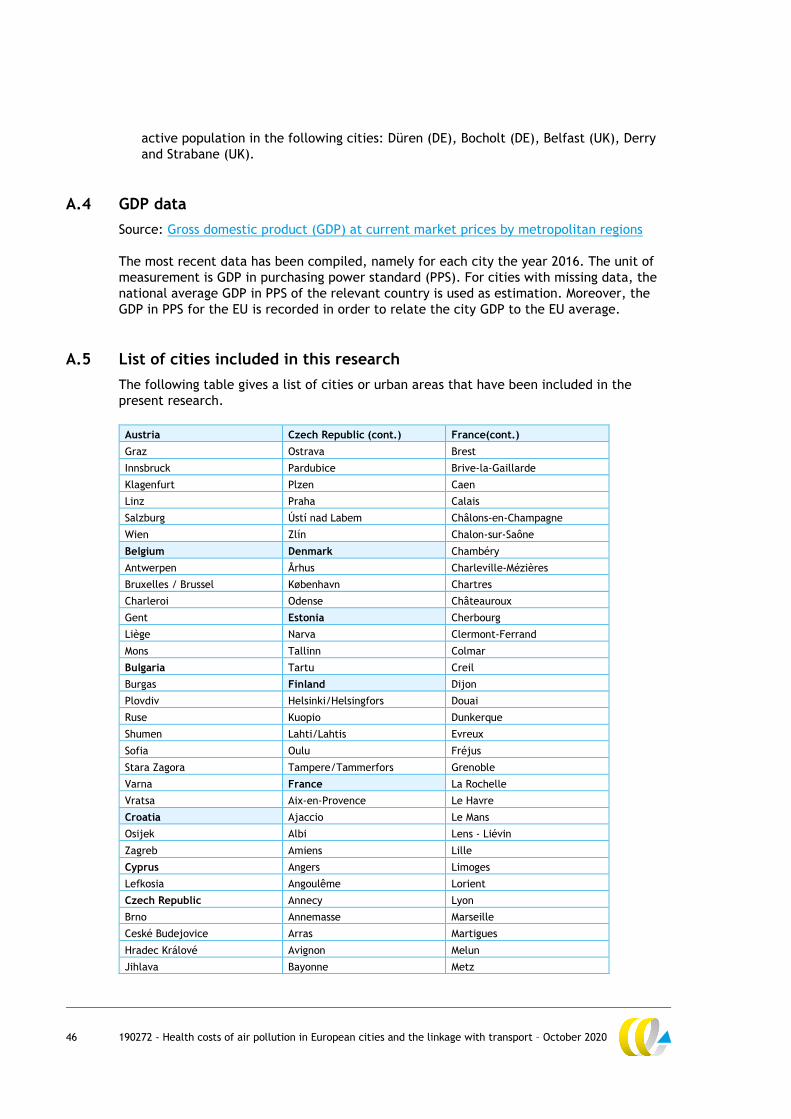
46 190272 - Health costs of air pollution in European cities and the linkage with transport – October 2020
active population in the following cities: Düren (DE), Bocholt (DE), Belfast (UK), Derry
and Strabane (UK).
A.4 GDP data
Source: Gross domestic product (GDP) at current market prices by metropolitan regions
The most recent data has been compiled, namely for each city the year 2016. The unit of
measurement is GDP in purchasing power standard (PPS). For cities with missing data, the
national average GDP in PPS of the relevant country is used as estimation. Moreover, the
GDP in PPS for the EU is recorded in order to relate the city GDP to the EU average.
A.5 List of cities included in this research
The following table gives a list of cities or urban areas that have been included in the
present research.
Austria Czech Republic (cont.) France(cont.)
Graz Ostrava Brest
Innsbruck Pardubice Brive-la-Gaillarde
Klagenfurt Plzen Caen
Linz Praha Calais
Salzburg Ústí nad Labem Châlons-en-Champagne
Wien Zlín Chalon-sur-Saône
Belgium Denmark Chambéry
Antwerpen Århus Charleville-Mézières
Bruxelles / Brussel København Chartres
Charleroi Odense Châteauroux
Gent Estonia Cherbourg
Liège Narva Clermont-Ferrand
Mons Tallinn Colmar
Bulgaria Tartu Creil
Burgas Finland Dijon
Plovdiv Helsinki/Helsingfors Douai
Ruse Kuopio Dunkerque
Shumen Lahti/Lahtis Evreux
Sofia Oulu Fréjus
Stara Zagora Tampere/Tammerfors Grenoble
Varna France La Rochelle
Vratsa Aix-en-Provence Le Havre
Croatia Ajaccio Le Mans
Osijek Albi Lens - Liévin
Zagreb Amiens Lille
Cyprus Angers Limoges
Lefkosia Angoulême Lorient
Czech Republic Annecy Lyon
Brno Annemasse Marseille
Ceské Budejovice Arras Martigues
Hradec Králové Avignon Melun
Jihlava Bayonne Metz

47 190272 - Health costs of air pollution in European cities and the linkage with transport – October 2020
Karviná Besançon Montbéliard
Kladno Bordeaux Montpellier
Liberec Boulogne-sur-Mer Mulhouse
Most Bourges Nancy
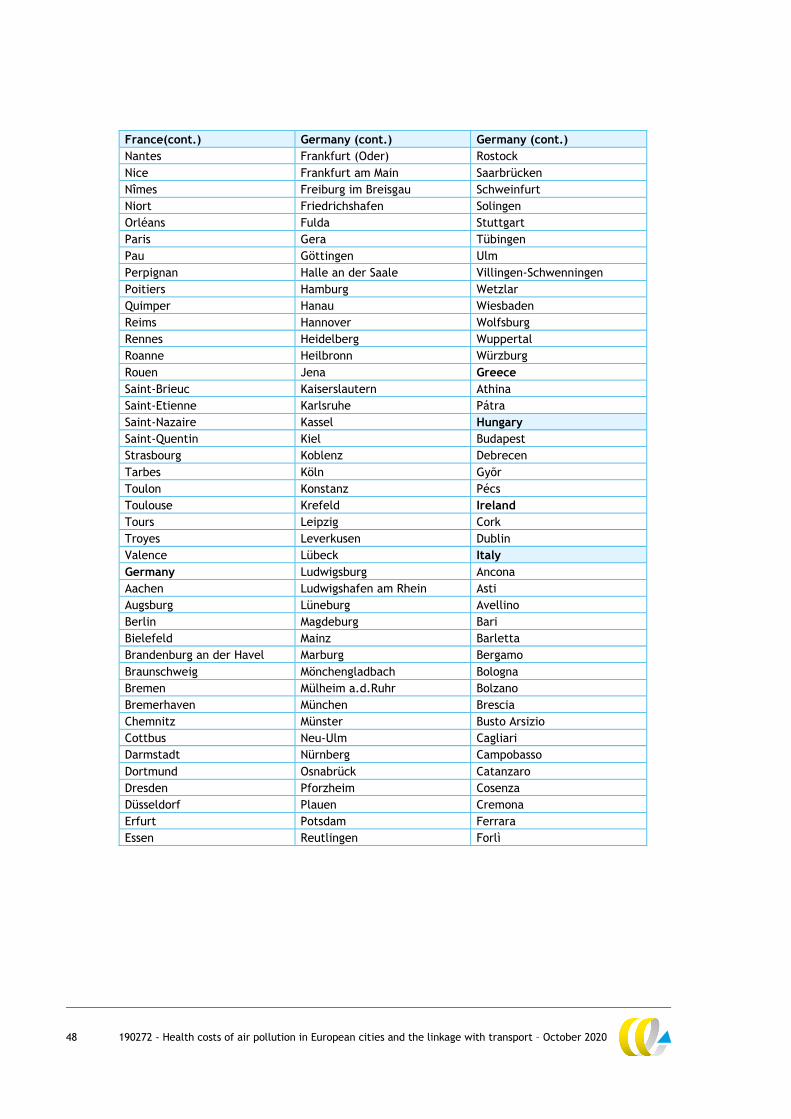
48 190272 - Health costs of air pollution in European cities and the linkage with transport – October 2020
France(cont.) Germany (cont.) Germany (cont.)
Nantes Frankfurt (Oder) Rostock
Nice Frankfurt am Main Saarbrücken
Nîmes Freiburg im Breisgau Schweinfurt
Niort Friedrichshafen Solingen
Orléans Fulda Stuttgart
Paris Gera Tübingen
Pau Göttingen Ulm
Perpignan Halle an der Saale Villingen-Schwenningen
Poitiers Hamburg Wetzlar
Quimper Hanau Wiesbaden
Reims Hannover Wolfsburg
Rennes Heidelberg Wuppertal
Roanne Heilbronn Würzburg
Rouen Jena Greece
Saint-Brieuc Kaiserslautern Athina
Saint-Etienne Karlsruhe Pátra
Saint-Nazaire Kassel Hungary
Saint-Quentin Kiel Budapest
Strasbourg Koblenz Debrecen
Tarbes Köln Gyõr
Toulon Konstanz Pécs
Toulouse Krefeld Ireland
Tours Leipzig Cork
Troyes Leverkusen Dublin
Valence Lübeck Italy
Germany Ludwigsburg Ancona
Aachen Ludwigshafen am Rhein Asti
Augsburg Lüneburg Avellino
Berlin Magdeburg Bari
Bielefeld Mainz Barletta
Brandenburg an der Havel Marburg Bergamo
Braunschweig Mönchengladbach Bologna
Bremen Mülheim a.d.Ruhr Bolzano
Bremerhaven München Brescia
Chemnitz Münster Busto Arsizio
Cottbus Neu-Ulm Cagliari
Darmstadt Nürnberg Campobasso
Dortmund Osnabrück Catanzaro
Dresden Pforzheim Cosenza
Düsseldorf Plauen Cremona
Erfurt Potsdam Ferrara
Essen Reutlingen Forlì
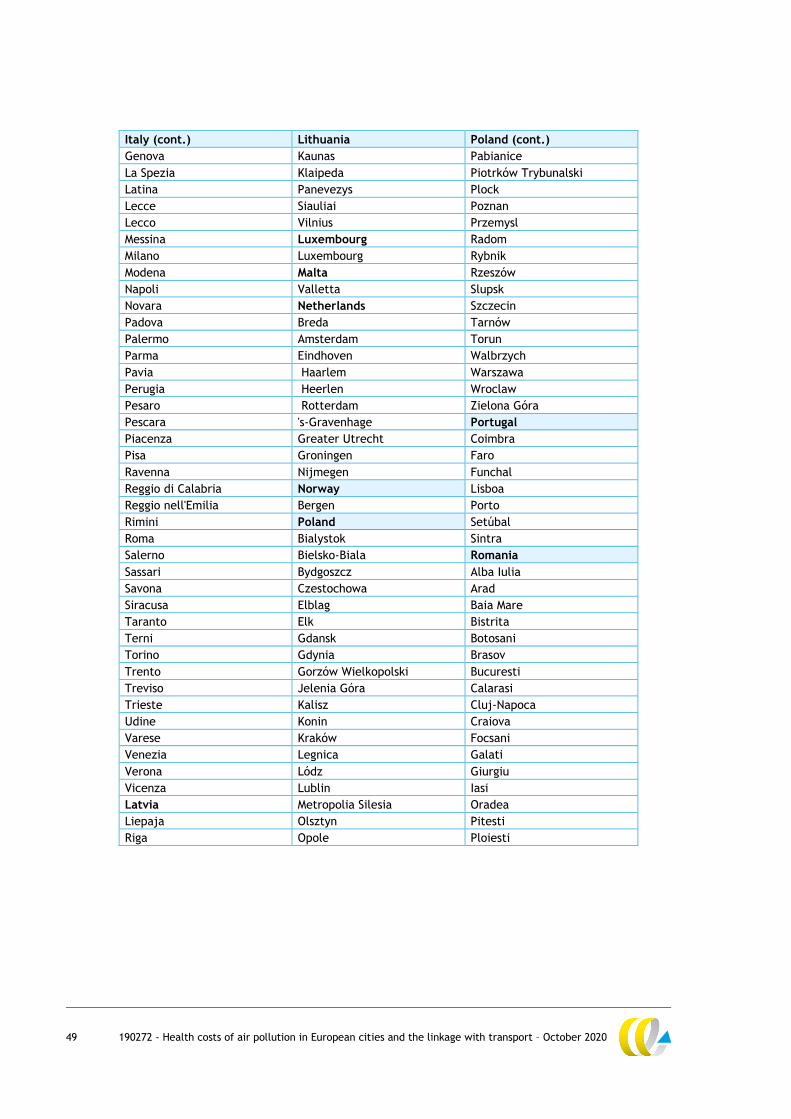
49 190272 - Health costs of air pollution in European cities and the linkage with transport – October 2020
Italy (cont.) Lithuania Poland (cont.)
Genova Kaunas Pabianice
La Spezia Klaipeda Piotrków Trybunalski
Latina Panevezys Plock
Lecce Siauliai Poznan
Lecco Vilnius Przemysl
Messina Luxembourg Radom
Milano Luxembourg Rybnik
Modena Malta Rzeszów
Napoli Valletta Slupsk
Novara Netherlands Szczecin
Padova Breda Tarnów
Palermo Amsterdam Torun
Parma Eindhoven Walbrzych
Pavia Haarlem Warszawa
Perugia Heerlen Wroclaw
Pesaro Rotterdam Zielona Góra
Pescara 's-Gravenhage Portugal
Piacenza Greater Utrecht Coimbra
Pisa Groningen Faro
Ravenna Nijmegen Funchal
Reggio di Calabria Norway Lisboa
Reggio nell'Emilia Bergen Porto
Rimini Poland Setúbal
Roma Bialystok Sintra
Salerno Bielsko-Biala Romania
Sassari Bydgoszcz Alba Iulia
Savona Czestochowa Arad
Siracusa Elblag Baia Mare
Taranto Elk Bistrita
Terni Gdansk Botosani
Torino Gdynia Brasov
Trento Gorzów Wielkopolski Bucuresti
Treviso Jelenia Góra Calarasi
Trieste Kalisz Cluj-Napoca
Udine Konin Craiova
Varese Kraków Focsani
Venezia Legnica Galati
Verona Lódz Giurgiu
Vicenza Lublin Iasi
Latvia Metropolia Silesia Oradea
Liepaja Olsztyn Pitesti
Riga Opole Ploiesti
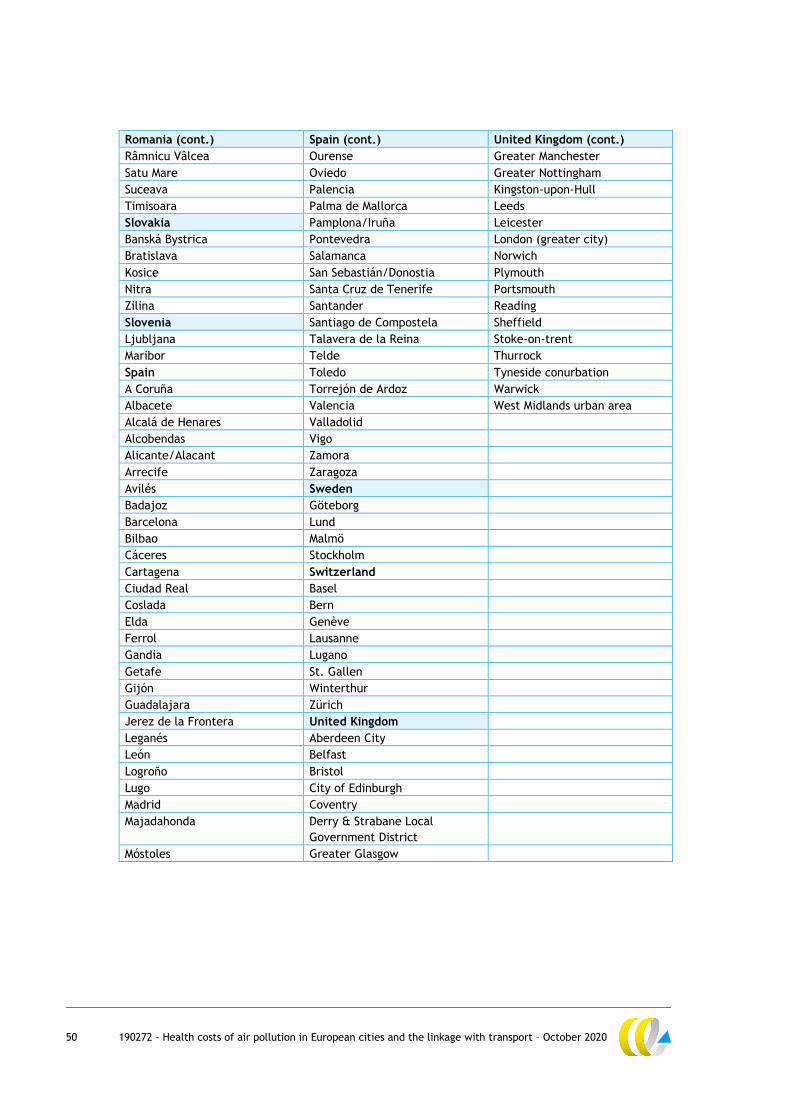
50 190272 - Health costs of air pollution in European cities and the linkage with transport – October 2020
Romania (cont.) Spain (cont.) United Kingdom (cont.)
Râmnicu Vâlcea Ourense Greater Manchester
Satu Mare Oviedo Greater Nottingham
Suceava Palencia Kingston-upon-Hull
Timisoara Palma de Mallorca Leeds
Slovakia Pamplona/Iruña Leicester
Banská Bystrica Pontevedra London (greater city)
Bratislava Salamanca Norwich
Kosice San Sebastián/Donostia Plymouth
Nitra Santa Cruz de Tenerife Portsmouth
Zilina Santander Reading
Slovenia Santiago de Compostela Sheffield
Ljubljana Talavera de la Reina Stoke-on-trent
Maribor Telde Thurrock
Spain Toledo Tyneside conurbation
A Coruña Torrejón de Ardoz Warwick
Albacete Valencia West Midlands urban area
Alcalá de Henares Valladolid
Alcobendas Vigo
Alicante/Alacant Zamora
Arrecife Zaragoza
Avilés Sweden
Badajoz Göteborg
Barcelona Lund
Bilbao Malmö
Cáceres Stockholm
Cartagena Switzerland
Ciudad Real Basel
Coslada Bern
Elda Genève
Ferrol Lausanne
Gandia Lugano
Getafe St. Gallen
Gijón Winterthur
Guadalajara Zürich
Jerez de la Frontera United Kingdom
Leganés Aberdeen City
León Belfast
Logroño Bristol
Lugo City of Edinburgh
Madrid Coventry
Majadahonda Derry & Strabane Local
Government District
Móstoles Greater Glasgow
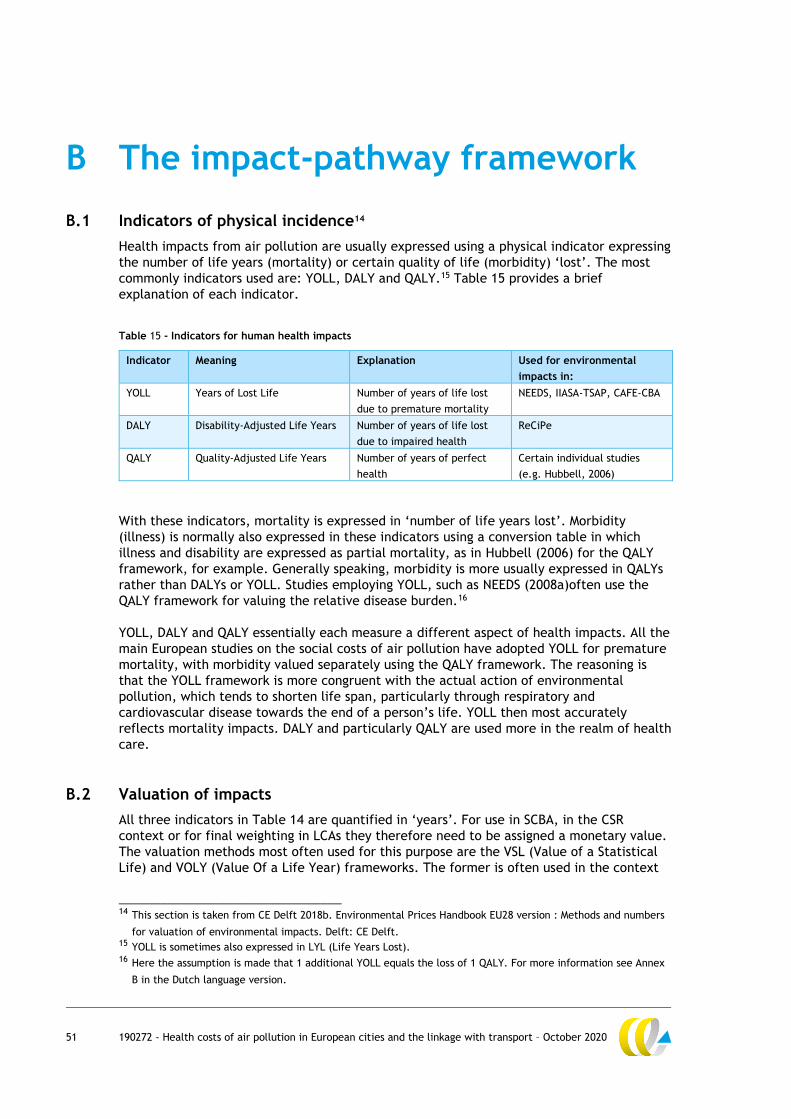
51 190272 - Health costs of air pollution in European cities and the linkage with transport – October 2020
B The impact-pathway framework
B.1 Indicators of physical incidence14
Health impacts from air pollution are usually expressed using a physical indicator expressing
the number of life years (mortality) or certain quality of life (morbidity) ‘lost’. The most
commonly indicators used are: YOLL, DALY and QALY.15 Table 15 provides a brief
explanation of each indicator.
Table 15 - Indicators for human health impacts
Indicator Meaning Explanation Used for environmental
impacts in:
YOLL Years of Lost Life Number of years of life lost
due to premature mortality
NEEDS, IIASA-TSAP, CAFE-CBA
DALY Disability-Adjusted Life Years Number of years of life lost
due to impaired health
ReCiPe
QALY Quality-Adjusted Life Years Number of years of perfect
health
Certain individual studies
(e.g. Hubbell, 2006)
With these indicators, mortality is expressed in ‘number of life years lost’. Morbidity
(illness) is normally also expressed in these indicators using a conversion table in which
illness and disability are expressed as partial mortality, as in Hubbell (2006) for the QALY
framework, for example. Generally speaking, morbidity is more usually expressed in QALYs
rather than DALYs or YOLL. Studies employing YOLL, such as NEEDS (2008a)often use the
QALY framework for valuing the relative disease burden.16
YOLL, DALY and QALY essentially each measure a different aspect of health impacts. All the
main European studies on the social costs of air pollution have adopted YOLL for premature
mortality, with morbidity valued separately using the QALY framework. The reasoning is
that the YOLL framework is more congruent with the actual action of environmental
pollution, which tends to shorten life span, particularly through respiratory and
cardiovascular disease towards the end of a person’s life. YOLL then most accurately
reflects mortality impacts. DALY and particularly QALY are used more in the realm of health
care.
B.2 Valuation of impacts
All three indicators in Table 14 are quantified in ‘years’. For use in SCBA, in the CSR
context or for final weighting in LCAs they therefore need to be assigned a monetary value.
The valuation methods most often used for this purpose are the VSL (Value of a Statistical
Life) and VOLY (Value Of a Life Year) frameworks. The former is often used in the context
________________________________ 14 This section is taken from CE Delft 2018b. Environmental Prices Handbook EU28 version : Methods and numbers
for valuation of environmental impacts. Delft: CE Delft. 15 YOLL is sometimes also expressed in LYL (Life Years Lost). 16 Here the assumption is made that 1 additional YOLL equals the loss of 1 QALY. For more information see Annex
B in the Dutch language version.
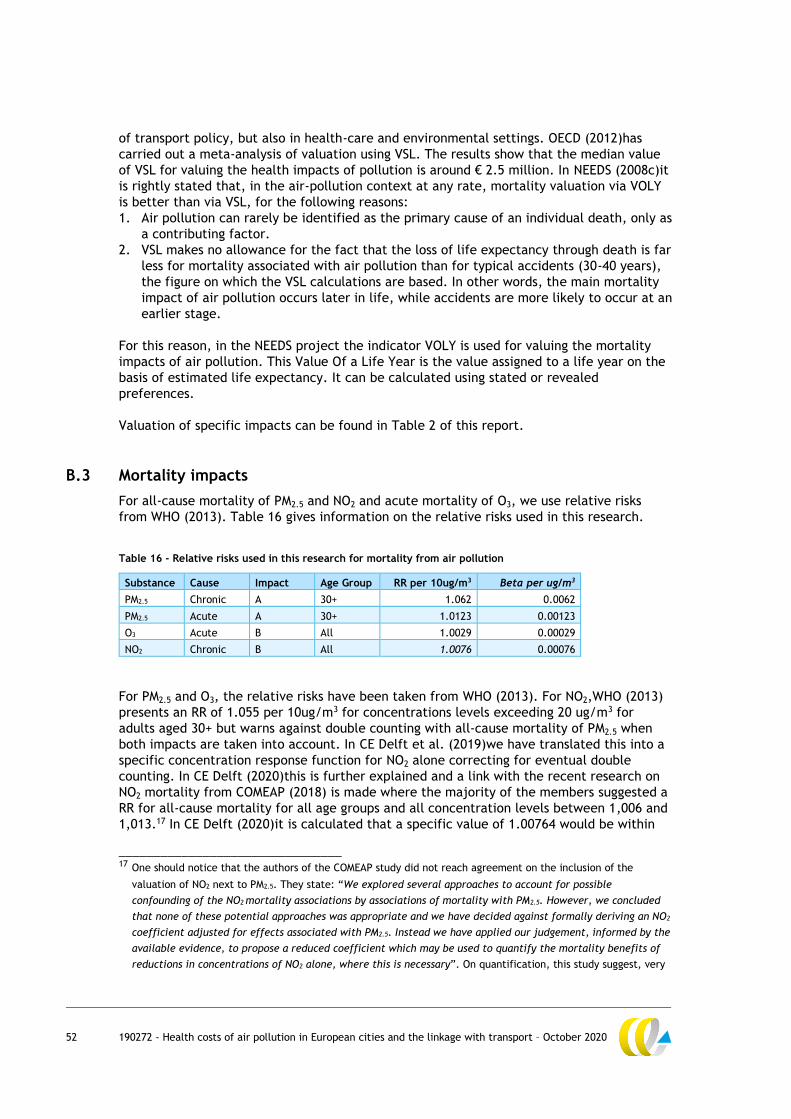
52 190272 - Health costs of air pollution in European cities and the linkage with transport – October 2020
of transport policy, but also in health-care and environmental settings. OECD (2012)has
carried out a meta-analysis of valuation using VSL. The results show that the median value
of VSL for valuing the health impacts of pollution is around € 2.5 million. In NEEDS (2008c)it
is rightly stated that, in the air-pollution context at any rate, mortality valuation via VOLY
is better than via VSL, for the following reasons:
1. Air pollution can rarely be identified as the primary cause of an individual death, only as
a contributing factor.
2. VSL makes no allowance for the fact that the loss of life expectancy through death is far
less for mortality associated with air pollution than for typical accidents (30-40 years),
the figure on which the VSL calculations are based. In other words, the main mortality
impact of air pollution occurs later in life, while accidents are more likely to occur at an
earlier stage.
For this reason, in the NEEDS project the indicator VOLY is used for valuing the mortality
impacts of air pollution. This Value Of a Life Year is the value assigned to a life year on the
basis of estimated life expectancy. It can be calculated using stated or revealed
preferences.
Valuation of specific impacts can be found in Table 2 of this report.
B.3 Mortality impacts
For all-cause mortality of PM2.5 and NO2 and acute mortality of O3, we use relative risks
from WHO (2013). Table 16 gives information on the relative risks used in this research.
Table 16 - Relative risks used in this research for mortality from air pollution
Substance Cause Impact Age Group RR per 10ug/m3 Beta per ug/m3
PM2.5 Chronic A 30+ 1.062 0.0062
PM2.5 Acute A 30+ 1.0123 0.00123
O3 Acute B All 1.0029 0.00029
NO2 Chronic B All 1.0076 0.00076
For PM2.5 and O3, the relative risks have been taken from WHO (2013). For NO2,WHO (2013)
presents an RR of 1.055 per 10ug/m3 for concentrations levels exceeding 20 ug/m3 for
adults aged 30+ but warns against double counting with all-cause mortality of PM2.5 when
both impacts are taken into account. In CE Delft et al. (2019)we have translated this into a
specific concentration response function for NO2 alone correcting for eventual double
counting. In CE Delft (2020)this is further explained and a link with the recent research on
NO2 mortality from COMEAP (2018) is made where the majority of the members suggested a
RR for all-cause mortality for all age groups and all concentration levels between 1,006 and
1,013.17 In CE Delft (2020)it is calculated that a specific value of 1.00764 would be within
________________________________ 17 One should notice that the authors of the COMEAP study did not reach agreement on the inclusion of the
valuation of NO2 next to PM2.5. They state: “We explored several approaches to account for possible
confounding of the NO2 mortality associations by associations of mortality with PM2.5. However, we concluded
that none of these potential approaches was appropriate and we have decided against formally deriving an NO2
coefficient adjusted for effects associated with PM2.5. Instead we have applied our judgement, informed by the
available evidence, to propose a reduced coefficient which may be used to quantify the mortality benefits of
reductions in concentrations of NO2 alone, where this is necessary”. On quantification, this study suggest, very
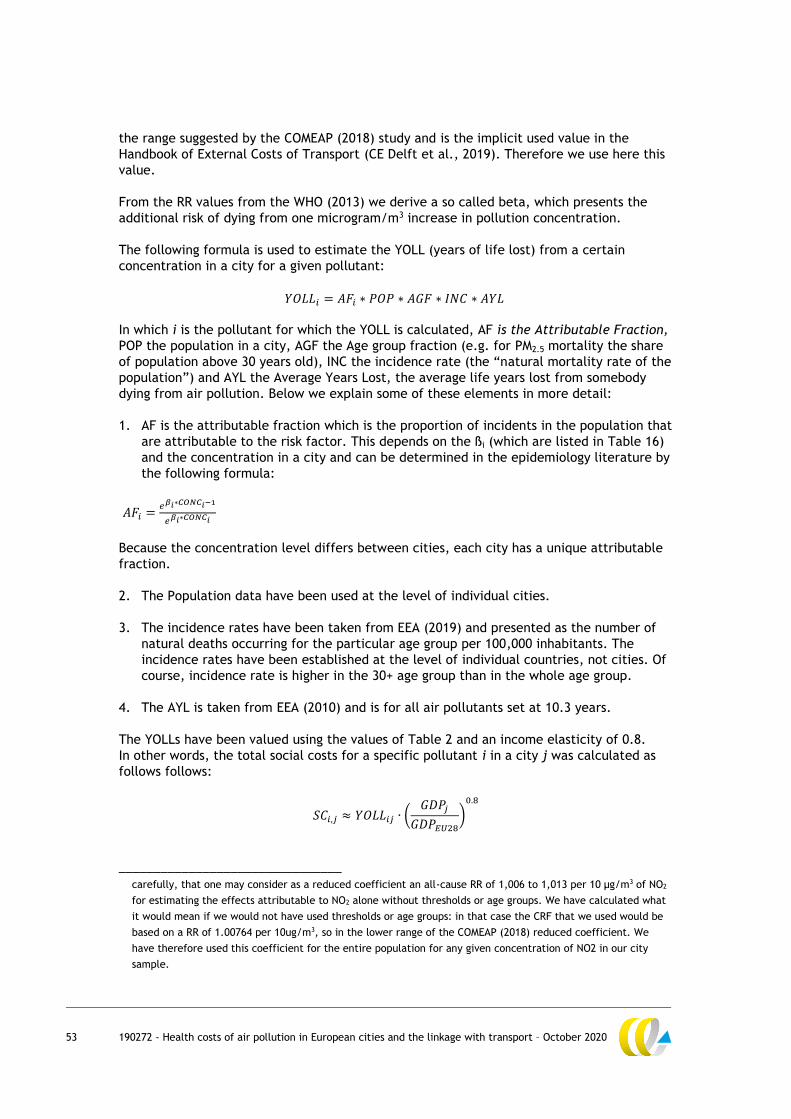
53 190272 - Health costs of air pollution in European cities and the linkage with transport – October 2020
the range suggested by the COMEAP (2018) study and is the implicit used value in the
Handbook of External Costs of Transport (CE Delft et al., 2019). Therefore we use here this
value.
From the RR values from the WHO (2013) we derive a so called beta, which presents the
additional risk of dying from one microgram/m3 increase in pollution concentration.
The following formula is used to estimate the YOLL (years of life lost) from a certain
concentration in a city for a given pollutant:
𝑌𝑂𝐿𝐿𝑖 = 𝐴𝐹𝑖 ∗ 𝑃𝑂𝑃 ∗ 𝐴𝐺𝐹 ∗ 𝐼𝑁𝐶 ∗ 𝐴𝑌𝐿
In which i is the pollutant for which the YOLL is calculated, AF is the Attributable Fraction,
POP the population in a city, AGF the Age group fraction (e.g. for PM2.5 mortality the share
of population above 30 years old), INC the incidence rate (the “natural mortality rate of the
population”) and AYL the Average Years Lost, the average life years lost from somebody
dying from air pollution. Below we explain some of these elements in more detail:
1. AF is the attributable fraction which is the proportion of incidents in the population that
are attributable to the risk factor. This depends on the ßi (which are listed in Table 16)
and the concentration in a city and can be determined in the epidemiology literature by
the following formula:
𝐴𝐹𝑖 =𝑒𝛽𝑖∗𝐶𝑂𝑁𝐶𝑖−1
𝑒𝛽𝑖∗𝐶𝑂𝑁𝐶𝑖
Because the concentration level differs between cities, each city has a unique attributable
fraction.
2. The Population data have been used at the level of individual cities.
3. The incidence rates have been taken from EEA (2019) and presented as the number of
natural deaths occurring for the particular age group per 100,000 inhabitants. The
incidence rates have been established at the level of individual countries, not cities. Of
course, incidence rate is higher in the 30+ age group than in the whole age group.
4. The AYL is taken from EEA (2010) and is for all air pollutants set at 10.3 years.
The YOLLs have been valued using the values of Table 2 and an income elasticity of 0.8.
In other words, the total social costs for a specific pollutant i in a city j was calculated as
follows follows:
𝑆𝐶𝑖,𝑗 ≈ 𝑌𝑂𝐿𝐿𝑖𝑗 ∙ (𝐺𝐷𝑃𝑗
𝐺𝐷𝑃𝐸𝑈28
)0.8
________________________________
carefully, that one may consider as a reduced coefficient an all-cause RR of 1,006 to 1,013 per 10 μg/m3 of NO2
for estimating the effects attributable to NO2 alone without thresholds or age groups. We have calculated what
it would mean if we would not have used thresholds or age groups: in that case the CRF that we used would be
based on a RR of 1.00764 per 10ug/m3, so in the lower range of the COMEAP (2018) reduced coefficient. We
have therefore used this coefficient for the entire population for any given concentration of NO2 in our city
sample.
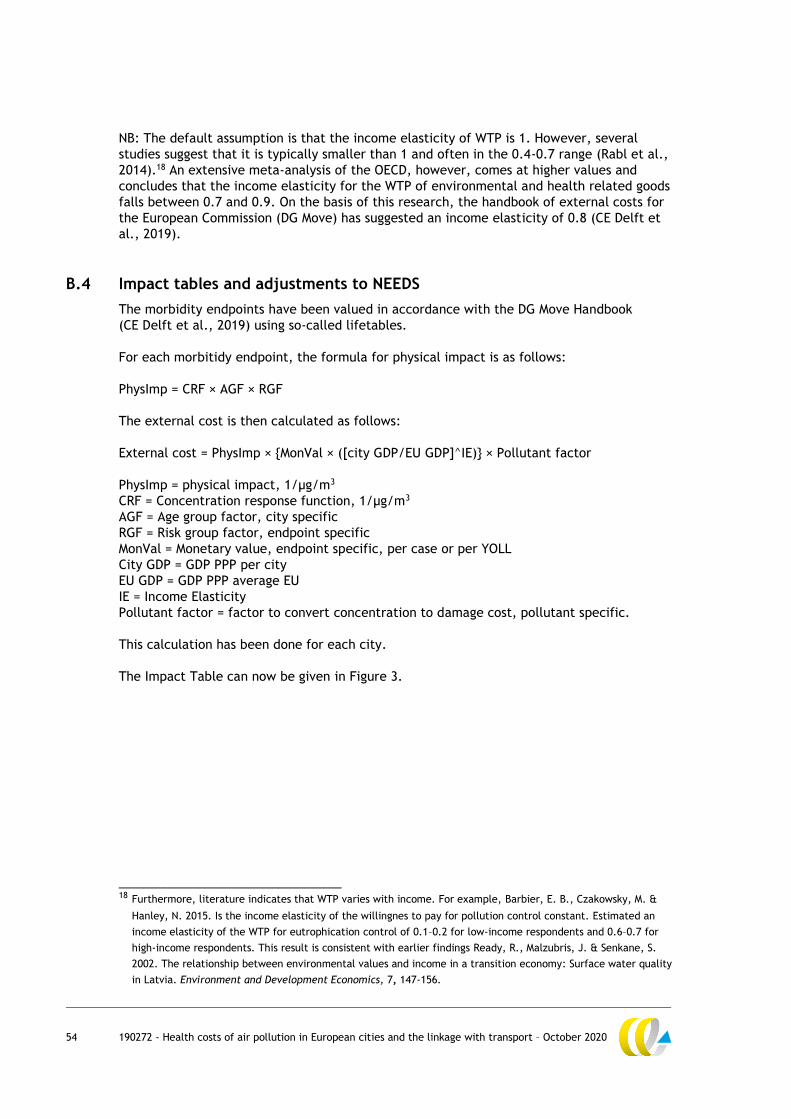
54 190272 - Health costs of air pollution in European cities and the linkage with transport – October 2020
NB: The default assumption is that the income elasticity of WTP is 1. However, several
studies suggest that it is typically smaller than 1 and often in the 0.4-0.7 range (Rabl et al.,
2014).18 An extensive meta-analysis of the OECD, however, comes at higher values and
concludes that the income elasticity for the WTP of environmental and health related goods
falls between 0.7 and 0.9. On the basis of this research, the handbook of external costs for
the European Commission (DG Move) has suggested an income elasticity of 0.8 (CE Delft et
al., 2019).
B.4 Impact tables and adjustments to NEEDS
The morbidity endpoints have been valued in accordance with the DG Move Handbook
(CE Delft et al., 2019) using so-called lifetables.
For each morbitidy endpoint, the formula for physical impact is as follows:
PhysImp = CRF × AGF × RGF
The external cost is then calculated as follows:
External cost = PhysImp × {MonVal × ([city GDP/EU GDP]^IE)} × Pollutant factor
PhysImp = physical impact, 1/µg/m3
CRF = Concentration response function, 1/µg/m3
AGF = Age group factor, city specific
RGF = Risk group factor, endpoint specific
MonVal = Monetary value, endpoint specific, per case or per YOLL
City GDP = GDP PPP per city
EU GDP = GDP PPP average EU
IE = Income Elasticity
Pollutant factor = factor to convert concentration to damage cost, pollutant specific.
This calculation has been done for each city.
The Impact Table can now be given in Figure 3.
________________________________ 18 Furthermore, literature indicates that WTP varies with income. For example, Barbier, E. B., Czakowsky, M. &
Hanley, N. 2015. Is the income elasticity of the willingnes to pay for pollution control constant. Estimated an
income elasticity of the WTP for eutrophication control of 0.1–0.2 for low-income respondents and 0.6–0.7 for
high-income respondents. This result is consistent with earlier findings Ready, R., Malzubris, J. & Senkane, S.
2002. The relationship between environmental values and income in a transition economy: Surface water quality
in Latvia. Environment and Development Economics, 7, 147-156.
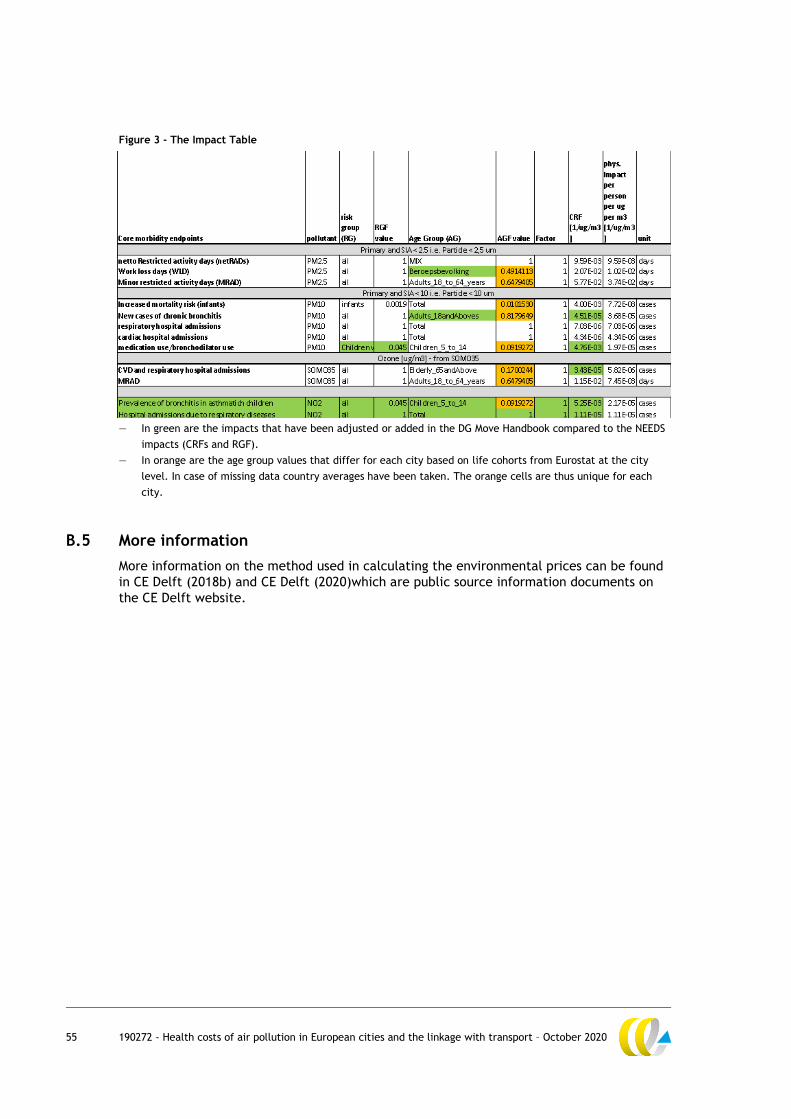
55 190272 - Health costs of air pollution in European cities and the linkage with transport – October 2020
Figure 3 - The Impact Table
— In green are the impacts that have been adjusted or added in the DG Move Handbook compared to the NEEDS
impacts (CRFs and RGF).
— In orange are the age group values that differ for each city based on life cohorts from Eurostat at the city
level. In case of missing data country averages have been taken. The orange cells are thus unique for each
city.
B.5 More information
More information on the method used in calculating the environmental prices can be found
in CE Delft (2018b) and CE Delft (2020)which are public source information documents on
the CE Delft website.
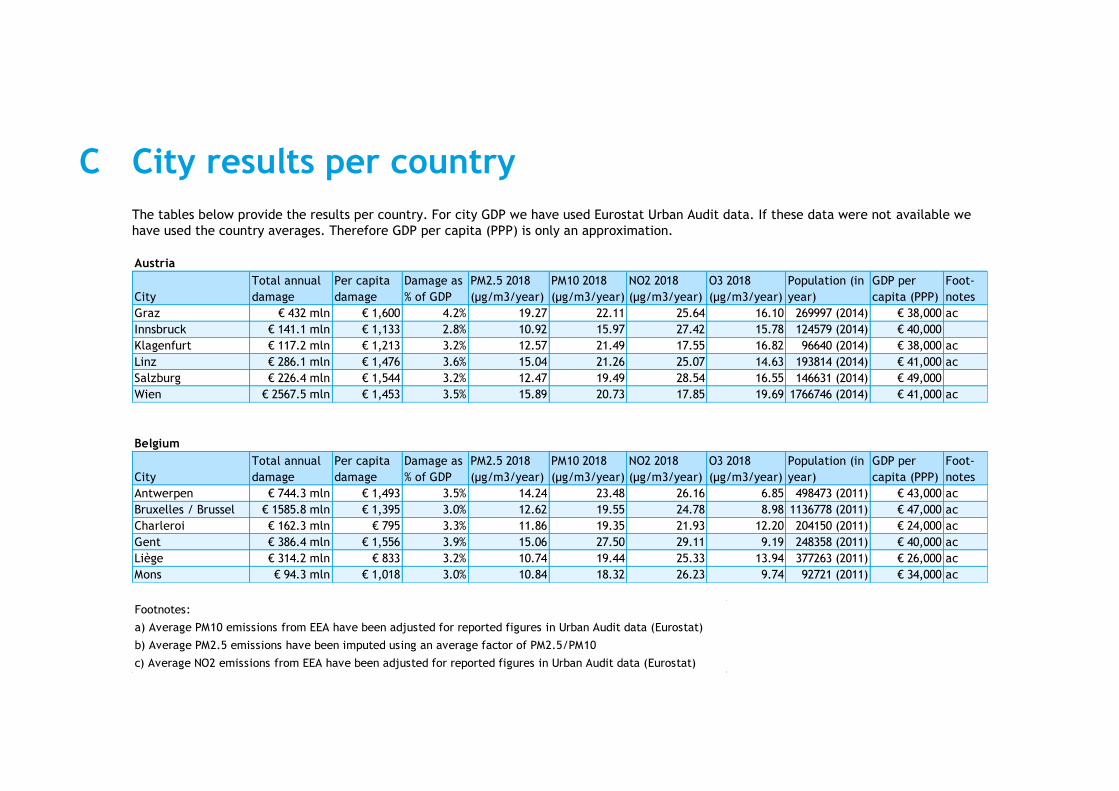
56 190272 - Health costs of air pollution in European cities and the linkage with transport – October 2020
C City results per country
The tables below provide the results per country. For city GDP we have used Eurostat Urban Audit data. If these data were not available we
have used the country averages. Therefore GDP per capita (PPP) is only an approximation.
Austria
City
Total annual
damage
Per capita
damage
Damage as
% of GDP
PM2.5 2018
(μg/m3/year)
PM10 2018
(μg/m3/year)
NO2 2018
(μg/m3/year)
O3 2018
(μg/m3/year)
Population (in
year)
GDP per
capita (PPP)
Foot-
notes
Graz € 432 mln € 1,600 4.2% 19.27 22.11 25.64 16.10 269997 (2014) € 38,000 ac
Innsbruck € 141.1 mln € 1,133 2.8% 10.92 15.97 27.42 15.78 124579 (2014) € 40,000
Klagenfurt € 117.2 mln € 1,213 3.2% 12.57 21.49 17.55 16.82 96640 (2014) € 38,000 ac
Linz € 286.1 mln € 1,476 3.6% 15.04 21.26 25.07 14.63 193814 (2014) € 41,000 ac
Salzburg € 226.4 mln € 1,544 3.2% 12.47 19.49 28.54 16.55 146631 (2014) € 49,000
Wien € 2567.5 mln € 1,453 3.5% 15.89 20.73 17.85 19.69 1766746 (2014) € 41,000 ac
Belgium
City
Total annual
damage
Per capita
damage
Damage as
% of GDP
PM2.5 2018
(μg/m3/year)
PM10 2018
(μg/m3/year)
NO2 2018
(μg/m3/year)
O3 2018
(μg/m3/year)
Population (in
year)
GDP per
capita (PPP)
Foot-
notes
Antwerpen € 744.3 mln € 1,493 3.5% 14.24 23.48 26.16 6.85 498473 (2011) € 43,000 ac
Bruxelles / Brussel € 1585.8 mln € 1,395 3.0% 12.62 19.55 24.78 8.98 1136778 (2011) € 47,000 ac
Charleroi € 162.3 mln € 795 3.3% 11.86 19.35 21.93 12.20 204150 (2011) € 24,000 ac
Gent € 386.4 mln € 1,556 3.9% 15.06 27.50 29.11 9.19 248358 (2011) € 40,000 ac
Liège € 314.2 mln € 833 3.2% 10.74 19.44 25.33 13.94 377263 (2011) € 26,000 ac
Mons € 94.3 mln € 1,018 3.0% 10.84 18.32 26.23 9.74 92721 (2011) € 34,000 ac
Footnotes:
a) Average PM10 emissions from EEA have been adjusted for reported figures in Urban Audit data (Eurostat)
b) Average PM2.5 emissions have been imputed using an average factor of PM2.5/PM10
c) Average NO2 emissions from EEA have been adjusted for reported figures in Urban Audit data (Eurostat)
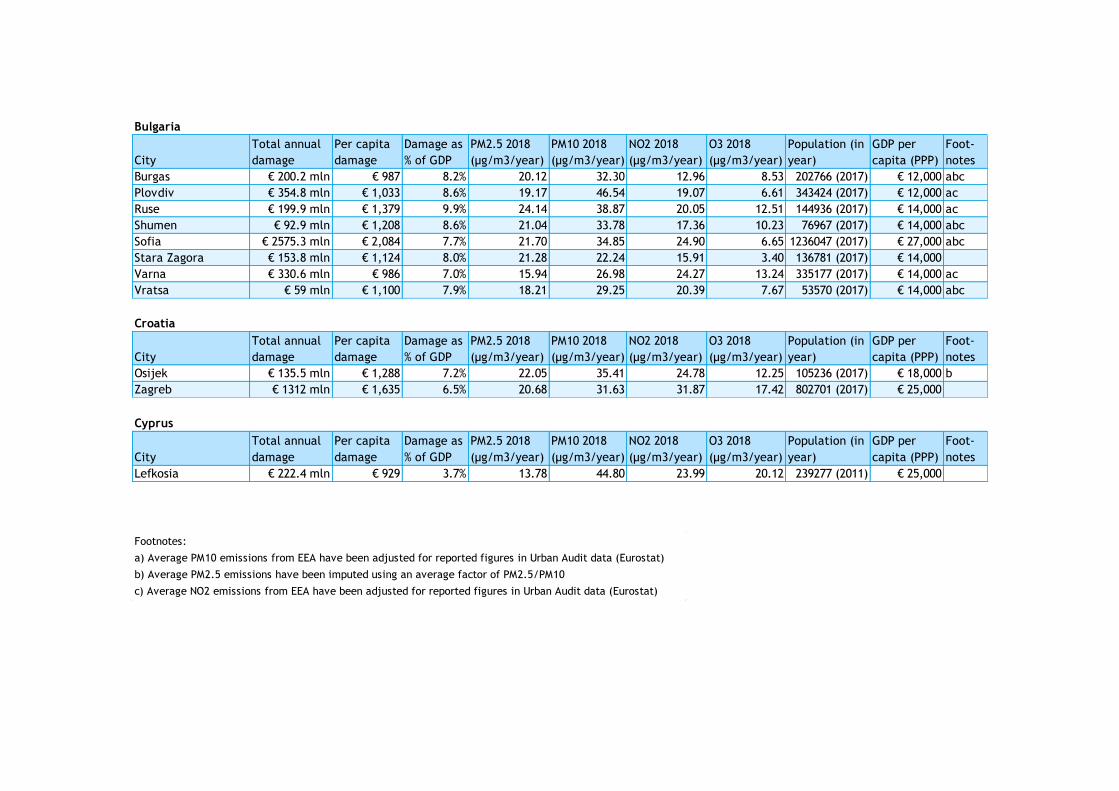
57 190272 - Health costs of air pollution in European cities and the linkage with transport – October 2020
Bulgaria
City
Total annual
damage
Per capita
damage
Damage as
% of GDP
PM2.5 2018
(μg/m3/year)
PM10 2018
(μg/m3/year)
NO2 2018
(μg/m3/year)
O3 2018
(μg/m3/year)
Population (in
year)
GDP per
capita (PPP)
Foot-
notes
Burgas € 200.2 mln € 987 8.2% 20.12 32.30 12.96 8.53 202766 (2017) € 12,000 abc
Plovdiv € 354.8 mln € 1,033 8.6% 19.17 46.54 19.07 6.61 343424 (2017) € 12,000 ac
Ruse € 199.9 mln € 1,379 9.9% 24.14 38.87 20.05 12.51 144936 (2017) € 14,000 ac
Shumen € 92.9 mln € 1,208 8.6% 21.04 33.78 17.36 10.23 76967 (2017) € 14,000 abc
Sofia € 2575.3 mln € 2,084 7.7% 21.70 34.85 24.90 6.65 1236047 (2017) € 27,000 abc
Stara Zagora € 153.8 mln € 1,124 8.0% 21.28 22.24 15.91 3.40 136781 (2017) € 14,000
Varna € 330.6 mln € 986 7.0% 15.94 26.98 24.27 13.24 335177 (2017) € 14,000 ac
Vratsa € 59 mln € 1,100 7.9% 18.21 29.25 20.39 7.67 53570 (2017) € 14,000 abc
Croatia
City
Total annual
damage
Per capita
damage
Damage as
% of GDP
PM2.5 2018
(μg/m3/year)
PM10 2018
(μg/m3/year)
NO2 2018
(μg/m3/year)
O3 2018
(μg/m3/year)
Population (in
year)
GDP per
capita (PPP)
Foot-
notes
Osijek € 135.5 mln € 1,288 7.2% 22.05 35.41 24.78 12.25 105236 (2017) € 18,000 b
Zagreb € 1312 mln € 1,635 6.5% 20.68 31.63 31.87 17.42 802701 (2017) € 25,000
Cyprus
City
Total annual
damage
Per capita
damage
Damage as
% of GDP
PM2.5 2018
(μg/m3/year)
PM10 2018
(μg/m3/year)
NO2 2018
(μg/m3/year)
O3 2018
(μg/m3/year)
Population (in
year)
GDP per
capita (PPP)
Foot-
notes
Lefkosia € 222.4 mln € 929 3.7% 13.78 44.80 23.99 20.12 239277 (2011) € 25,000
Footnotes:
a) Average PM10 emissions from EEA have been adjusted for reported figures in Urban Audit data (Eurostat)
b) Average PM2.5 emissions have been imputed using an average factor of PM2.5/PM10
c) Average NO2 emissions from EEA have been adjusted for reported figures in Urban Audit data (Eurostat)
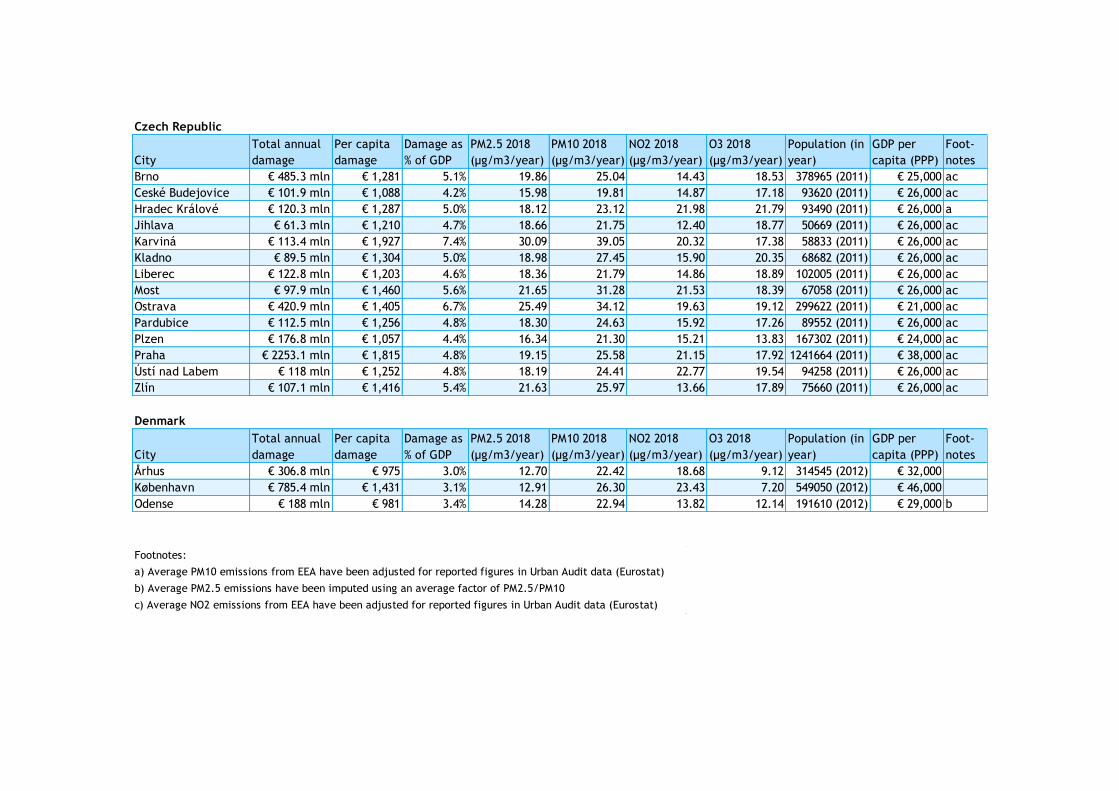
58 190272 - Health costs of air pollution in European cities and the linkage with transport – October 2020
Czech Republic
City
Total annual
damage
Per capita
damage
Damage as
% of GDP
PM2.5 2018
(μg/m3/year)
PM10 2018
(μg/m3/year)
NO2 2018
(μg/m3/year)
O3 2018
(μg/m3/year)
Population (in
year)
GDP per
capita (PPP)
Foot-
notes
Brno € 485.3 mln € 1,281 5.1% 19.86 25.04 14.43 18.53 378965 (2011) € 25,000 ac
Ceské Budejovice € 101.9 mln € 1,088 4.2% 15.98 19.81 14.87 17.18 93620 (2011) € 26,000 ac
Hradec Králové € 120.3 mln € 1,287 5.0% 18.12 23.12 21.98 21.79 93490 (2011) € 26,000 a
Jihlava € 61.3 mln € 1,210 4.7% 18.66 21.75 12.40 18.77 50669 (2011) € 26,000 ac
Karviná € 113.4 mln € 1,927 7.4% 30.09 39.05 20.32 17.38 58833 (2011) € 26,000 ac
Kladno € 89.5 mln € 1,304 5.0% 18.98 27.45 15.90 20.35 68682 (2011) € 26,000 ac
Liberec € 122.8 mln € 1,203 4.6% 18.36 21.79 14.86 18.89 102005 (2011) € 26,000 ac
Most € 97.9 mln € 1,460 5.6% 21.65 31.28 21.53 18.39 67058 (2011) € 26,000 ac
Ostrava € 420.9 mln € 1,405 6.7% 25.49 34.12 19.63 19.12 299622 (2011) € 21,000 ac
Pardubice € 112.5 mln € 1,256 4.8% 18.30 24.63 15.92 17.26 89552 (2011) € 26,000 ac
Plzen € 176.8 mln € 1,057 4.4% 16.34 21.30 15.21 13.83 167302 (2011) € 24,000 ac
Praha € 2253.1 mln € 1,815 4.8% 19.15 25.58 21.15 17.92 1241664 (2011) € 38,000 ac
Ústí nad Labem € 118 mln € 1,252 4.8% 18.19 24.41 22.77 19.54 94258 (2011) € 26,000 ac
Zlín € 107.1 mln € 1,416 5.4% 21.63 25.97 13.66 17.89 75660 (2011) € 26,000 ac
Denmark
City
Total annual
damage
Per capita
damage
Damage as
% of GDP
PM2.5 2018
(μg/m3/year)
PM10 2018
(μg/m3/year)
NO2 2018
(μg/m3/year)
O3 2018
(μg/m3/year)
Population (in
year)
GDP per
capita (PPP)
Foot-
notes
Århus € 306.8 mln € 975 3.0% 12.70 22.42 18.68 9.12 314545 (2012) € 32,000
København € 785.4 mln € 1,431 3.1% 12.91 26.30 23.43 7.20 549050 (2012) € 46,000
Odense € 188 mln € 981 3.4% 14.28 22.94 13.82 12.14 191610 (2012) € 29,000 b
Footnotes:
a) Average PM10 emissions from EEA have been adjusted for reported figures in Urban Audit data (Eurostat)
b) Average PM2.5 emissions have been imputed using an average factor of PM2.5/PM10
c) Average NO2 emissions from EEA have been adjusted for reported figures in Urban Audit data (Eurostat)

59 190272 - Health costs of air pollution in European cities and the linkage with transport – October 2020
Estonia
City
Total annual
damage
Per capita
damage
Damage as
% of GDP
PM2.5 2018
(μg/m3/year)
PM10 2018
(μg/m3/year)
NO2 2018
(μg/m3/year)
O3 2018
(μg/m3/year)
Population (in
year)
GDP per
capita (PPP)
Foot-
notes
Narva € 23.1 mln € 405 1.8% 5.43 12.91 4.40 0.00 57130 (2017) € 22,000 ac
Tallinn € 249.2 mln € 584 1.8% 6.13 13.07 5.29 0.00 426538 (2017) € 33,000 ac
Tartu € 44.8 mln € 481 2.2% 7.24 16.24 5.85 0.00 93124 (2017) € 22,000 ac
Finland
City
Total annual
damage
Per capita
damage
Damage as
% of GDP
PM2.5 2018
(μg/m3/year)
PM10 2018
(μg/m3/year)
NO2 2018
(μg/m3/year)
O3 2018
(μg/m3/year)
Population (in
year)
GDP per
capita (PPP)
Foot-
notes
Helsinki /
Helsingfors € 493.7 mln € 777 1.9% 7.28 13.40 10.99 6.33 635181 (2017) € 42,000 ac
Kuopio € 50.4 mln € 428 1.3% 3.53 13.50 12.68 5.85 117740 (2017) € 32,000
Lahti / Lahtis € 68.9 mln € 577 1.8% 5.19 16.83 15.43 5.18 119452 (2017) € 32,000
Oulu € 105.9 mln € 528 1.6% 5.84 11.53 16.80 5.09 200526 (2017) € 32,000
Tampere /
Tammerfors € 117.3 mln € 514 1.8% 5.86 13.67 13.90 4.32 228274 (2017) € 29,000
Footnotes:
a) Average PM10 emissions from EEA have been adjusted for reported figures in Urban Audit data (Eurostat)
b) Average PM2.5 emissions have been imputed using an average factor of PM2.5/PM10
c) Average NO2 emissions from EEA have been adjusted for reported figures in Urban Audit data (Eurostat)
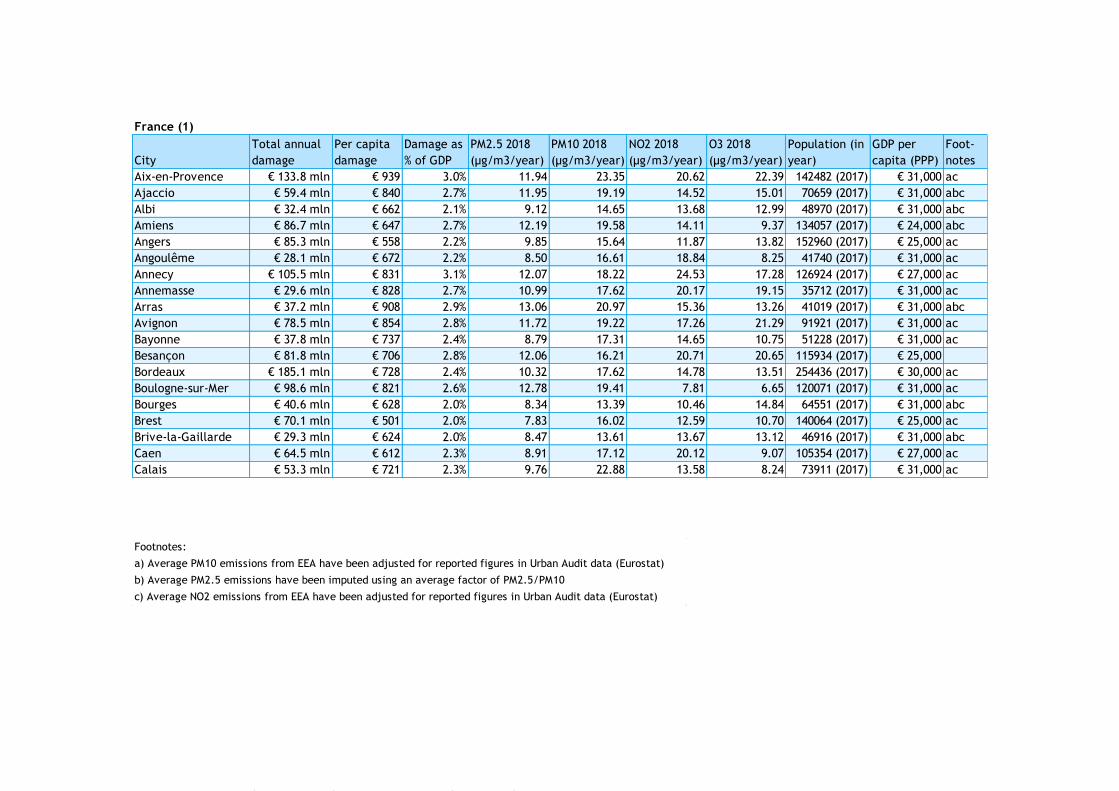
60 190272 - Health costs of air pollution in European cities and the linkage with transport – October 2020
France (1)
City
Total annual
damage
Per capita
damage
Damage as
% of GDP
PM2.5 2018
(μg/m3/year)
PM10 2018
(μg/m3/year)
NO2 2018
(μg/m3/year)
O3 2018
(μg/m3/year)
Population (in
year)
GDP per
capita (PPP)
Foot-
notes
Aix-en-Provence € 133.8 mln € 939 3.0% 11.94 23.35 20.62 22.39 142482 (2017) € 31,000 ac
Ajaccio € 59.4 mln € 840 2.7% 11.95 19.19 14.52 15.01 70659 (2017) € 31,000 abc
Albi € 32.4 mln € 662 2.1% 9.12 14.65 13.68 12.99 48970 (2017) € 31,000 abc
Amiens € 86.7 mln € 647 2.7% 12.19 19.58 14.11 9.37 134057 (2017) € 24,000 abc
Angers € 85.3 mln € 558 2.2% 9.85 15.64 11.87 13.82 152960 (2017) € 25,000 ac
Angoulême € 28.1 mln € 672 2.2% 8.50 16.61 18.84 8.25 41740 (2017) € 31,000 ac
Annecy € 105.5 mln € 831 3.1% 12.07 18.22 24.53 17.28 126924 (2017) € 27,000 ac
Annemasse € 29.6 mln € 828 2.7% 10.99 17.62 20.17 19.15 35712 (2017) € 31,000 ac
Arras € 37.2 mln € 908 2.9% 13.06 20.97 15.36 13.26 41019 (2017) € 31,000 abc
Avignon € 78.5 mln € 854 2.8% 11.72 19.22 17.26 21.29 91921 (2017) € 31,000 ac
Bayonne € 37.8 mln € 737 2.4% 8.79 17.31 14.65 10.75 51228 (2017) € 31,000 ac
Besançon € 81.8 mln € 706 2.8% 12.06 16.21 20.71 20.65 115934 (2017) € 25,000
Bordeaux € 185.1 mln € 728 2.4% 10.32 17.62 14.78 13.51 254436 (2017) € 30,000 ac
Boulogne-sur-Mer € 98.6 mln € 821 2.6% 12.78 19.41 7.81 6.65 120071 (2017) € 31,000 ac
Bourges € 40.6 mln € 628 2.0% 8.34 13.39 10.46 14.84 64551 (2017) € 31,000 abc
Brest € 70.1 mln € 501 2.0% 7.83 16.02 12.59 10.70 140064 (2017) € 25,000 ac
Brive-la-Gaillarde € 29.3 mln € 624 2.0% 8.47 13.61 13.67 13.12 46916 (2017) € 31,000 abc
Caen € 64.5 mln € 612 2.3% 8.91 17.12 20.12 9.07 105354 (2017) € 27,000 ac
Calais € 53.3 mln € 721 2.3% 9.76 22.88 13.58 8.24 73911 (2017) € 31,000 ac
Footnotes:
a) Average PM10 emissions from EEA have been adjusted for reported figures in Urban Audit data (Eurostat)
b) Average PM2.5 emissions have been imputed using an average factor of PM2.5/PM10
c) Average NO2 emissions from EEA have been adjusted for reported figures in Urban Audit data (Eurostat)
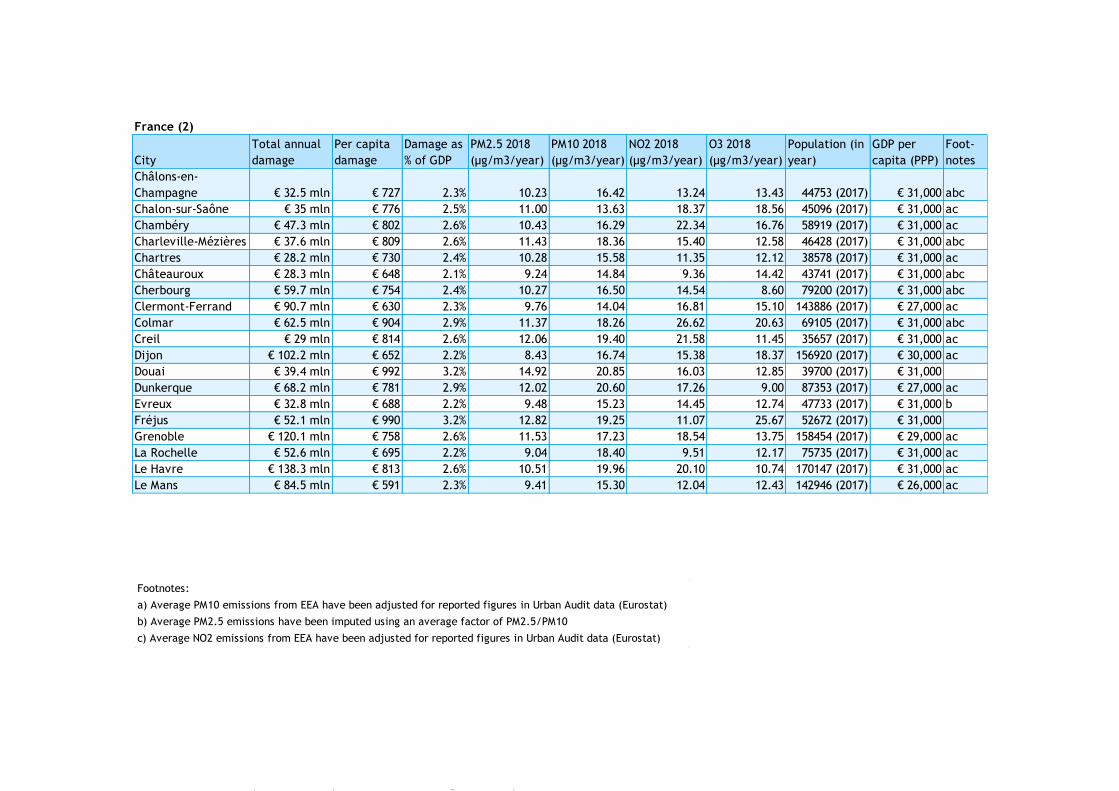
61 190272 - Health costs of air pollution in European cities and the linkage with transport – October 2020
France (2)
City
Total annual
damage
Per capita
damage
Damage as
% of GDP
PM2.5 2018
(μg/m3/year)
PM10 2018
(μg/m3/year)
NO2 2018
(μg/m3/year)
O3 2018
(μg/m3/year)
Population (in
year)
GDP per
capita (PPP)
Foot-
notes
Châlons-en-
Champagne € 32.5 mln € 727 2.3% 10.23 16.42 13.24 13.43 44753 (2017) € 31,000 abc
Chalon-sur-Saône € 35 mln € 776 2.5% 11.00 13.63 18.37 18.56 45096 (2017) € 31,000 ac
Chambéry € 47.3 mln € 802 2.6% 10.43 16.29 22.34 16.76 58919 (2017) € 31,000 ac
Charleville-Mézières € 37.6 mln € 809 2.6% 11.43 18.36 15.40 12.58 46428 (2017) € 31,000 abc
Chartres € 28.2 mln € 730 2.4% 10.28 15.58 11.35 12.12 38578 (2017) € 31,000 ac
Châteauroux € 28.3 mln € 648 2.1% 9.24 14.84 9.36 14.42 43741 (2017) € 31,000 abc
Cherbourg € 59.7 mln € 754 2.4% 10.27 16.50 14.54 8.60 79200 (2017) € 31,000 abc
Clermont-Ferrand € 90.7 mln € 630 2.3% 9.76 14.04 16.81 15.10 143886 (2017) € 27,000 ac
Colmar € 62.5 mln € 904 2.9% 11.37 18.26 26.62 20.63 69105 (2017) € 31,000 abc
Creil € 29 mln € 814 2.6% 12.06 19.40 21.58 11.45 35657 (2017) € 31,000 ac
Dijon € 102.2 mln € 652 2.2% 8.43 16.74 15.38 18.37 156920 (2017) € 30,000 ac
Douai € 39.4 mln € 992 3.2% 14.92 20.85 16.03 12.85 39700 (2017) € 31,000
Dunkerque € 68.2 mln € 781 2.9% 12.02 20.60 17.26 9.00 87353 (2017) € 27,000 ac
Evreux € 32.8 mln € 688 2.2% 9.48 15.23 14.45 12.74 47733 (2017) € 31,000 b
Fréjus € 52.1 mln € 990 3.2% 12.82 19.25 11.07 25.67 52672 (2017) € 31,000
Grenoble € 120.1 mln € 758 2.6% 11.53 17.23 18.54 13.75 158454 (2017) € 29,000 ac
La Rochelle € 52.6 mln € 695 2.2% 9.04 18.40 9.51 12.17 75735 (2017) € 31,000 ac
Le Havre € 138.3 mln € 813 2.6% 10.51 19.96 20.10 10.74 170147 (2017) € 31,000 ac
Le Mans € 84.5 mln € 591 2.3% 9.41 15.30 12.04 12.43 142946 (2017) € 26,000 ac
Footnotes:
a) Average PM10 emissions from EEA have been adjusted for reported figures in Urban Audit data (Eurostat)
b) Average PM2.5 emissions have been imputed using an average factor of PM2.5/PM10
c) Average NO2 emissions from EEA have been adjusted for reported figures in Urban Audit data (Eurostat)

62 190272 - Health costs of air pollution in European cities and the linkage with transport – October 2020
France (3)
City
Total annual
damage
Per capita
damage
Damage as
% of GDP
PM2.5 2018
(μg/m3/year)
PM10 2018
(μg/m3/year)
NO2 2018
(μg/m3/year)
O3 2018
(μg/m3/year)
Population (in
year)
GDP per
capita (PPP)
Foot-
notes
Lens - Liévin € 57.8 mln € 929 3.0% 13.52 21.71 17.18 10.63 62200 (2017) € 31,000 abc
Lille € 206.2 mln € 886 3.3% 14.78 22.27 24.37 10.25 232787 (2017) € 27,000 ac
Limoges € 69 mln € 522 2.1% 8.07 11.87 16.60 13.76 132175 (2017) € 25,000 ac
Lorient € 38.9 mln € 681 2.2% 9.37 15.05 10.94 10.38 57149 (2017) € 31,000 abc
Lyon € 585.3 mln € 1,134 2.8% 12.37 18.49 28.26 15.71 516092 (2017) € 41,000 ac
Marseille € 774.1 mln € 897 3.2% 12.49 22.26 23.69 21.54 863310 (2017) € 28,000 ac
Martigues € 44.7 mln € 928 3.0% 11.64 22.07 15.69 26.66 48188 (2017) € 31,000 ac
Melun € 40.6 mln € 1,015 3.3% 14.12 24.79 30.50 10.27 40032 (2017) € 31,000
Metz € 105.7 mln € 907 2.9% 12.46 19.85 20.23 14.74 116429 (2017) € 31,000 ac
Montbéliard € 21.6 mln € 849 2.7% 11.18 19.66 19.03 20.84 25395 (2017) € 31,000 ac
Montpellier € 180.3 mln € 632 2.4% 10.36 12.56 23.18 18.54 285121 (2017) € 26,000 ac
Mulhouse € 86.6 mln € 791 3.2% 12.84 18.25 24.55 19.58 109443 (2017) € 25,000 ac
Nancy € 65.1 mln € 624 2.6% 10.79 16.52 19.89 14.67 104286 (2017) € 24,000 ac
Nantes € 216 mln € 698 2.3% 10.12 14.64 14.38 12.33 309346 (2017) € 31,000 ac
Nice € 383.4 mln € 1,128 3.6% 12.53 25.19 36.25 19.86 340017 (2017) € 31,000
Nîmes € 84.2 mln € 559 2.7% 9.85 16.80 19.01 18.57 150610 (2017) € 21,000
Niort € 38.7 mln € 660 2.1% 8.99 16.62 11.66 11.34 58707 (2017) € 31,000 ac
Orléans € 75.3 mln € 645 2.3% 10.76 12.98 11.84 14.41 116685 (2017) € 28,000 ac
Paris € 3505.3 mln € 1,602 3.1% 14.27 20.80 33.94 11.49 2187526 (2017) € 52,000 ac
Footnotes:
a) Average PM10 emissions from EEA have been adjusted for reported figures in Urban Audit data (Eurostat)
b) Average PM2.5 emissions have been imputed using an average factor of PM2.5/PM10
c) Average NO2 emissions from EEA have been adjusted for reported figures in Urban Audit data (Eurostat)
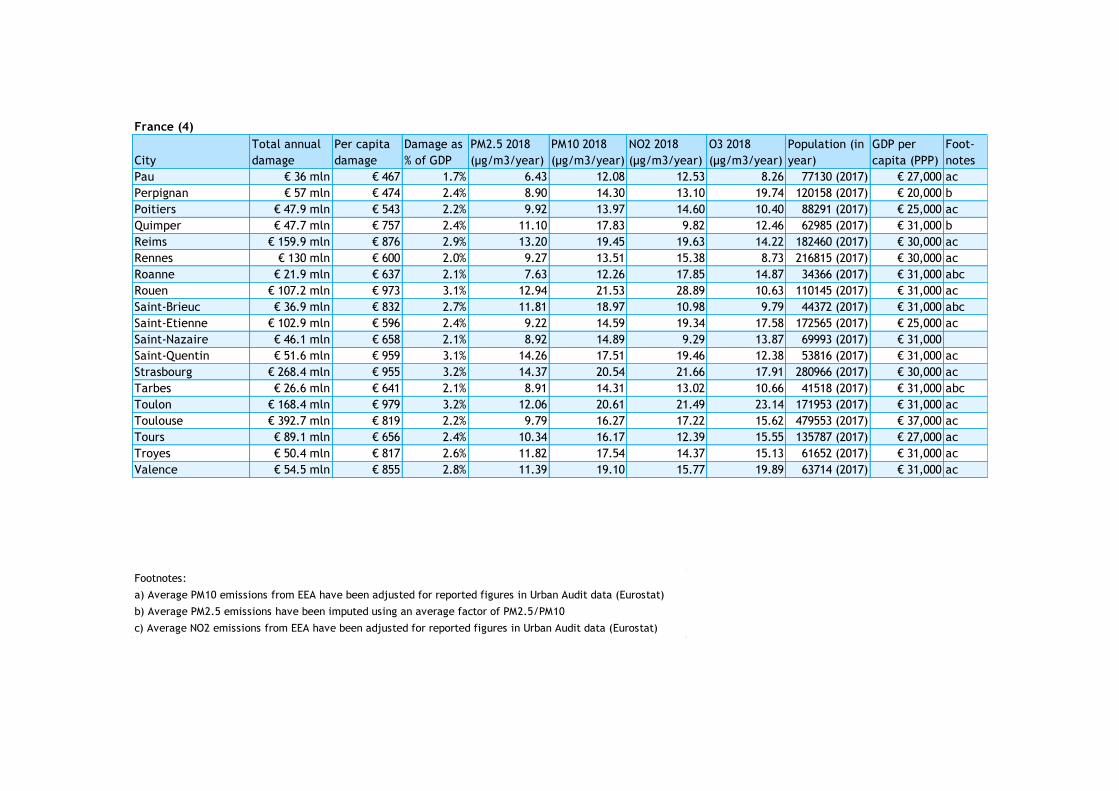
63 190272 - Health costs of air pollution in European cities and the linkage with transport – October 2020
France (4)
City
Total annual
damage
Per capita
damage
Damage as
% of GDP
PM2.5 2018
(μg/m3/year)
PM10 2018
(μg/m3/year)
NO2 2018
(μg/m3/year)
O3 2018
(μg/m3/year)
Population (in
year)
GDP per
capita (PPP)
Foot-
notes
Pau € 36 mln € 467 1.7% 6.43 12.08 12.53 8.26 77130 (2017) € 27,000 ac
Perpignan € 57 mln € 474 2.4% 8.90 14.30 13.10 19.74 120158 (2017) € 20,000 b
Poitiers € 47.9 mln € 543 2.2% 9.92 13.97 14.60 10.40 88291 (2017) € 25,000 ac
Quimper € 47.7 mln € 757 2.4% 11.10 17.83 9.82 12.46 62985 (2017) € 31,000 b
Reims € 159.9 mln € 876 2.9% 13.20 19.45 19.63 14.22 182460 (2017) € 30,000 ac
Rennes € 130 mln € 600 2.0% 9.27 13.51 15.38 8.73 216815 (2017) € 30,000 ac
Roanne € 21.9 mln € 637 2.1% 7.63 12.26 17.85 14.87 34366 (2017) € 31,000 abc
Rouen € 107.2 mln € 973 3.1% 12.94 21.53 28.89 10.63 110145 (2017) € 31,000 ac
Saint-Brieuc € 36.9 mln € 832 2.7% 11.81 18.97 10.98 9.79 44372 (2017) € 31,000 abc
Saint-Etienne € 102.9 mln € 596 2.4% 9.22 14.59 19.34 17.58 172565 (2017) € 25,000 ac
Saint-Nazaire € 46.1 mln € 658 2.1% 8.92 14.89 9.29 13.87 69993 (2017) € 31,000
Saint-Quentin € 51.6 mln € 959 3.1% 14.26 17.51 19.46 12.38 53816 (2017) € 31,000 ac
Strasbourg € 268.4 mln € 955 3.2% 14.37 20.54 21.66 17.91 280966 (2017) € 30,000 ac
Tarbes € 26.6 mln € 641 2.1% 8.91 14.31 13.02 10.66 41518 (2017) € 31,000 abc
Toulon € 168.4 mln € 979 3.2% 12.06 20.61 21.49 23.14 171953 (2017) € 31,000 ac
Toulouse € 392.7 mln € 819 2.2% 9.79 16.27 17.22 15.62 479553 (2017) € 37,000 ac
Tours € 89.1 mln € 656 2.4% 10.34 16.17 12.39 15.55 135787 (2017) € 27,000 ac
Troyes € 50.4 mln € 817 2.6% 11.82 17.54 14.37 15.13 61652 (2017) € 31,000 ac
Valence € 54.5 mln € 855 2.8% 11.39 19.10 15.77 19.89 63714 (2017) € 31,000 ac
Footnotes:
a) Average PM10 emissions from EEA have been adjusted for reported figures in Urban Audit data (Eurostat)
b) Average PM2.5 emissions have been imputed using an average factor of PM2.5/PM10
c) Average NO2 emissions from EEA have been adjusted for reported figures in Urban Audit data (Eurostat)
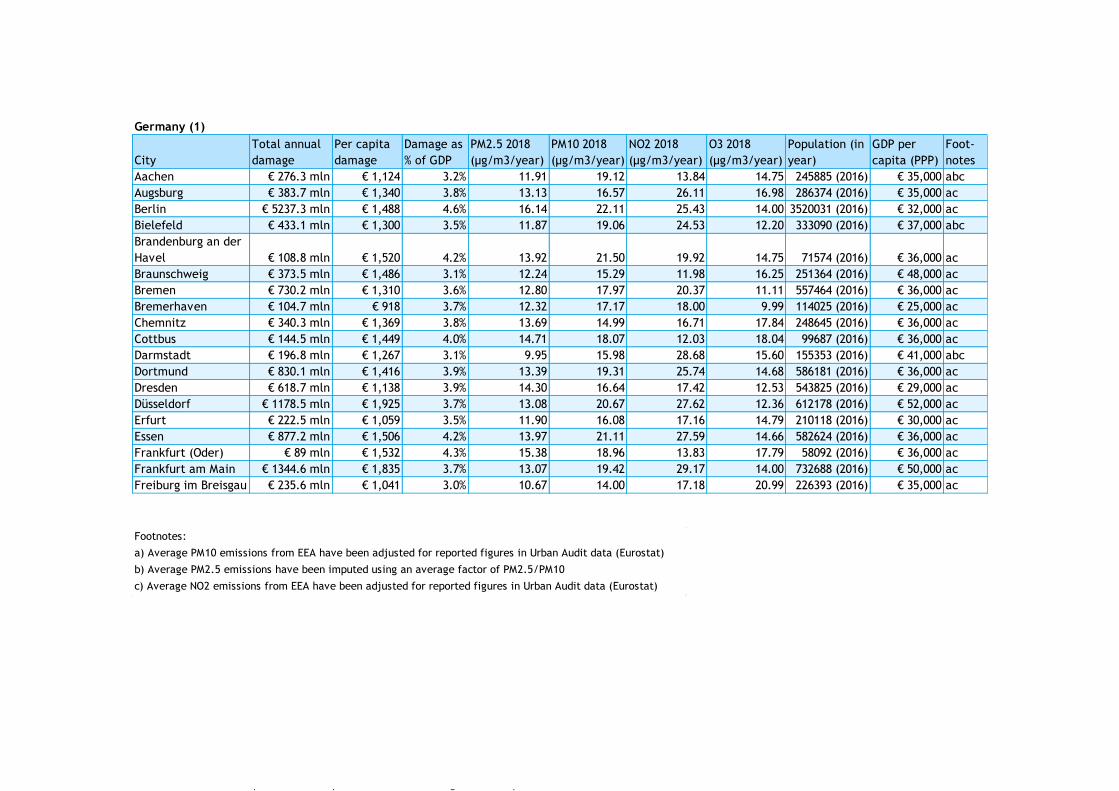
64 190272 - Health costs of air pollution in European cities and the linkage with transport – October 2020
Germany (1)
City
Total annual
damage
Per capita
damage
Damage as
% of GDP
PM2.5 2018
(μg/m3/year)
PM10 2018
(μg/m3/year)
NO2 2018
(μg/m3/year)
O3 2018
(μg/m3/year)
Population (in
year)
GDP per
capita (PPP)
Foot-
notes
Aachen € 276.3 mln € 1,124 3.2% 11.91 19.12 13.84 14.75 245885 (2016) € 35,000 abc
Augsburg € 383.7 mln € 1,340 3.8% 13.13 16.57 26.11 16.98 286374 (2016) € 35,000 ac
Berlin € 5237.3 mln € 1,488 4.6% 16.14 22.11 25.43 14.00 3520031 (2016) € 32,000 ac
Bielefeld € 433.1 mln € 1,300 3.5% 11.87 19.06 24.53 12.20 333090 (2016) € 37,000 abc
Brandenburg an der
Havel € 108.8 mln € 1,520 4.2% 13.92 21.50 19.92 14.75 71574 (2016) € 36,000 ac
Braunschweig € 373.5 mln € 1,486 3.1% 12.24 15.29 11.98 16.25 251364 (2016) € 48,000 ac
Bremen € 730.2 mln € 1,310 3.6% 12.80 17.97 20.37 11.11 557464 (2016) € 36,000 ac
Bremerhaven € 104.7 mln € 918 3.7% 12.32 17.17 18.00 9.99 114025 (2016) € 25,000 ac
Chemnitz € 340.3 mln € 1,369 3.8% 13.69 14.99 16.71 17.84 248645 (2016) € 36,000 ac
Cottbus € 144.5 mln € 1,449 4.0% 14.71 18.07 12.03 18.04 99687 (2016) € 36,000 ac
Darmstadt € 196.8 mln € 1,267 3.1% 9.95 15.98 28.68 15.60 155353 (2016) € 41,000 abc
Dortmund € 830.1 mln € 1,416 3.9% 13.39 19.31 25.74 14.68 586181 (2016) € 36,000 ac
Dresden € 618.7 mln € 1,138 3.9% 14.30 16.64 17.42 12.53 543825 (2016) € 29,000 ac
Düsseldorf € 1178.5 mln € 1,925 3.7% 13.08 20.67 27.62 12.36 612178 (2016) € 52,000 ac
Erfurt € 222.5 mln € 1,059 3.5% 11.90 16.08 17.16 14.79 210118 (2016) € 30,000 ac
Essen € 877.2 mln € 1,506 4.2% 13.97 21.11 27.59 14.66 582624 (2016) € 36,000 ac
Frankfurt (Oder) € 89 mln € 1,532 4.3% 15.38 18.96 13.83 17.79 58092 (2016) € 36,000 ac
Frankfurt am Main € 1344.6 mln € 1,835 3.7% 13.07 19.42 29.17 14.00 732688 (2016) € 50,000 ac
Freiburg im Breisgau € 235.6 mln € 1,041 3.0% 10.67 14.00 17.18 20.99 226393 (2016) € 35,000 ac
Footnotes:
a) Average PM10 emissions from EEA have been adjusted for reported figures in Urban Audit data (Eurostat)
b) Average PM2.5 emissions have been imputed using an average factor of PM2.5/PM10
c) Average NO2 emissions from EEA have been adjusted for reported figures in Urban Audit data (Eurostat)
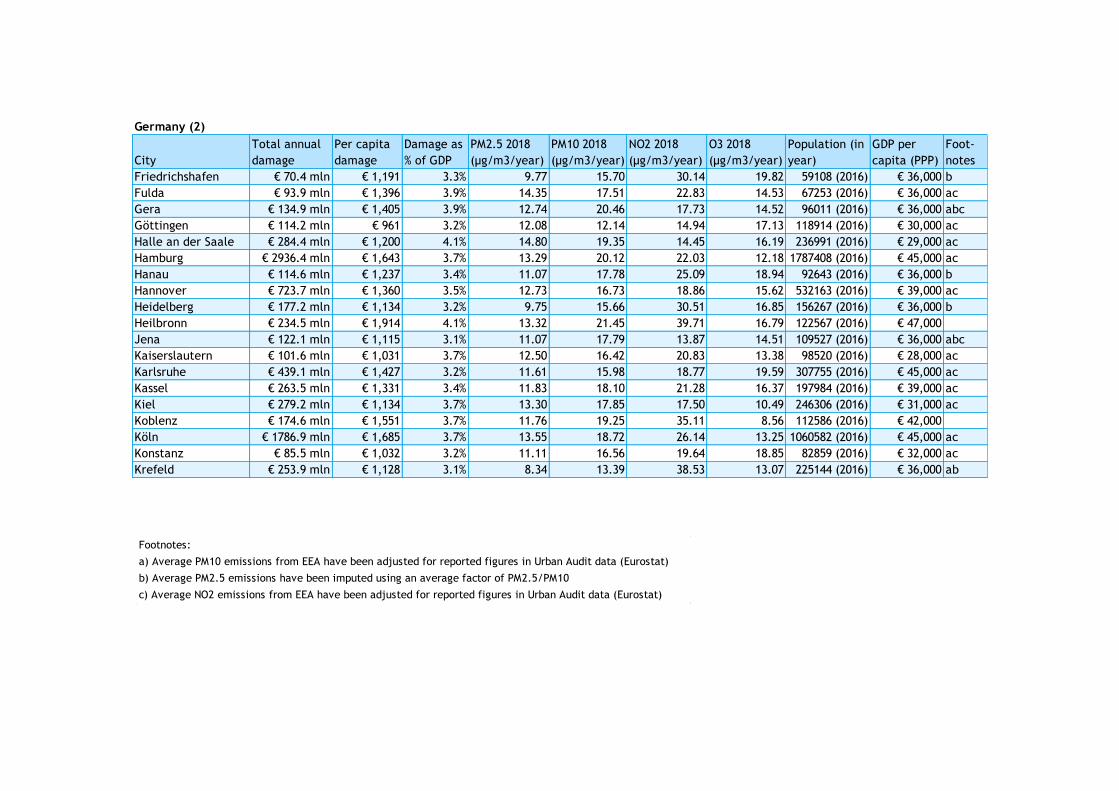
65 190272 - Health costs of air pollution in European cities and the linkage with transport – October 2020
Germany (2)
City
Total annual
damage
Per capita
damage
Damage as
% of GDP
PM2.5 2018
(μg/m3/year)
PM10 2018
(μg/m3/year)
NO2 2018
(μg/m3/year)
O3 2018
(μg/m3/year)
Population (in
year)
GDP per
capita (PPP)
Foot-
notes
Friedrichshafen € 70.4 mln € 1,191 3.3% 9.77 15.70 30.14 19.82 59108 (2016) € 36,000 b
Fulda € 93.9 mln € 1,396 3.9% 14.35 17.51 22.83 14.53 67253 (2016) € 36,000 ac
Gera € 134.9 mln € 1,405 3.9% 12.74 20.46 17.73 14.52 96011 (2016) € 36,000 abc
Göttingen € 114.2 mln € 961 3.2% 12.08 12.14 14.94 17.13 118914 (2016) € 30,000 ac
Halle an der Saale € 284.4 mln € 1,200 4.1% 14.80 19.35 14.45 16.19 236991 (2016) € 29,000 ac
Hamburg € 2936.4 mln € 1,643 3.7% 13.29 20.12 22.03 12.18 1787408 (2016) € 45,000 ac
Hanau € 114.6 mln € 1,237 3.4% 11.07 17.78 25.09 18.94 92643 (2016) € 36,000 b
Hannover € 723.7 mln € 1,360 3.5% 12.73 16.73 18.86 15.62 532163 (2016) € 39,000 ac
Heidelberg € 177.2 mln € 1,134 3.2% 9.75 15.66 30.51 16.85 156267 (2016) € 36,000 b
Heilbronn € 234.5 mln € 1,914 4.1% 13.32 21.45 39.71 16.79 122567 (2016) € 47,000
Jena € 122.1 mln € 1,115 3.1% 11.07 17.79 13.87 14.51 109527 (2016) € 36,000 abc
Kaiserslautern € 101.6 mln € 1,031 3.7% 12.50 16.42 20.83 13.38 98520 (2016) € 28,000 ac
Karlsruhe € 439.1 mln € 1,427 3.2% 11.61 15.98 18.77 19.59 307755 (2016) € 45,000 ac
Kassel € 263.5 mln € 1,331 3.4% 11.83 18.10 21.28 16.37 197984 (2016) € 39,000 ac
Kiel € 279.2 mln € 1,134 3.7% 13.30 17.85 17.50 10.49 246306 (2016) € 31,000 ac
Koblenz € 174.6 mln € 1,551 3.7% 11.76 19.25 35.11 8.56 112586 (2016) € 42,000
Köln € 1786.9 mln € 1,685 3.7% 13.55 18.72 26.14 13.25 1060582 (2016) € 45,000 ac
Konstanz € 85.5 mln € 1,032 3.2% 11.11 16.56 19.64 18.85 82859 (2016) € 32,000 ac
Krefeld € 253.9 mln € 1,128 3.1% 8.34 13.39 38.53 13.07 225144 (2016) € 36,000 ab
Footnotes:
a) Average PM10 emissions from EEA have been adjusted for reported figures in Urban Audit data (Eurostat)
b) Average PM2.5 emissions have been imputed using an average factor of PM2.5/PM10
c) Average NO2 emissions from EEA have been adjusted for reported figures in Urban Audit data (Eurostat)
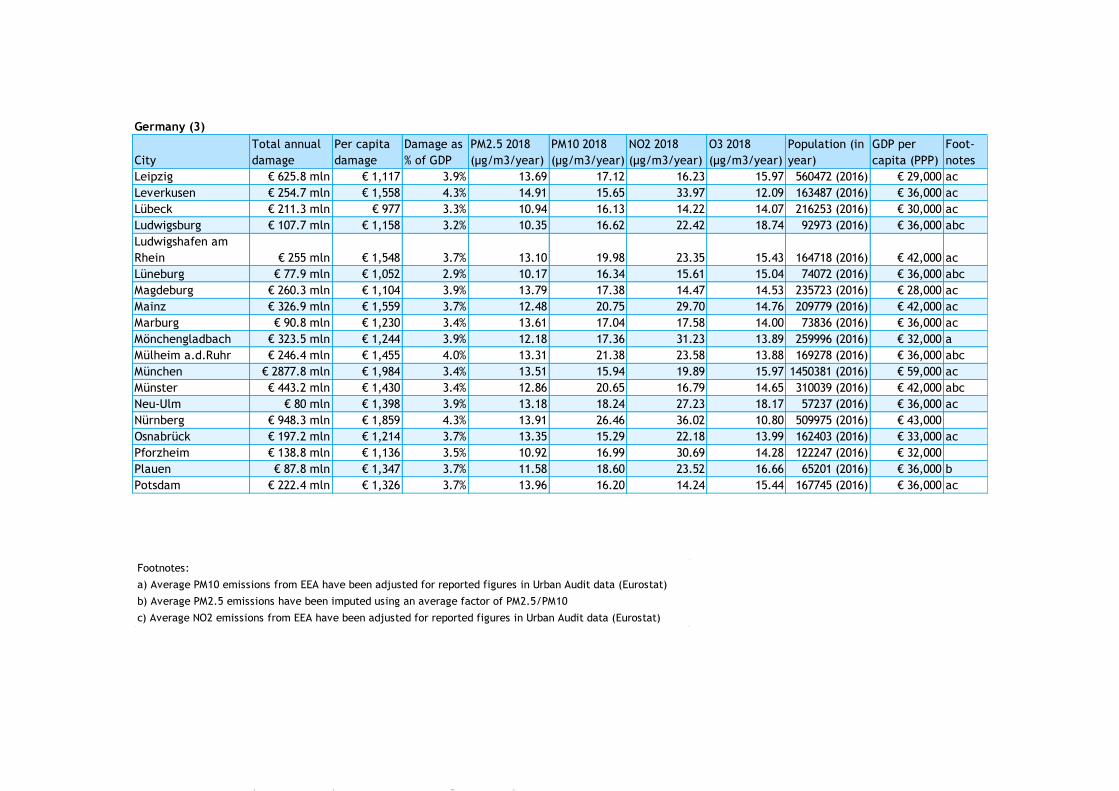
66 190272 - Health costs of air pollution in European cities and the linkage with transport – October 2020
Germany (3)
City
Total annual
damage
Per capita
damage
Damage as
% of GDP
PM2.5 2018
(μg/m3/year)
PM10 2018
(μg/m3/year)
NO2 2018
(μg/m3/year)
O3 2018
(μg/m3/year)
Population (in
year)
GDP per
capita (PPP)
Foot-
notes
Leipzig € 625.8 mln € 1,117 3.9% 13.69 17.12 16.23 15.97 560472 (2016) € 29,000 ac
Leverkusen € 254.7 mln € 1,558 4.3% 14.91 15.65 33.97 12.09 163487 (2016) € 36,000 ac
Lübeck € 211.3 mln € 977 3.3% 10.94 16.13 14.22 14.07 216253 (2016) € 30,000 ac
Ludwigsburg € 107.7 mln € 1,158 3.2% 10.35 16.62 22.42 18.74 92973 (2016) € 36,000 abc
Ludwigshafen am
Rhein € 255 mln € 1,548 3.7% 13.10 19.98 23.35 15.43 164718 (2016) € 42,000 ac
Lüneburg € 77.9 mln € 1,052 2.9% 10.17 16.34 15.61 15.04 74072 (2016) € 36,000 abc
Magdeburg € 260.3 mln € 1,104 3.9% 13.79 17.38 14.47 14.53 235723 (2016) € 28,000 ac
Mainz € 326.9 mln € 1,559 3.7% 12.48 20.75 29.70 14.76 209779 (2016) € 42,000 ac
Marburg € 90.8 mln € 1,230 3.4% 13.61 17.04 17.58 14.00 73836 (2016) € 36,000 ac
Mönchengladbach € 323.5 mln € 1,244 3.9% 12.18 17.36 31.23 13.89 259996 (2016) € 32,000 a
Mülheim a.d.Ruhr € 246.4 mln € 1,455 4.0% 13.31 21.38 23.58 13.88 169278 (2016) € 36,000 abc
München € 2877.8 mln € 1,984 3.4% 13.51 15.94 19.89 15.97 1450381 (2016) € 59,000 ac
Münster € 443.2 mln € 1,430 3.4% 12.86 20.65 16.79 14.65 310039 (2016) € 42,000 abc
Neu-Ulm € 80 mln € 1,398 3.9% 13.18 18.24 27.23 18.17 57237 (2016) € 36,000 ac
Nürnberg € 948.3 mln € 1,859 4.3% 13.91 26.46 36.02 10.80 509975 (2016) € 43,000
Osnabrück € 197.2 mln € 1,214 3.7% 13.35 15.29 22.18 13.99 162403 (2016) € 33,000 ac
Pforzheim € 138.8 mln € 1,136 3.5% 10.92 16.99 30.69 14.28 122247 (2016) € 32,000
Plauen € 87.8 mln € 1,347 3.7% 11.58 18.60 23.52 16.66 65201 (2016) € 36,000 b
Potsdam € 222.4 mln € 1,326 3.7% 13.96 16.20 14.24 15.44 167745 (2016) € 36,000 ac
Footnotes:
a) Average PM10 emissions from EEA have been adjusted for reported figures in Urban Audit data (Eurostat)
b) Average PM2.5 emissions have been imputed using an average factor of PM2.5/PM10
c) Average NO2 emissions from EEA have been adjusted for reported figures in Urban Audit data (Eurostat)

67 190272 - Health costs of air pollution in European cities and the linkage with transport – October 2020
Germany (4)
City
Total annual
damage
Per capita
damage
Damage as
% of GDP
PM2.5 2018
(μg/m3/year)
PM10 2018
(μg/m3/year)
NO2 2018
(μg/m3/year)
O3 2018
(μg/m3/year)
Population (in
year)
GDP per
capita (PPP)
Foot-
notes
Reutlingen € 149.4 mln € 1,307 3.4% 12.88 12.29 20.11 15.07 114310 (2016) € 38,000 ac
Rostock € 204.3 mln € 992 3.7% 13.09 15.93 13.21 7.34 206011 (2016) € 27,000 ac
Saarbrücken € 219.4 mln € 1,231 3.5% 11.90 16.16 22.94 11.23 178151 (2016) € 35,000 ac
Schweinfurt € 65.6 mln € 1,262 3.3% 10.97 17.61 21.27 13.45 51969 (2016) € 38,000 b
Solingen € 213.2 mln € 1,343 3.7% 11.87 19.06 27.30 16.87 158726 (2016) € 36,000 abc
Stuttgart € 1061.2 mln € 1,701 3.4% 12.57 15.56 25.00 17.50 623738 (2016) € 50,000 ac
Tübingen € 95.7 mln € 1,094 3.0% 11.11 16.14 19.05 17.96 87464 (2016) € 36,000 ac
Ulm € 164 mln € 1,337 3.3% 11.93 14.89 21.42 15.43 122636 (2016) € 41,000 ac
Villingen-
Schwenningen € 82.3 mln € 971 2.7% 8.85 14.21 14.32 22.60 84674 (2016) € 36,000 abc
Wetzlar € 61.3 mln € 1,188 3.8% 12.43 19.96 25.04 7.69 51649 (2016) € 31,000 b
Wiesbaden € 418.8 mln € 1,516 3.4% 11.93 16.65 26.53 14.58 276218 (2016) € 44,000 ac
Wolfsburg € 186.5 mln € 1,504 3.1% 11.35 18.23 15.28 15.90 124045 (2016) € 48,000 abc
Wuppertal € 447.6 mln € 1,279 3.7% 12.00 20.56 22.60 13.44 350046 (2016) € 35,000 ac
Würzburg € 165.4 mln € 1,325 3.7% 11.90 15.73 33.45 14.86 124873 (2016) € 36,000 a
Footnotes:
a) Average PM10 emissions from EEA have been adjusted for reported figures in Urban Audit data (Eurostat)
b) Average PM2.5 emissions have been imputed using an average factor of PM2.5/PM10
c) Average NO2 emissions from EEA have been adjusted for reported figures in Urban Audit data (Eurostat)
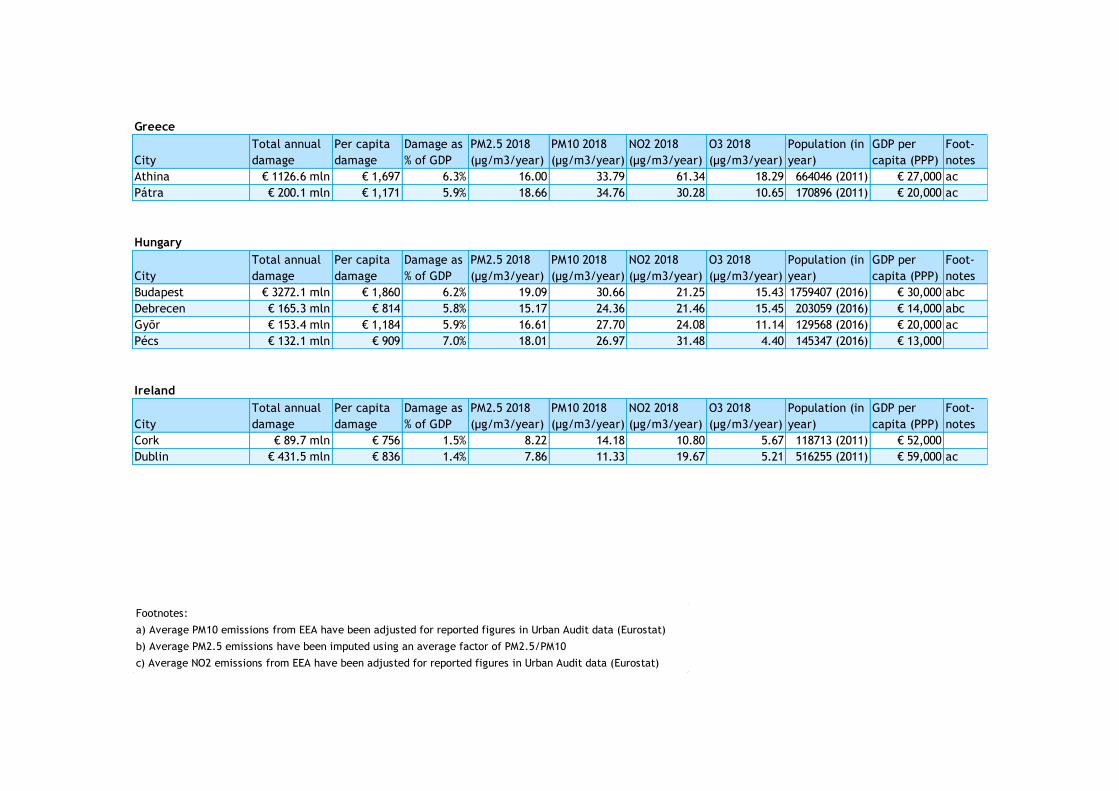
68 190272 - Health costs of air pollution in European cities and the linkage with transport – October 2020
Greece
City
Total annual
damage
Per capita
damage
Damage as
% of GDP
PM2.5 2018
(μg/m3/year)
PM10 2018
(μg/m3/year)
NO2 2018
(μg/m3/year)
O3 2018
(μg/m3/year)
Population (in
year)
GDP per
capita (PPP)
Foot-
notes
Athina € 1126.6 mln € 1,697 6.3% 16.00 33.79 61.34 18.29 664046 (2011) € 27,000 ac
Pátra € 200.1 mln € 1,171 5.9% 18.66 34.76 30.28 10.65 170896 (2011) € 20,000 ac
Hungary
City
Total annual
damage
Per capita
damage
Damage as
% of GDP
PM2.5 2018
(μg/m3/year)
PM10 2018
(μg/m3/year)
NO2 2018
(μg/m3/year)
O3 2018
(μg/m3/year)
Population (in
year)
GDP per
capita (PPP)
Foot-
notes
Budapest € 3272.1 mln € 1,860 6.2% 19.09 30.66 21.25 15.43 1759407 (2016) € 30,000 abc
Debrecen € 165.3 mln € 814 5.8% 15.17 24.36 21.46 15.45 203059 (2016) € 14,000 abc
Gyõr € 153.4 mln € 1,184 5.9% 16.61 27.70 24.08 11.14 129568 (2016) € 20,000 ac
Pécs € 132.1 mln € 909 7.0% 18.01 26.97 31.48 4.40 145347 (2016) € 13,000
Ireland
City
Total annual
damage
Per capita
damage
Damage as
% of GDP
PM2.5 2018
(μg/m3/year)
PM10 2018
(μg/m3/year)
NO2 2018
(μg/m3/year)
O3 2018
(μg/m3/year)
Population (in
year)
GDP per
capita (PPP)
Foot-
notes
Cork € 89.7 mln € 756 1.5% 8.22 14.18 10.80 5.67 118713 (2011) € 52,000
Dublin € 431.5 mln € 836 1.4% 7.86 11.33 19.67 5.21 516255 (2011) € 59,000 ac
Footnotes:
a) Average PM10 emissions from EEA have been adjusted for reported figures in Urban Audit data (Eurostat)
b) Average PM2.5 emissions have been imputed using an average factor of PM2.5/PM10
c) Average NO2 emissions from EEA have been adjusted for reported figures in Urban Audit data (Eurostat)
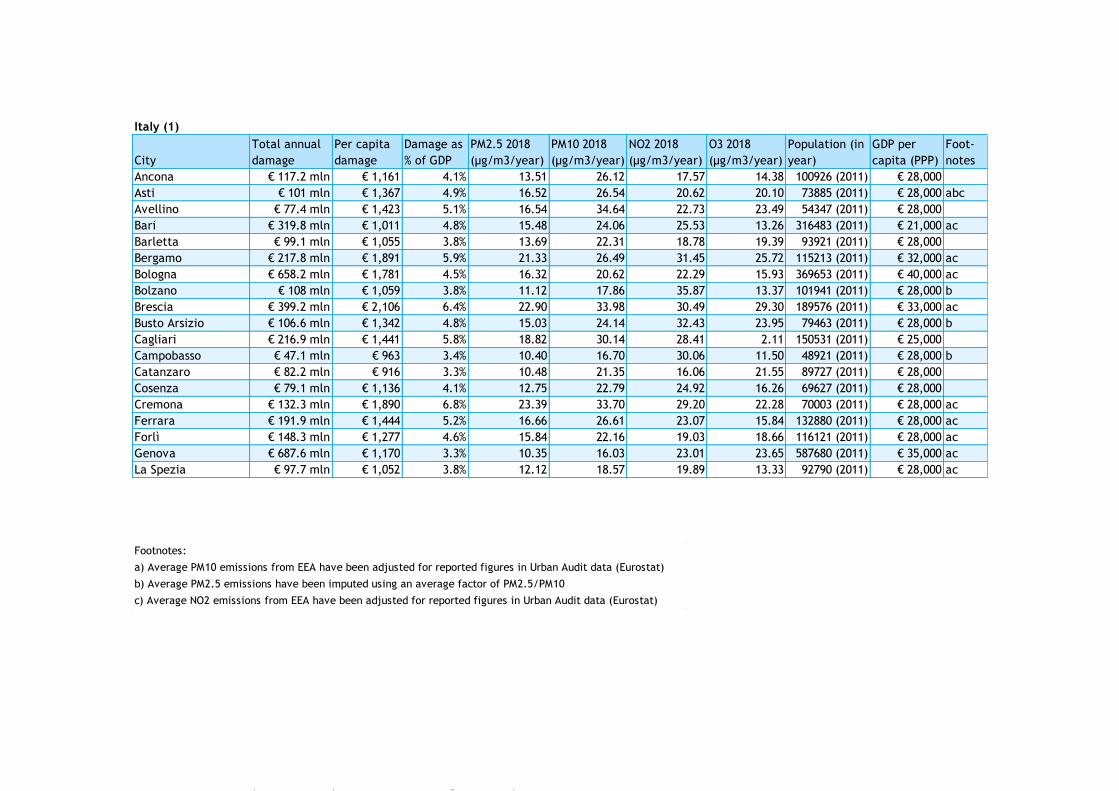
69 190272 - Health costs of air pollution in European cities and the linkage with transport – October 2020
Italy (1)
City
Total annual
damage
Per capita
damage
Damage as
% of GDP
PM2.5 2018
(μg/m3/year)
PM10 2018
(μg/m3/year)
NO2 2018
(μg/m3/year)
O3 2018
(μg/m3/year)
Population (in
year)
GDP per
capita (PPP)
Foot-
notes
Ancona € 117.2 mln € 1,161 4.1% 13.51 26.12 17.57 14.38 100926 (2011) € 28,000
Asti € 101 mln € 1,367 4.9% 16.52 26.54 20.62 20.10 73885 (2011) € 28,000 abc
Avellino € 77.4 mln € 1,423 5.1% 16.54 34.64 22.73 23.49 54347 (2011) € 28,000
Bari € 319.8 mln € 1,011 4.8% 15.48 24.06 25.53 13.26 316483 (2011) € 21,000 ac
Barletta € 99.1 mln € 1,055 3.8% 13.69 22.31 18.78 19.39 93921 (2011) € 28,000
Bergamo € 217.8 mln € 1,891 5.9% 21.33 26.49 31.45 25.72 115213 (2011) € 32,000 ac
Bologna € 658.2 mln € 1,781 4.5% 16.32 20.62 22.29 15.93 369653 (2011) € 40,000 ac
Bolzano € 108 mln € 1,059 3.8% 11.12 17.86 35.87 13.37 101941 (2011) € 28,000 b
Brescia € 399.2 mln € 2,106 6.4% 22.90 33.98 30.49 29.30 189576 (2011) € 33,000 ac
Busto Arsizio € 106.6 mln € 1,342 4.8% 15.03 24.14 32.43 23.95 79463 (2011) € 28,000 b
Cagliari € 216.9 mln € 1,441 5.8% 18.82 30.14 28.41 2.11 150531 (2011) € 25,000
Campobasso € 47.1 mln € 963 3.4% 10.40 16.70 30.06 11.50 48921 (2011) € 28,000 b
Catanzaro € 82.2 mln € 916 3.3% 10.48 21.35 16.06 21.55 89727 (2011) € 28,000
Cosenza € 79.1 mln € 1,136 4.1% 12.75 22.79 24.92 16.26 69627 (2011) € 28,000
Cremona € 132.3 mln € 1,890 6.8% 23.39 33.70 29.20 22.28 70003 (2011) € 28,000 ac
Ferrara € 191.9 mln € 1,444 5.2% 16.66 26.61 23.07 15.84 132880 (2011) € 28,000 ac
Forlì € 148.3 mln € 1,277 4.6% 15.84 22.16 19.03 18.66 116121 (2011) € 28,000 ac
Genova € 687.6 mln € 1,170 3.3% 10.35 16.03 23.01 23.65 587680 (2011) € 35,000 ac
La Spezia € 97.7 mln € 1,052 3.8% 12.12 18.57 19.89 13.33 92790 (2011) € 28,000 ac
Footnotes:
a) Average PM10 emissions from EEA have been adjusted for reported figures in Urban Audit data (Eurostat)
b) Average PM2.5 emissions have been imputed using an average factor of PM2.5/PM10
c) Average NO2 emissions from EEA have been adjusted for reported figures in Urban Audit data (Eurostat)
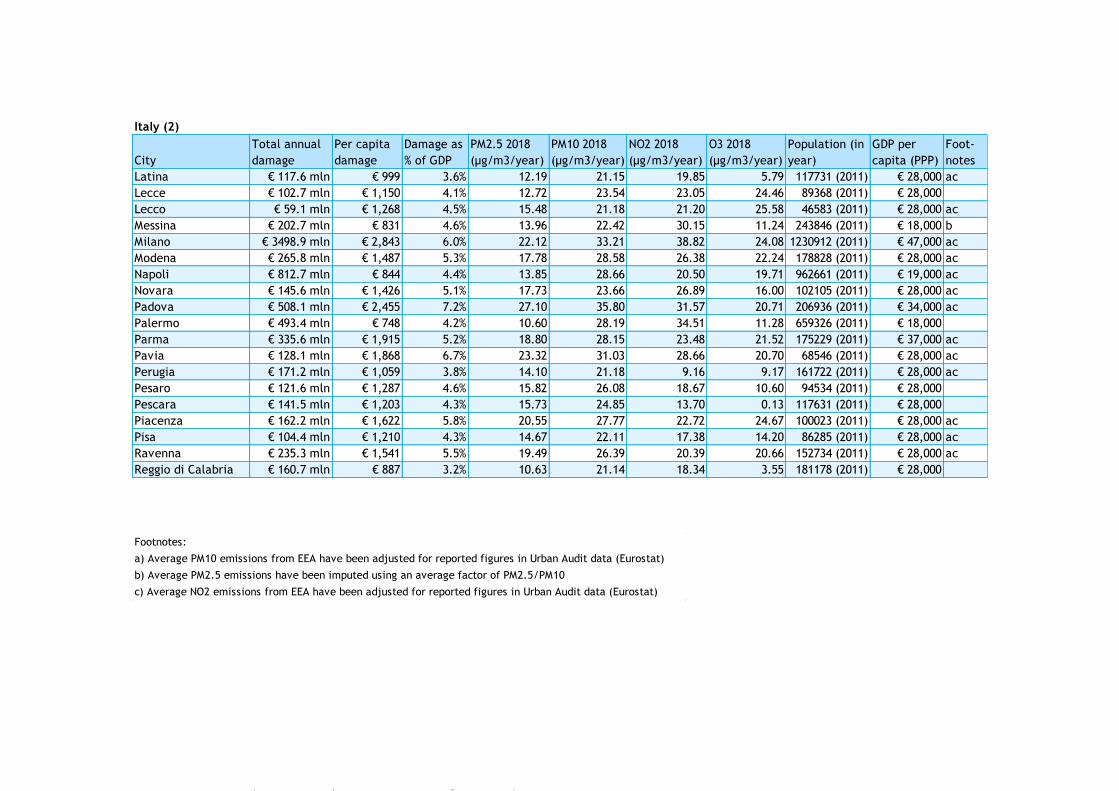
70 190272 - Health costs of air pollution in European cities and the linkage with transport – October 2020
Italy (2)
City
Total annual
damage
Per capita
damage
Damage as
% of GDP
PM2.5 2018
(μg/m3/year)
PM10 2018
(μg/m3/year)
NO2 2018
(μg/m3/year)
O3 2018
(μg/m3/year)
Population (in
year)
GDP per
capita (PPP)
Foot-
notes
Latina € 117.6 mln € 999 3.6% 12.19 21.15 19.85 5.79 117731 (2011) € 28,000 ac
Lecce € 102.7 mln € 1,150 4.1% 12.72 23.54 23.05 24.46 89368 (2011) € 28,000
Lecco € 59.1 mln € 1,268 4.5% 15.48 21.18 21.20 25.58 46583 (2011) € 28,000 ac
Messina € 202.7 mln € 831 4.6% 13.96 22.42 30.15 11.24 243846 (2011) € 18,000 b
Milano € 3498.9 mln € 2,843 6.0% 22.12 33.21 38.82 24.08 1230912 (2011) € 47,000 ac
Modena € 265.8 mln € 1,487 5.3% 17.78 28.58 26.38 22.24 178828 (2011) € 28,000 ac
Napoli € 812.7 mln € 844 4.4% 13.85 28.66 20.50 19.71 962661 (2011) € 19,000 ac
Novara € 145.6 mln € 1,426 5.1% 17.73 23.66 26.89 16.00 102105 (2011) € 28,000 ac
Padova € 508.1 mln € 2,455 7.2% 27.10 35.80 31.57 20.71 206936 (2011) € 34,000 ac
Palermo € 493.4 mln € 748 4.2% 10.60 28.19 34.51 11.28 659326 (2011) € 18,000
Parma € 335.6 mln € 1,915 5.2% 18.80 28.15 23.48 21.52 175229 (2011) € 37,000 ac
Pavia € 128.1 mln € 1,868 6.7% 23.32 31.03 28.66 20.70 68546 (2011) € 28,000 ac
Perugia € 171.2 mln € 1,059 3.8% 14.10 21.18 9.16 9.17 161722 (2011) € 28,000 ac
Pesaro € 121.6 mln € 1,287 4.6% 15.82 26.08 18.67 10.60 94534 (2011) € 28,000
Pescara € 141.5 mln € 1,203 4.3% 15.73 24.85 13.70 0.13 117631 (2011) € 28,000
Piacenza € 162.2 mln € 1,622 5.8% 20.55 27.77 22.72 24.67 100023 (2011) € 28,000 ac
Pisa € 104.4 mln € 1,210 4.3% 14.67 22.11 17.38 14.20 86285 (2011) € 28,000 ac
Ravenna € 235.3 mln € 1,541 5.5% 19.49 26.39 20.39 20.66 152734 (2011) € 28,000 ac
Reggio di Calabria € 160.7 mln € 887 3.2% 10.63 21.14 18.34 3.55 181178 (2011) € 28,000
Footnotes:
a) Average PM10 emissions from EEA have been adjusted for reported figures in Urban Audit data (Eurostat)
b) Average PM2.5 emissions have been imputed using an average factor of PM2.5/PM10
c) Average NO2 emissions from EEA have been adjusted for reported figures in Urban Audit data (Eurostat)
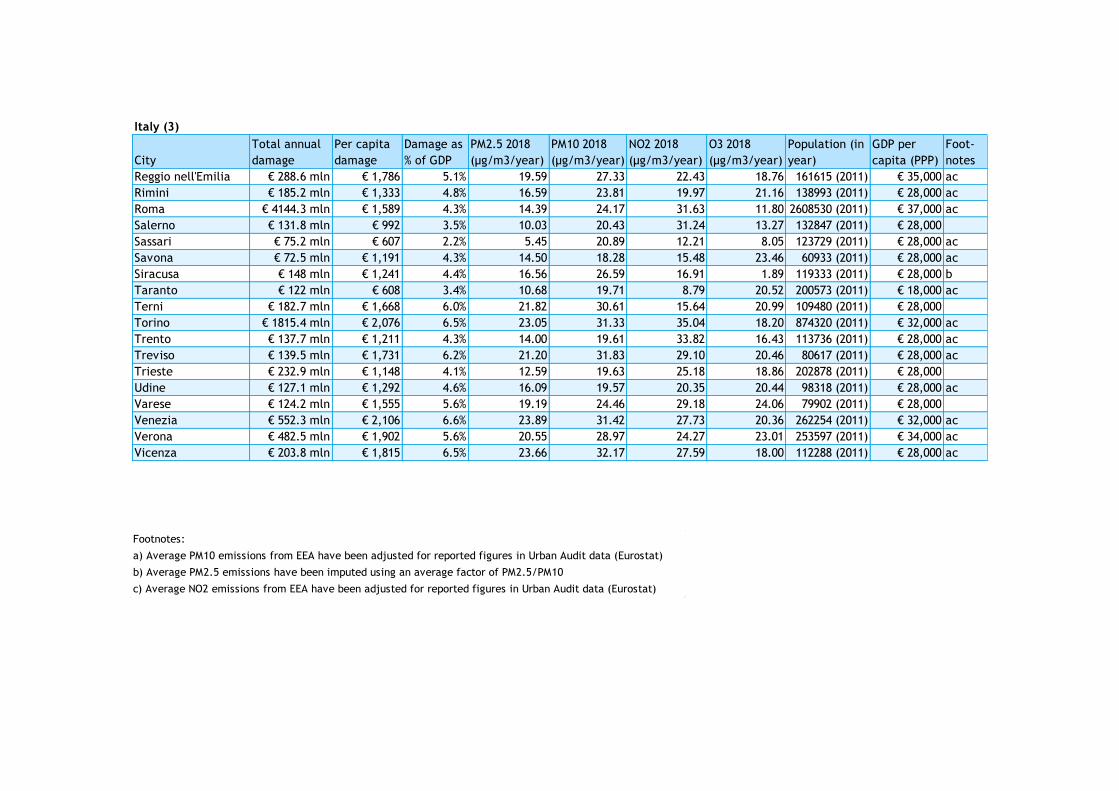
71 190272 - Health costs of air pollution in European cities and the linkage with transport – October 2020
Italy (3)
City
Total annual
damage
Per capita
damage
Damage as
% of GDP
PM2.5 2018
(μg/m3/year)
PM10 2018
(μg/m3/year)
NO2 2018
(μg/m3/year)
O3 2018
(μg/m3/year)
Population (in
year)
GDP per
capita (PPP)
Foot-
notes
Reggio nell'Emilia € 288.6 mln € 1,786 5.1% 19.59 27.33 22.43 18.76 161615 (2011) € 35,000 ac
Rimini € 185.2 mln € 1,333 4.8% 16.59 23.81 19.97 21.16 138993 (2011) € 28,000 ac
Roma € 4144.3 mln € 1,589 4.3% 14.39 24.17 31.63 11.80 2608530 (2011) € 37,000 ac
Salerno € 131.8 mln € 992 3.5% 10.03 20.43 31.24 13.27 132847 (2011) € 28,000
Sassari € 75.2 mln € 607 2.2% 5.45 20.89 12.21 8.05 123729 (2011) € 28,000 ac
Savona € 72.5 mln € 1,191 4.3% 14.50 18.28 15.48 23.46 60933 (2011) € 28,000 ac
Siracusa € 148 mln € 1,241 4.4% 16.56 26.59 16.91 1.89 119333 (2011) € 28,000 b
Taranto € 122 mln € 608 3.4% 10.68 19.71 8.79 20.52 200573 (2011) € 18,000 ac
Terni € 182.7 mln € 1,668 6.0% 21.82 30.61 15.64 20.99 109480 (2011) € 28,000
Torino € 1815.4 mln € 2,076 6.5% 23.05 31.33 35.04 18.20 874320 (2011) € 32,000 ac
Trento € 137.7 mln € 1,211 4.3% 14.00 19.61 33.82 16.43 113736 (2011) € 28,000 ac
Treviso € 139.5 mln € 1,731 6.2% 21.20 31.83 29.10 20.46 80617 (2011) € 28,000 ac
Trieste € 232.9 mln € 1,148 4.1% 12.59 19.63 25.18 18.86 202878 (2011) € 28,000
Udine € 127.1 mln € 1,292 4.6% 16.09 19.57 20.35 20.44 98318 (2011) € 28,000 ac
Varese € 124.2 mln € 1,555 5.6% 19.19 24.46 29.18 24.06 79902 (2011) € 28,000
Venezia € 552.3 mln € 2,106 6.6% 23.89 31.42 27.73 20.36 262254 (2011) € 32,000 ac
Verona € 482.5 mln € 1,902 5.6% 20.55 28.97 24.27 23.01 253597 (2011) € 34,000 ac
Vicenza € 203.8 mln € 1,815 6.5% 23.66 32.17 27.59 18.00 112288 (2011) € 28,000 ac
Footnotes:
a) Average PM10 emissions from EEA have been adjusted for reported figures in Urban Audit data (Eurostat)
b) Average PM2.5 emissions have been imputed using an average factor of PM2.5/PM10
c) Average NO2 emissions from EEA have been adjusted for reported figures in Urban Audit data (Eurostat)
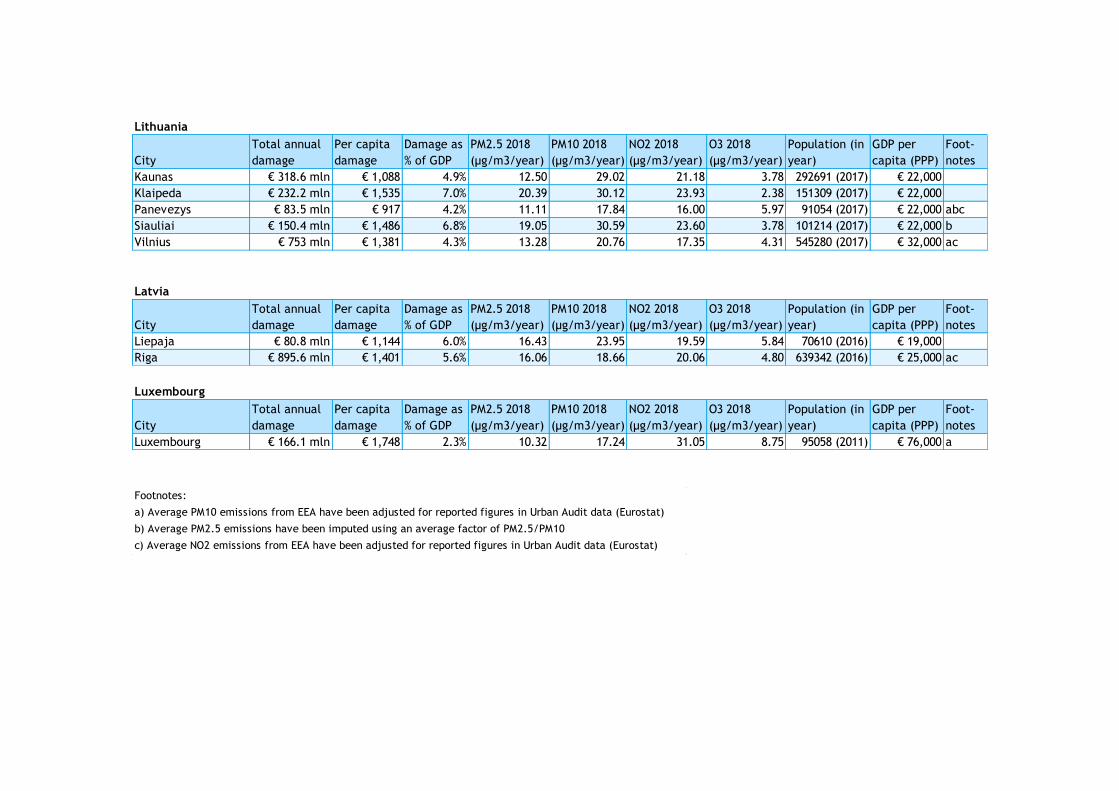
72 190272 - Health costs of air pollution in European cities and the linkage with transport – October 2020
Lithuania
City
Total annual
damage
Per capita
damage
Damage as
% of GDP
PM2.5 2018
(μg/m3/year)
PM10 2018
(μg/m3/year)
NO2 2018
(μg/m3/year)
O3 2018
(μg/m3/year)
Population (in
year)
GDP per
capita (PPP)
Foot-
notes
Kaunas € 318.6 mln € 1,088 4.9% 12.50 29.02 21.18 3.78 292691 (2017) € 22,000
Klaipeda € 232.2 mln € 1,535 7.0% 20.39 30.12 23.93 2.38 151309 (2017) € 22,000
Panevezys € 83.5 mln € 917 4.2% 11.11 17.84 16.00 5.97 91054 (2017) € 22,000 abc
Siauliai € 150.4 mln € 1,486 6.8% 19.05 30.59 23.60 3.78 101214 (2017) € 22,000 b
Vilnius € 753 mln € 1,381 4.3% 13.28 20.76 17.35 4.31 545280 (2017) € 32,000 ac
Latvia
City
Total annual
damage
Per capita
damage
Damage as
% of GDP
PM2.5 2018
(μg/m3/year)
PM10 2018
(μg/m3/year)
NO2 2018
(μg/m3/year)
O3 2018
(μg/m3/year)
Population (in
year)
GDP per
capita (PPP)
Foot-
notes
Liepaja € 80.8 mln € 1,144 6.0% 16.43 23.95 19.59 5.84 70610 (2016) € 19,000
Riga € 895.6 mln € 1,401 5.6% 16.06 18.66 20.06 4.80 639342 (2016) € 25,000 ac
Luxembourg
City
Total annual
damage
Per capita
damage
Damage as
% of GDP
PM2.5 2018
(μg/m3/year)
PM10 2018
(μg/m3/year)
NO2 2018
(μg/m3/year)
O3 2018
(μg/m3/year)
Population (in
year)
GDP per
capita (PPP)
Foot-
notes
Luxembourg € 166.1 mln € 1,748 2.3% 10.32 17.24 31.05 8.75 95058 (2011) € 76,000 a
Footnotes:
a) Average PM10 emissions from EEA have been adjusted for reported figures in Urban Audit data (Eurostat)
b) Average PM2.5 emissions have been imputed using an average factor of PM2.5/PM10
c) Average NO2 emissions from EEA have been adjusted for reported figures in Urban Audit data (Eurostat)
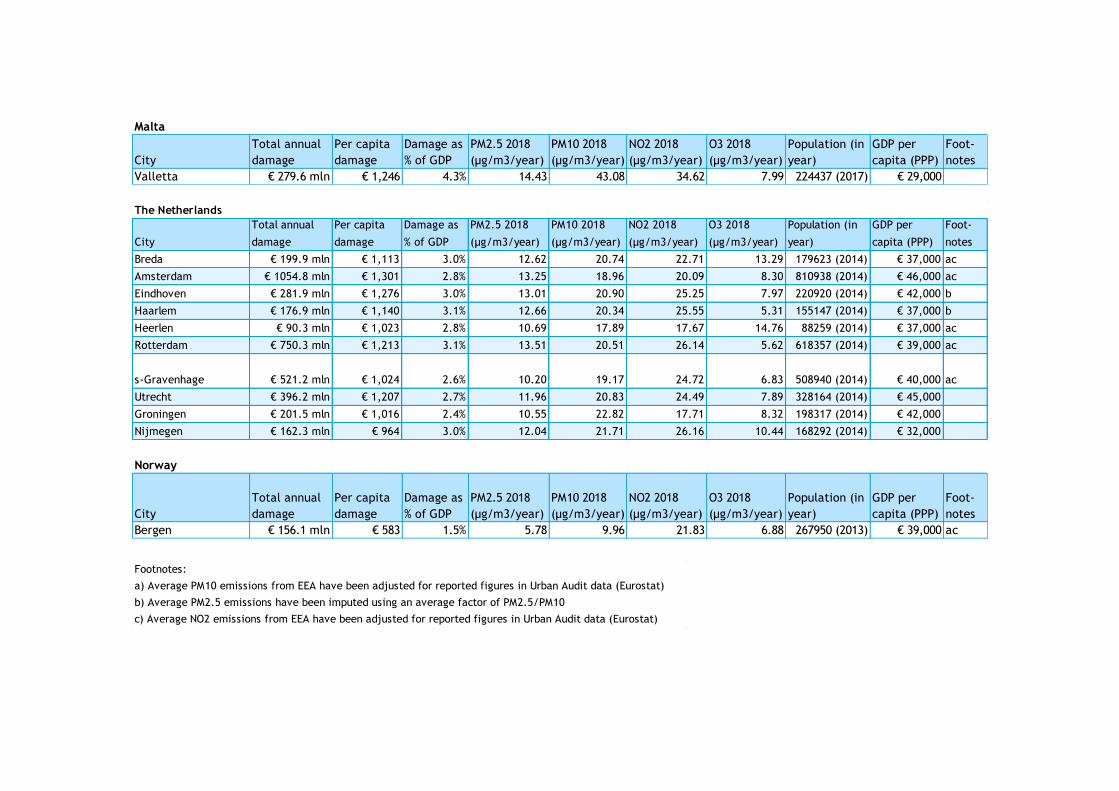
73 190272 - Health costs of air pollution in European cities and the linkage with transport – October 2020
Malta
City
Total annual
damage
Per capita
damage
Damage as
% of GDP
PM2.5 2018
(μg/m3/year)
PM10 2018
(μg/m3/year)
NO2 2018
(μg/m3/year)
O3 2018
(μg/m3/year)
Population (in
year)
GDP per
capita (PPP)
Foot-
notes
Valletta € 279.6 mln € 1,246 4.3% 14.43 43.08 34.62 7.99 224437 (2017) € 29,000
The Netherlands
City
Total annual
damage
Per capita
damage
Damage as
% of GDP
PM2.5 2018
(μg/m3/year)
PM10 2018
(μg/m3/year)
NO2 2018
(μg/m3/year)
O3 2018
(μg/m3/year)
Population (in
year)
GDP per
capita (PPP)
Foot-
notes
Breda € 199.9 mln € 1,113 3.0% 12.62 20.74 22.71 13.29 179623 (2014) € 37,000 ac
Amsterdam € 1054.8 mln € 1,301 2.8% 13.25 18.96 20.09 8.30 810938 (2014) € 46,000 ac
Eindhoven € 281.9 mln € 1,276 3.0% 13.01 20.90 25.25 7.97 220920 (2014) € 42,000 b
Haarlem € 176.9 mln € 1,140 3.1% 12.66 20.34 25.55 5.31 155147 (2014) € 37,000 b
Heerlen € 90.3 mln € 1,023 2.8% 10.69 17.89 17.67 14.76 88259 (2014) € 37,000 ac
Rotterdam € 750.3 mln € 1,213 3.1% 13.51 20.51 26.14 5.62 618357 (2014) € 39,000 ac
s-Gravenhage € 521.2 mln € 1,024 2.6% 10.20 19.17 24.72 6.83 508940 (2014) € 40,000 ac
Utrecht € 396.2 mln € 1,207 2.7% 11.96 20.83 24.49 7.89 328164 (2014) € 45,000
Groningen € 201.5 mln € 1,016 2.4% 10.55 22.82 17.71 8.32 198317 (2014) € 42,000
Nijmegen € 162.3 mln € 964 3.0% 12.04 21.71 26.16 10.44 168292 (2014) € 32,000
Norway
City
Total annual
damage
Per capita
damage
Damage as
% of GDP
PM2.5 2018
(μg/m3/year)
PM10 2018
(μg/m3/year)
NO2 2018
(μg/m3/year)
O3 2018
(μg/m3/year)
Population (in
year)
GDP per
capita (PPP)
Foot-
notes
Bergen € 156.1 mln € 583 1.5% 5.78 9.96 21.83 6.88 267950 (2013) € 39,000 ac
Footnotes:
a) Average PM10 emissions from EEA have been adjusted for reported figures in Urban Audit data (Eurostat)
b) Average PM2.5 emissions have been imputed using an average factor of PM2.5/PM10
c) Average NO2 emissions from EEA have been adjusted for reported figures in Urban Audit data (Eurostat)
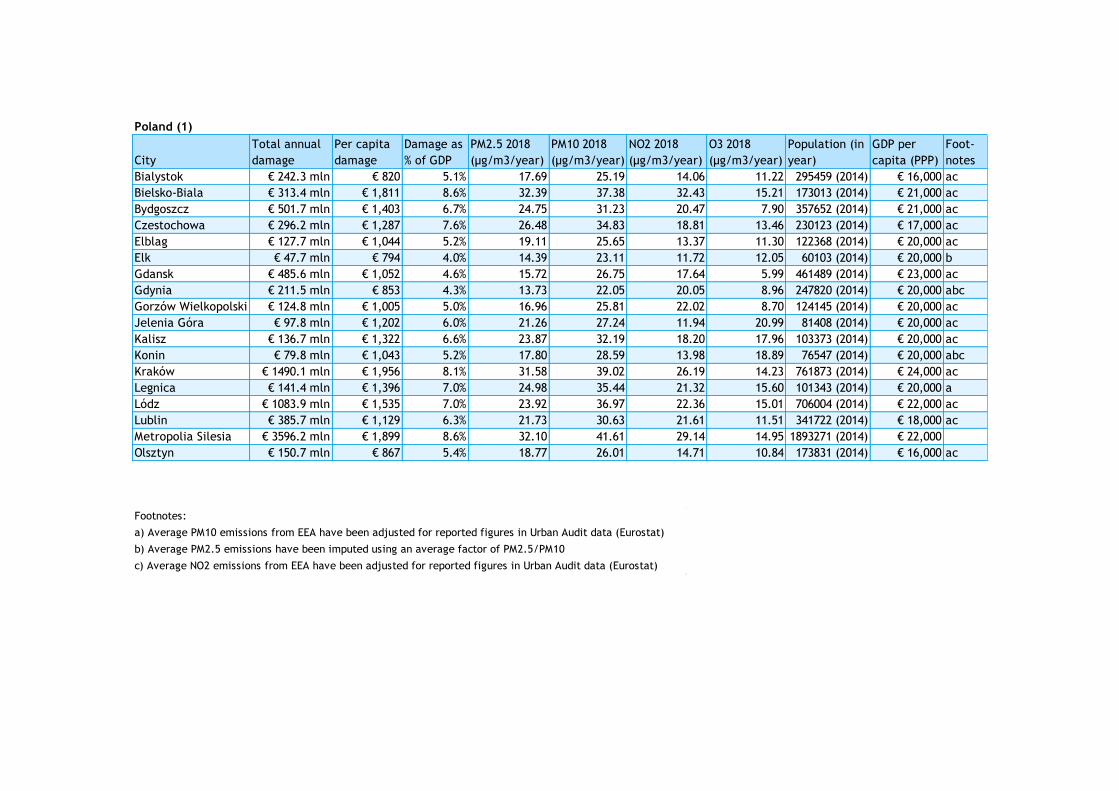
74 190272 - Health costs of air pollution in European cities and the linkage with transport – October 2020
Poland (1)
City
Total annual
damage
Per capita
damage
Damage as
% of GDP
PM2.5 2018
(μg/m3/year)
PM10 2018
(μg/m3/year)
NO2 2018
(μg/m3/year)
O3 2018
(μg/m3/year)
Population (in
year)
GDP per
capita (PPP)
Foot-
notes
Bialystok € 242.3 mln € 820 5.1% 17.69 25.19 14.06 11.22 295459 (2014) € 16,000 ac
Bielsko-Biala € 313.4 mln € 1,811 8.6% 32.39 37.38 32.43 15.21 173013 (2014) € 21,000 ac
Bydgoszcz € 501.7 mln € 1,403 6.7% 24.75 31.23 20.47 7.90 357652 (2014) € 21,000 ac
Czestochowa € 296.2 mln € 1,287 7.6% 26.48 34.83 18.81 13.46 230123 (2014) € 17,000 ac
Elblag € 127.7 mln € 1,044 5.2% 19.11 25.65 13.37 11.30 122368 (2014) € 20,000 ac
Elk € 47.7 mln € 794 4.0% 14.39 23.11 11.72 12.05 60103 (2014) € 20,000 b
Gdansk € 485.6 mln € 1,052 4.6% 15.72 26.75 17.64 5.99 461489 (2014) € 23,000 ac
Gdynia € 211.5 mln € 853 4.3% 13.73 22.05 20.05 8.96 247820 (2014) € 20,000 abc
Gorzów Wielkopolski € 124.8 mln € 1,005 5.0% 16.96 25.81 22.02 8.70 124145 (2014) € 20,000 ac
Jelenia Góra € 97.8 mln € 1,202 6.0% 21.26 27.24 11.94 20.99 81408 (2014) € 20,000 ac
Kalisz € 136.7 mln € 1,322 6.6% 23.87 32.19 18.20 17.96 103373 (2014) € 20,000 ac
Konin € 79.8 mln € 1,043 5.2% 17.80 28.59 13.98 18.89 76547 (2014) € 20,000 abc
Kraków € 1490.1 mln € 1,956 8.1% 31.58 39.02 26.19 14.23 761873 (2014) € 24,000 ac
Legnica € 141.4 mln € 1,396 7.0% 24.98 35.44 21.32 15.60 101343 (2014) € 20,000 a
Lódz € 1083.9 mln € 1,535 7.0% 23.92 36.97 22.36 15.01 706004 (2014) € 22,000 ac
Lublin € 385.7 mln € 1,129 6.3% 21.73 30.63 21.61 11.51 341722 (2014) € 18,000 ac
Metropolia Silesia € 3596.2 mln € 1,899 8.6% 32.10 41.61 29.14 14.95 1893271 (2014) € 22,000
Olsztyn € 150.7 mln € 867 5.4% 18.77 26.01 14.71 10.84 173831 (2014) € 16,000 ac
Footnotes:
a) Average PM10 emissions from EEA have been adjusted for reported figures in Urban Audit data (Eurostat)
b) Average PM2.5 emissions have been imputed using an average factor of PM2.5/PM10
c) Average NO2 emissions from EEA have been adjusted for reported figures in Urban Audit data (Eurostat)
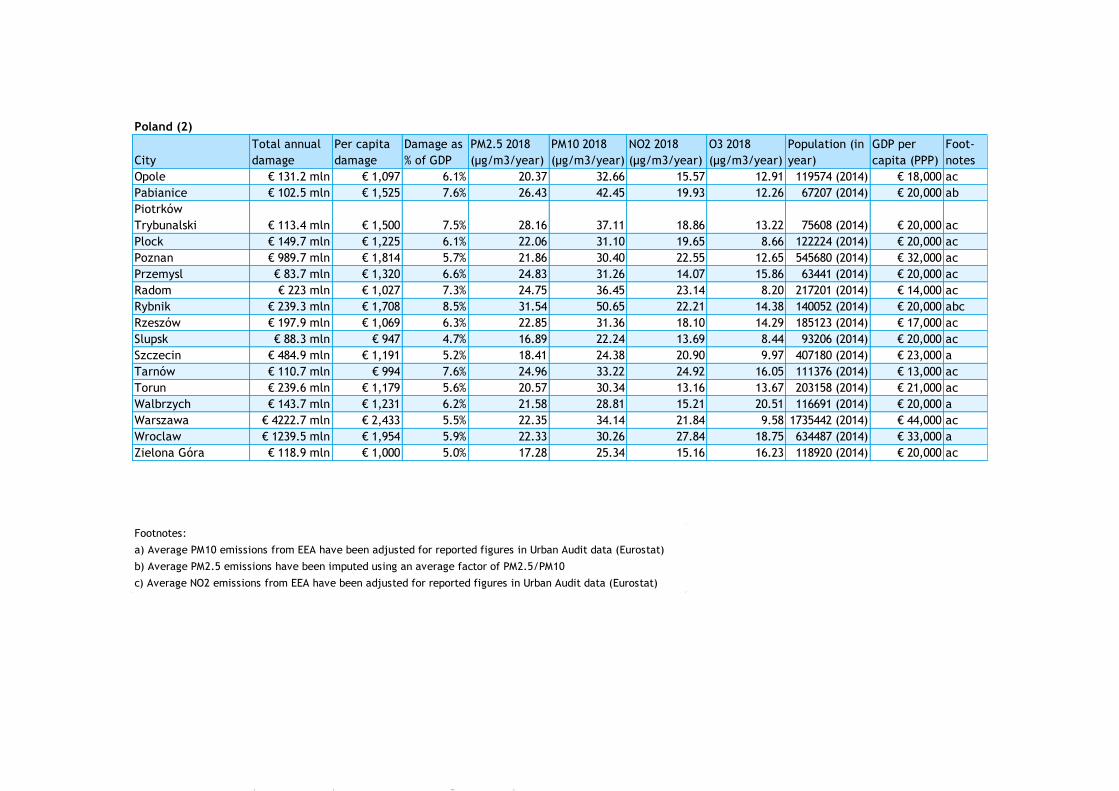
75 190272 - Health costs of air pollution in European cities and the linkage with transport – October 2020
Poland (2)
City
Total annual
damage
Per capita
damage
Damage as
% of GDP
PM2.5 2018
(μg/m3/year)
PM10 2018
(μg/m3/year)
NO2 2018
(μg/m3/year)
O3 2018
(μg/m3/year)
Population (in
year)
GDP per
capita (PPP)
Foot-
notes
Opole € 131.2 mln € 1,097 6.1% 20.37 32.66 15.57 12.91 119574 (2014) € 18,000 ac
Pabianice € 102.5 mln € 1,525 7.6% 26.43 42.45 19.93 12.26 67207 (2014) € 20,000 ab
Piotrków
Trybunalski € 113.4 mln € 1,500 7.5% 28.16 37.11 18.86 13.22 75608 (2014) € 20,000 ac
Plock € 149.7 mln € 1,225 6.1% 22.06 31.10 19.65 8.66 122224 (2014) € 20,000 ac
Poznan € 989.7 mln € 1,814 5.7% 21.86 30.40 22.55 12.65 545680 (2014) € 32,000 ac
Przemysl € 83.7 mln € 1,320 6.6% 24.83 31.26 14.07 15.86 63441 (2014) € 20,000 ac
Radom € 223 mln € 1,027 7.3% 24.75 36.45 23.14 8.20 217201 (2014) € 14,000 ac
Rybnik € 239.3 mln € 1,708 8.5% 31.54 50.65 22.21 14.38 140052 (2014) € 20,000 abc
Rzeszów € 197.9 mln € 1,069 6.3% 22.85 31.36 18.10 14.29 185123 (2014) € 17,000 ac
Slupsk € 88.3 mln € 947 4.7% 16.89 22.24 13.69 8.44 93206 (2014) € 20,000 ac
Szczecin € 484.9 mln € 1,191 5.2% 18.41 24.38 20.90 9.97 407180 (2014) € 23,000 a
Tarnów € 110.7 mln € 994 7.6% 24.96 33.22 24.92 16.05 111376 (2014) € 13,000 ac
Torun € 239.6 mln € 1,179 5.6% 20.57 30.34 13.16 13.67 203158 (2014) € 21,000 ac
Walbrzych € 143.7 mln € 1,231 6.2% 21.58 28.81 15.21 20.51 116691 (2014) € 20,000 a
Warszawa € 4222.7 mln € 2,433 5.5% 22.35 34.14 21.84 9.58 1735442 (2014) € 44,000 ac
Wroclaw € 1239.5 mln € 1,954 5.9% 22.33 30.26 27.84 18.75 634487 (2014) € 33,000 a
Zielona Góra € 118.9 mln € 1,000 5.0% 17.28 25.34 15.16 16.23 118920 (2014) € 20,000 ac
Footnotes:
a) Average PM10 emissions from EEA have been adjusted for reported figures in Urban Audit data (Eurostat)
b) Average PM2.5 emissions have been imputed using an average factor of PM2.5/PM10
c) Average NO2 emissions from EEA have been adjusted for reported figures in Urban Audit data (Eurostat)
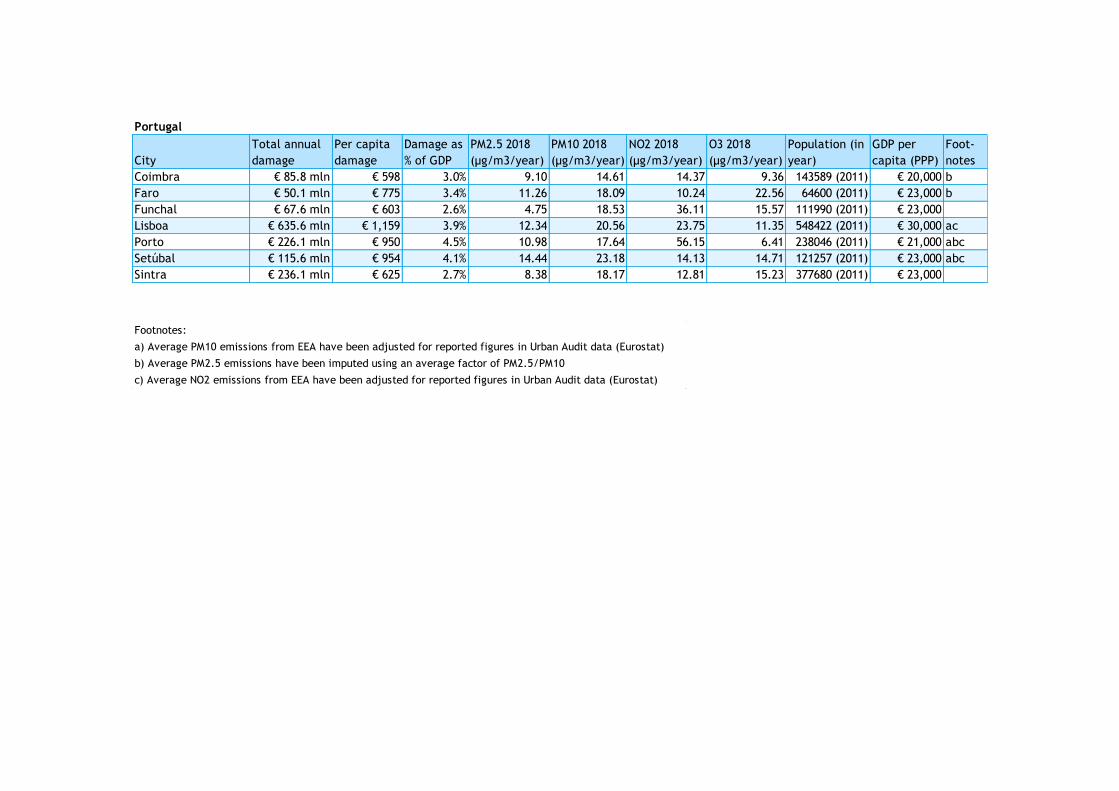
76 190272 - Health costs of air pollution in European cities and the linkage with transport – October 2020
Portugal
City
Total annual
damage
Per capita
damage
Damage as
% of GDP
PM2.5 2018
(μg/m3/year)
PM10 2018
(μg/m3/year)
NO2 2018
(μg/m3/year)
O3 2018
(μg/m3/year)
Population (in
year)
GDP per
capita (PPP)
Foot-
notes
Coimbra € 85.8 mln € 598 3.0% 9.10 14.61 14.37 9.36 143589 (2011) € 20,000 b
Faro € 50.1 mln € 775 3.4% 11.26 18.09 10.24 22.56 64600 (2011) € 23,000 b
Funchal € 67.6 mln € 603 2.6% 4.75 18.53 36.11 15.57 111990 (2011) € 23,000
Lisboa € 635.6 mln € 1,159 3.9% 12.34 20.56 23.75 11.35 548422 (2011) € 30,000 ac
Porto € 226.1 mln € 950 4.5% 10.98 17.64 56.15 6.41 238046 (2011) € 21,000 abc
Setúbal € 115.6 mln € 954 4.1% 14.44 23.18 14.13 14.71 121257 (2011) € 23,000 abc
Sintra € 236.1 mln € 625 2.7% 8.38 18.17 12.81 15.23 377680 (2011) € 23,000
Footnotes:
a) Average PM10 emissions from EEA have been adjusted for reported figures in Urban Audit data (Eurostat)
b) Average PM2.5 emissions have been imputed using an average factor of PM2.5/PM10
c) Average NO2 emissions from EEA have been adjusted for reported figures in Urban Audit data (Eurostat)
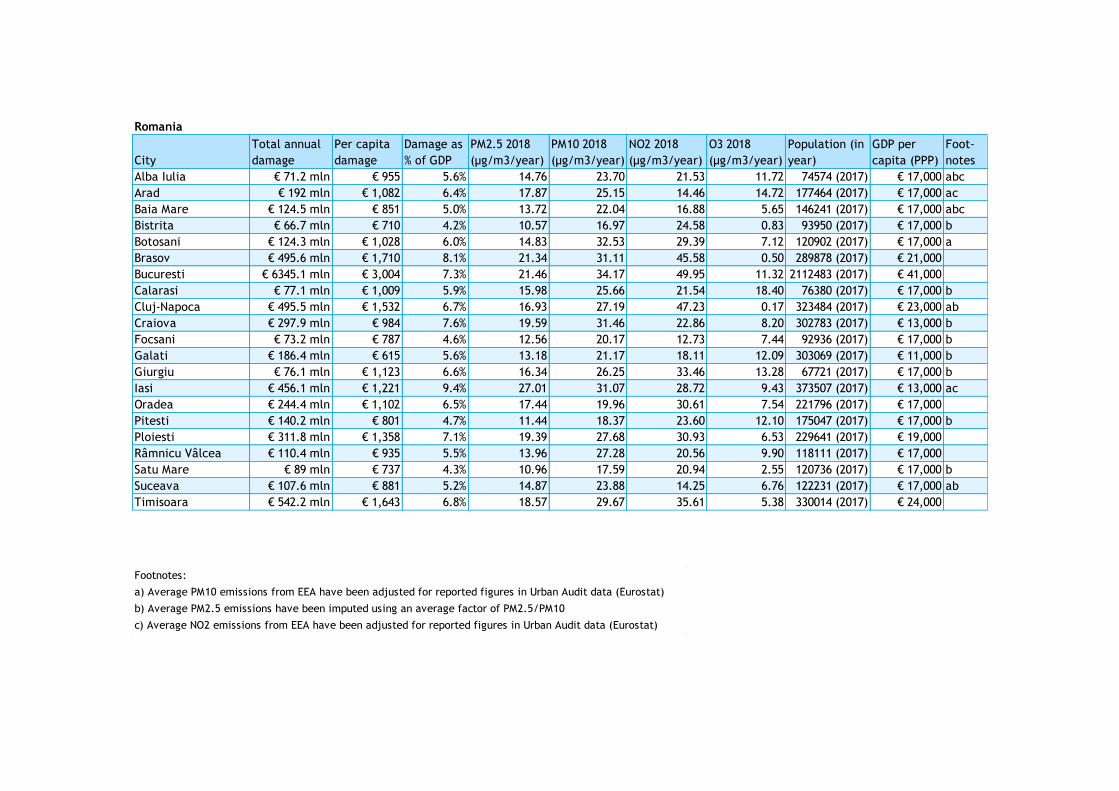
77 190272 - Health costs of air pollution in European cities and the linkage with transport – October 2020
Romania
City
Total annual
damage
Per capita
damage
Damage as
% of GDP
PM2.5 2018
(μg/m3/year)
PM10 2018
(μg/m3/year)
NO2 2018
(μg/m3/year)
O3 2018
(μg/m3/year)
Population (in
year)
GDP per
capita (PPP)
Foot-
notes
Alba Iulia € 71.2 mln € 955 5.6% 14.76 23.70 21.53 11.72 74574 (2017) € 17,000 abc
Arad € 192 mln € 1,082 6.4% 17.87 25.15 14.46 14.72 177464 (2017) € 17,000 ac
Baia Mare € 124.5 mln € 851 5.0% 13.72 22.04 16.88 5.65 146241 (2017) € 17,000 abc
Bistrita € 66.7 mln € 710 4.2% 10.57 16.97 24.58 0.83 93950 (2017) € 17,000 b
Botosani € 124.3 mln € 1,028 6.0% 14.83 32.53 29.39 7.12 120902 (2017) € 17,000 a
Brasov € 495.6 mln € 1,710 8.1% 21.34 31.11 45.58 0.50 289878 (2017) € 21,000
Bucuresti € 6345.1 mln € 3,004 7.3% 21.46 34.17 49.95 11.32 2112483 (2017) € 41,000
Calarasi € 77.1 mln € 1,009 5.9% 15.98 25.66 21.54 18.40 76380 (2017) € 17,000 b
Cluj-Napoca € 495.5 mln € 1,532 6.7% 16.93 27.19 47.23 0.17 323484 (2017) € 23,000 ab
Craiova € 297.9 mln € 984 7.6% 19.59 31.46 22.86 8.20 302783 (2017) € 13,000 b
Focsani € 73.2 mln € 787 4.6% 12.56 20.17 12.73 7.44 92936 (2017) € 17,000 b
Galati € 186.4 mln € 615 5.6% 13.18 21.17 18.11 12.09 303069 (2017) € 11,000 b
Giurgiu € 76.1 mln € 1,123 6.6% 16.34 26.25 33.46 13.28 67721 (2017) € 17,000 b
Iasi € 456.1 mln € 1,221 9.4% 27.01 31.07 28.72 9.43 373507 (2017) € 13,000 ac
Oradea € 244.4 mln € 1,102 6.5% 17.44 19.96 30.61 7.54 221796 (2017) € 17,000
Pitesti € 140.2 mln € 801 4.7% 11.44 18.37 23.60 12.10 175047 (2017) € 17,000 b
Ploiesti € 311.8 mln € 1,358 7.1% 19.39 27.68 30.93 6.53 229641 (2017) € 19,000
Râmnicu Vâlcea € 110.4 mln € 935 5.5% 13.96 27.28 20.56 9.90 118111 (2017) € 17,000
Satu Mare € 89 mln € 737 4.3% 10.96 17.59 20.94 2.55 120736 (2017) € 17,000 b
Suceava € 107.6 mln € 881 5.2% 14.87 23.88 14.25 6.76 122231 (2017) € 17,000 ab
Timisoara € 542.2 mln € 1,643 6.8% 18.57 29.67 35.61 5.38 330014 (2017) € 24,000
Footnotes:
a) Average PM10 emissions from EEA have been adjusted for reported figures in Urban Audit data (Eurostat)
b) Average PM2.5 emissions have been imputed using an average factor of PM2.5/PM10
c) Average NO2 emissions from EEA have been adjusted for reported figures in Urban Audit data (Eurostat)
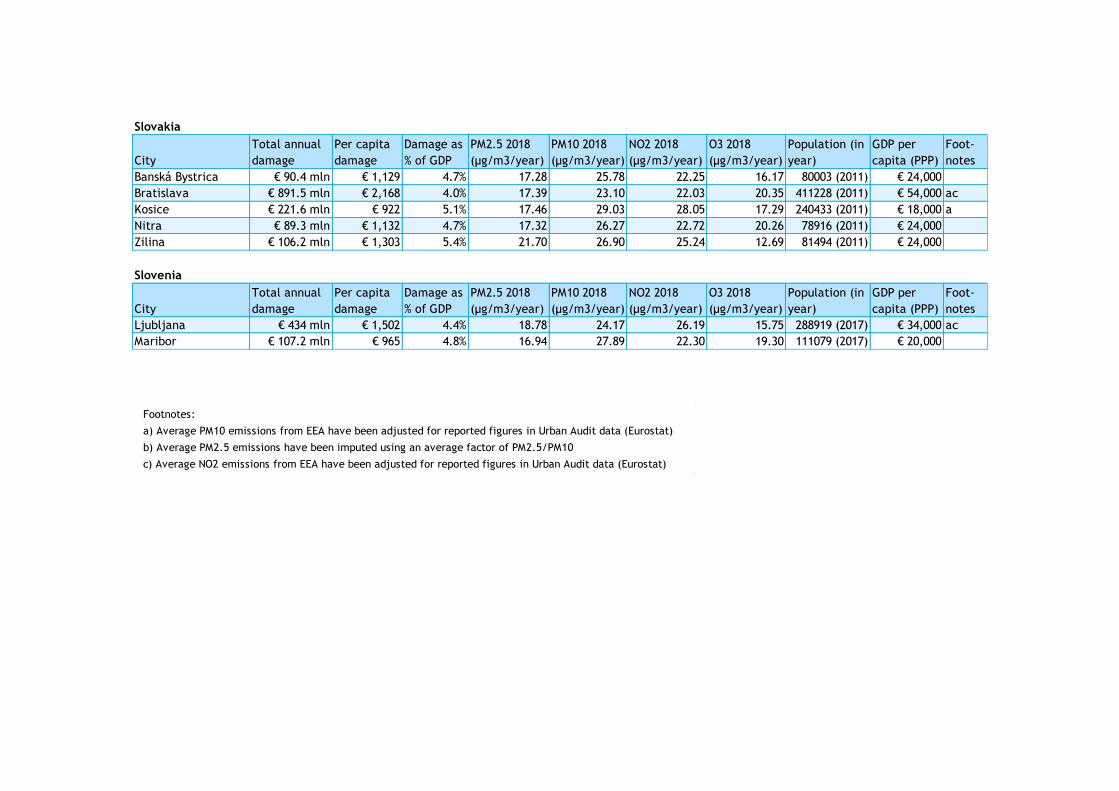
78 190272 - Health costs of air pollution in European cities and the linkage with transport – October 2020
Slovakia
City
Total annual
damage
Per capita
damage
Damage as
% of GDP
PM2.5 2018
(μg/m3/year)
PM10 2018
(μg/m3/year)
NO2 2018
(μg/m3/year)
O3 2018
(μg/m3/year)
Population (in
year)
GDP per
capita (PPP)
Foot-
notes
Banská Bystrica € 90.4 mln € 1,129 4.7% 17.28 25.78 22.25 16.17 80003 (2011) € 24,000
Bratislava € 891.5 mln € 2,168 4.0% 17.39 23.10 22.03 20.35 411228 (2011) € 54,000 ac
Kosice € 221.6 mln € 922 5.1% 17.46 29.03 28.05 17.29 240433 (2011) € 18,000 a
Nitra € 89.3 mln € 1,132 4.7% 17.32 26.27 22.72 20.26 78916 (2011) € 24,000
Zilina € 106.2 mln € 1,303 5.4% 21.70 26.90 25.24 12.69 81494 (2011) € 24,000
Slovenia
City
Total annual
damage
Per capita
damage
Damage as
% of GDP
PM2.5 2018
(μg/m3/year)
PM10 2018
(μg/m3/year)
NO2 2018
(μg/m3/year)
O3 2018
(μg/m3/year)
Population (in
year)
GDP per
capita (PPP)
Foot-
notes
Ljubljana € 434 mln € 1,502 4.4% 18.78 24.17 26.19 15.75 288919 (2017) € 34,000 ac
Maribor € 107.2 mln € 965 4.8% 16.94 27.89 22.30 19.30 111079 (2017) € 20,000
Footnotes:
a) Average PM10 emissions from EEA have been adjusted for reported figures in Urban Audit data (Eurostat)
b) Average PM2.5 emissions have been imputed using an average factor of PM2.5/PM10
c) Average NO2 emissions from EEA have been adjusted for reported figures in Urban Audit data (Eurostat)
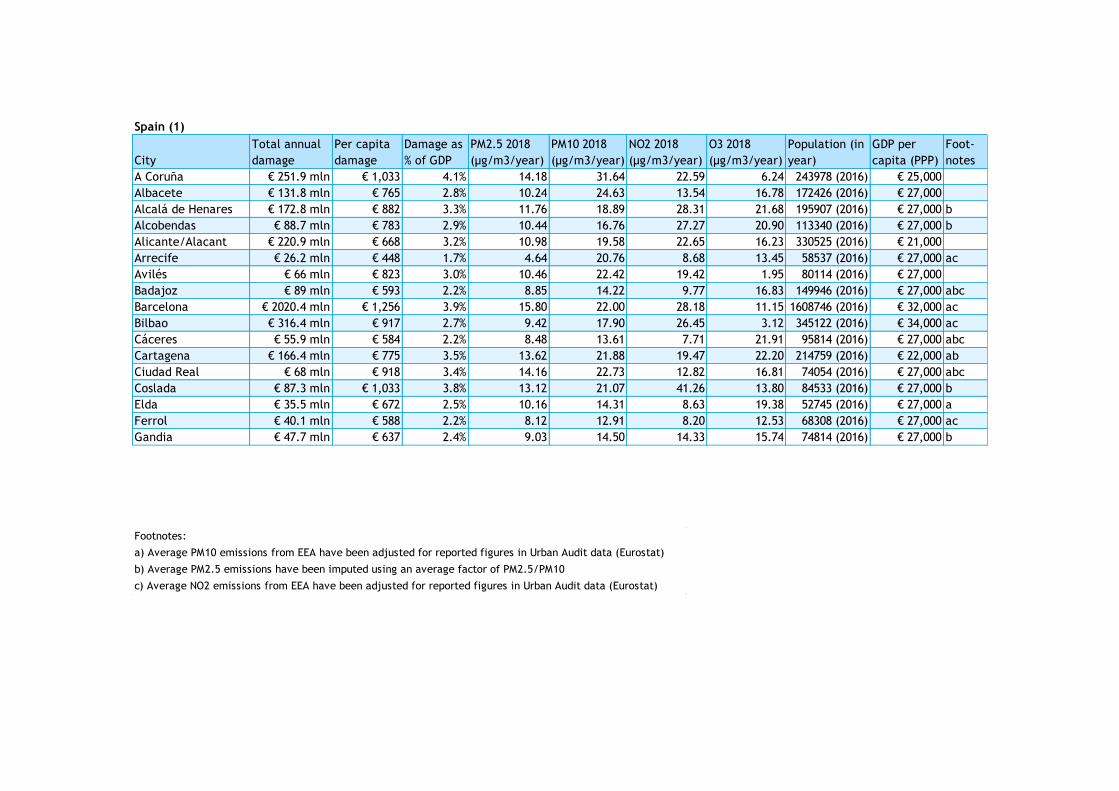
79 190272 - Health costs of air pollution in European cities and the linkage with transport – October 2020
Spain (1)
City
Total annual
damage
Per capita
damage
Damage as
% of GDP
PM2.5 2018
(μg/m3/year)
PM10 2018
(μg/m3/year)
NO2 2018
(μg/m3/year)
O3 2018
(μg/m3/year)
Population (in
year)
GDP per
capita (PPP)
Foot-
notes
A Coruña € 251.9 mln € 1,033 4.1% 14.18 31.64 22.59 6.24 243978 (2016) € 25,000
Albacete € 131.8 mln € 765 2.8% 10.24 24.63 13.54 16.78 172426 (2016) € 27,000
Alcalá de Henares € 172.8 mln € 882 3.3% 11.76 18.89 28.31 21.68 195907 (2016) € 27,000 b
Alcobendas € 88.7 mln € 783 2.9% 10.44 16.76 27.27 20.90 113340 (2016) € 27,000 b
Alicante/Alacant € 220.9 mln € 668 3.2% 10.98 19.58 22.65 16.23 330525 (2016) € 21,000
Arrecife € 26.2 mln € 448 1.7% 4.64 20.76 8.68 13.45 58537 (2016) € 27,000 ac
Avilés € 66 mln € 823 3.0% 10.46 22.42 19.42 1.95 80114 (2016) € 27,000
Badajoz € 89 mln € 593 2.2% 8.85 14.22 9.77 16.83 149946 (2016) € 27,000 abc
Barcelona € 2020.4 mln € 1,256 3.9% 15.80 22.00 28.18 11.15 1608746 (2016) € 32,000 ac
Bilbao € 316.4 mln € 917 2.7% 9.42 17.90 26.45 3.12 345122 (2016) € 34,000 ac
Cáceres € 55.9 mln € 584 2.2% 8.48 13.61 7.71 21.91 95814 (2016) € 27,000 abc
Cartagena € 166.4 mln € 775 3.5% 13.62 21.88 19.47 22.20 214759 (2016) € 22,000 ab
Ciudad Real € 68 mln € 918 3.4% 14.16 22.73 12.82 16.81 74054 (2016) € 27,000 abc
Coslada € 87.3 mln € 1,033 3.8% 13.12 21.07 41.26 13.80 84533 (2016) € 27,000 b
Elda € 35.5 mln € 672 2.5% 10.16 14.31 8.63 19.38 52745 (2016) € 27,000 a
Ferrol € 40.1 mln € 588 2.2% 8.12 12.91 8.20 12.53 68308 (2016) € 27,000 ac
Gandia € 47.7 mln € 637 2.4% 9.03 14.50 14.33 15.74 74814 (2016) € 27,000 b
Footnotes:
a) Average PM10 emissions from EEA have been adjusted for reported figures in Urban Audit data (Eurostat)
b) Average PM2.5 emissions have been imputed using an average factor of PM2.5/PM10
c) Average NO2 emissions from EEA have been adjusted for reported figures in Urban Audit data (Eurostat)
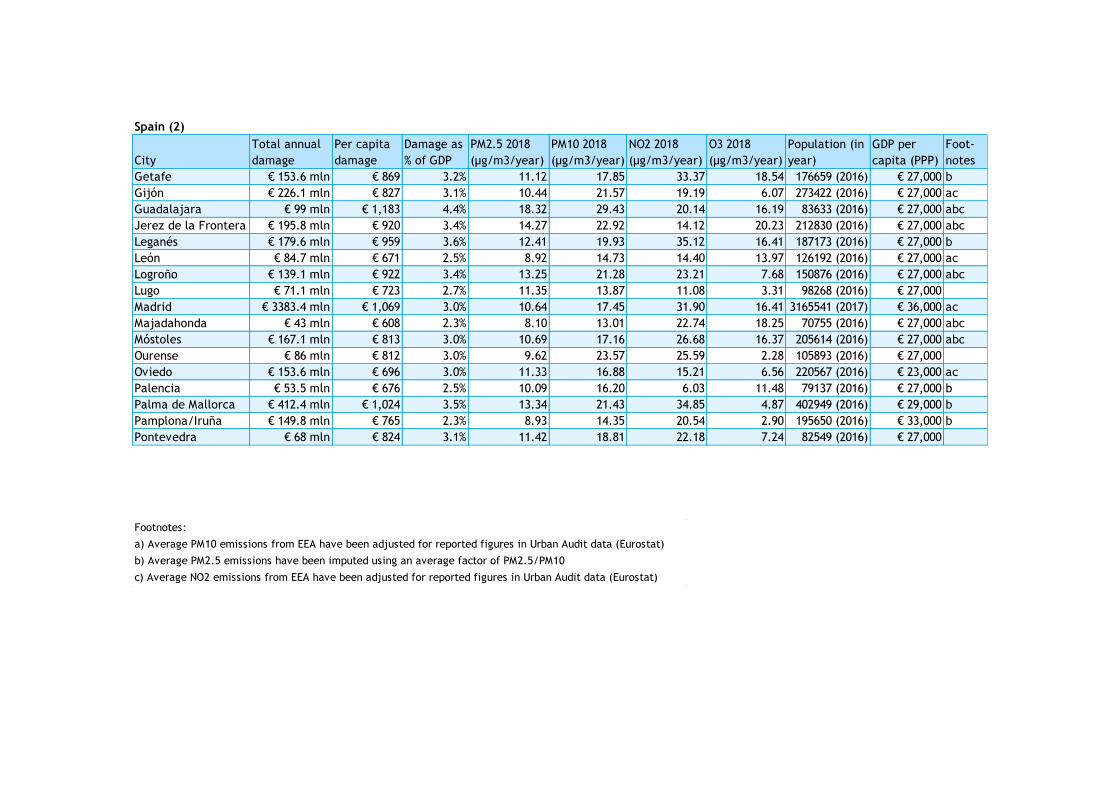
80 190272 - Health costs of air pollution in European cities and the linkage with transport – October 2020
Spain (2)
City
Total annual
damage
Per capita
damage
Damage as
% of GDP
PM2.5 2018
(μg/m3/year)
PM10 2018
(μg/m3/year)
NO2 2018
(μg/m3/year)
O3 2018
(μg/m3/year)
Population (in
year)
GDP per
capita (PPP)
Foot-
notes
Getafe € 153.6 mln € 869 3.2% 11.12 17.85 33.37 18.54 176659 (2016) € 27,000 b
Gijón € 226.1 mln € 827 3.1% 10.44 21.57 19.19 6.07 273422 (2016) € 27,000 ac
Guadalajara € 99 mln € 1,183 4.4% 18.32 29.43 20.14 16.19 83633 (2016) € 27,000 abc
Jerez de la Frontera € 195.8 mln € 920 3.4% 14.27 22.92 14.12 20.23 212830 (2016) € 27,000 abc
Leganés € 179.6 mln € 959 3.6% 12.41 19.93 35.12 16.41 187173 (2016) € 27,000 b
León € 84.7 mln € 671 2.5% 8.92 14.73 14.40 13.97 126192 (2016) € 27,000 ac
Logroño € 139.1 mln € 922 3.4% 13.25 21.28 23.21 7.68 150876 (2016) € 27,000 abc
Lugo € 71.1 mln € 723 2.7% 11.35 13.87 11.08 3.31 98268 (2016) € 27,000
Madrid € 3383.4 mln € 1,069 3.0% 10.64 17.45 31.90 16.41 3165541 (2017) € 36,000 ac
Majadahonda € 43 mln € 608 2.3% 8.10 13.01 22.74 18.25 70755 (2016) € 27,000 abc
Móstoles € 167.1 mln € 813 3.0% 10.69 17.16 26.68 16.37 205614 (2016) € 27,000 abc
Ourense € 86 mln € 812 3.0% 9.62 23.57 25.59 2.28 105893 (2016) € 27,000
Oviedo € 153.6 mln € 696 3.0% 11.33 16.88 15.21 6.56 220567 (2016) € 23,000 ac
Palencia € 53.5 mln € 676 2.5% 10.09 16.20 6.03 11.48 79137 (2016) € 27,000 b
Palma de Mallorca € 412.4 mln € 1,024 3.5% 13.34 21.43 34.85 4.87 402949 (2016) € 29,000 b
Pamplona/Iruña € 149.8 mln € 765 2.3% 8.93 14.35 20.54 2.90 195650 (2016) € 33,000 b
Pontevedra € 68 mln € 824 3.1% 11.42 18.81 22.18 7.24 82549 (2016) € 27,000
Footnotes:
a) Average PM10 emissions from EEA have been adjusted for reported figures in Urban Audit data (Eurostat)
b) Average PM2.5 emissions have been imputed using an average factor of PM2.5/PM10
c) Average NO2 emissions from EEA have been adjusted for reported figures in Urban Audit data (Eurostat)
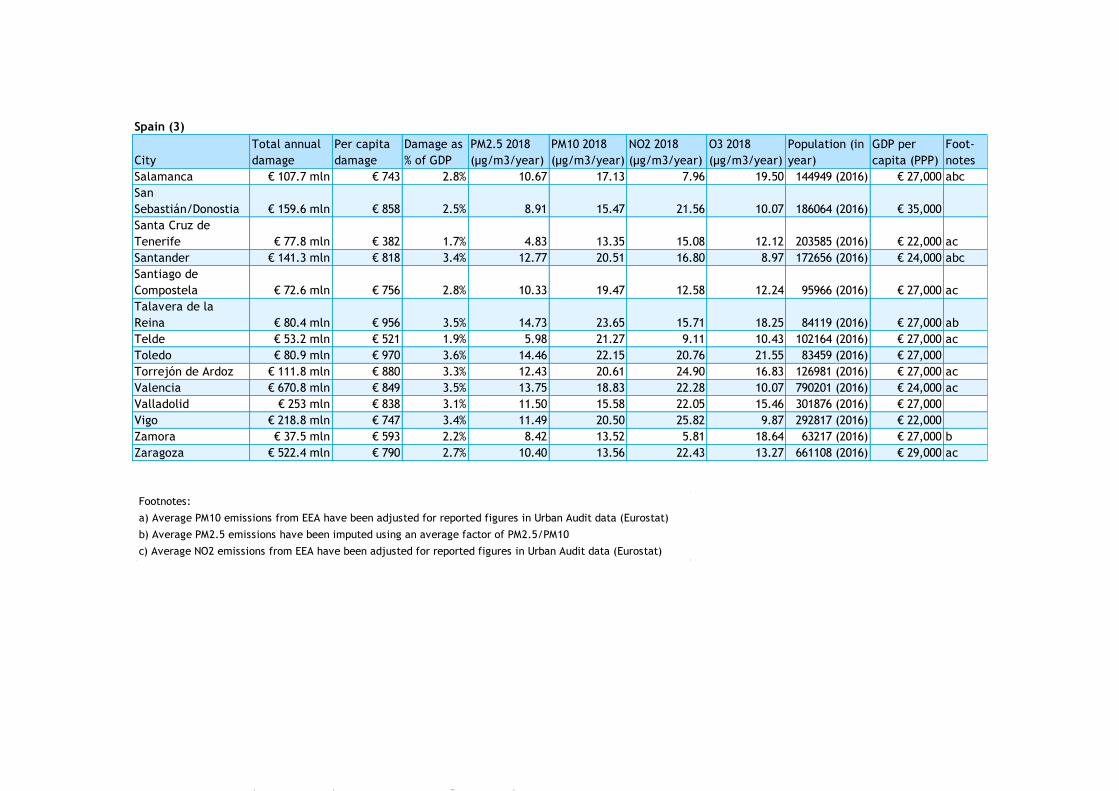
81 190272 - Health costs of air pollution in European cities and the linkage with transport – October 2020
Spain (3)
City
Total annual
damage
Per capita
damage
Damage as
% of GDP
PM2.5 2018
(μg/m3/year)
PM10 2018
(μg/m3/year)
NO2 2018
(μg/m3/year)
O3 2018
(μg/m3/year)
Population (in
year)
GDP per
capita (PPP)
Foot-
notes
Salamanca € 107.7 mln € 743 2.8% 10.67 17.13 7.96 19.50 144949 (2016) € 27,000 abc
San
Sebastián/Donostia € 159.6 mln € 858 2.5% 8.91 15.47 21.56 10.07 186064 (2016) € 35,000
Santa Cruz de
Tenerife € 77.8 mln € 382 1.7% 4.83 13.35 15.08 12.12 203585 (2016) € 22,000 ac
Santander € 141.3 mln € 818 3.4% 12.77 20.51 16.80 8.97 172656 (2016) € 24,000 abc
Santiago de
Compostela € 72.6 mln € 756 2.8% 10.33 19.47 12.58 12.24 95966 (2016) € 27,000 ac
Talavera de la
Reina € 80.4 mln € 956 3.5% 14.73 23.65 15.71 18.25 84119 (2016) € 27,000 ab
Telde € 53.2 mln € 521 1.9% 5.98 21.27 9.11 10.43 102164 (2016) € 27,000 ac
Toledo € 80.9 mln € 970 3.6% 14.46 22.15 20.76 21.55 83459 (2016) € 27,000
Torrejón de Ardoz € 111.8 mln € 880 3.3% 12.43 20.61 24.90 16.83 126981 (2016) € 27,000 ac
Valencia € 670.8 mln € 849 3.5% 13.75 18.83 22.28 10.07 790201 (2016) € 24,000 ac
Valladolid € 253 mln € 838 3.1% 11.50 15.58 22.05 15.46 301876 (2016) € 27,000
Vigo € 218.8 mln € 747 3.4% 11.49 20.50 25.82 9.87 292817 (2016) € 22,000
Zamora € 37.5 mln € 593 2.2% 8.42 13.52 5.81 18.64 63217 (2016) € 27,000 b
Zaragoza € 522.4 mln € 790 2.7% 10.40 13.56 22.43 13.27 661108 (2016) € 29,000 ac
Footnotes:
a) Average PM10 emissions from EEA have been adjusted for reported figures in Urban Audit data (Eurostat)
b) Average PM2.5 emissions have been imputed using an average factor of PM2.5/PM10
c) Average NO2 emissions from EEA have been adjusted for reported figures in Urban Audit data (Eurostat)
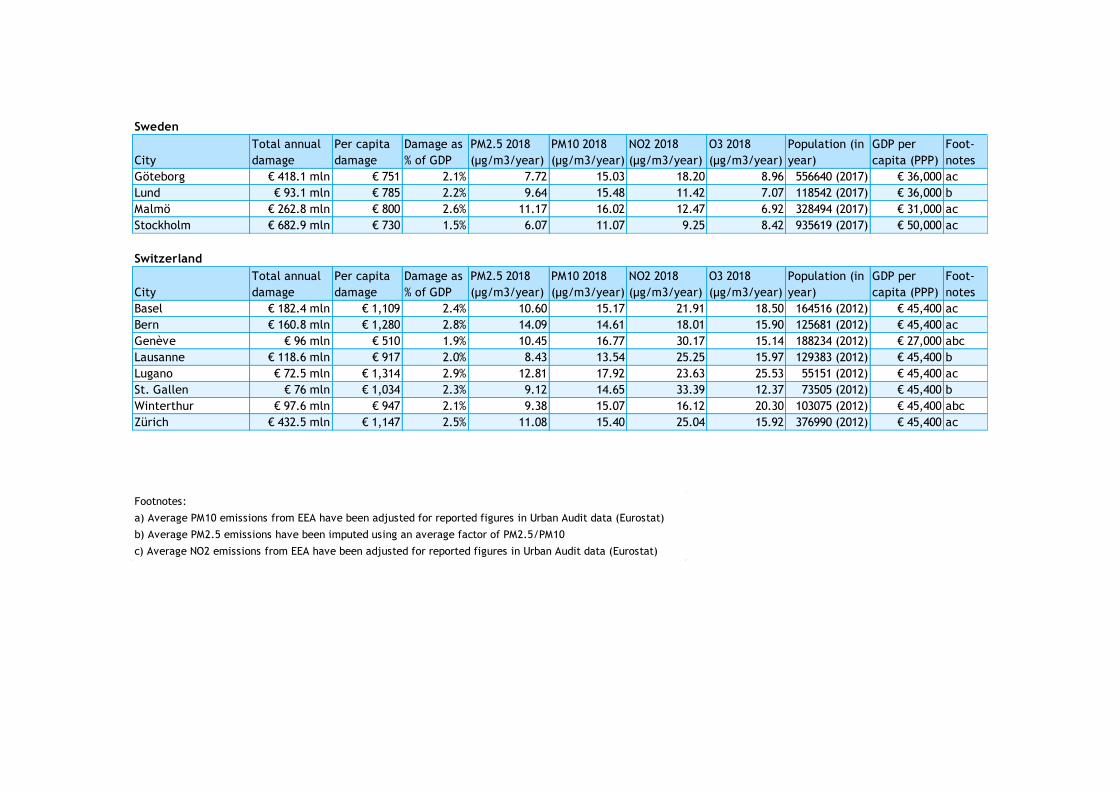
82 190272 - Health costs of air pollution in European cities and the linkage with transport – October 2020
Sweden
City
Total annual
damage
Per capita
damage
Damage as
% of GDP
PM2.5 2018
(μg/m3/year)
PM10 2018
(μg/m3/year)
NO2 2018
(μg/m3/year)
O3 2018
(μg/m3/year)
Population (in
year)
GDP per
capita (PPP)
Foot-
notes
Göteborg € 418.1 mln € 751 2.1% 7.72 15.03 18.20 8.96 556640 (2017) € 36,000 ac
Lund € 93.1 mln € 785 2.2% 9.64 15.48 11.42 7.07 118542 (2017) € 36,000 b
Malmö € 262.8 mln € 800 2.6% 11.17 16.02 12.47 6.92 328494 (2017) € 31,000 ac
Stockholm € 682.9 mln € 730 1.5% 6.07 11.07 9.25 8.42 935619 (2017) € 50,000 ac
Switzerland
City
Total annual
damage
Per capita
damage
Damage as
% of GDP
PM2.5 2018
(μg/m3/year)
PM10 2018
(μg/m3/year)
NO2 2018
(μg/m3/year)
O3 2018
(μg/m3/year)
Population (in
year)
GDP per
capita (PPP)
Foot-
notes
Basel € 182.4 mln € 1,109 2.4% 10.60 15.17 21.91 18.50 164516 (2012) € 45,400 ac
Bern € 160.8 mln € 1,280 2.8% 14.09 14.61 18.01 15.90 125681 (2012) € 45,400 ac
Genève € 96 mln € 510 1.9% 10.45 16.77 30.17 15.14 188234 (2012) € 27,000 abc
Lausanne € 118.6 mln € 917 2.0% 8.43 13.54 25.25 15.97 129383 (2012) € 45,400 b
Lugano € 72.5 mln € 1,314 2.9% 12.81 17.92 23.63 25.53 55151 (2012) € 45,400 ac
St. Gallen € 76 mln € 1,034 2.3% 9.12 14.65 33.39 12.37 73505 (2012) € 45,400 b
Winterthur € 97.6 mln € 947 2.1% 9.38 15.07 16.12 20.30 103075 (2012) € 45,400 abc
Zürich € 432.5 mln € 1,147 2.5% 11.08 15.40 25.04 15.92 376990 (2012) € 45,400 ac
Footnotes:
a) Average PM10 emissions from EEA have been adjusted for reported figures in Urban Audit data (Eurostat)
b) Average PM2.5 emissions have been imputed using an average factor of PM2.5/PM10
c) Average NO2 emissions from EEA have been adjusted for reported figures in Urban Audit data (Eurostat)
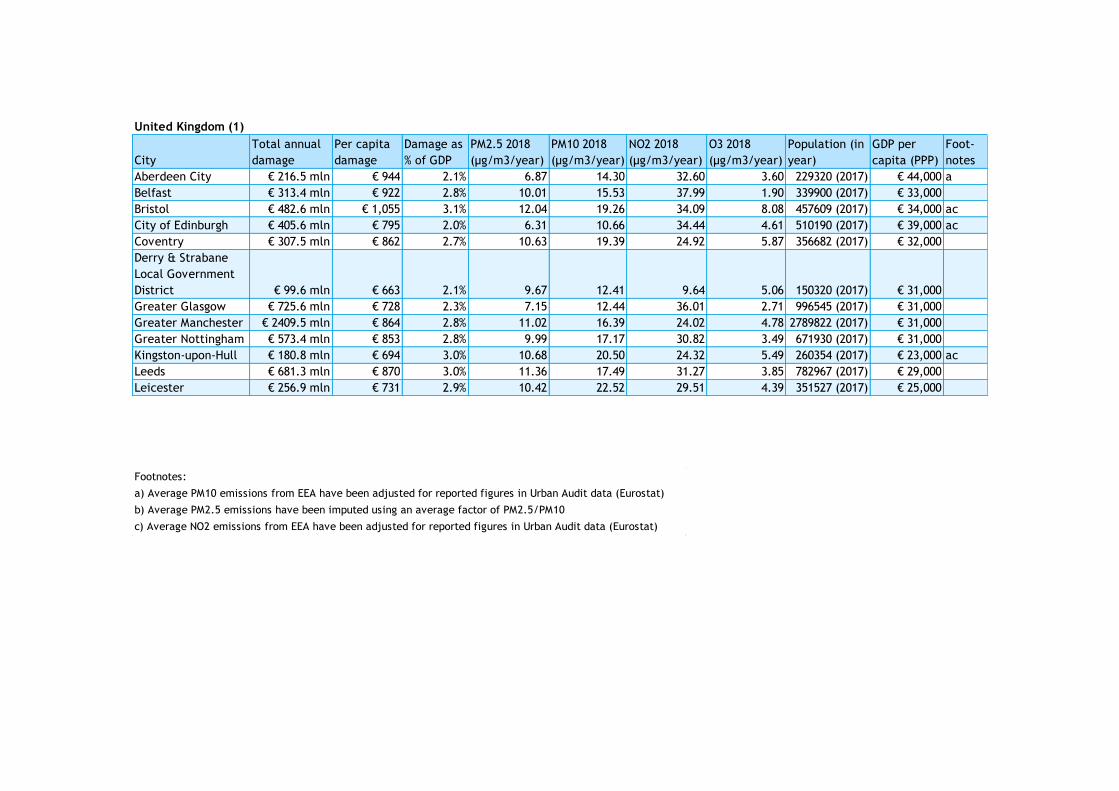
83 190272 - Health costs of air pollution in European cities and the linkage with transport – October 2020
United Kingdom (1)
City
Total annual
damage
Per capita
damage
Damage as
% of GDP
PM2.5 2018
(μg/m3/year)
PM10 2018
(μg/m3/year)
NO2 2018
(μg/m3/year)
O3 2018
(μg/m3/year)
Population (in
year)
GDP per
capita (PPP)
Foot-
notes
Aberdeen City € 216.5 mln € 944 2.1% 6.87 14.30 32.60 3.60 229320 (2017) € 44,000 a
Belfast € 313.4 mln € 922 2.8% 10.01 15.53 37.99 1.90 339900 (2017) € 33,000
Bristol € 482.6 mln € 1,055 3.1% 12.04 19.26 34.09 8.08 457609 (2017) € 34,000 ac
City of Edinburgh € 405.6 mln € 795 2.0% 6.31 10.66 34.44 4.61 510190 (2017) € 39,000 ac
Coventry € 307.5 mln € 862 2.7% 10.63 19.39 24.92 5.87 356682 (2017) € 32,000
Derry & Strabane
Local Government
District € 99.6 mln € 663 2.1% 9.67 12.41 9.64 5.06 150320 (2017) € 31,000
Greater Glasgow € 725.6 mln € 728 2.3% 7.15 12.44 36.01 2.71 996545 (2017) € 31,000
Greater Manchester € 2409.5 mln € 864 2.8% 11.02 16.39 24.02 4.78 2789822 (2017) € 31,000
Greater Nottingham € 573.4 mln € 853 2.8% 9.99 17.17 30.82 3.49 671930 (2017) € 31,000
Kingston-upon-Hull € 180.8 mln € 694 3.0% 10.68 20.50 24.32 5.49 260354 (2017) € 23,000 ac
Leeds € 681.3 mln € 870 3.0% 11.36 17.49 31.27 3.85 782967 (2017) € 29,000
Leicester € 256.9 mln € 731 2.9% 10.42 22.52 29.51 4.39 351527 (2017) € 25,000
Footnotes:
a) Average PM10 emissions from EEA have been adjusted for reported figures in Urban Audit data (Eurostat)
b) Average PM2.5 emissions have been imputed using an average factor of PM2.5/PM10
c) Average NO2 emissions from EEA have been adjusted for reported figures in Urban Audit data (Eurostat)
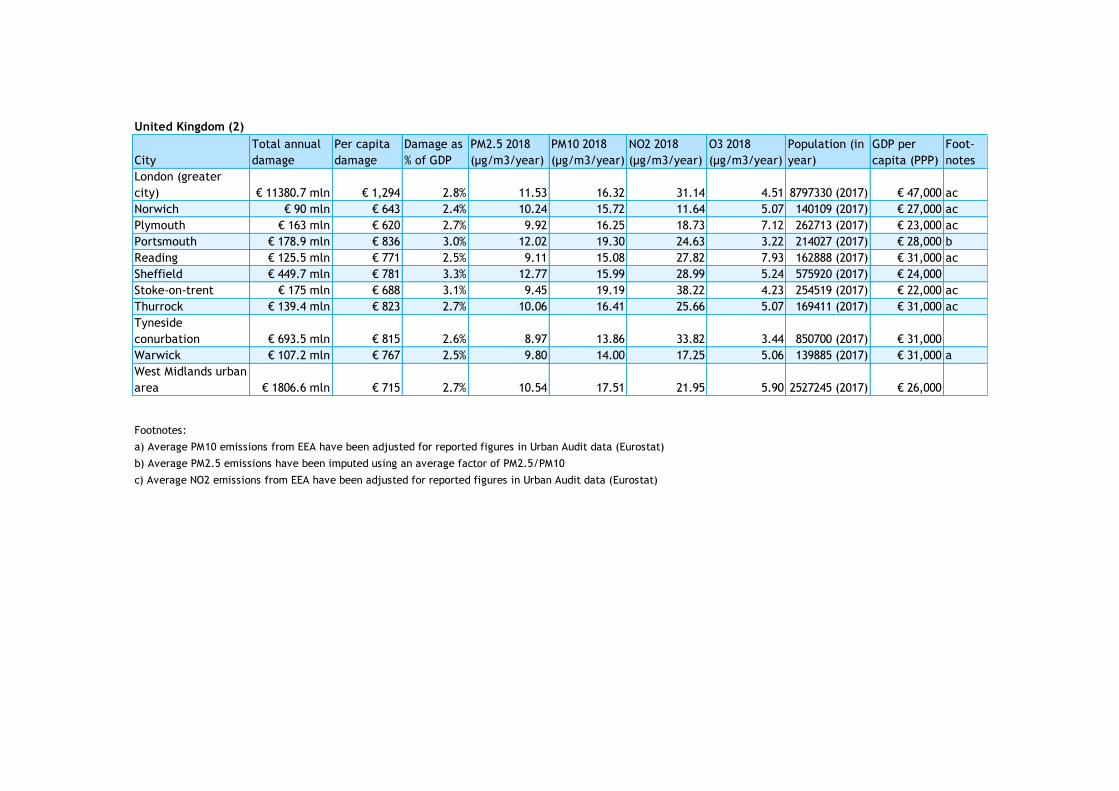
84 190272 - Health costs of air pollution in European cities and the linkage with transport – October 2020
United Kingdom (2)
City
Total annual
damage
Per capita
damage
Damage as
% of GDP
PM2.5 2018
(μg/m3/year)
PM10 2018
(μg/m3/year)
NO2 2018
(μg/m3/year)
O3 2018
(μg/m3/year)
Population (in
year)
GDP per
capita (PPP)
Foot-
notes
London (greater
city) € 11380.7 mln € 1,294 2.8% 11.53 16.32 31.14 4.51 8797330 (2017) € 47,000 ac
Norwich € 90 mln € 643 2.4% 10.24 15.72 11.64 5.07 140109 (2017) € 27,000 ac
Plymouth € 163 mln € 620 2.7% 9.92 16.25 18.73 7.12 262713 (2017) € 23,000 ac
Portsmouth € 178.9 mln € 836 3.0% 12.02 19.30 24.63 3.22 214027 (2017) € 28,000 b
Reading € 125.5 mln € 771 2.5% 9.11 15.08 27.82 7.93 162888 (2017) € 31,000 ac
Sheffield € 449.7 mln € 781 3.3% 12.77 15.99 28.99 5.24 575920 (2017) € 24,000
Stoke-on-trent € 175 mln € 688 3.1% 9.45 19.19 38.22 4.23 254519 (2017) € 22,000 ac
Thurrock € 139.4 mln € 823 2.7% 10.06 16.41 25.66 5.07 169411 (2017) € 31,000 ac
Tyneside
conurbation € 693.5 mln € 815 2.6% 8.97 13.86 33.82 3.44 850700 (2017) € 31,000
Warwick € 107.2 mln € 767 2.5% 9.80 14.00 17.25 5.06 139885 (2017) € 31,000 a
West Midlands urban
area € 1806.6 mln € 715 2.7% 10.54 17.51 21.95 5.90 2527245 (2017) € 26,000
Footnotes:
a) Average PM10 emissions from EEA have been adjusted for reported figures in Urban Audit data (Eurostat)
b) Average PM2.5 emissions have been imputed using an average factor of PM2.5/PM10
c) Average NO2 emissions from EEA have been adjusted for reported figures in Urban Audit data (Eurostat)
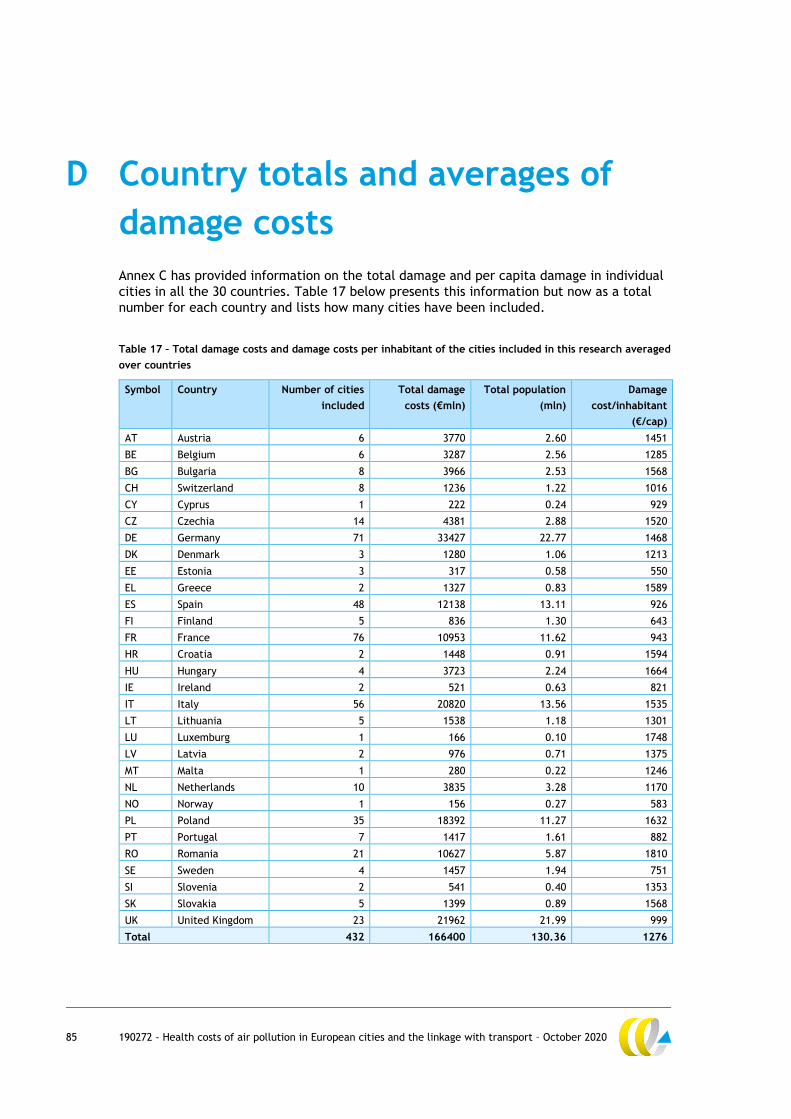
85 190272 - Health costs of air pollution in European cities and the linkage with transport – October 2020
D Country totals and averages of
damage costs
Annex C has provided information on the total damage and per capita damage in individual
cities in all the 30 countries. Table 17 below presents this information but now as a total
number for each country and lists how many cities have been included.
Table 17 – Total damage costs and damage costs per inhabitant of the cities included in this research averaged
over countries
Symbol Country Number of cities
included
Total damage
costs (€mln)
Total population
(mln)
Damage
cost/inhabitant
(€/cap)
AT Austria 6 3770 2.60 1451
BE Belgium 6 3287 2.56 1285
BG Bulgaria 8 3966 2.53 1568
CH Switzerland 8 1236 1.22 1016
CY Cyprus 1 222 0.24 929
CZ Czechia 14 4381 2.88 1520
DE Germany 71 33427 22.77 1468
DK Denmark 3 1280 1.06 1213
EE Estonia 3 317 0.58 550
EL Greece 2 1327 0.83 1589
ES Spain 48 12138 13.11 926
FI Finland 5 836 1.30 643
FR France 76 10953 11.62 943
HR Croatia 2 1448 0.91 1594
HU Hungary 4 3723 2.24 1664
IE Ireland 2 521 0.63 821
IT Italy 56 20820 13.56 1535
LT Lithuania 5 1538 1.18 1301
LU Luxemburg 1 166 0.10 1748
LV Latvia 2 976 0.71 1375
MT Malta 1 280 0.22 1246
NL Netherlands 10 3835 3.28 1170
NO Norway 1 156 0.27 583
PL Poland 35 18392 11.27 1632
PT Portugal 7 1417 1.61 882
RO Romania 21 10627 5.87 1810
SE Sweden 4 1457 1.94 751
SI Slovenia 2 541 0.40 1353
SK Slovakia 5 1399 0.89 1568
UK United Kingdom 23 21962 21.99 999
Total 432 166400 130.36 1276