air pollution in mega cities: a case study of istanbul -...
TRANSCRIPT
4
Air Pollution in Mega Cities: A Case Study of Istanbul
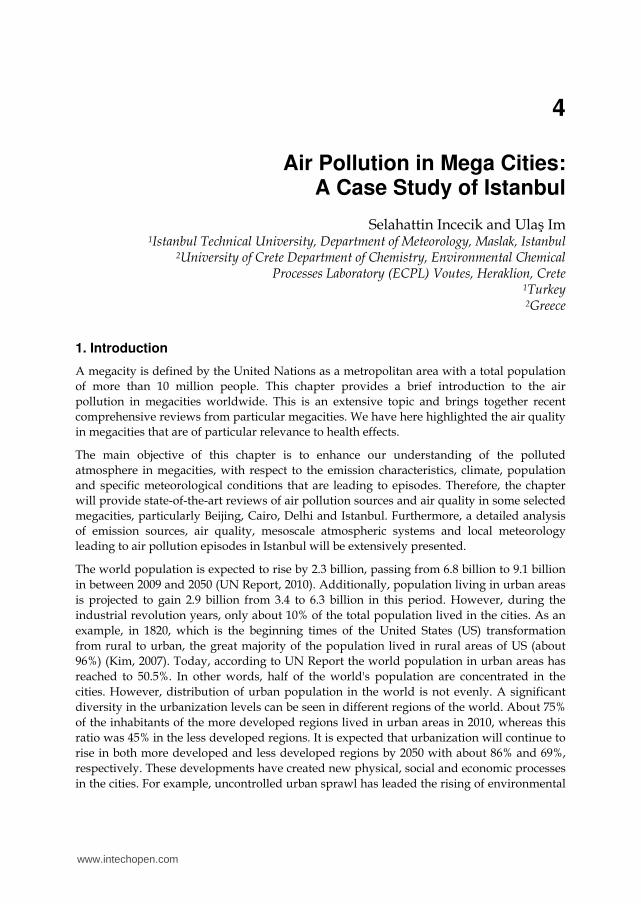
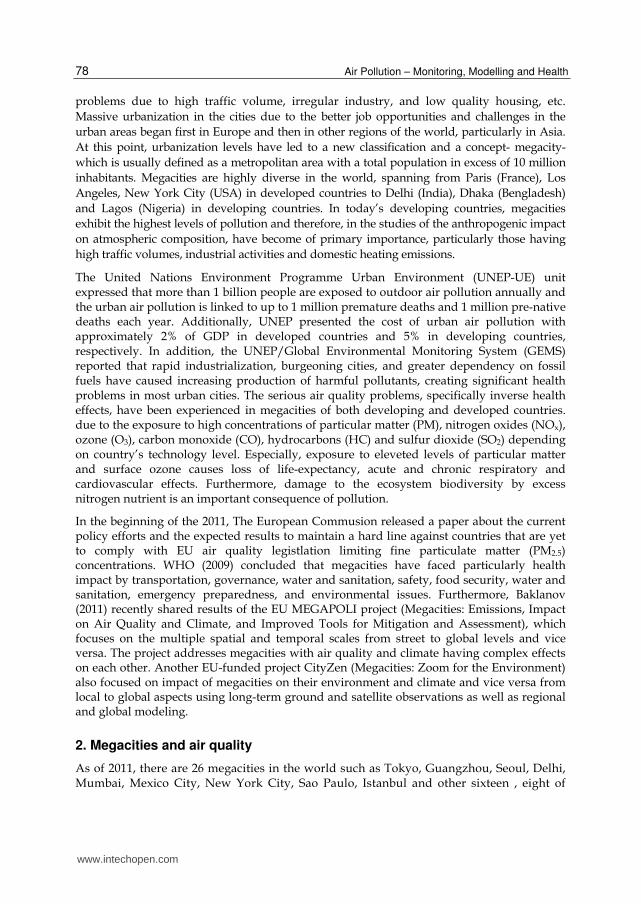
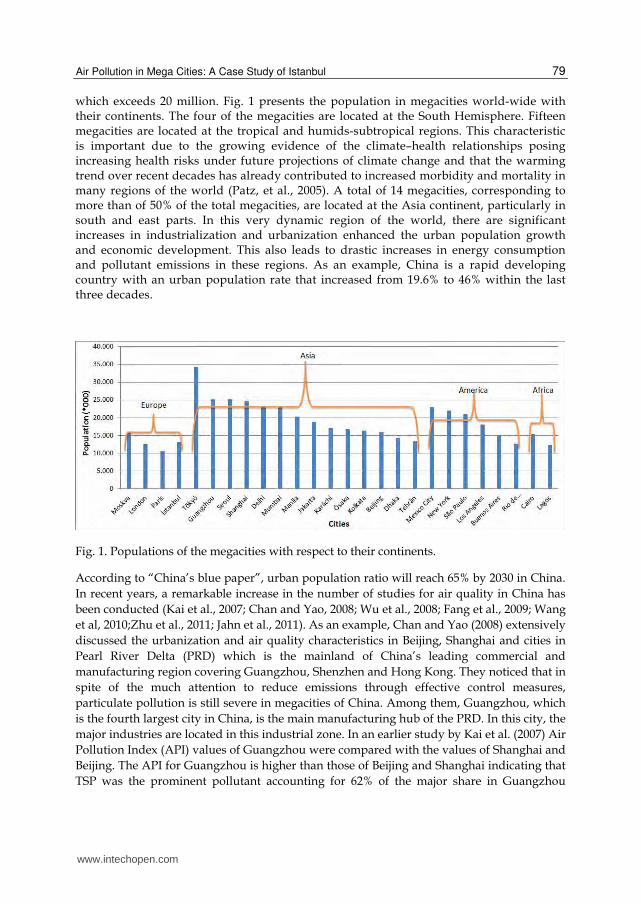
Selahattin Incecik and Ulaş Im 1Istanbul Technical University, Department of Meteorology, Maslak, Istanbul
2University of Crete Department of Chemistry, Environmental Chemical Processes Laboratory (ECPL) Voutes, Heraklion, Crete
1Turkey 2Greece
1. Introduction
A megacity is defined by the United Nations as a metropolitan area with a total population of more than 10 million people. This chapter provides a brief introduction to the air pollution in megacities worldwide. This is an extensive topic and brings together recent comprehensive reviews from particular megacities. We have here highlighted the air quality in megacities that are of particular relevance to health effects.
The main objective of this chapter is to enhance our understanding of the polluted atmosphere in megacities, with respect to the emission characteristics, climate, population and specific meteorological conditions that are leading to episodes. Therefore, the chapter will provide state-of-the-art reviews of air pollution sources and air quality in some selected megacities, particularly Beijing, Cairo, Delhi and Istanbul. Furthermore, a detailed analysis of emission sources, air quality, mesoscale atmospheric systems and local meteorology leading to air pollution episodes in Istanbul will be extensively presented.
The world population is expected to rise by 2.3 billion, passing from 6.8 billion to 9.1 billion in between 2009 and 2050 (UN Report, 2010). Additionally, population living in urban areas is projected to gain 2.9 billion from 3.4 to 6.3 billion in this period. However, during the industrial revolution years, only about 10% of the total population lived in the cities. As an example, in 1820, which is the beginning times of the United States (US) transformation from rural to urban, the great majority of the population lived in rural areas of US (about 96%) (Kim, 2007). Today, according to UN Report the world population in urban areas has reached to 50.5%. In other words, half of the world's population are concentrated in the cities. However, distribution of urban population in the world is not evenly. A significant diversity in the urbanization levels can be seen in different regions of the world. About 75% of the inhabitants of the more developed regions lived in urban areas in 2010, whereas this ratio was 45% in the less developed regions. It is expected that urbanization will continue to rise in both more developed and less developed regions by 2050 with about 86% and 69%, respectively. These developments have created new physical, social and economic processes in the cities. For example, uncontrolled urban sprawl has leaded the rising of environmental
www.intechopen.com
Air Pollution – Monitoring, Modelling and Health
78
problems due to high traffic volume, irregular industry, and low quality housing, etc. Massive urbanization in the cities due to the better job opportunities and challenges in the urban areas began first in Europe and then in other regions of the world, particularly in Asia. At this point, urbanization levels have led to a new classification and a concept- megacity- which is usually defined as a metropolitan area with a total population in excess of 10 million inhabitants. Megacities are highly diverse in the world, spanning from Paris (France), Los Angeles, New York City (USA) in developed countries to Delhi (India), Dhaka (Bengladesh) and Lagos (Nigeria) in developing countries. In today’s developing countries, megacities exhibit the highest levels of pollution and therefore, in the studies of the anthropogenic impact on atmospheric composition, have become of primary importance, particularly those having high traffic volumes, industrial activities and domestic heating emissions.
The United Nations Environment Programme Urban Environment (UNEP-UE) unit expressed that more than 1 billion people are exposed to outdoor air pollution annually and the urban air pollution is linked to up to 1 million premature deaths and 1 million pre-native deaths each year. Additionally, UNEP presented the cost of urban air pollution with approximately 2% of GDP in developed countries and 5% in developing countries, respectively. In addition, the UNEP/Global Environmental Monitoring System (GEMS) reported that rapid industrialization, burgeoning cities, and greater dependency on fossil fuels have caused increasing production of harmful pollutants, creating significant health problems in most urban cities. The serious air quality problems, specifically inverse health effects, have been experienced in megacities of both developing and developed countries. due to the exposure to high concentrations of particular matter (PM), nitrogen oxides (NOx), ozone (O3), carbon monoxide (CO), hydrocarbons (HC) and sulfur dioxide (SO2) depending on country’s technology level. Especially, exposure to eleveted levels of particular matter and surface ozone causes loss of life-expectancy, acute and chronic respiratory and cardiovascular effects. Furthermore, damage to the ecosystem biodiversity by excess nitrogen nutrient is an important consequence of pollution.
In the beginning of the 2011, The European Commusion released a paper about the current policy efforts and the expected results to maintain a hard line against countries that are yet to comply with EU air quality legistlation limiting fine particulate matter (PM2.5) concentrations. WHO (2009) concluded that megacities have faced particularly health impact by transportation, governance, water and sanitation, safety, food security, water and sanitation, emergency preparedness, and environmental issues. Furthermore, Baklanov (2011) recently shared results of the EU MEGAPOLI project (Megacities: Emissions, Impact on Air Quality and Climate, and Improved Tools for Mitigation and Assessment), which focuses on the multiple spatial and temporal scales from street to global levels and vice versa. The project addresses megacities with air quality and climate having complex effects on each other. Another EU-funded project CityZen (Megacities: Zoom for the Environment) also focused on impact of megacities on their environment and climate and vice versa from local to global aspects using long-term ground and satellite observations as well as regional and global modeling.
2. Megacities and air quality
As of 2011, there are 26 megacities in the world such as Tokyo, Guangzhou, Seoul, Delhi, Mumbai, Mexico City, New York City, Sao Paulo, Istanbul and other sixteen , eight of
www.intechopen.com
Air Pollution in Mega Cities: A Case Study of Istanbul
79
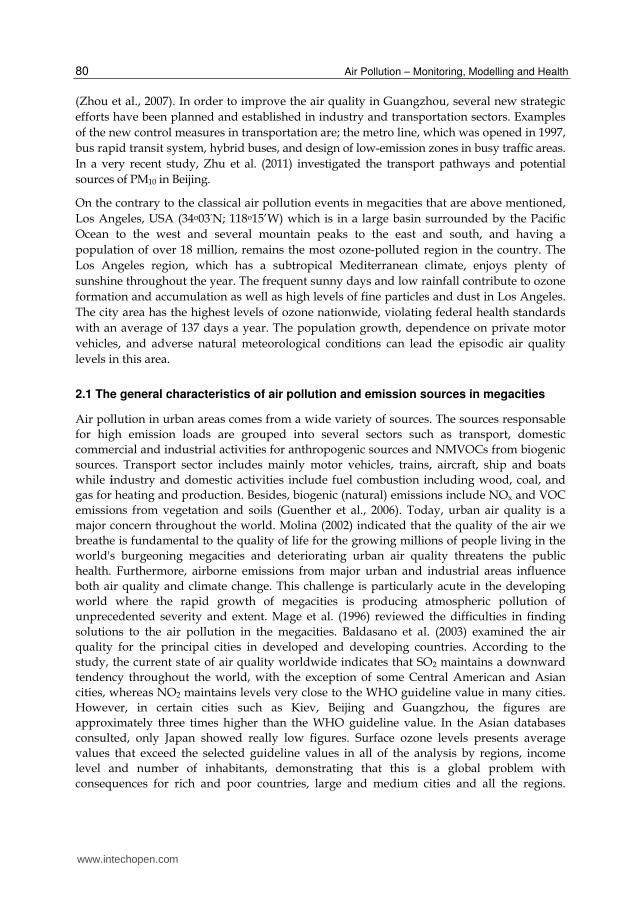
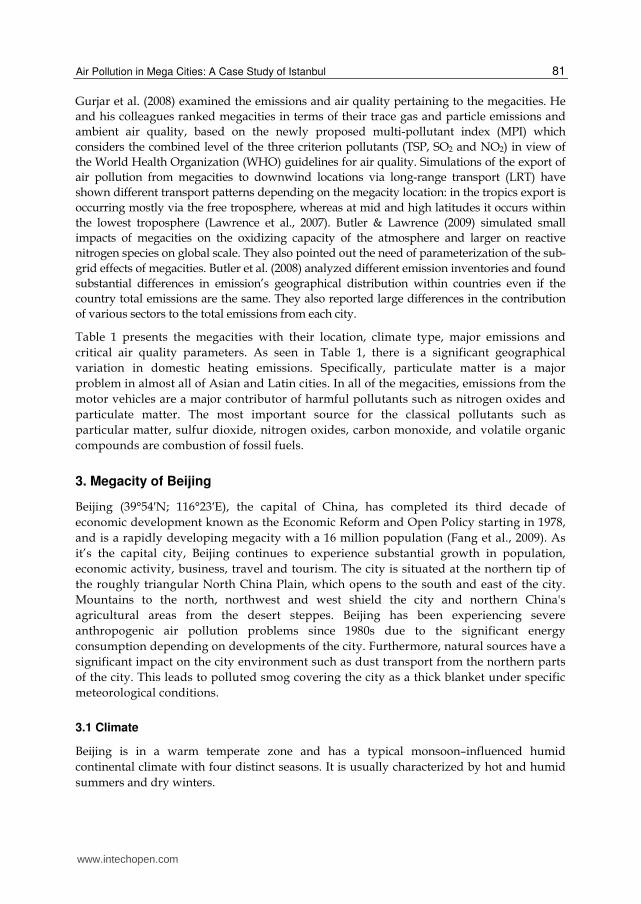
which exceeds 20 million. Fig. 1 presents the population in megacities world-wide with their continents. The four of the megacities are located at the South Hemisphere. Fifteen megacities are located at the tropical and humids-subtropical regions. This characteristic is important due to the growing evidence of the climate–health relationships posing increasing health risks under future projections of climate change and that the warming trend over recent decades has already contributed to increased morbidity and mortality in many regions of the world (Patz, et al., 2005). A total of 14 megacities, corresponding to more than of 50% of the total megacities, are located at the Asia continent, particularly in south and east parts. In this very dynamic region of the world, there are significant increases in industrialization and urbanization enhanced the urban population growth and economic development. This also leads to drastic increases in energy consumption and pollutant emissions in these regions. As an example, China is a rapid developing country with an urban population rate that increased from 19.6% to 46% within the last three decades.
Fig. 1. Populations of the megacities with respect to their continents.
According to “China’s blue paper”, urban population ratio will reach 65% by 2030 in China. In recent years, a remarkable increase in the number of studies for air quality in China has been conducted (Kai et al., 2007; Chan and Yao, 2008; Wu et al., 2008; Fang et al., 2009; Wang et al, 2010;Zhu et al., 2011; Jahn et al., 2011). As an example, Chan and Yao (2008) extensively discussed the urbanization and air quality characteristics in Beijing, Shanghai and cities in Pearl River Delta (PRD) which is the mainland of China’s leading commercial and manufacturing region covering Guangzhou, Shenzhen and Hong Kong. They noticed that in spite of the much attention to reduce emissions through effective control measures, particulate pollution is still severe in megacities of China. Among them, Guangzhou, which is the fourth largest city in China, is the main manufacturing hub of the PRD. In this city, the major industries are located in this industrial zone. In an earlier study by Kai et al. (2007) Air Pollution Index (API) values of Guangzhou were compared with the values of Shanghai and Beijing. The API for Guangzhou is higher than those of Beijing and Shanghai indicating that TSP was the prominent pollutant accounting for 62% of the major share in Guangzhou
www.intechopen.com
Air Pollution – Monitoring, Modelling and Health
80
(Zhou et al., 2007). In order to improve the air quality in Guangzhou, several new strategic efforts have been planned and established in industry and transportation sectors. Examples of the new control measures in transportation are; the metro line, which was opened in 1997, bus rapid transit system, hybrid buses, and design of low-emission zones in busy traffic areas. In a very recent study, Zhu et al. (2011) investigated the transport pathways and potential sources of PM10 in Beijing.
On the contrary to the classical air pollution events in megacities that are above mentioned, Los Angeles, USA (34o03’N; 118o15’W) which is in a large basin surrounded by the Pacific Ocean to the west and several mountain peaks to the east and south, and having a population of over 18 million, remains the most ozone-polluted region in the country. The Los Angeles region, which has a subtropical Mediterranean climate, enjoys plenty of sunshine throughout the year. The frequent sunny days and low rainfall contribute to ozone formation and accumulation as well as high levels of fine particles and dust in Los Angeles. The city area has the highest levels of ozone nationwide, violating federal health standards with an average of 137 days a year. The population growth, dependence on private motor vehicles, and adverse natural meteorological conditions can lead the episodic air quality levels in this area.
2.1 The general characteristics of air pollution and emission sources in megacities
Air pollution in urban areas comes from a wide variety of sources. The sources responsable for high emission loads are grouped into several sectors such as transport, domestic commercial and industrial activities for anthropogenic sources and NMVOCs from biogenic sources. Transport sector includes mainly motor vehicles, trains, aircraft, ship and boats while industry and domestic activities include fuel combustion including wood, coal, and gas for heating and production. Besides, biogenic (natural) emissions include NOx and VOC emissions from vegetation and soils (Guenther et al., 2006). Today, urban air quality is a major concern throughout the world. Molina (2002) indicated that the quality of the air we breathe is fundamental to the quality of life for the growing millions of people living in the world's burgeoning megacities and deteriorating urban air quality threatens the public health. Furthermore, airborne emissions from major urban and industrial areas influence both air quality and climate change. This challenge is particularly acute in the developing world where the rapid growth of megacities is producing atmospheric pollution of unprecedented severity and extent. Mage et al. (1996) reviewed the difficulties in finding solutions to the air pollution in the megacities. Baldasano et al. (2003) examined the air quality for the principal cities in developed and developing countries. According to the study, the current state of air quality worldwide indicates that SO2 maintains a downward tendency throughout the world, with the exception of some Central American and Asian cities, whereas NO2 maintains levels very close to the WHO guideline value in many cities. However, in certain cities such as Kiev, Beijing and Guangzhou, the figures are approximately three times higher than the WHO guideline value. In the Asian databases consulted, only Japan showed really low figures. Surface ozone levels presents average values that exceed the selected guideline values in all of the analysis by regions, income level and number of inhabitants, demonstrating that this is a global problem with consequences for rich and poor countries, large and medium cities and all the regions.
www.intechopen.com
Air Pollution in Mega Cities: A Case Study of Istanbul
81
Gurjar et al. (2008) examined the emissions and air quality pertaining to the megacities. He and his colleagues ranked megacities in terms of their trace gas and particle emissions and ambient air quality, based on the newly proposed multi-pollutant index (MPI) which considers the combined level of the three criterion pollutants (TSP, SO2 and NO2) in view of the World Health Organization (WHO) guidelines for air quality. Simulations of the export of air pollution from megacities to downwind locations via long-range transport (LRT) have shown different transport patterns depending on the megacity location: in the tropics export is occurring mostly via the free troposphere, whereas at mid and high latitudes it occurs within the lowest troposphere (Lawrence et al., 2007). Butler & Lawrence (2009) simulated small impacts of megacities on the oxidizing capacity of the atmosphere and larger on reactive nitrogen species on global scale. They also pointed out the need of parameterization of the sub-grid effects of megacities. Butler et al. (2008) analyzed different emission inventories and found substantial differences in emission’s geographical distribution within countries even if the country total emissions are the same. They also reported large differences in the contribution of various sectors to the total emissions from each city.
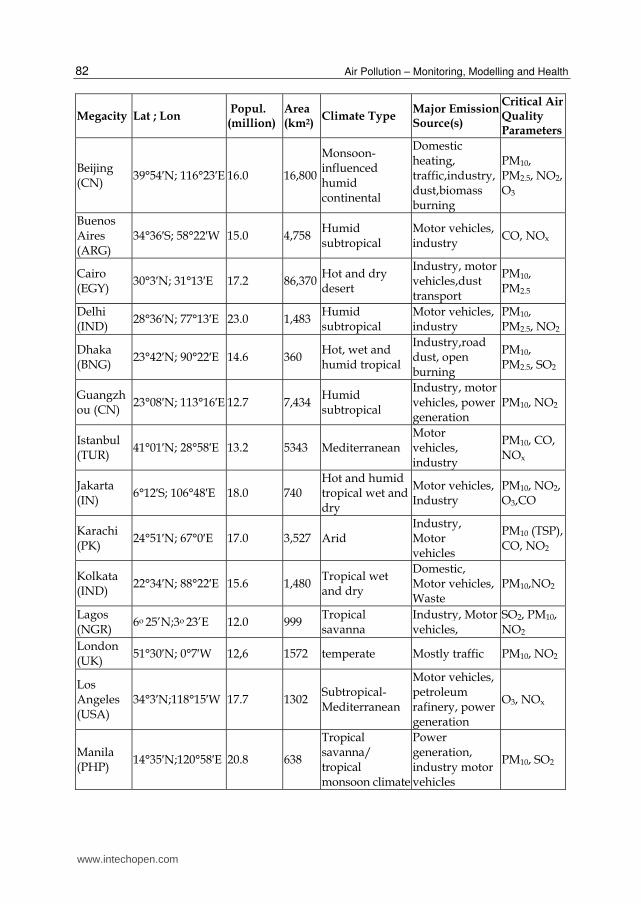
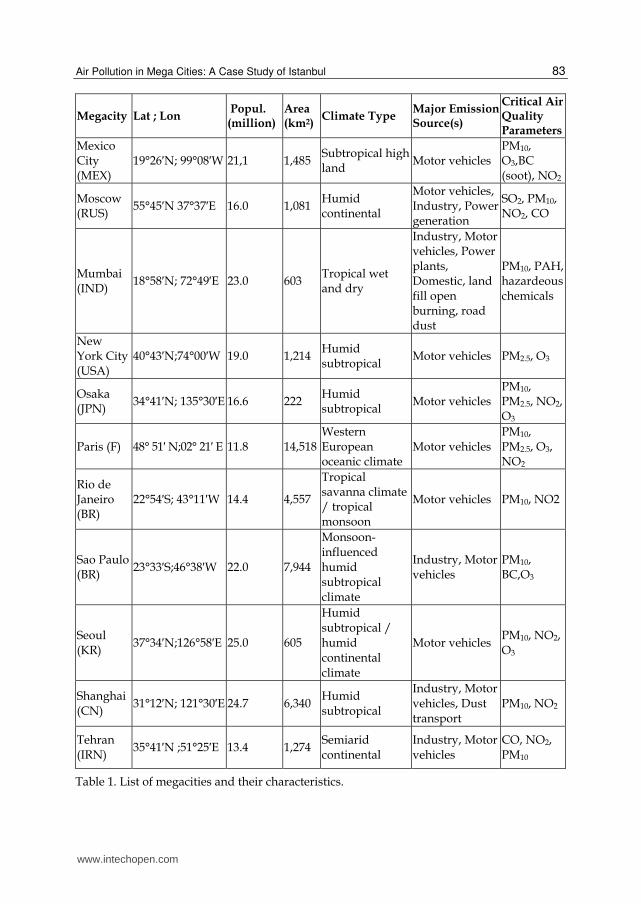
Table 1 presents the megacities with their location, climate type, major emissions and critical air quality parameters. As seen in Table 1, there is a significant geographical variation in domestic heating emissions. Specifically, particulate matter is a major problem in almost all of Asian and Latin cities. In all of the megacities, emissions from the motor vehicles are a major contributor of harmful pollutants such as nitrogen oxides and particulate matter. The most important source for the classical pollutants such as particular matter, sulfur dioxide, nitrogen oxides, carbon monoxide, and volatile organic compounds are combustion of fossil fuels.
3. Megacity of Beijing
Beijing (39°54′N; 116°23′E), the capital of China, has completed its third decade of economic development known as the Economic Reform and Open Policy starting in 1978, and is a rapidly developing megacity with a 16 million population (Fang et al., 2009). As it’s the capital city, Beijing continues to experience substantial growth in population, economic activity, business, travel and tourism. The city is situated at the northern tip of the roughly triangular North China Plain, which opens to the south and east of the city. Mountains to the north, northwest and west shield the city and northern China's agricultural areas from the desert steppes. Beijing has been experiencing severe anthropogenic air pollution problems since 1980s due to the significant energy consumption depending on developments of the city. Furthermore, natural sources have a significant impact on the city environment such as dust transport from the northern parts of the city. This leads to polluted smog covering the city as a thick blanket under specific meteorological conditions.
3.1 Climate
Beijing is in a warm temperate zone and has a typical monsoon–influenced humid continental climate with four distinct seasons. It is usually characterized by hot and humid summers and dry winters.
www.intechopen.com
Air Pollution – Monitoring, Modelling and Health
82
Megacity Lat ; Lon Popul. (million)
Area (km2)
Climate Type Major Emission Source(s)
Critical Air Quality Parameters
Beijing (CN)
39°54′N; 116°23′E 16.0 16,800
Monsoon-influenced humid continental
Domestic heating, traffic,industry, dust,biomass burning
PM10, PM2.5, NO2, O3
Buenos Aires (ARG)
34°36′S; 58°22′W 15.0 4,758 Humid subtropical
Motor vehicles, industry
CO, NOx
Cairo (EGY)
30°3′N; 31°13′E 17.2 86,370Hot and dry desert
Industry, motor vehicles,dust transport
PM10, PM2.5
Delhi (IND)
28°36′N; 77°13′E 23.0 1,483 Humid subtropical
Motor vehicles, industry
PM10, PM2.5, NO2
Dhaka (BNG)
23°42′N; 90°22′E 14.6 360 Hot, wet and humid tropical
Industry,road dust, open burning
PM10, PM2.5, SO2
Guangzhou (CN)
23°08′N; 113°16′E 12.7 7,434 Humid subtropical
Industry, motor vehicles, power generation
PM10, NO2
Istanbul (TUR)
41°01′N; 28°58′E 13.2 5343 Mediterranean Motor vehicles, industry
PM10, CO, NOx
Jakarta (IN)
6°12′S; 106°48′E 18.0 740 Hot and humid tropical wet and dry
Motor vehicles, Industry
PM10, NO2, O3,CO
Karachi (PK)
24°51′N; 67°0′E 17.0 3,527 Arid Industry, Motor vehicles
PM10 (TSP), CO, NO2
Kolkata (IND)
22°34′N; 88°22′E 15.6 1,480 Tropical wet and dry
Domestic, Motor vehicles, Waste
PM10,NO2
Lagos (NGR)
6o 25’N;3o 23’E 12.0 999 Tropical savanna
Industry, Motor vehicles,
SO2, PM10, NO2
London (UK)
51°30′N; 0°7′W 12,6 1572 temperate Mostly traffic PM10, NO2
Los Angeles (USA)
34°3′N;118°15′W 17.7 1302 Subtropical-Mediterranean
Motor vehicles, petroleum rafinery, power generation
O3, NOx
Manila (PHP)
14°35′N;120°58′E 20.8 638
Tropical savanna/ tropical monsoon climate
Power generation, industry motor vehicles
PM10, SO2
www.intechopen.com
Air Pollution in Mega Cities: A Case Study of Istanbul
83
Megacity Lat ; Lon Popul. (million)
Area (km2)
Climate Type Major Emission Source(s)
Critical Air Quality Parameters
Mexico City (MEX)
19°26′N; 99°08′W 21,1 1,485 Subtropical high land
Motor vehicles PM10, O3,BC (soot), NO2
Moscow (RUS)
55°45′N 37°37′E 16.0 1,081 Humid continental
Motor vehicles, Industry, Power generation
SO2, PM10, NO2, CO
Mumbai (IND)
18°58′N; 72°49′E 23.0 603 Tropical wet and dry
Industry, Motor vehicles, Power plants, Domestic, land fill open burning, road dust
PM10, PAH, hazardeous chemicals
New York City (USA)
40°43′N;74°00′W 19.0 1,214 Humid subtropical
Motor vehicles PM2.5, O3
Osaka (JPN)
34°41′N; 135°30′E 16.6 222 Humid subtropical
Motor vehicles PM10, PM2.5, NO2, O3
Paris (F) 48° 51′ N;02° 21′ E 11.8 14,518Western European oceanic climate
Motor vehicles PM10, PM2.5, O3, NO2
Rio de Janeiro (BR)
22°54′S; 43°11′W 14.4 4,557
Tropical savanna climate / tropical monsoon
Motor vehicles PM10, NO2
Sao Paulo (BR)
23°33′S;46°38′W 22.0 7,944
Monsoon-influenced humid subtropical climate
Industry, Motor vehicles
PM10, BC,O3
Seoul (KR)
37°34′N;126°58′E 25.0 605
Humid subtropical / humid continental climate
Motor vehicles PM10, NO2, O3
Shanghai (CN)
31°12′N; 121°30′E 24.7 6,340 Humid subtropical
Industry, Motor vehicles, Dust transport
PM10, NO2
Tehran (IRN)
35°41′N ;51°25′E 13.4 1,274 Semiarid continental
Industry, Motor vehicles
CO, NO2, PM10
Table 1. List of megacities and their characteristics.
www.intechopen.com

Air Pollution – Monitoring, Modelling and Health
84
3.2 Air pollution sources
The major anthropogenic emission sources in Beijing are domestic heating, traffic and industry. Coal dominated energy structure is also one of the major causes of air pollution in Beijing (Hao, et al., 2007). As an example to the total emissions from energy production sector of 16.0 GWh/y, Hao et al. (2007) calculated a 102,497 t/y of SO2, 60,567 t/y of NOx and 11,633 t/y of PM10. Domestic heating in Beijing usually starts in mid-November and ends in the following March and it is the major source for SO2 in the winter season (Chan and Yao, 2008; Hao et al., 2005). Furthermore, industrial emissions emitted from Shijingshan region, located west of Beijing, are significant sources of particulate matter in Beijing. Beijing experiences a serious urban sprawl which has been claimed to be a major factor leading to the need for long-distance travel, congestion in the city centre and private vehicle usage problem (Zhao, et al., 2010; Deng & Huang, 2004). The number of cars in Beijing has grown rapidly and reached to 4.76 million vehicles in 2011, up from 1.5 million in 2000 and 2.6 million in 2005, according to official statistics provided by the municipal transportation authorities. Particulate matter emitted from motor vehicles and re-suspension of road dust are also likely contributors to PM10 pollution in the city (Song et al., 2006). Last but not least, natural dust originating from the erosion of deserts in northern and northwestern China results in seasonal dust storms that plague the city.
3.3 Air quality in Beijing
Beijing is party to the Standard Ambient Air Quality Standards (GB 3095-1996), which sets limits for SO2, CO, PM10 and nitrogen dioxide (NO2). The Chinese air quality standards set separate limits for different types of areas such as Class I, II and III based on physical characteristics of the region such as natural conservation areas and special industrial areas. Beijing is designated as a Class II area, which applies to residential, mixed commercial/ residential, cultural, industrial, and rural areas.
TSP and SO2 have been the major pollutants in China for a long time due to the fossil fuel burning from power plants, industry and domestic heating. However, in recent years, the Chinese Government have planned to reveal a major environmental plan to help managing air pollution and is expected to include efforts to reduce pollution through new regulations and strategies including taxes and investments in this field. As an example, energy-related measures include fuel substitution and flue gas desulfurization facilities, which were built at the coal fired power plants, control measures such as energy efficiency and fuel use and dust control improvements (Hao et al. 2007). Initiatives have also been implemented in Beijing. The use of natural gas has been increased four-fold from 2000 as a result of efforts made to replace coal fired boilers and family stoves to use natural gas, and coal heating with electrical heating. As a result of these initiatives, from 1990 to 1999, the annual average TSP concentration in 100 major cities decreased by 30% to 256 μg/m3 and it remained almost constant from 1999 to 2003 (Sinton et al., 2004), despite an overall decrease of 30% in total energy consumption from 1997 to 2002. Fang et al. (2009) examined the air quality management in China and the changing air quality levels with their reasons. The results of the new strategies in Beijing are seen in Fig.2. In 1998, Beijing started its phased intensive control program to fight air pollution. PM10 concentrations increased by around 10% from 2003 to 2006 because of the increase in coal-fired boiler emissions, construction activities and dust storms (United Nations Environment Program, 2007). The annual PM10 concentrations
www.intechopen.com
Air Pollution in Mega Cities: A Case Study of Istanbul
85
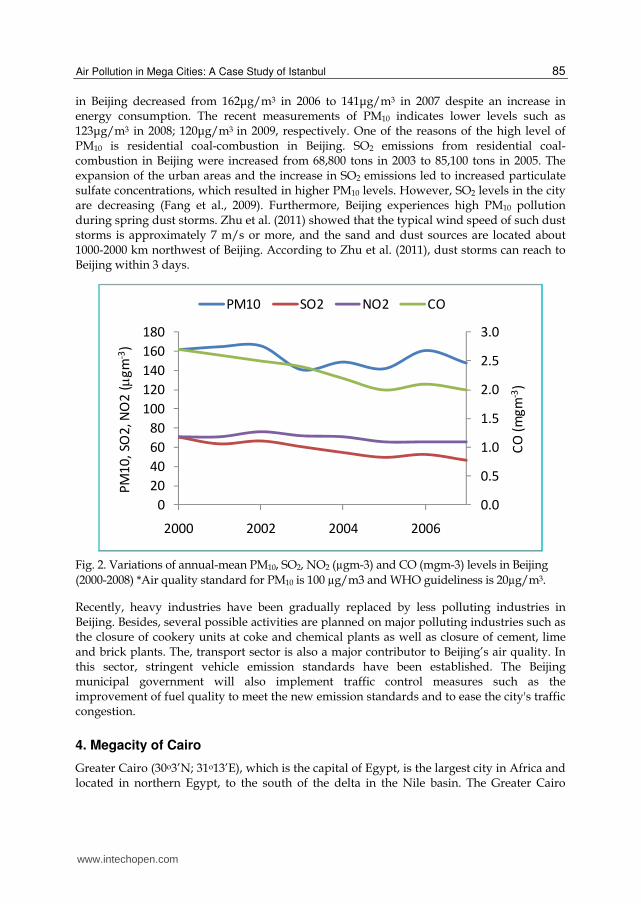
in Beijing decreased from 162μg/m3 in 2006 to 141μg/m3 in 2007 despite an increase in energy consumption. The recent measurements of PM10 indicates lower levels such as 123μg/m3 in 2008; 120μg/m3 in 2009, respectively. One of the reasons of the high level of PM10 is residential coal-combustion in Beijing. SO2 emissions from residential coal-combustion in Beijing were increased from 68,800 tons in 2003 to 85,100 tons in 2005. The expansion of the urban areas and the increase in SO2 emissions led to increased particulate sulfate concentrations, which resulted in higher PM10 levels. However, SO2 levels in the city are decreasing (Fang et al., 2009). Furthermore, Beijing experiences high PM10 pollution during spring dust storms. Zhu et al. (2011) showed that the typical wind speed of such dust storms is approximately 7 m/s or more, and the sand and dust sources are located about 1000-2000 km northwest of Beijing. According to Zhu et al. (2011), dust storms can reach to Beijing within 3 days.
0.0
0.5
1.0
1.5
2.0
2.5
3.0
0
20
40
60
80
100
120
140
160
180
2000 2002 2004 2006C
O (
mg
m-3
)
PM
10
, SO
2, N
O2
(gm
-3)
PM10 SO2 NO2 CO
Fig. 2. Variations of annual-mean PM10, SO2, NO2 (µgm-3) and CO (mgm-3) levels in Beijing (2000-2008) *Air quality standard for PM10 is 100 µg/m3 and WHO guideliness is 20µg/m3.
Recently, heavy industries have been gradually replaced by less polluting industries in Beijing. Besides, several possible activities are planned on major polluting industries such as the closure of cookery units at coke and chemical plants as well as closure of cement, lime and brick plants. The, transport sector is also a major contributor to Beijing’s air quality. In this sector, stringent vehicle emission standards have been established. The Beijing municipal government will also implement traffic control measures such as the improvement of fuel quality to meet the new emission standards and to ease the city's traffic congestion.
4. Megacity of Cairo
Greater Cairo (30o3’N; 31o13’E), which is the capital of Egypt, is the largest city in Africa and located in northern Egypt, to the south of the delta in the Nile basin. The Greater Cairo
www.intechopen.com
Air Pollution – Monitoring, Modelling and Health
86
consists of Cario, Giza and Kalubia, and has a population of about 17 million inhabitants. The city which about one-third of Egypt’s population and 60% of its industry and is one of the world’s most densely populated cities. Gurjar, (2009) and Decker et al., (2000) reported that Cairo’s population is confined in 214 km2 area making it the most densely populated megacity. The urbanization and industrialzation have increased very rapidly in Greater Cairo, particularly in the second half of the last century.
4.1 Climate
The climate in Cairo and along the Nile River Valley is characterized by a hot, dry desert climate. Wind storms can be frequent, bringing Saharan dust into the city during the spring. Abu-Allaban et al. (2002; 2007 and 2009) reported that wind speeds in wintertime is weaker than during summer, implying a lower ventilation of the area during winter that could favor pollutant accumulation in the vicinity of the sources. Additionally, Safar and Lebib (2010) indicated that the arid climate in the city causes a persistent high background PM level in the Cairo area.
4.2 Air pollutant emissions
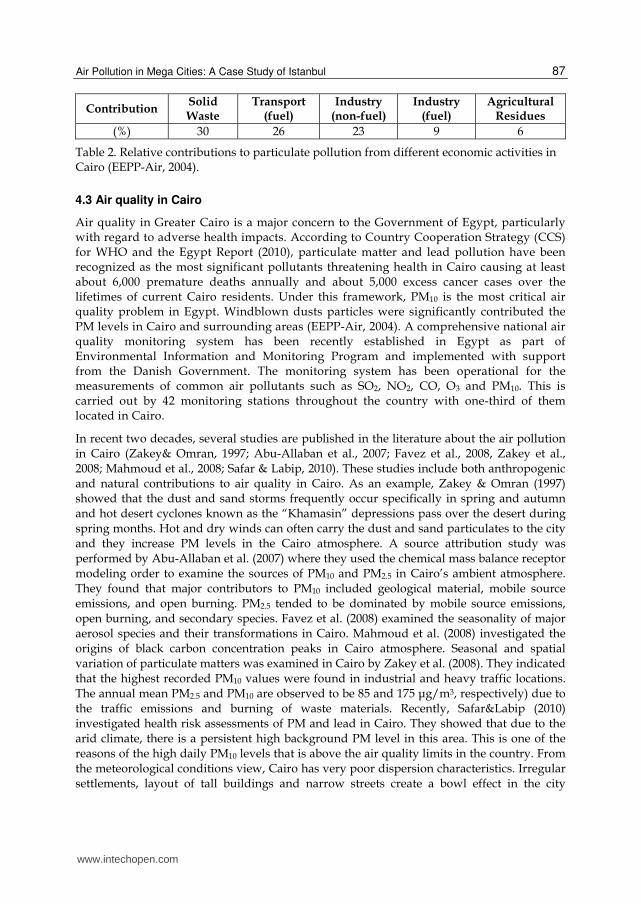
The air pollution in Cairo is a matter of serious concern. The major emissions in the city come from industry and motor vehicles which cause high ambient concentrations of PM, SO2, NOx and CO. There are over 4.5 million cars on the streets of Cairo according to recent records. The relative contribution to particulate pollution from different economic activities is shown in Table 2. As seen in the table, the major contribution to the particulate load is urban solid waste burning by 30%. Transport and industry follows the solid waste by 26% and 23%, respectively. Kanakidou et al. (2011) summarized a comprehensive overview of the actual knowledge on the atmospheric pollutant sources, and the levels in the Eastern Mediterranean cities including Cairo. The annual sectoral distribution of pollutants are calculated for Cairo based on 2005 year as the reference year. Road transport and residential activities are important sources of PM and responsible for almost 35.9% and 53.4% of the PM10 emissions, respectively. Industrial activities have a major part for the SO2 with 71.5% (Kanakidou et al., 2011). Furthermore, a typical black cloud appears over Cairo and rural regions of the Nile Delta in every fall due to biomass burning. It is found that this event is a major contributor to the local air quality. Molina and Molina (2004) explained the black cloud in Cairo during fall season based on the open burning of agricultural waste (mostly burning of rice harvest by farmers to clear fields for the next harvest in rural areas of Nile Delta). Additionally, traffic, industrial emissions and secondary aerosols was attributed to the black cloud events. Prasat et al. (2010) indicated the long range transport of dust at high altitudes (2.5–6 km) from Western Sahara and its deposition over the Nile Delta region. New evidence of the desert dust transported from Western Sahara to Nile Delta during black cloud season and its significance for regional aerosols have potential impact on the regional climate. Recently, the European Investment Bank approved a 90,000 EURO grant in order to investigate methods to reduce the burning of rice straw, which is thought to be one of the potential sources of these clouds (UN and League of Arap States Report, 2006). In addition to all, Cairo is the only city in Africa having a metro system (about 42 km length and carrying 60,000 passengers per hour in each direction).
www.intechopen.com
Air Pollution in Mega Cities: A Case Study of Istanbul
87
Contribution Solid Waste
Transport (fuel)
Industry (non-fuel)
Industry (fuel)
Agricultural Residues
(%) 30 26 23 9 6
Table 2. Relative contributions to particulate pollution from different economic activities in Cairo (EEPP-Air, 2004).
4.3 Air quality in Cairo
Air quality in Greater Cairo is a major concern to the Government of Egypt, particularly with regard to adverse health impacts. According to Country Cooperation Strategy (CCS) for WHO and the Egypt Report (2010), particulate matter and lead pollution have been recognized as the most significant pollutants threatening health in Cairo causing at least about 6,000 premature deaths annually and about 5,000 excess cancer cases over the lifetimes of current Cairo residents. Under this framework, PM10 is the most critical air quality problem in Egypt. Windblown dusts particles were significantly contributed the PM levels in Cairo and surrounding areas (EEPP-Air, 2004). A comprehensive national air quality monitoring system has been recently established in Egypt as part of Environmental Information and Monitoring Program and implemented with support from the Danish Government. The monitoring system has been operational for the measurements of common air pollutants such as SO2, NO2, CO, O3 and PM10. This is carried out by 42 monitoring stations throughout the country with one-third of them located in Cairo.
In recent two decades, several studies are published in the literature about the air pollution in Cairo (Zakey& Omran, 1997; Abu-Allaban et al., 2007; Favez et al., 2008, Zakey et al., 2008; Mahmoud et al., 2008; Safar & Labip, 2010). These studies include both anthropogenic and natural contributions to air quality in Cairo. As an example, Zakey & Omran (1997) showed that the dust and sand storms frequently occur specifically in spring and autumn and hot desert cyclones known as the “Khamasin” depressions pass over the desert during spring months. Hot and dry winds can often carry the dust and sand particulates to the city and they increase PM levels in the Cairo atmosphere. A source attribution study was performed by Abu-Allaban et al. (2007) where they used the chemical mass balance receptor modeling order to examine the sources of PM10 and PM2.5 in Cairo’s ambient atmosphere. They found that major contributors to PM10 included geological material, mobile source emissions, and open burning. PM2.5 tended to be dominated by mobile source emissions, open burning, and secondary species. Favez et al. (2008) examined the seasonality of major aerosol species and their transformations in Cairo. Mahmoud et al. (2008) investigated the origins of black carbon concentration peaks in Cairo atmosphere. Seasonal and spatial variation of particulate matters was examined in Cairo by Zakey et al. (2008). They indicated that the highest recorded PM10 values were found in industrial and heavy traffic locations. The annual mean PM2.5 and PM10 are observed to be 85 and 175 μg/m3, respectively) due to the traffic emissions and burning of waste materials. Recently, Safar&Labip (2010) investigated health risk assessments of PM and lead in Cairo. They showed that due to the arid climate, there is a persistent high background PM level in this area. This is one of the reasons of the high daily PM10 levels that is above the air quality limits in the country. From the meteorological conditions view, Cairo has very poor dispersion characteristics. Irregular settlements, layout of tall buildings and narrow streets create a bowl effect in the city
www.intechopen.com
Air Pollution – Monitoring, Modelling and Health
88
environment. The high levels of lead were recorded in the major Egyptian cities. Safar&Labip (2010) explained that the lead levels in Cairo are among the highest in the world. The maximum annual average concentration of lead is found in the Shoubra Kheima industrialized region due to the lead smelters in this area during the period of 1998 through 2007. The highest annual average Pb levels recorded were 26.2 and 25.4 μg/m3 at the Shoubra Kheima and El Sahel monitoring stations, respectively, during the baseline year (October 98 to September 99). The annual average Pb levels have been gradually decreased when the lead smelters in the area were closed and moved to the industrial area of Abou Zaabal. CCS (2010) report indicated that lead was completely phased out from petrol distributed in Cairo, Alexandria and most of the cities of Lower Egypt in late 1997, and consequently, lead concentration in the atmosphere of Cairo city centre and residential areas gradually decreased. Surface ozone levels were also examined in Cairo. Gusten et al. (1994) studied the ozone formation in the Greater Cairo in 1990. The peak values of 120 ppb and daily mean value of 50 ppb throughout the year indicate a substantial contribution of photochemistry to the ozone content of the atmosphere. It is estimated that the ozone is produced predominantly over the industrial area in the north and in the centre of Cairo and transported southward by the prevailing northerly winds. Contrary to many urban areas in Europe and in North America, fairly high average ozone levels of 40 ppb are observed during the night throughout the spring and the summer. This may imply that health hazards and crop damage may be higher in the greater Cairo area than in Central Europe. Recently, Mi (2009) examined the diurnal, seasonal and weekdays-weekends variations of ground level ozone concentrations in an urban area in Greater Cairo (Haram, Giza). He found that the daytime (8-h) mean values of wintertime and summertime O3 were 44 ppb and 91 ppb, respectively. Besides, he reported that the highest levels of NOx were found in winter. The concentrations of O3 precursors (NO and NO2) in weekends were lower than those found in weekdays, whereas the O3 levels during the weekends were high compared with weekdays.
In order to enhance the air quality in Cairo atmosphere, there are several efforts under the new strategy by the Government such as switching to natural gas in industrial, residential and transport sectors. Policies to remove old fleet of vehicles from the streets and to promote public transport especially through the expansion of underground metro, enhancement of solid waste management, banning of the open air burning of solid waste are also among the major strategies.
5. Megacity of Delhi
Delhi (28o36’N; 77o13’E) is the second largest metropolitan in India. The name Delhi is often used to refer both to the urban areas near the National Capital Territory of Delhi and New Delhi, the capital of India, which is surrounded by other major urban agglomerations of adjoining states such as Haryana and Uttar Pradesh (National Summary Report, 2010). The National Capital Territory of Delhi is spread over an area of 1484 km2. There are three local bodies in Delhi. Municipal Corporation of Delhi which is the major one has an area of 1397 km2 and the two small areas are New Delhi Municipal Committee and Delhi Cantonment Board. Its population has increased from 9.4 million in 1991 to 18.9 million in 2010. Presently, about 30% of the population lives in squatter settlements. The number of industrial units in Delhi in 1951 was approximately 8,000. By 1991 this number had
www.intechopen.com
Air Pollution in Mega Cities: A Case Study of Istanbul
89
increased to more than 125,000. The vehicular population has increased phenomenally, from 235,000 in 1975 to 2,629,000 in 1996, and closed to touch 6 million in 2011. In 1975 the vehicular population in Delhi and Mumbai was about the same; today Delhi has three times more vehicles than Mumbai.
5.1 Climate
The climate of Delhi is a monsoon-influenced humid subtropical climate with an extremely hot summer, and cold winters. Delhi has relatively dry winters and has a prolonged spell of very hot weather. Delhi usually experiences surface inversions and heavy fog events during the winter season. This leads to restriction of dilution of the emissions from specifically motor vehicles and episodic events in Delhi. In December, reduced visibility leads to disruption of road, air and rail traffic. Molina & Molina (2004) explained that during summer, large amounts of wind-blown dust carried by strong westerly winds from the Thar Desert result in elevated PM levels. These dust storm periods are followed by the monsoon season (July to mid-September), which is the least polluted season due to the heavy monsoon rains that wash out the pollutants.
5.2 Air pollution sources
The major air pollution sources in Delhi are motor vehicles and industry. The number of industrial units in Delhi increased from 8,000 in 1951 to 125,000 in 1991 while automobile vehicles increased from 235,000 in 1975 to 4,5 million in 2004 (Government of India, 2006). The vehicular pollution contributes 67% of the total air pollution load (approx.3 Mt per day) in Delhi and its sharing is rapidly growing (Narain & Krupnick, 2007). The 25% of air pollution is generated by industry and coal based thermal power plants. The three power plants in Delhi generate approximately 6,000 Mt of fly ash per day. Industrial effluent load is about 320 Mt per day. Municipal solid waste generation is also estimated to be 5,000 Mt per day.
5.3 Air quality in Delhi
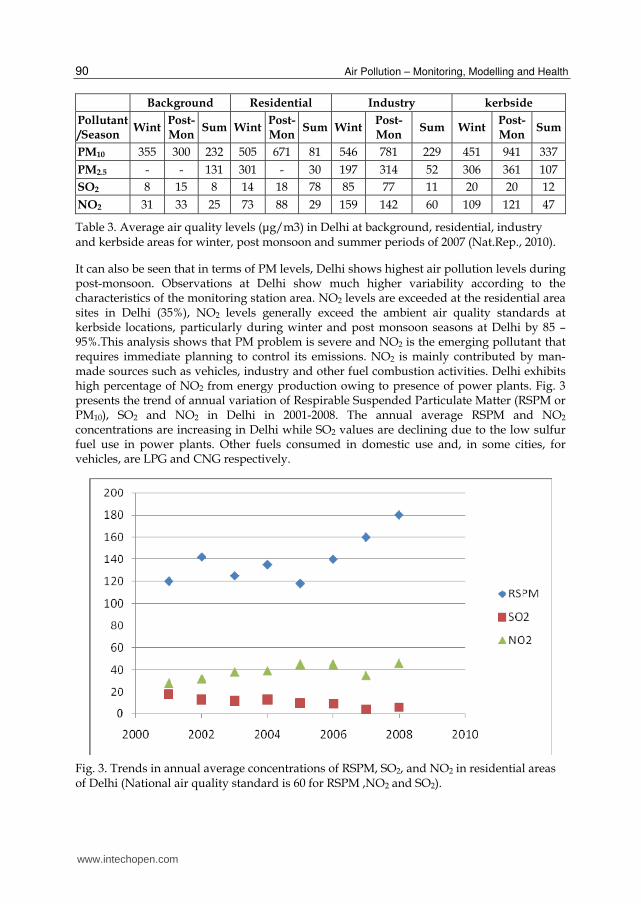
Delhi is the fourth most polluted megacity in the world. Air quality in Delhi is poor and airborne concentrations of major air pollutants frequently exceed National Ambient Air Quality Standards (NAAQS) set by India’s Central Pollution Control Board (CPCB) (The Ministry of Environment and Forests, National Ambient Air Quality Standards 2009) A number of studies have analyzed air pollution data for Delhi. Delhi’s annual mean PM10 concentration is highest among major Asian cities, and was between three and four times the Indian standard during 2001–2004 (HEI, 2004). A summary of PM10, PM2.5, NO2, and SO2 levels for different stations (background, residential, industry and kerbside) and different seasons (winter, post monsoon, and summer) in Delhi is given in Table 3. As seen in Table 3, almost at all locations and in all seasons, standards of PM10 and PM2.5 have been exceeded (except for the industrial area). Even the background locations are highly polluted because these locations also fall within the city area and are impacted from the city emissions. PM10 contribution is mainly originated from heavy duty diesel vehicles.
www.intechopen.com
Air Pollution – Monitoring, Modelling and Health
90
Background Residential Industry kerbside
Pollutant/Season
Wint Post-Mon
Sum WintPost-Mon
Sum WintPost-Mon
Sum WintPost-Mon
Sum
PM10 355 300 232 505 671 81 546 781 229 451 941 337
PM2.5 - - 131 301 - 30 197 314 52 306 361 107
SO2 8 15 8 14 18 78 85 77 11 20 20 12
NO2 31 33 25 73 88 29 159 142 60 109 121 47
Table 3. Average air quality levels (μg/m3) in Delhi at background, residential, industry and kerbside areas for winter, post monsoon and summer periods of 2007 (Nat.Rep., 2010).
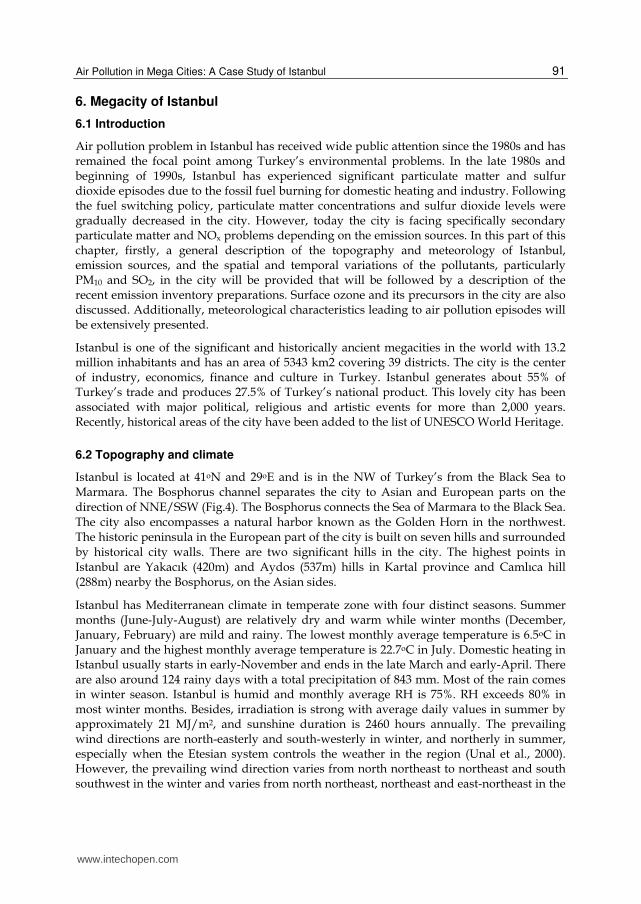
It can also be seen that in terms of PM levels, Delhi shows highest air pollution levels during post-monsoon. Observations at Delhi show much higher variability according to the characteristics of the monitoring station area. NO2 levels are exceeded at the residential area sites in Delhi (35%), NO2 levels generally exceed the ambient air quality standards at kerbside locations, particularly during winter and post monsoon seasons at Delhi by 85 – 95%.This analysis shows that PM problem is severe and NO2 is the emerging pollutant that requires immediate planning to control its emissions. NO2 is mainly contributed by man-made sources such as vehicles, industry and other fuel combustion activities. Delhi exhibits high percentage of NO2 from energy production owing to presence of power plants. Fig. 3 presents the trend of annual variation of Respirable Suspended Particulate Matter (RSPM or PM10), SO2 and NO2 in Delhi in 2001-2008. The annual average RSPM and NO2 concentrations are increasing in Delhi while SO2 values are declining due to the low sulfur fuel use in power plants. Other fuels consumed in domestic use and, in some cities, for vehicles, are LPG and CNG respectively.
Fig. 3. Trends in annual average concentrations of RSPM, SO2, and NO2 in residential areas of Delhi (National air quality standard is 60 for RSPM ,NO2 and SO2).
www.intechopen.com
Air Pollution in Mega Cities: A Case Study of Istanbul
91
6. Megacity of Istanbul
6.1 Introduction
Air pollution problem in Istanbul has received wide public attention since the 1980s and has remained the focal point among Turkey’s environmental problems. In the late 1980s and beginning of 1990s, Istanbul has experienced significant particulate matter and sulfur dioxide episodes due to the fossil fuel burning for domestic heating and industry. Following the fuel switching policy, particulate matter concentrations and sulfur dioxide levels were gradually decreased in the city. However, today the city is facing specifically secondary particulate matter and NOx problems depending on the emission sources. In this part of this chapter, firstly, a general description of the topography and meteorology of Istanbul, emission sources, and the spatial and temporal variations of the pollutants, particularly PM10 and SO2, in the city will be provided that will be followed by a description of the recent emission inventory preparations. Surface ozone and its precursors in the city are also discussed. Additionally, meteorological characteristics leading to air pollution episodes will be extensively presented.
Istanbul is one of the significant and historically ancient megacities in the world with 13.2 million inhabitants and has an area of 5343 km2 covering 39 districts. The city is the center of industry, economics, finance and culture in Turkey. Istanbul generates about 55% of Turkey’s trade and produces 27.5% of Turkey’s national product. This lovely city has been associated with major political, religious and artistic events for more than 2,000 years. Recently, historical areas of the city have been added to the list of UNESCO World Heritage.
6.2 Topography and climate
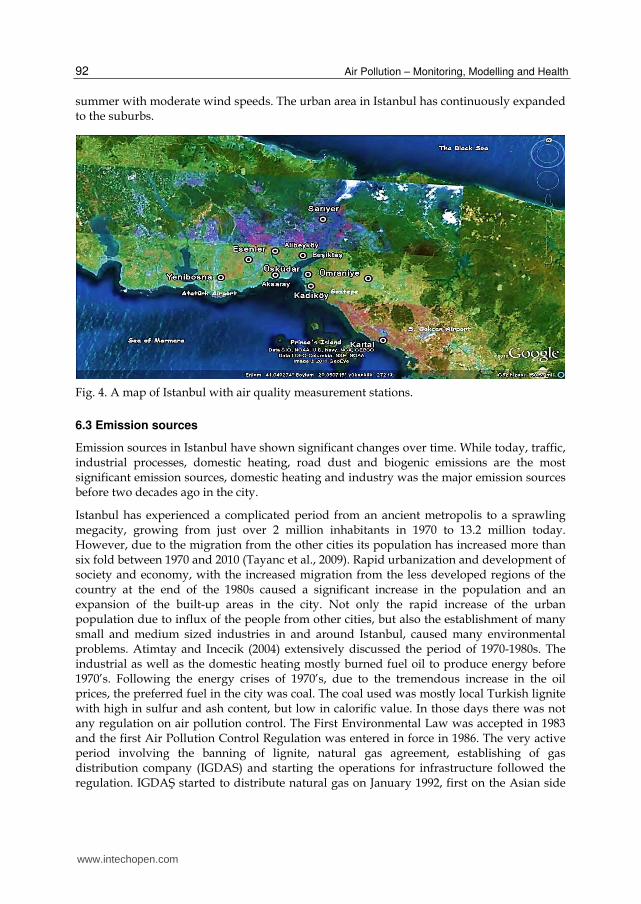
Istanbul is located at 41oN and 29oE and is in the NW of Turkey’s from the Black Sea to Marmara. The Bosphorus channel separates the city to Asian and European parts on the direction of NNE/SSW (Fig.4). The Bosphorus connects the Sea of Marmara to the Black Sea. The city also encompasses a natural harbor known as the Golden Horn in the northwest. The historic peninsula in the European part of the city is built on seven hills and surrounded by historical city walls. There are two significant hills in the city. The highest points in Istanbul are Yakacık (420m) and Aydos (537m) hills in Kartal province and Camlıca hill (288m) nearby the Bosphorus, on the Asian sides.
Istanbul has Mediterranean climate in temperate zone with four distinct seasons. Summer months (June-July-August) are relatively dry and warm while winter months (December, January, February) are mild and rainy. The lowest monthly average temperature is 6.5oC in January and the highest monthly average temperature is 22.7oC in July. Domestic heating in Istanbul usually starts in early-November and ends in the late March and early-April. There are also around 124 rainy days with a total precipitation of 843 mm. Most of the rain comes in winter season. Istanbul is humid and monthly average RH is 75%. RH exceeds 80% in most winter months. Besides, irradiation is strong with average daily values in summer by approximately 21 MJ/m2, and sunshine duration is 2460 hours annually. The prevailing wind directions are north-easterly and south-westerly in winter, and northerly in summer, especially when the Etesian system controls the weather in the region (Unal et al., 2000). However, the prevailing wind direction varies from north northeast to northeast and south southwest in the winter and varies from north northeast, northeast and east-northeast in the
www.intechopen.com
Air Pollution – Monitoring, Modelling and Health
92
summer with moderate wind speeds. The urban area in Istanbul has continuously expanded to the suburbs.
Fig. 4. A map of Istanbul with air quality measurement stations.
6.3 Emission sources
Emission sources in Istanbul have shown significant changes over time. While today, traffic, industrial processes, domestic heating, road dust and biogenic emissions are the most significant emission sources, domestic heating and industry was the major emission sources before two decades ago in the city.
Istanbul has experienced a complicated period from an ancient metropolis to a sprawling megacity, growing from just over 2 million inhabitants in 1970 to 13.2 million today. However, due to the migration from the other cities its population has increased more than six fold between 1970 and 2010 (Tayanc et al., 2009). Rapid urbanization and development of society and economy, with the increased migration from the less developed regions of the country at the end of the 1980s caused a significant increase in the population and an expansion of the built-up areas in the city. Not only the rapid increase of the urban population due to influx of the people from other cities, but also the establishment of many small and medium sized industries in and around Istanbul, caused many environmental problems. Atimtay and Incecik (2004) extensively discussed the period of 1970-1980s. The industrial as well as the domestic heating mostly burned fuel oil to produce energy before 1970’s. Following the energy crises of 1970’s, due to the tremendous increase in the oil prices, the preferred fuel in the city was coal. The coal used was mostly local Turkish lignite with high in sulfur and ash content, but low in calorific value. In those days there was not any regulation on air pollution control. The First Environmental Law was accepted in 1983 and the first Air Pollution Control Regulation was entered in force in 1986. The very active period involving the banning of lignite, natural gas agreement, establishing of gas distribution company (IGDAS) and starting the operations for infrastructure followed the regulation. IGDAŞ started to distribute natural gas on January 1992, first on the Asian side
www.intechopen.com
Air Pollution in Mega Cities: A Case Study of Istanbul
93
of the city and then expanded to the metropolitan area (Atimtay&Incecik, 2004). Today 95% of the total gas is used for domestic heating and industry purposes.
As one of the major emission sources, traffic was the secondary source in 1980s. Following 1980s the number of motor vehicles on Istanbul’s streets has increased even faster than its population growing since 1980. It was only about 0.3 million cars in 1980, but now it is closing three million (about 2.72 million vehicles are registered based on the 2010 figures). Every day more than 700 new cars enter to the Istanbul streets. About 60% of these vehicles are operated by gasoline and 40% by diesel. PM10 emissions on traffic originate from diesel vehicles rather than the gasoline powered ones. Besides, most of the heavy vehicles, such as buses and commercial vehicles in transport and construction sectors, are powered by the diesel system. Furthermore, following the 1999, liquefied petroleum gas has been widely used in traffic. Istanbul Chamber of Industry reported and Im et al., 2006; Kanakidou et al. (2011) used that the low quality solid and liquid fuels with high sulfur content, natural gas and LPG are the most commonly used fuel types in the industrial activities including textile, metal, chemical, food and other industries. Istanbul is on the two transit motorways passing over the city connections between Europe and Asia on the east-west direction by the Bosphorus and Fatih Sultan Mehmet Bridges. The total length of roads and highways has significantly increased from 1980s within three decades while the number of vehicles has increased. The city traffic much more depends on the two bridges in the city. The number of vehicles crossing the two bridges has increased approximately 25% from 2001 (120,000 vehicles) to 2010 (150,000 vehicles) (KGM, 2011). Hence, traffic emissions are elevated significantly within the past decade. Recently, Turkey adopted the Euro 4 standards to reduce vehicular emissions of air pollutants in the beginning of 2009. Istanbul has a metro with 16 km long in the European side and it is still expanding. On the Asian side, a new metro construction continues and is scheduled to be opened in 2013. Furthermore, a Bus Rapid Transit (BRT) system established in 2009 connecting the both side of the city from far west (Avcılar) to Sogutlucesme (Kadikoy) with about 30 km. Istanbul will be connected at soon with an underwater tunnel. The construction is currently in progress and underwater rail tunnel (Marmaray) will be open in 2013.
There are three industrial zones in the city for small and medium-scale industrial operations. They are located at both sides of the city. There are two busy international airports. One is located at the European part (Atatürk Airport) and the other is Sabiha Gokcen Airport at the Asian part (Fig. 4). Atatürk International Airport is ranked 34th in the busiest airports of the world with a passenger traffic of 32.1 million. Sabiha Gokcen Airport serves many domestic and some low-fare international flights, with about 104,000 total aircraft movements annually. Istanbul experiences frequently dust transport coming from the Sahara. Karaca et al. (2009), Celebi et al. (2010) and Kocak et al. (2011) showed that air parcels arriving in Istanbul in the spring months are mainly from the Sahara. Nevertheless, even limited amounts coal is consumed for domestic heating in winter months; it causes significant particular matter pollution problems at some residential areas in the city where mostly illegal squatter settlements are located.
6.4 Emission inventory preparations
Emission inventory has always been a significant problem in Istanbul. In recent decade, there were several efforts on the emission inventory preparations for Istanbul
www.intechopen.com
Air Pollution – Monitoring, Modelling and Health
94
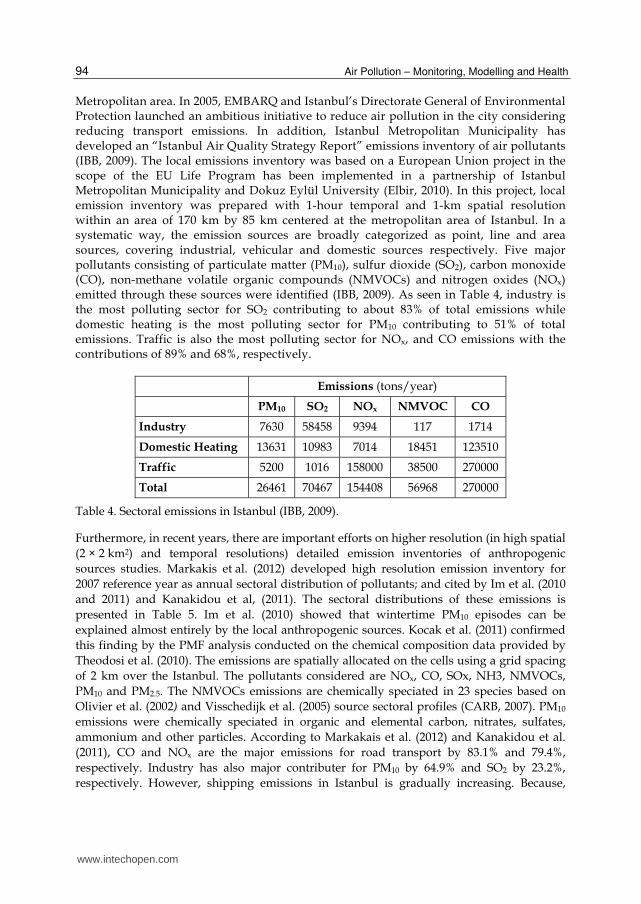
Metropolitan area. In 2005, EMBARQ and Istanbul’s Directorate General of Environmental Protection launched an ambitious initiative to reduce air pollution in the city considering reducing transport emissions. In addition, Istanbul Metropolitan Municipality has developed an “Istanbul Air Quality Strategy Report” emissions inventory of air pollutants (IBB, 2009). The local emissions inventory was based on a European Union project in the scope of the EU Life Program has been implemented in a partnership of Istanbul Metropolitan Municipality and Dokuz Eylül University (Elbir, 2010). In this project, local emission inventory was prepared with 1-hour temporal and 1-km spatial resolution within an area of 170 km by 85 km centered at the metropolitan area of Istanbul. In a systematic way, the emission sources are broadly categorized as point, line and area sources, covering industrial, vehicular and domestic sources respectively. Five major pollutants consisting of particulate matter (PM10), sulfur dioxide (SO2), carbon monoxide (CO), non-methane volatile organic compounds (NMVOCs) and nitrogen oxides (NOx) emitted through these sources were identified (IBB, 2009). As seen in Table 4, industry is the most polluting sector for SO2 contributing to about 83% of total emissions while domestic heating is the most polluting sector for PM10 contributing to 51% of total emissions. Traffic is also the most polluting sector for NOx, and CO emissions with the contributions of 89% and 68%, respectively.
Emissions (tons/year)
PM10 SO2 NOx NMVOC CO
Industry 7630 58458 9394 117 1714
Domestic Heating 13631 10983 7014 18451 123510
Traffic 5200 1016 158000 38500 270000
Total 26461 70467 154408 56968 270000
Table 4. Sectoral emissions in Istanbul (IBB, 2009).
Furthermore, in recent years, there are important efforts on higher resolution (in high spatial (2 × 2 km2) and temporal resolutions) detailed emission inventories of anthropogenic sources studies. Markakis et al. (2012) developed high resolution emission inventory for 2007 reference year as annual sectoral distribution of pollutants; and cited by Im et al. (2010 and 2011) and Kanakidou et al, (2011). The sectoral distributions of these emissions is presented in Table 5. Im et al. (2010) showed that wintertime PM10 episodes can be explained almost entirely by the local anthropogenic sources. Kocak et al. (2011) confirmed this finding by the PMF analysis conducted on the chemical composition data provided by Theodosi et al. (2010). The emissions are spatially allocated on the cells using a grid spacing of 2 km over the Istanbul. The pollutants considered are NOx, CO, SOx, NH3, NMVOCs, PM10 and PM2.5. The NMVOCs emissions are chemically speciated in 23 species based on Olivier et al. (2002) and Visschedijk et al. (2005) source sectoral profiles (CARB, 2007). PM10 emissions were chemically speciated in organic and elemental carbon, nitrates, sulfates, ammonium and other particles. According to Markakais et al. (2012) and Kanakidou et al. (2011), CO and NOx are the major emissions for road transport by 83.1% and 79.4%, respectively. Industry has also major contributer for PM10 by 64.9% and SO2 by 23.2%, respectively. However, shipping emissions in Istanbul is gradually increasing. Because,
www.intechopen.com
Air Pollution in Mega Cities: A Case Study of Istanbul
95
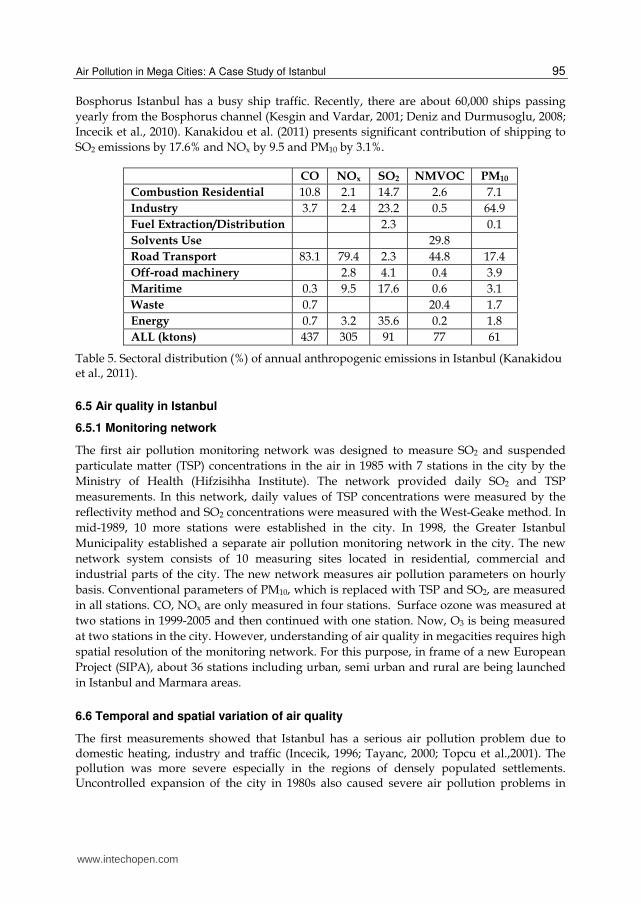
Bosphorus Istanbul has a busy ship traffic. Recently, there are about 60,000 ships passing yearly from the Bosphorus channel (Kesgin and Vardar, 2001; Deniz and Durmusoglu, 2008; Incecik et al., 2010). Kanakidou et al. (2011) presents significant contribution of shipping to SO2 emissions by 17.6% and NOx by 9.5 and PM10 by 3.1%.
CO NOx SO2 NMVOC PM10
Combustion Residential 10.8 2.1 14.7 2.6 7.1 Industry 3.7 2.4 23.2 0.5 64.9 Fuel Extraction/Distribution 2.3 0.1 Solvents Use 29.8 Road Transport 83.1 79.4 2.3 44.8 17.4 Off-road machinery 2.8 4.1 0.4 3.9 Maritime 0.3 9.5 17.6 0.6 3.1 Waste 0.7 20.4 1.7 Energy 0.7 3.2 35.6 0.2 1.8 ALL (ktons) 437 305 91 77 61
Table 5. Sectoral distribution (%) of annual anthropogenic emissions in Istanbul (Kanakidou et al., 2011).
6.5 Air quality in Istanbul
6.5.1 Monitoring network
The first air pollution monitoring network was designed to measure SO2 and suspended particulate matter (TSP) concentrations in the air in 1985 with 7 stations in the city by the Ministry of Health (Hifzisihha Institute). The network provided daily SO2 and TSP measurements. In this network, daily values of TSP concentrations were measured by the reflectivity method and SO2 concentrations were measured with the West-Geake method. In mid-1989, 10 more stations were established in the city. In 1998, the Greater Istanbul Municipality established a separate air pollution monitoring network in the city. The new network system consists of 10 measuring sites located in residential, commercial and industrial parts of the city. The new network measures air pollution parameters on hourly basis. Conventional parameters of PM10, which is replaced with TSP and SO2, are measured in all stations. CO, NOx are only measured in four stations. Surface ozone was measured at two stations in 1999-2005 and then continued with one station. Now, O3 is being measured at two stations in the city. However, understanding of air quality in megacities requires high spatial resolution of the monitoring network. For this purpose, in frame of a new European Project (SIPA), about 36 stations including urban, semi urban and rural are being launched in Istanbul and Marmara areas.
6.6 Temporal and spatial variation of air quality
The first measurements showed that Istanbul has a serious air pollution problem due to domestic heating, industry and traffic (Incecik, 1996; Tayanc, 2000; Topcu et al.,2001). The pollution was more severe especially in the regions of densely populated settlements. Uncontrolled expansion of the city in 1980s also caused severe air pollution problems in
www.intechopen.com
Air Pollution – Monitoring, Modelling and Health
96
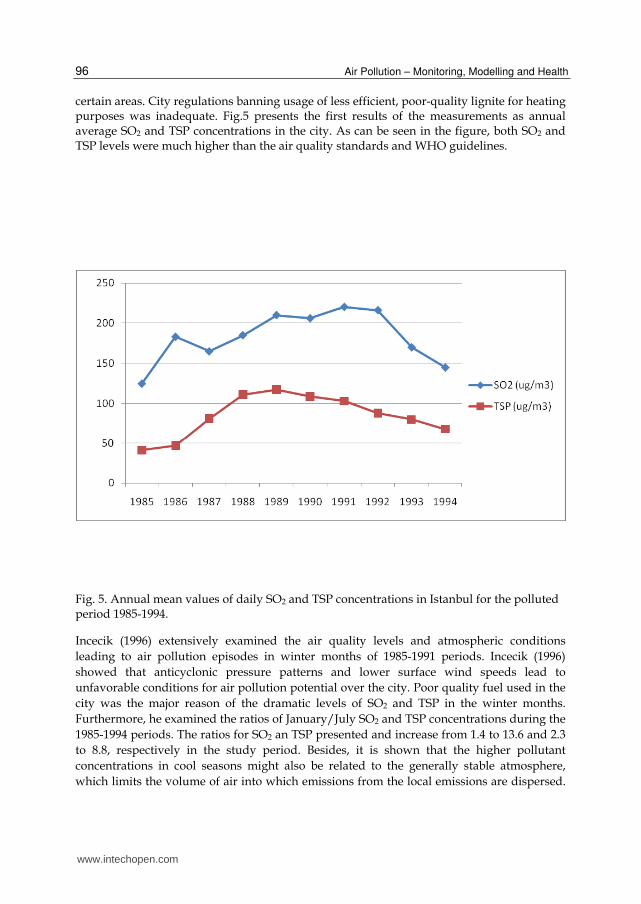
certain areas. City regulations banning usage of less efficient, poor-quality lignite for heating purposes was inadequate. Fig.5 presents the first results of the measurements as annual average SO2 and TSP concentrations in the city. As can be seen in the figure, both SO2 and TSP levels were much higher than the air quality standards and WHO guidelines.
Fig. 5. Annual mean values of daily SO2 and TSP concentrations in Istanbul for the polluted period 1985-1994.
Incecik (1996) extensively examined the air quality levels and atmospheric conditions leading to air pollution episodes in winter months of 1985-1991 periods. Incecik (1996) showed that anticyclonic pressure patterns and lower surface wind speeds lead to unfavorable conditions for air pollution potential over the city. Poor quality fuel used in the city was the major reason of the dramatic levels of SO2 and TSP in the winter months. Furthermore, he examined the ratios of January/July SO2 and TSP concentrations during the 1985-1994 periods. The ratios for SO2 an TSP presented and increase from 1.4 to 13.6 and 2.3 to 8.8, respectively in the study period. Besides, it is shown that the higher pollutant concentrations in cool seasons might also be related to the generally stable atmosphere, which limits the volume of air into which emissions from the local emissions are dispersed.
www.intechopen.com
Air Pollution in Mega Cities: A Case Study of Istanbul
97
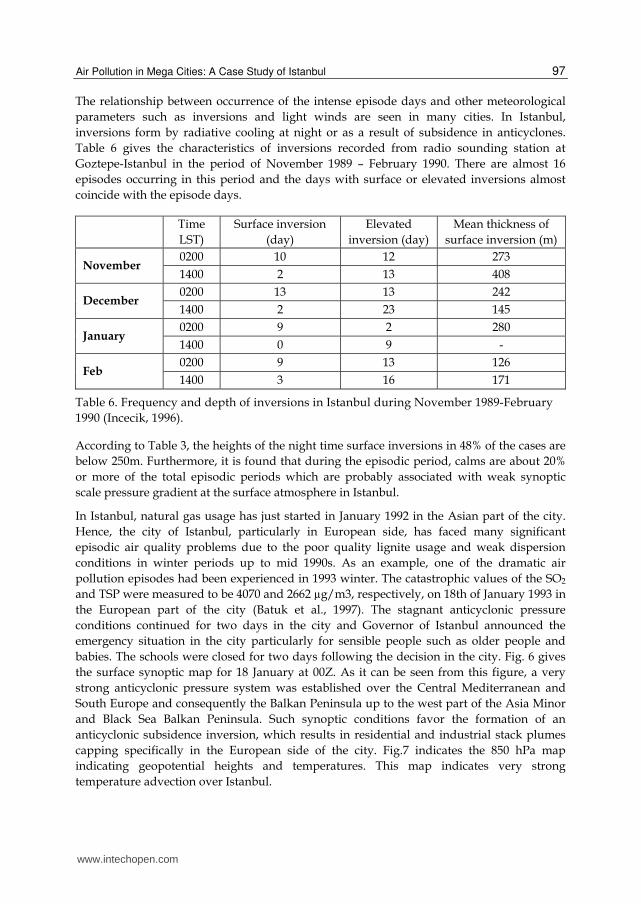
The relationship between occurrence of the intense episode days and other meteorological parameters such as inversions and light winds are seen in many cities. In Istanbul, inversions form by radiative cooling at night or as a result of subsidence in anticyclones. Table 6 gives the characteristics of inversions recorded from radio sounding station at Goztepe-Istanbul in the period of November 1989 – February 1990. There are almost 16 episodes occurring in this period and the days with surface or elevated inversions almost coincide with the episode days.
Time LST)
Surface inversion (day)
Elevated inversion (day)
Mean thickness of surface inversion (m)
November 0200 10 12 273
1400 2 13 408
December 0200 13 13 242
1400 2 23 145
January 0200 9 2 280
1400 0 9 -
Feb 0200 9 13 126
1400 3 16 171
Table 6. Frequency and depth of inversions in Istanbul during November 1989-February 1990 (Incecik, 1996).
According to Table 3, the heights of the night time surface inversions in 48% of the cases are below 250m. Furthermore, it is found that during the episodic period, calms are about 20% or more of the total episodic periods which are probably associated with weak synoptic scale pressure gradient at the surface atmosphere in Istanbul.
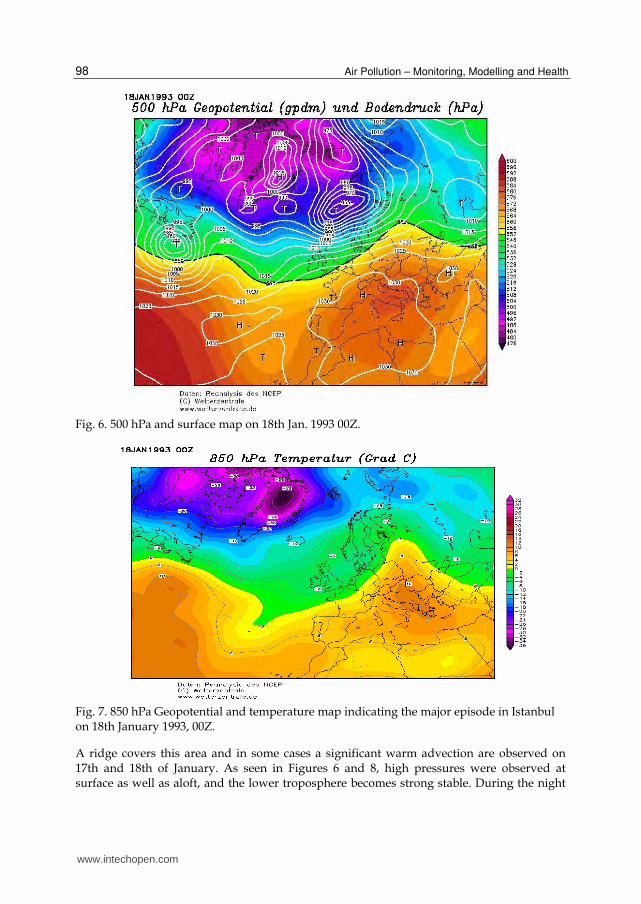
In Istanbul, natural gas usage has just started in January 1992 in the Asian part of the city. Hence, the city of Istanbul, particularly in European side, has faced many significant episodic air quality problems due to the poor quality lignite usage and weak dispersion conditions in winter periods up to mid 1990s. As an example, one of the dramatic air pollution episodes had been experienced in 1993 winter. The catastrophic values of the SO2 and TSP were measured to be 4070 and 2662 µg/m3, respectively, on 18th of January 1993 in the European part of the city (Batuk et al., 1997). The stagnant anticyclonic pressure conditions continued for two days in the city and Governor of Istanbul announced the emergency situation in the city particularly for sensible people such as older people and babies. The schools were closed for two days following the decision in the city. Fig. 6 gives the surface synoptic map for 18 January at 00Z. As it can be seen from this figure, a very strong anticyclonic pressure system was established over the Central Mediterranean and South Europe and consequently the Balkan Peninsula up to the west part of the Asia Minor and Black Sea Balkan Peninsula. Such synoptic conditions favor the formation of an anticyclonic subsidence inversion, which results in residential and industrial stack plumes capping specifically in the European side of the city. Fig.7 indicates the 850 hPa map indicating geopotential heights and temperatures. This map indicates very strong temperature advection over Istanbul.
www.intechopen.com
Air Pollution – Monitoring, Modelling and Health
98
Fig. 6. 500 hPa and surface map on 18th Jan. 1993 00Z.
Fig. 7. 850 hPa Geopotential and temperature map indicating the major episode in Istanbul on 18th January 1993, 00Z.
A ridge covers this area and in some cases a significant warm advection are observed on 17th and 18th of January. As seen in Figures 6 and 8, high pressures were observed at surface as well as aloft, and the lower troposphere becomes strong stable. During the night
www.intechopen.com

Air Pollution in Mega Cities: A Case Study of Istanbul
99
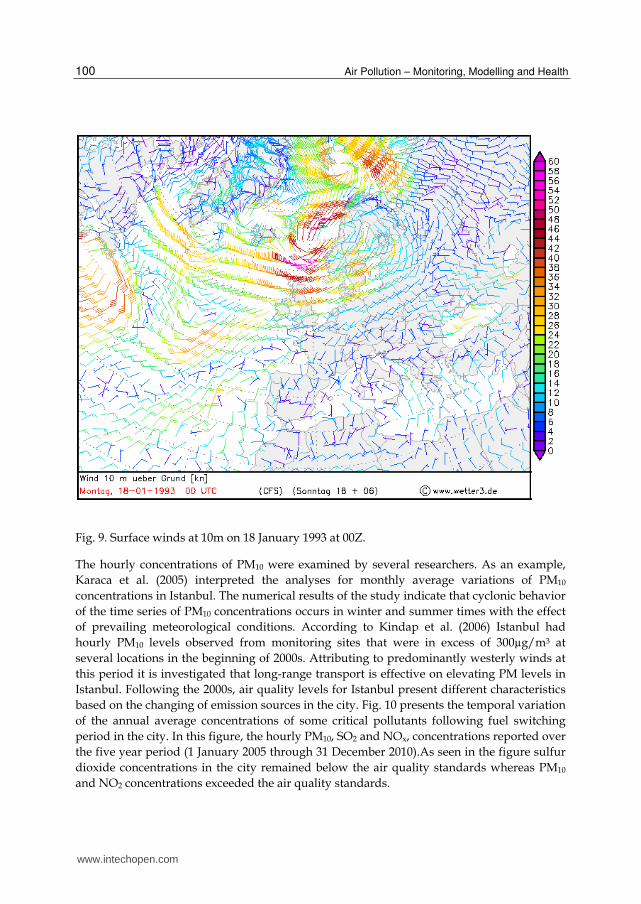
of January 17, a surface temperature inversion was formed. On January 17, the first day of the episode, the surface pressure was rather high over the entire Balkans and Eastern Mediterranean. The light surface winds blew from southern directions, weak at noon and from SW at night (Fig.9). The thermodynamic structure of the lower atmosphere during the episode shows that during the night of 17 January, a strong surface inversion was formed with a depth of 230 m more than 5o C in strength as result of warm advection. On that night surface atmospheric pressure was 1028 hPa and surface winds measured at the Goztepe meteorological stations from 17th January 00Z to 19 January 12 Z were light (~1 m/s) throughout the night and daytime period. around 1 m/s were at the south and southwest
Fig. 8. Skew T log P diagram at 00Z on 17th Jan 1993.
directions. The pollutants (SO2 and TSP) were accumulated during the following day due to the stagnant weather conditions. Very dramatic concentrations of SO2 and TSP (4070 and 2662 μg/m3) on 18th January 1993 were measured to be associated with very strong surface inversion and stagnant conditions during the poor quality coal usage in the European and west parts of Istanbul. The episode ends on January 20, when a strong low pressure system moves over the Black Sea.
www.intechopen.com
Air Pollution – Monitoring, Modelling and Health
100
Fig. 9. Surface winds at 10m on 18 January 1993 at 00Z.
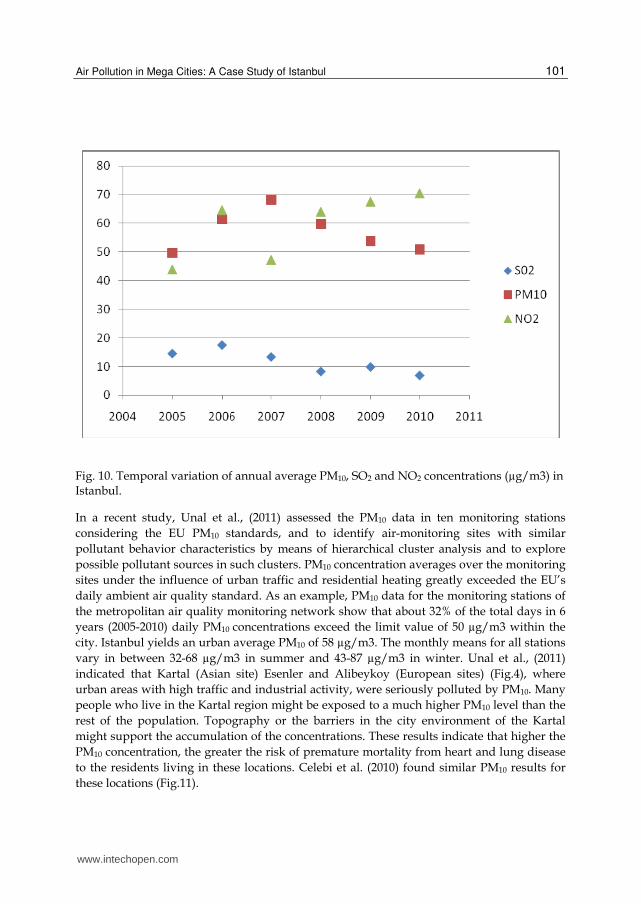
The hourly concentrations of PM10 were examined by several researchers. As an example, Karaca et al. (2005) interpreted the analyses for monthly average variations of PM10 concentrations in Istanbul. The numerical results of the study indicate that cyclonic behavior of the time series of PM10 concentrations occurs in winter and summer times with the effect of prevailing meteorological conditions. According to Kindap et al. (2006) Istanbul had hourly PM10 levels observed from monitoring sites that were in excess of 300µg/m3 at several locations in the beginning of 2000s. Attributing to predominantly westerly winds at this period it is investigated that long-range transport is effective on elevating PM levels in Istanbul. Following the 2000s, air quality levels for Istanbul present different characteristics based on the changing of emission sources in the city. Fig. 10 presents the temporal variation of the annual average concentrations of some critical pollutants following fuel switching period in the city. In this figure, the hourly PM10, SO2 and NOx, concentrations reported over the five year period (1 January 2005 through 31 December 2010).As seen in the figure sulfur dioxide concentrations in the city remained below the air quality standards whereas PM10 and NO2 concentrations exceeded the air quality standards.
www.intechopen.com
Air Pollution in Mega Cities: A Case Study of Istanbul
101
Fig. 10. Temporal variation of annual average PM10, SO2 and NO2 concentrations (µg/m3) in Istanbul.
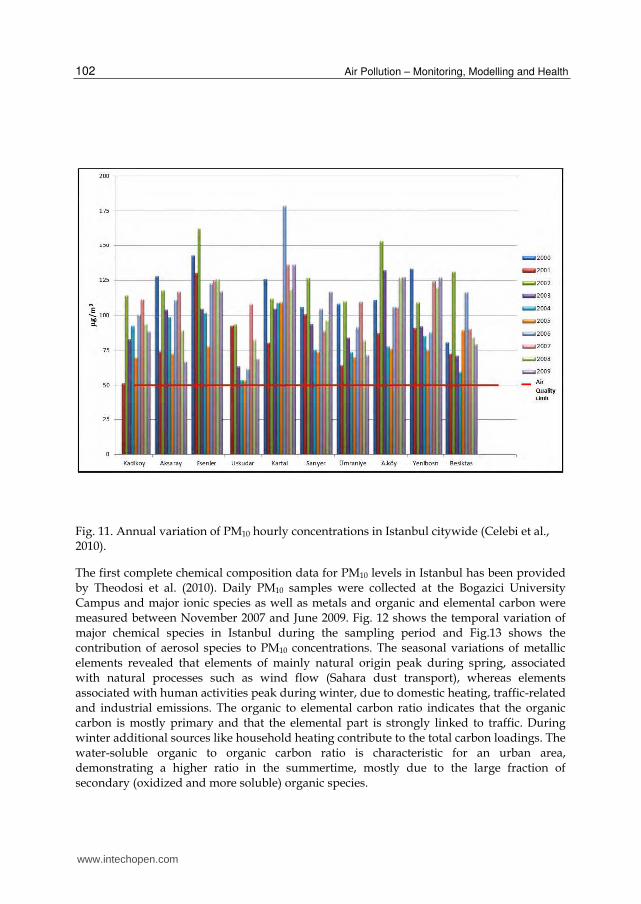
In a recent study, Unal et al., (2011) assessed the PM10 data in ten monitoring stations considering the EU PM10 standards, and to identify air-monitoring sites with similar pollutant behavior characteristics by means of hierarchical cluster analysis and to explore possible pollutant sources in such clusters. PM10 concentration averages over the monitoring sites under the influence of urban traffic and residential heating greatly exceeded the EU’s daily ambient air quality standard. As an example, PM10 data for the monitoring stations of the metropolitan air quality monitoring network show that about 32% of the total days in 6 years (2005-2010) daily PM10 concentrations exceed the limit value of 50 µg/m3 within the city. Istanbul yields an urban average PM10 of 58 µg/m3. The monthly means for all stations vary in between 32-68 µg/m3 in summer and 43-87 µg/m3 in winter. Unal et al., (2011) indicated that Kartal (Asian site) Esenler and Alibeykoy (European sites) (Fig.4), where urban areas with high traffic and industrial activity, were seriously polluted by PM10. Many people who live in the Kartal region might be exposed to a much higher PM10 level than the rest of the population. Topography or the barriers in the city environment of the Kartal might support the accumulation of the concentrations. These results indicate that higher the PM10 concentration, the greater the risk of premature mortality from heart and lung disease to the residents living in these locations. Celebi et al. (2010) found similar PM10 results for these locations (Fig.11).
www.intechopen.com
Air Pollution – Monitoring, Modelling and Health
102
Fig. 11. Annual variation of PM10 hourly concentrations in Istanbul citywide (Celebi et al., 2010).
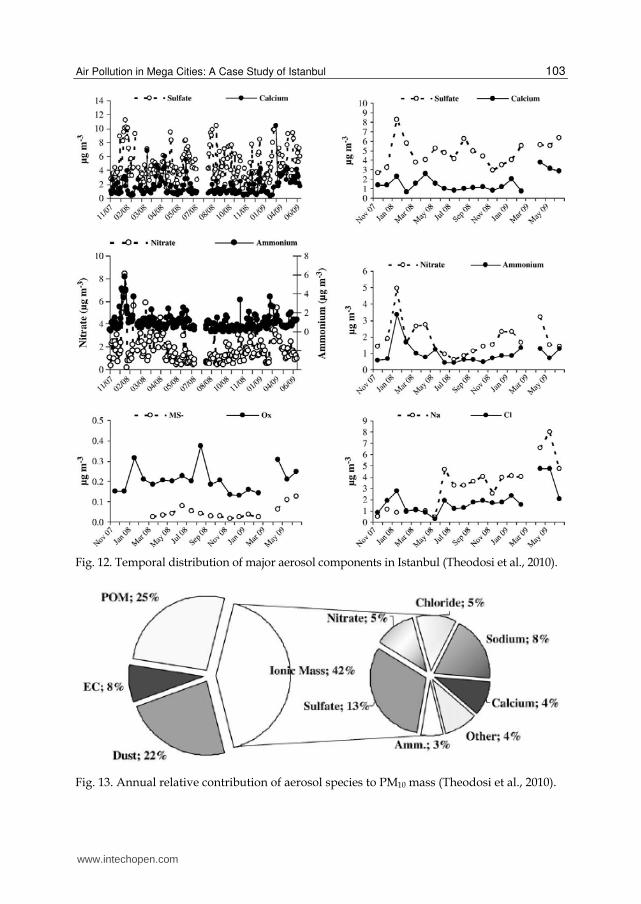
The first complete chemical composition data for PM10 levels in Istanbul has been provided by Theodosi et al. (2010). Daily PM10 samples were collected at the Bogazici University Campus and major ionic species as well as metals and organic and elemental carbon were measured between November 2007 and June 2009. Fig. 12 shows the temporal variation of major chemical species in Istanbul during the sampling period and Fig.13 shows the contribution of aerosol species to PM10 concentrations. The seasonal variations of metallic elements revealed that elements of mainly natural origin peak during spring, associated with natural processes such as wind flow (Sahara dust transport), whereas elements associated with human activities peak during winter, due to domestic heating, traffic-related and industrial emissions. The organic to elemental carbon ratio indicates that the organic carbon is mostly primary and that the elemental part is strongly linked to traffic. During winter additional sources like household heating contribute to the total carbon loadings. The water-soluble organic to organic carbon ratio is characteristic for an urban area, demonstrating a higher ratio in the summertime, mostly due to the large fraction of secondary (oxidized and more soluble) organic species.
www.intechopen.com
Air Pollution in Mega Cities: A Case Study of Istanbul
103
Fig. 12. Temporal distribution of major aerosol components in Istanbul (Theodosi et al., 2010).
Fig. 13. Annual relative contribution of aerosol species to PM10 mass (Theodosi et al., 2010).
www.intechopen.com
Air Pollution – Monitoring, Modelling and Health
104
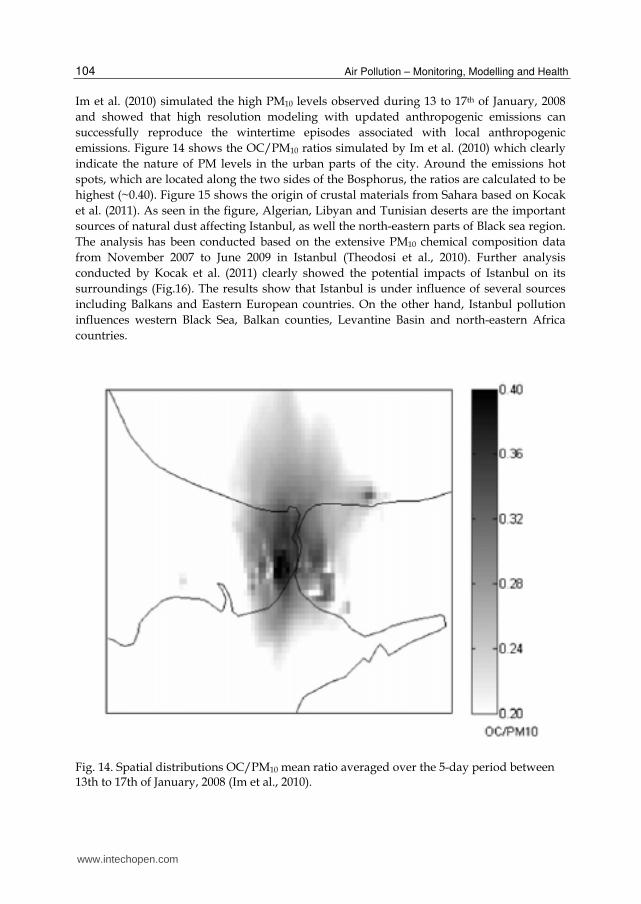
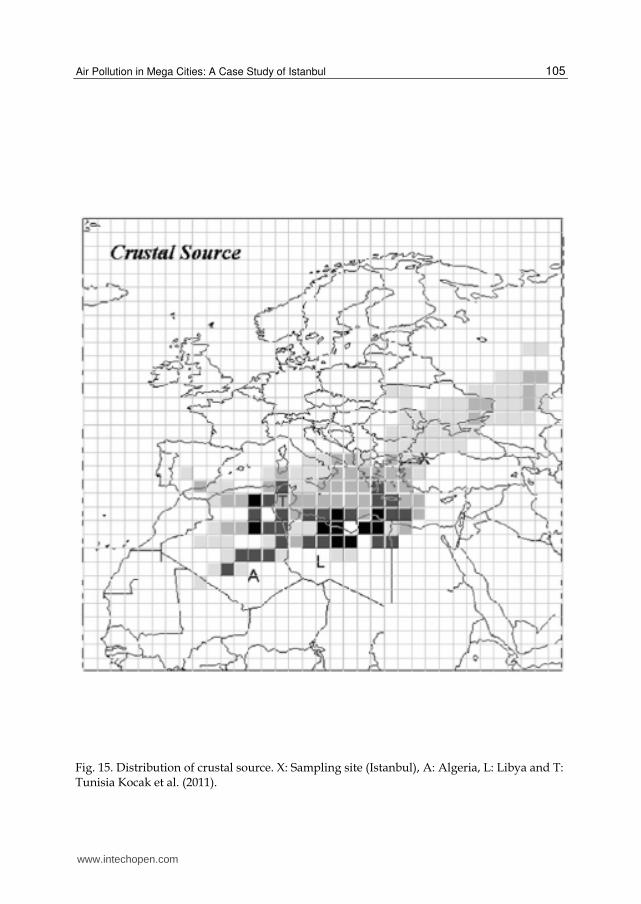
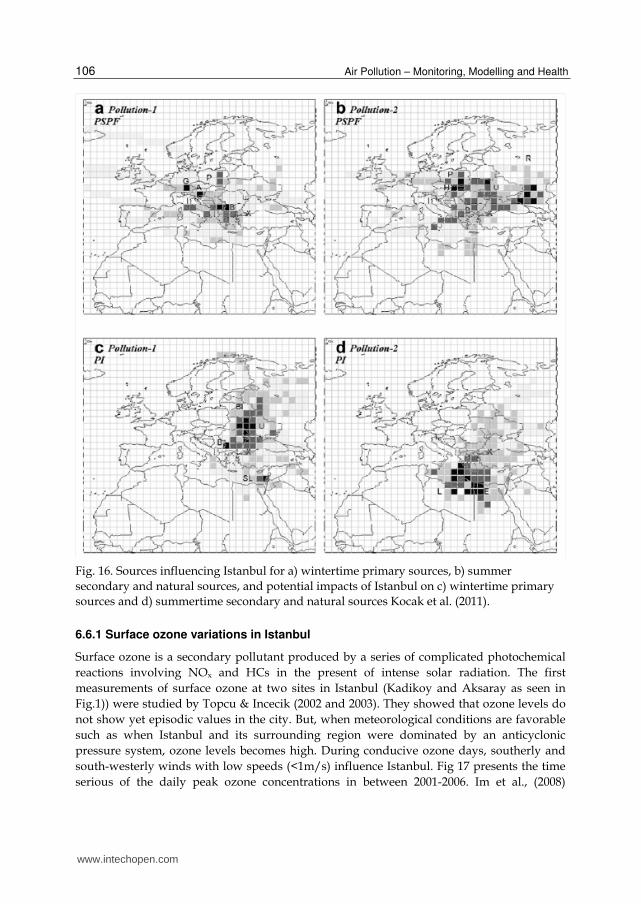
Im et al. (2010) simulated the high PM10 levels observed during 13 to 17th of January, 2008 and showed that high resolution modeling with updated anthropogenic emissions can successfully reproduce the wintertime episodes associated with local anthropogenic emissions. Figure 14 shows the OC/PM10 ratios simulated by Im et al. (2010) which clearly indicate the nature of PM levels in the urban parts of the city. Around the emissions hot spots, which are located along the two sides of the Bosphorus, the ratios are calculated to be highest (~0.40). Figure 15 shows the origin of crustal materials from Sahara based on Kocak et al. (2011). As seen in the figure, Algerian, Libyan and Tunisian deserts are the important sources of natural dust affecting Istanbul, as well the north-eastern parts of Black sea region. The analysis has been conducted based on the extensive PM10 chemical composition data from November 2007 to June 2009 in Istanbul (Theodosi et al., 2010). Further analysis conducted by Kocak et al. (2011) clearly showed the potential impacts of Istanbul on its surroundings (Fig.16). The results show that Istanbul is under influence of several sources including Balkans and Eastern European countries. On the other hand, Istanbul pollution influences western Black Sea, Balkan counties, Levantine Basin and north-eastern Africa countries.
Fig. 14. Spatial distributions OC/PM10 mean ratio averaged over the 5-day period between 13th to 17th of January, 2008 (Im et al., 2010).
www.intechopen.com
Air Pollution in Mega Cities: A Case Study of Istanbul
105
Fig. 15. Distribution of crustal source. X: Sampling site (Istanbul), A: Algeria, L: Libya and T: Tunisia Kocak et al. (2011).
www.intechopen.com
Air Pollution – Monitoring, Modelling and Health
106
Fig. 16. Sources influencing Istanbul for a) wintertime primary sources, b) summer secondary and natural sources, and potential impacts of Istanbul on c) wintertime primary sources and d) summertime secondary and natural sources Kocak et al. (2011).
6.6.1 Surface ozone variations in Istanbul
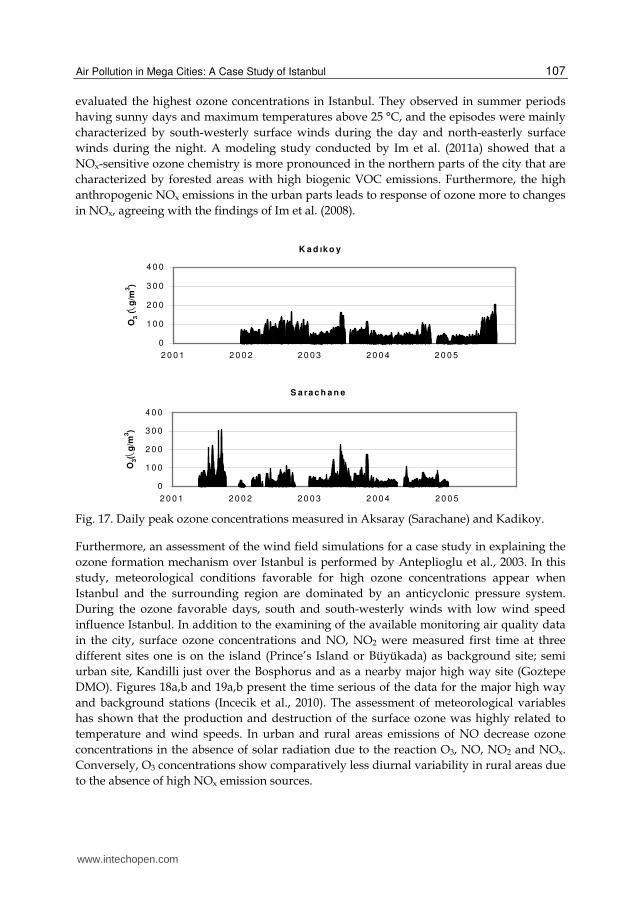
Surface ozone is a secondary pollutant produced by a series of complicated photochemical reactions involving NOx and HCs in the present of intense solar radiation. The first measurements of surface ozone at two sites in Istanbul (Kadikoy and Aksaray as seen in Fig.1)) were studied by Topcu & Incecik (2002 and 2003). They showed that ozone levels do not show yet episodic values in the city. But, when meteorological conditions are favorable such as when Istanbul and its surrounding region were dominated by an anticyclonic pressure system, ozone levels becomes high. During conducive ozone days, southerly and south-westerly winds with low speeds (<1m/s) influence Istanbul. Fig 17 presents the time serious of the daily peak ozone concentrations in between 2001-2006. Im et al., (2008)
www.intechopen.com
Air Pollution in Mega Cities: A Case Study of Istanbul
107
evaluated the highest ozone concentrations in Istanbul. They observed in summer periods having sunny days and maximum temperatures above 25 °C, and the episodes were mainly characterized by south-westerly surface winds during the day and north-easterly surface winds during the night. A modeling study conducted by Im et al. (2011a) showed that a NOx-sensitive ozone chemistry is more pronounced in the northern parts of the city that are characterized by forested areas with high biogenic VOC emissions. Furthermore, the high anthropogenic NOx emissions in the urban parts leads to response of ozone more to changes in NOx, agreeing with the findings of Im et al. (2008).
K a d ık o y
0
1 0 0
2 0 0
3 0 0
4 0 0
2 0 0 1 2 0 0 2 2 0 0 3 2 0 0 4 2 0 0 5
O3 (g/
m3)
S a ra c h a n e
0
1 0 0
2 0 0
3 0 0
4 0 0
2 0 0 1 2 0 0 2 2 0 0 3 2 0 0 4 2 0 0 5
O3( g
/m3)
Fig. 17. Daily peak ozone concentrations measured in Aksaray (Sarachane) and Kadikoy.
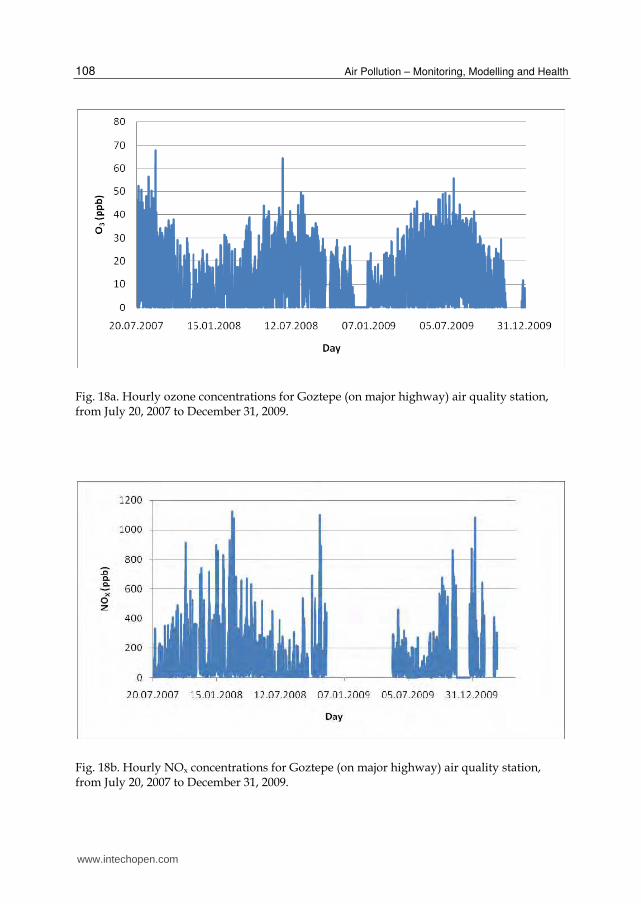
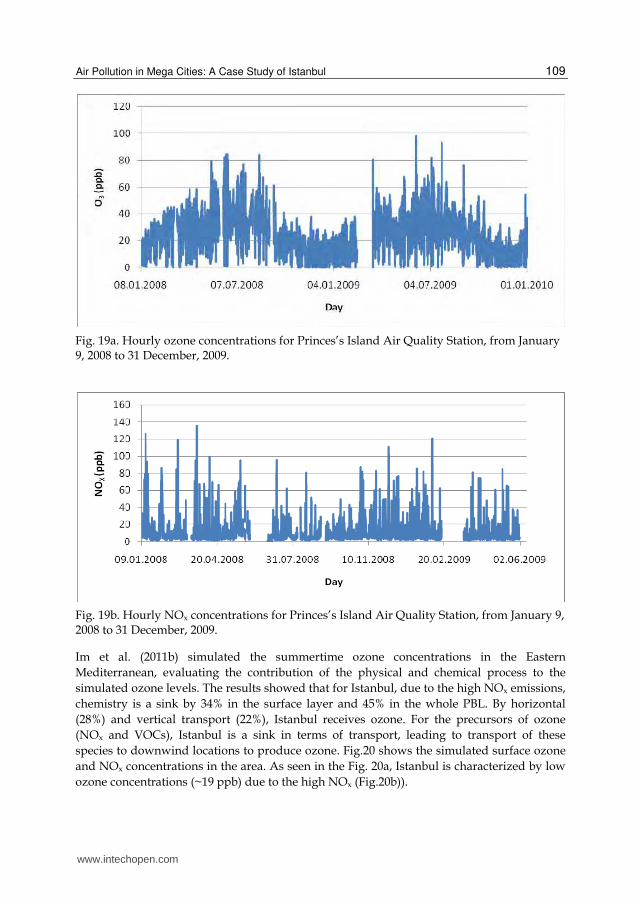
Furthermore, an assessment of the wind field simulations for a case study in explaining the ozone formation mechanism over Istanbul is performed by Anteplioglu et al., 2003. In this study, meteorological conditions favorable for high ozone concentrations appear when Istanbul and the surrounding region are dominated by an anticyclonic pressure system. During the ozone favorable days, south and south-westerly winds with low wind speed influence Istanbul. In addition to the examining of the available monitoring air quality data in the city, surface ozone concentrations and NO, NO2 were measured first time at three different sites one is on the island (Prince’s Island or Büyükada) as background site; semi urban site, Kandilli just over the Bosphorus and as a nearby major high way site (Goztepe DMO). Figures 18a,b and 19a,b present the time serious of the data for the major high way and background stations (Incecik et al., 2010). The assessment of meteorological variables has shown that the production and destruction of the surface ozone was highly related to temperature and wind speeds. In urban and rural areas emissions of NO decrease ozone concentrations in the absence of solar radiation due to the reaction O3, NO, NO2 and NOx. Conversely, O3 concentrations show comparatively less diurnal variability in rural areas due to the absence of high NOx emission sources.
www.intechopen.com
Air Pollution – Monitoring, Modelling and Health
108
Fig. 18a. Hourly ozone concentrations for Goztepe (on major highway) air quality station, from July 20, 2007 to December 31, 2009.
Fig. 18b. Hourly NOx concentrations for Goztepe (on major highway) air quality station, from July 20, 2007 to December 31, 2009.
www.intechopen.com
Air Pollution in Mega Cities: A Case Study of Istanbul
109
Fig. 19a. Hourly ozone concentrations for Princes’s Island Air Quality Station, from January 9, 2008 to 31 December, 2009.
Fig. 19b. Hourly NOx concentrations for Princes’s Island Air Quality Station, from January 9, 2008 to 31 December, 2009.
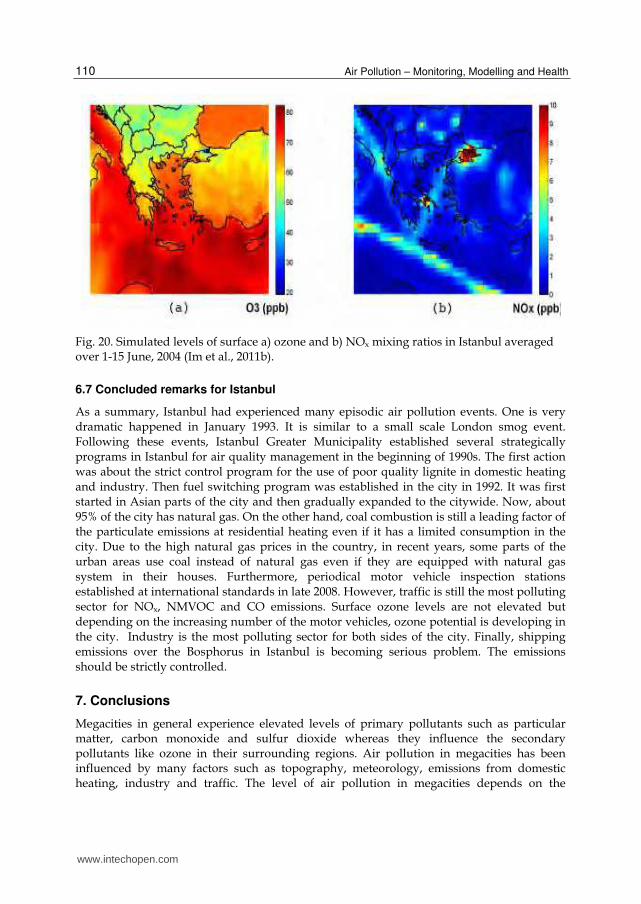
Im et al. (2011b) simulated the summertime ozone concentrations in the Eastern Mediterranean, evaluating the contribution of the physical and chemical process to the simulated ozone levels. The results showed that for Istanbul, due to the high NOx emissions, chemistry is a sink by 34% in the surface layer and 45% in the whole PBL. By horizontal (28%) and vertical transport (22%), Istanbul receives ozone. For the precursors of ozone (NOx and VOCs), Istanbul is a sink in terms of transport, leading to transport of these species to downwind locations to produce ozone. Fig.20 shows the simulated surface ozone and NOx concentrations in the area. As seen in the Fig. 20a, Istanbul is characterized by low ozone concentrations (~19 ppb) due to the high NOx (Fig.20b)).
www.intechopen.com
Air Pollution – Monitoring, Modelling and Health
110
Fig. 20. Simulated levels of surface a) ozone and b) NOx mixing ratios in Istanbul averaged over 1-15 June, 2004 (Im et al., 2011b).
6.7 Concluded remarks for Istanbul
As a summary, Istanbul had experienced many episodic air pollution events. One is very dramatic happened in January 1993. It is similar to a small scale London smog event. Following these events, Istanbul Greater Municipality established several strategically programs in Istanbul for air quality management in the beginning of 1990s. The first action was about the strict control program for the use of poor quality lignite in domestic heating and industry. Then fuel switching program was established in the city in 1992. It was first started in Asian parts of the city and then gradually expanded to the citywide. Now, about 95% of the city has natural gas. On the other hand, coal combustion is still a leading factor of the particulate emissions at residential heating even if it has a limited consumption in the city. Due to the high natural gas prices in the country, in recent years, some parts of the urban areas use coal instead of natural gas even if they are equipped with natural gas system in their houses. Furthermore, periodical motor vehicle inspection stations established at international standards in late 2008. However, traffic is still the most polluting sector for NOx, NMVOC and CO emissions. Surface ozone levels are not elevated but depending on the increasing number of the motor vehicles, ozone potential is developing in the city. Industry is the most polluting sector for both sides of the city. Finally, shipping emissions over the Bosphorus in Istanbul is becoming serious problem. The emissions should be strictly controlled.
7. Conclusions
Megacities in general experience elevated levels of primary pollutants such as particular matter, carbon monoxide and sulfur dioxide whereas they influence the secondary pollutants like ozone in their surrounding regions. Air pollution in megacities has been influenced by many factors such as topography, meteorology, emissions from domestic heating, industry and traffic. The level of air pollution in megacities depends on the
www.intechopen.com
Air Pollution in Mega Cities: A Case Study of Istanbul
111
country’s technology and pollution control capability by air quality improving plans, using cleaner fuels, renewable.
Megacities in developed and developing countries have different emission sources and air quality problems. Most of the megacities in developed countries (Los Angeles, New York, USA; Osaka, Tokyo, Japan and Paris, France) motor vehicles have been the major emission source and PM10, PM2.5, and NO2 were the critical air quality parameters whereas, industry, motor vehicles and residential heating were major emissions in developing countries. In addition to the emission sources, the critical air quality parameters in megacities of developing countries are PM10, PM2.5, NO2, SO2 and CO. Dust transport leads to serious air quality and visibility problem in some megacities in developing countries such as Beijing and Cairo.
Rapid urbanization has resulted in increasing urban air pollution in major cities, especially in the developing countries. Over 90% of air pollution in cities of these countries is attributed to vehicle emissions brought about by high number of older vehicles coupled with low fuel quality. Increased population density causes new risks for the residents through deteriorated environment and social problems due to the intense and complicated interactions between economic, demographic, social political and ecological processes in megacities.
Finally, in megacities of the developing world, in order to enhance quality of life, city planning needs to adopt new visions and innovating management tools. One of the key public concerns in megacities is transportation. High population density and high motor vehicle rates need to be improved. Transport policies should consist of multiple strategies particularly in developing countries.
8. Acknowledgements
The authors acknowledge Özkan Çapraz, Dr Huseyin Toros and Melike Celebi for their help with graphics of this chapter.
9. References
Anteplioğlu, U.; Topçu, S. & İncecik, S. (2003). An Application of a Photochemical Model for Urban Air Shed in Istanbul, Journal of Water, Air & Soil Pollution: Focus, Vol.3(5-6), pp. 55-66.
Abu-Allaban, M.; Gertler, A.W. & Lowenthal, D.H. (2002). A Preliminary Apportionment of the Sources of Ambient PM10, PM2.5 and VOCs in Cairo. Atmospheric Environment, Vol.36, pp. 5549- 5557.
Abu-Allaban, M.; Lowenthal, D.H.; Gertler, A.W. & Labib, M. (2007). Sources of PM10 and PM2.5 in Cairo's Ambient Air. Environmental Monitoring and Assessment, Vol.133, pp. 417-425.
Abu-Allaban, M.; Lowenthal, D.H.; Gertler, A.W. & Labib, M. (2009) . Sources of Volatile Organic Compounds in
Cairo’s Ambient Air. Environmental Monitoring and Assessment, Vol.157, pp. 179–189.
www.intechopen.com
Air Pollution – Monitoring, Modelling and Health
112
Atimtay, A. & İncecik, S. (2004). Air Pollution Problem in Istanbul and Strategically Efforts in Air Quality Management, 13th World Clean Air Congress, 22-27 Aug.2004, London.
APCR, Air Pollution Country Report, Rep. of Turkey, Min. of Health, Refik Saydam Center for Hygiene (1998).
Baklanov, A. (2011). Megapoli Project Megacities: Emissions, Urban, Regional and Global Atmospheric Pollution and Climate Effects, and Integrated Tools for Assessment and Mitigation THEME FP7-ENV-2007.1.1.2.1: Megacities and Regional Hot-spots Air Quality and Climate Collaborative Project (Medium-Scale Focused Research Project) Grant Agreement no.: 212520.
Baldasano, J.M.; Valera, E. & Jimenez, P. (2003). Air Quality Data from Large Cities, Science of the Total Environment, Vol.307, pp. 141 – 165.
Batuk, D.N.; Gürsoy, E.; Ertut, H.; Erdun, H. & Incecik, S. (1997). Analysis of SO2 and TSP Under Mesoscale Weather Conditions in Istanbul, Turkey, Environ. Res. Forum, Vol 7-8,pp 73-83.
Butler, T.M.; Lawrence, M.G.; Gurjar, B.R.; van Aardenne, J.; Schultz, M. & Lelieveld, J. (2008). The Representation of Emissions from Megacities in Global Emission Inventories, Atmos. Environ., Vol.42, pp. 703-719.
Butler, T.M. & Lawrence, M.G. (2009). The Influence of Megacities on Global Atmospheric Chemistry: a Modeling Study, Environ. Chem., Vol.6, pp. 219-225.
Cairo Air Improvement Project, (2004). USAID/Egypt, Office of Environment Contract 263-C-00-97-00090-00
Celebi, M.; İncecik, S. & Deniz, A. (2010). Investigation of PM10 Levels in Urban Atmosphere of a Megacity: Istanbul, Better Air Quality Conference, BAQ2010, 9-11 Nov. 2010. Singapore.
CCS Report , (2010). Country Cooperation Strategy for WHO and Egypt 2005-2009, WHO Regional Office for the Eastern Mediterranean.
Chan, C.K. & Yao, X. (2008). Review: Air Pollution in Megacities in China, Atmospheric Environment, Vol.42, pp. 1-42.
Decker, E.H.; Elliot, S.; Smith, F.A.; Blake, D.R. & Rowland, F.S. (2000). Energy and Material Flow Through the Urban Ecosystem. Annual Review of Environment and Resources, Vol.25, pp. 685 – 740.
Deng, F.F. & Huang, Y. (2004). Uneven Land Reform and Urban Sprawl in China: the Case of Beijing. Progress in Planning, Vol.61, pp. 211–236.
Deniz, C. & Durmusoglu, Y. (2008). Estimating Shipping Emissions in the Region of the Sea of Marmara, Turkey. Science of the Total Environment, Vol.390, pp. 255-261.
EEPP-Air, (2004). Egyptian Environmental Policy Program, Planning for Integrated Air Quality Management. Final Report | June, Chemonics International Inc. 1133 20t h Street, NW Washington, DC 20036 / USA. USAID/Egypt, Office of Environment Contract 263-C-00-97-00090-00
Elbir, T. (2008). A GIS Based Decision Support System for Urban Air Quality Management in the City of İstanbul (LIFE06-TCY/TR/000283)
Elbir, T.; Mangir, N.; Kara, M. & Ozdemir, S. (2010). Development of a GIS-based Decision Support System for
Urban Air Quality Management in the City of Istanbul, Atmospheric Environment, Vol.44, pp. 441-454.
www.intechopen.com
Air Pollution in Mega Cities: A Case Study of Istanbul
113
Fang, M.; Chan, C.K. & Yao, X. (2009). Managing Air Quality in a Rapidly Developing Nation, China, Atmospheric Environment, Vol.43, pp. 79-86.
Farber, R.J.; Welsing, P.R. & Rozzi, C. (1994). PM10 and Ozone Control Strategy to Improve Visibility in the Los Angeles Basin, Atmospheric Environment, Vol.28, pp. 3277-3283.
Favez, O.; Cachier, H.; Sciare, J.; Alfaro, S. C.; El-Araby, T. M.; Harhash, M. A. & Abdelwahab , M. M. (2008). Seasonality of Major Aerosol Species and Their Transformation in Cairo, Atmospheric Environment, Vol.42, pp. 1503-1516.
Government of India (2006). Government Report. Guenther, A.; Karl, T.; Harley, P.; Wiedinmyer, C.; Palmer, P.I. & Geron, C. (2006). Estimates
of Global Terrestrial Isoprene Emissions Using MEGAN (Model of Emissions of Gases and Aerosols from Nature, Atmospheric Chemistry and Physics Discussions, Vol.6, pp. 107 – 173.
Gurjar, B. R.; van Aardenne, J. A.; Lelieveld, J. & Mohan, M. (2004). Emission Estimates and Trends (1990-2000) for Megacity Delhi and Implications. Atmospheric Environment, 38 (33), 5663-5681. doi: 10.1016/j.atmosenv.2004.05.057
Gurjar, B. R. & Lelieveld, J. (2005). New Directions: Megacities and Global Change. Atmospheric Environment, 39, 391-393. doi:10.1016/j.atmosenv.2004.11.002
Gurjar, B. R; Butler, T. M.; Lawrence, M. G. & Lelieveld, J. (2008). Evaluation of Emissions and Air Quality in Megacities, Atmospheric Environment , Vol.42, pp. 1593-1606.
Gusten, H.; Heinrich, G.; Wappner, J.; Abdel-Aal, M.M.; Abdel-Hay, F.A.; Ramadan, A.B.; Tawfik, F.S.; Ahmed, D.M.; Hassan, G.K.Y.; Cuitas, T.; Jeftic, J. & Klasinc, L. (1994). Ozone Formation in The Greater Cairo Area, Science of The Total Environment, Vol.155, pp. 285 – 295.
Hao, J.; Wang, L.; Shen, M.; Li, L. & Hu, J. (2007). Air Quality Impacts of Power Plant Emissions in Beijing, Environmental Pollution, Vol.147, pp. 401 – 408.
HEI (2004). International Scientific Oversight Committee, 2004. HEI, (2010). Health Effects Institute Special Report 18, 2010. IBB, (2009). Istanbul Municipality Report. Im, U.; Tayanc, M. & Yenigün, O. (2008). Interaction Patterns of Major Photochemical
Pollutants in Istanbul, Turkey, Atmospheric Research, Vol.89, pp. 382-390. Im, U.; Markakis, K.; Unal, A.; Kindap, T.; Poupkou, A.; Incecik, S.; Yenigun, O.; Melas, D.;
Theodosi, C. & Mihalopoulos, N. (2010). Study of a Winter PM Episode in Istanbul Using High Resolution WRF/CMAQ Modeling System. Atmospheric Environment, Vol.44, pp. 3085-3094.
Im, U.; Poupkou, A.; Incecik, S.; Markakis, K.; Kindap, T.; Unal, A.; Melas, D.; Yenigun, O.; Topcu, S.; Odman, M.T.; Tayanc, M. & Guler, M. (2011a). The Impact of Anthropogenic and Biogenic Emissions on Surface Ozone Concentrations in Istanbul. Science of the Total Environment, Vol.409, pp. 1255-1265.
Im, U.; Markakis, K.; Poupkou, A.; Melas, D.; Unal, A.; Gerasopoulos, E.; Daskalakis, N. & Kanakidou, M. (2011b). The Impact of Temperature Changes on Summer Time Ozone and Its Precursors in the Eastern Mediterranean. Atmospheric Chemistry and Physics, Vol.11, pp. 3847-3864.
Incecik, S. (1996). Investigation of Atmospheric Conditions in Istanbul Leading to Air Pollution Episodes, Atmospheric Environment. Vol.30, pp. 2739-2749.
Incecik, S.; Im, U.; Yenigün, O.; Odman, M.T.; Kindap, T.; Topcu, S.; Tek, A. & Tayanç, M. (2010). Simulations of Meteorological Fields and Investigation of Air Pollution in
www.intechopen.com
Air Pollution – Monitoring, Modelling and Health
114
Istanbul and Kocaeli Regions. Turkish Scientific and Technical Research Council Project No: 105Y005 (in Turkish)
Jahn, H.J.; Schnider, A.; Breitner, S.; Eibner, R. & Wendisch, M. (2011). Particulate Matter Pollution in the Megacities of the Pearl River Delta, China-A Systematic Literature Review and Health Risk Assessment, Int.J. Hygiene and Environmental Health, Vol.214, pp. 281-295.
Karaca, F.; Anil, I. & Alagha O. (2009). Long-range Potential Source Contributions of Eisodic Aerosol Events to PM10 Profile of a Megacity, Atmospheric Environment, Vol.43, pp. 5713 – 5722.
Kai, Z.; You-Hua, Y.; Qiang, L.; Ai-Jun, L. & Shao-Lin, P. (2007). Evaluation of Ambient Air Quality in Guangzhou, China, Journal of Environmental Sciences, Vol.19, pp. 432–437.
Kanakidou, M.; Mihalopoulos, N.; Kindap, T.; Im, U.; Vrekoussis, M.; Gerasopoulos, E.; Dermitzaki, E.; Unal, A.; Koçak, M.; Markakis, K.; Melas, D.; Kouvarakis, G.; Youssef, A.F.; Richter, A.; Hatzianastassiou, N.; Ebojie, A. F.; Wittrock, F.; von Savigny, C.; Burrows, J. P.; Weissenmayer, A. L. & Moubasher, H. (2011). Review: Megacities as Hot Spots of Air Pollution in the East Mediterranean, Atmospheric Environment, Vol.45, pp. 1223-1235.
Kesgin, U. & Vardar, N. (2001). A Study on Exhaust Gas Emissions from Ships in Turkish Streets. Atmospheric Environment, Vol.35, pp. 1863-1870.
Khoder, M. (2009). Diurnal Seasonal and Weekdays-Weekends Variation of Ground Level Ozone Concentrations in an Urban Area in Grater Cairo, Environmental Monitoring and Assessment, Vol.149, pp. 349 – 362.
Kim, S. (2007). Immigration, Industrial Revolution and Urbanization in the United States, 1820-1920: Factor Endowments, Technology and Geography, NBER Working Paper No. 12900.
Kindap, T.; Unal, A.; Chen, S.H.; Odman, M.T. & Karaca, M.(2006). Long-range Aerosol Transport from Europe to Istanbul, Turkey, Atmopheric Environment, Vol.40, pp. 3536 – 3547.
Kocak, M.; Theodosi, C.; Zarmpas, P.; Im, U.; Bougiatioti, A.; Yenigun, O. & Mihalopoulos, N. (2011). Particulate matter (PM10) in Istanbul: Origin, source areas and potential impact on surrounding regions. Atmospheric Environment, 45, 6891-6900.
Lawrence, M.G.; Butler, T.M.; Steinkamp, J.; Gurjar, B.R. & Lelieveld, J. (2007). Regional Pollution Potentials of Megacities and Other Major Population Centers, Atmos. Chem. Phys., Vol.7, pp. 3969-3987.
Mage, D.; Ozolins, G.; Peterson, P.; Webster, A.; Orthofer, R.; Vandeweerd, V. & Gwynne, M. (1996). Urban Air Pollution in Megacities of the World. Atmospheric Environment, Vol.30, pp. 681-686.
Mahmoud, K.F.; Alfaro, S.C.; Favez, O.; Abdel Wahab, M.M. & Sciare, J. (2008). Origin of Black Carbon Concentration Peaks in Cairo, Atmospheric Research, Vol.89, pp. 161-169.
Markakis, K., Im, U., Unal, A., Melas, D., Yenigun, O. & Incecik S. (2012). Compilation of a GIS based high spatially and temporally resolved emission inventory for the Greater Istanbul Area. Atmospheric Pollution Research, Vol. 3, pp. 112-125.
Markakis, K.; Im, U.; Unal, A.; Melas, D.; Yenigun, O. & Incecik, S., (2009). A Computational Approach for the Compilation of a High Spatially and Temporally Resolved
www.intechopen.com
Air Pollution in Mega Cities: A Case Study of Istanbul
115
Emission Inventory for the Istanbul Greater Area. In: 7th International Conference on Air Quality Science and Application, 24–27 March 2009, Istanbul.
Markakis, K.; Poupkou, A.; Melas, D.; Tzoumaka, P. & Petrakakis, M. (2010). A Computational Approach Based on GIS Technology for the Development of an Anthropogenic Emission Inventory for Air Quality Applications in Greece, Water, Air & Soil Pollution, Vol.207, pp. 157–180.
Molina, M.J. & Molina, L.T. (2002). Air Quality in the Mexico Megacity: An Integrated Assessment, Springer, New York.
Molina M.J, Molina L.T, (2004). Megacities and Atmospheric Pollution, Journal of Air &Waste Management Assoc. Vol.54, pp. 644-680.
National Summary Report, (2010). Air Quality Monitoring, Emission Inventory and Source Apportionment Study for Indian Cities, Central Pollution Control Board.
Narain, U. & Krupnick, A. (2007). The Impact of Delphi’s CNG Program on Air Quality, RFF Discussion Paper No 07 – 06.
Patz, J.; Campbell-Lendrum, D.; Holloway, T. & Foley,, J. A. (2005). Impact of Regional Climate Change on Human Health, Nature, Vol.438, pp. 310-317.
Prasad, A. K.; El-Askary, H. & Kafatos, M. (2010). Implications of High Altitude Desert Dust Transport from Western Sahara to Nile Delta During Biomass Burning Season , Environmental Pollution, Vol.158, pp. 3385-3391.
Safar, Z. S. & Labib, M. W. (2010). Assessment of Particulate Matter and Lead Levels in the Greater Cairo Area for the Period 1998–2007, Journal of Advanced Research, Vol.1, pp. 53-63.
Song, Y.; Zhang, M. & Cai, X. (2006). PM10 Modeling of Beijing in the Winter, Atmospheric Environment, Vol.40, pp. 4126-4136.
Tayanc, M. (2000). An Assessment of Spatial and Temporal Variation of Sulfur Dioxide Levels over Istanbul, Env.Poll., Vol. 107, pp. 61-69.
Theodosi, C.; Im, U.; Bougiatuoti, A.; Zarmpas, P.; Yenigun, O. & Mihalopoulos N. (2010). Aerosol Chemical Composition Over Istanbul. Science of the Total Environment, Vol.408, pp. 2482-2491.
Topcu, S.; Incecik, S. & Unal, Y.S. (2001). The Influence of Meteorological Conditions and Stringent Emission Control on High TSP Episodes in Istanbul , Environ. Sci. and Pollut. Res., Vol.10, pp. 24-32.
Topcu, S. & İncecik, S. (2002). Surface Ozone Measurements and Meteorological Influences in the Urban Atmosphere of Istanbul, Int.Journal of Environment and Pollution, Vol.17, pp. 390-404.
Topcu, S. & İncecik, S. (2003). Characteristics of Surface Ozone Concentrations in Urban Atmosphere of Istanbul: A
Case Study, Fresenius Environmental Bulletin, Vol.12, pp.413-417. UN and League of Arap States Report, (2006). Air Quality and Atmospheric Pollution in the
Arab Region, UN Economic and Social Commission for Western Asia & League of Arab States.
UN (2009). United Nations Department of Economic and Social ffairs/Population Division. World Urbanization Prospects.
Unal, Y.S.; Incecik, S.; Borhan, Y. & Mentes, S. (2000). Factors Influencing the Variability of SO2 Concentrations in Istanbul, Journal of the Air & Waste Management Association, Vol.50, pp. 75-84.
www.intechopen.com

Air Pollution – Monitoring, Modelling and Health
116
Unal, Y.S.; Deniz, A.; Toros, H. & Incecik, S. (2011). Influence of Meteorological Factors and Emission Sources on Spatial and Temporal Variations of PM10 Concentrations in Istanbul Metropolitan Area, Atmospheric Environment, Vol.45, pp. 5504-5513.
UNEP United Nations Environment Program, Urban Environment Unit. United Nations Environment Programme/Global Environmental Monitoring System. Urban
Air Pollution; Environmental Library No.4, Oxford, England, 1991. Visschedijk, M.; Hendriks, R. & Nuyts, K. (2005). How to Set up and Manage Quality
Control and Quality Assurance, The Quality Assurance Journal, Vol.9, pp. 95 – 107. Wang, H.; Fu, L.; Zhou, Y.; Du, X. & Ge, W. (2010). Trends in Vehicular Emissions in China’s
Mega Cities from 1995 to 2005, Environmental Pollution, Vol.158, pp. 394–400. WHO, (2008). Air Quality and Health, Fact Sheet N°313 WHO, (2009). Center for Health Development, World Health Organization Centre for
Health Development (WHO Kobe Centre – WKC) Wu, Z.; Hu, M.; Lin, P.; Liu, S.; Wehner, B. & Wiedensohler, A. (2008). Particle Number Size
Distribution in the Urban Atmosphere of Beijing, China, Atmospheric Environment, Vol.42, pp. 7967-7980.
Zakey, A.S.; Abdelwahab, M.M.; Pattersson, J.J.C.; Gatari, M.J. & Hallquist, M. (2008). Seasonal and Spatial Variation of Atmospheric Particular Matter in a Developing Megacity, the Greater Cairo, Egypt Atmosfera, Vol.21, pp. 171-189.
Zhao,P (2010). Sustainable Urban Expansion and Transportation in a Growing Megacity: Consequences of Urban Sprawl for Mobility on the Urban Fringe of Beijing, Habitat International, Vol.34, pp. 236–243.
Zhou, K.; Ye, Y-H.; Liu, Q.; Liu, A-J. &Peng, S-L. (2007). Evaluation of Ambient Air Quality in Guangzhou, China, Journal of Environmental Sciences, Vol.19, pp. 432-437.
Zhu, L.; Huang, X.; Shi, H.; Cai, X. & Song, Y. (2011). Transport Pathways and Potential Sources of PM10 in Beijing, Atmospheric Environment, Vol.45, pp. 594-604.
www.intechopen.com

Air Pollution - Monitoring, Modelling and HealthEdited by Dr. Mukesh Khare
ISBN 978-953-51-0424-7Hard cover, 386 pagesPublisher InTechPublished online 23, March, 2012Published in print edition March, 2012
InTech EuropeUniversity Campus STeP Ri Slavka Krautzeka 83/A 51000 Rijeka, Croatia Phone: +385 (51) 770 447 Fax: +385 (51) 686 166www.intechopen.com
InTech ChinaUnit 405, Office Block, Hotel Equatorial Shanghai No.65, Yan An Road (West), Shanghai, 200040, China
Phone: +86-21-62489820 Fax: +86-21-62489821
Air pollution has always been a trans-boundary environmental problem and a matter of global concern for pastmany years. High concentrations of air pollutants due to numerous anthropogenic activities influence the airquality. There are many books on this subject, but the one in front of you will probably help in filling the gapsexisting in the area of air quality monitoring, modelling, exposure, health and control, and can be of great helpto graduate students professionals and researchers. The book is divided in two volumes dealing with variousmonitoring techniques of air pollutants, their predictions and control. It also contains case studies describingthe exposure and health implications of air pollutants on living biota in different countries across the globe.
How to referenceIn order to correctly reference this scholarly work, feel free to copy and paste the following:
Selahattin Incecik and Ulaş Im (2012). Air Pollution in Mega Cities: A Case Study of Istanbul, Air Pollution -Monitoring, Modelling and Health, Dr. Mukesh Khare (Ed.), ISBN: 978-953-51-0424-7, InTech, Available from:http://www.intechopen.com/books/air-pollution-monitoring-modelling-and-health/air-pollution-in-mega-cities-a-case-study-of-istanbul-