mineralogy and grain size of surficial … · tables table 1. grain ... discussions on grain-size...
TRANSCRIPT

MINERALOGY AND GRAIN SIZE OF SURFICIAL SEDIMENTFROM THE LITTLE LOST RIVER AND BIRCH CREEK DRAINAGES,IDAHO NATIONAL ENGINEERING LABORATORY, IDAHO
by
Roy C. Bartholomay and LeRoy L. Knobel
U.S. GEOLOGICAL SURVEY
Open-File Report 89-385
Prepared in cooperation with the
U.S. DEPARTMENT OF ENERGY
Idaho Falls, Idaho July 1989

DEPARTMENT OF THE INTERIOR
MANUEL LUJAN, JR., Secretary
U.S. Geological Survey
Dallas L. Peck, Director
For additional information write to:
Project OfficeU.S. Geological SurveyINEL, MS 4148P.O. Box 2230Idaho Falls, ID 83403
Copies of this report can be purchased from:
Books and Open-File Reports Section Western Distribution Branch Box 25425, Federal Center, Bldg. 810 Denver, CO 80225
ii

CONTENTS
PageAbstract ............................... 1Introduction ............................. 1
Hydrologic setting. ....................... 3Previous investigations ..................... 4Acknowledgments ......................... 5
Methods................................ 5Sample collection ........................ 5Sample preparation and analysis ................. 6
Grain-size samples. .................... 6X-ray diffraction samples ................. 7
Grain-size distribution of surficial sediment. ............ 8Mineralogy of surficial sediment ................... 9Summary. ............................... 12References cited ........................... 13
ILLUSTRATIONS
Figure 1. Map showing locations of the Idaho National Engineering Laboratory, selected facilities, and sampling sites for surficial sediment. .................. 2
2. Graph showing cumulative weight percent versus grade limits for grain-size analyses of surficial sediment from the Little Lost River. ................ 10
3. Graph showing cumulative weight percent versus grade limits for grain-size analyses of surficial sediment from Birch Creek. ...................... 11
TABLES
Table 1. Grain-size distribution for Little Lost River channeland overbank deposits, in weight percent. ......... 15
2. Grain-size distribution for Birch Creek channel andoverbank deposits, in weight percent. ........... 15
3. Summary of statistical parameters for grain-size data of surficial sediment for the Little Lost River and Birch Creek drainages ...................... 16
4. Mineralogy of bulk and clay samples by X-ray diffractionanalysis for the Little Lost River. ............ 17
5. Mineralogy of bulk and clay samples by X-ray diffractionanalysis for Birch Creek. ................. 18
6. Summary of statistical parameters for bulk mineralogy of surficial sediment for the Little Lost River and Birch Creek drainages ................... 19
iii

FACTORS FOR CONVERTING INCH-POUND UNITS TO METRIC (SI) UNITS
For readers who prefer to use International System (SI) units, rather than inch-pound units, the following conversion factors may be used.
Multiply inch-pound units
foot (ft) mile (mi) inch (in.) square mile (mi 2 ) acre-foot (acre-ft)
By.
0.30481.609
25.42.590
1,233
To obtain SI units
meter kilometer millimeter square kilometer cubic meter
Sea level: In this report "sea level" refers to the National Geodetic Vertical Datum of 1929 (NGVD of 1929)--a geodetic datum derived from a general adjustment of the first-order level nets of both the United States and Canada, formerly called "Sea Level Datum of 1929."
IV

MINERALOGY AND GRAIN SIZE OF SURFICIAL SEDIMENT FROM THE LITTLE LOST RIVER AND BIRCH CREEK DRAINAGES,
IDAHO NATIONAL ENGINEERING LABORATORY, IDAHO
by
Roy C. Bartholomay and LeRoy L. Knobel
ABSTRACT
The U.S. Geological Survey's project office at the Idaho National
Engineering Laboratory, in cooperation with the U.S. Department of Energy,
collected 13 samples of surficial sediment from the Little Lost River and
Birch Creek drainages during August 1988 for analysis of grain-size
distribution, bulk mineralogy, and clay mineralogy. Samples were collected
from five sites in the channel of the Little Lost River, two sites from
overbank deposits of the Little Lost River, five sites in the channel of
Birch Creek, and one site from an overbank deposit of Birch Creek.
Six samples from the Birch Creek channel and overbank deposits had a
mean of 7.8 and median of 2.5 weight percent in the less than 0.062
millimeter fraction. The seven samples from the Little Lost River channel
and overbank deposits had a mean of 34.5 and median of 23.8 weight percent
for the same size fraction. Mineralogy data indicated that Birch Creek had
larger mean percentages of quartz and calcite, and smaller mean percentages
of total feldspar and dolomite than the Little Lost River deposits. Illite
was the dominant clay mineral present in both drainages, but the Little Lost
River deposits contained more smectite, mixed-layer clays, and kaolinite
than the Birch Creek deposits.
INTRODUCTION
The INEL (Idaho National Engineering Laboratory) covers about 890 mi 2
of the eastern Snake River Plain in southeastern Idaho (fig. 1). The INEL
was established in 1949 and is used by the U.S. Department of Energy to test
different types of nuclear reactors. The INEL is one of the main centers in
the United States for developing the peacetime use of atomic energy, nuclear

15' 113" 45'
44°
45'
30'
43°15'
112-30'
ARCO
EXPLANATION <Q? BIG SOUTHERN BUTTE
Selected Facilities at the Idaho National Engineering Laboratory
RWMC - RADIOACTIVE WASTE MANAGEMENT COMPLEX EBR-1 - EXPERIMENTAL BREEDER REACTOR NO. 1 ANL-W - ARGONNE NATIONAL LABORATORY WEST ICPP - IDAHO CHEMICAL PROCESSING PLANT CTF - CONTAIN ED TEST FACILITY (formerly called
Loss of Fluid Test Facility--LOFT) - INELBOUNDARY - FACILITIES V - TOWNS
LLRB-1 - LOCATION OF SEDIMENT SAMPLE Entry, LLRB-1, is local sample identifier
CFA - CENTRAL FACILITIES AREA NRF - NAVAL REACTOR FACILITIES TAN - TEST AREA NORTH TRA - TEST REACTORS AREA
8 Milesj
10 Kilometers
9-0827
Figure 1.--Locations of the Idaho National Engineering Laboratory, selected facilities, and sampling sites for surficial sediment.

safety research, defense programs, and advanced energy concepts.
Aqueous chemical and radioactive wastes generated at the INEL were
discharged to ponds and wells from 1952 to 1983. Since 1983, most of the
aqueous wastes have been discharged to unlined infiltration ponds. Many of
the waste constituents enter the Snake River Plain aquifer indirectly
following percolation through the unsaturated zone (Pittman and others,
1988, p. 2); however, the movement of some constituents--including some
radionuclides--may be retarded by minerals in the unsaturated zone.
A sampling program was conducted to document the mineralogy and grain-
size distribution of surficial sediment at selected sites from the Little
Lost River and Birch Creek drainages during August 1988. Samples were
collected from five sites in the channel of the Little Lost River, two sites
from overbank deposits of the Little Lost River, five sites in the channel
of Birch Creek, and one site from an overbank deposit of Birch Creek (fig.
1). This report describes the methods used to collect, prepare, and analyze
surficial sediment samples and summarizes their mineralogy and grain-size
distribution. The sampling program was conducted by the U.S. Geological
Survey in cooperation with the U.S. Department of Energy.
Hydrologic Setting
The eastern Snake River Plain is a northeast-trending structural basin
about 200 mi long and 50 to 70 mi wide. The plain is underlain by a layered
sequence of basaltic lava flows and cinder beds intercalated with alluvium
and lakebed sedimentary deposits. Individual flows range from 10 to 50 ft
in thickness, although the average thickness may be from 20 to 25 ft
(Mundorff and others, 1964, p. 143). The sedimentary deposits consist
mainly of beds of sand, silt, and clay with lesser amounts of gravel.
Locally, rhyolitic lava flows and tuffs are exposed at the land surface or
occur at depth. The basaltic lava flows and intercalated sedimentary
deposits combine to form the Snake River Plain aquifer, which is the main

source of ground water on the plain. The altitude--relative to sea level--
of the water table for the Snake River Plain aquifer in July 1985 and July
1978 ranged from about 4,580 ft in the northern part of the INEL, to about
4,430 ft in the southern part (Pittmah and others, 1988, fig. 9; Barraclough
and others, 1981, fig. 7). The corresponding depths to water below land
surface ranged from about 200 ft in the northern end to as much as 1,000 ft
in the southern end (Barraclough and others, 1981, fig. 8). The INEL
obtains its entire water supply from the Snake River Plain aquifer.
Much of the northern part of the INEL is contained in a topographically
closed depression that includes the Big Lost River Sinks, Little Lost River
Sinks, Birch Creek Sinks, the Big Lost River playas--playas 1, 2, and 3--and
the Birch Creek playa. The Big Lost River, Little Lost River, and Birch
Creek terminate in the Birch Creek playa (Robertson and others, 1974, p. 8)
(fig. 1). The INEL also contains several other small, isolated closed
basins. Except for years with above normal runoff, flow from the Little
Lost River and Birch Creek is diverted for irrigation and power generation
and does not reach the INEL playas. The Big Lost River is the primary
source of surface water to the INEL, most of which subsequently recharges
the Snake River Plain aquifer. Data from May and November 1985 seepage runs
on the Big Lost River near the ICPP (Idaho Chemical Processing Plant) (fig.
1) indicate that the river loses from 1.1 to 3.8 (acre-ft/day)/mi depending
on the amount of flow in the channel (Mann and others, 1988, p. 17).
Previous Investigations
The U.S. Geological Survey has conducted geologic, hydrologic and
water-quality investigations at the INEL since it was selected as a reactor
testing area in 1949. Many of the reports generated by these investigations
contained data on the physical and chemical characteristics of Snake River
Plain aquifer materials. The information published in previous U.S.
Geological Survey reports , along with the types of data and the number of
analyses for each are summarized in a report by Bartholomay and others
(1989) . That report also contains information on surficial sediment from
the Big Lost River drainage and vicinity.

Acknowledgments
The authors gratefully acknowledge the ISU (Idaho State University)
Department of Geology--Dr. Paul K. Link, Chairman-- for providing X-ray
diffraction equipment, laboratory space, and computer support. Several
professors from the Department of Geology deserve special thanks for
providing assistance as follows: Dr. H. Thomas Ore provided helpful
discussions on grain-size analysis and selection of sampling locations; Dr.
Charles W. Blount demonstrated the proper use of the X-ray equipment and
helped with computer software; and Dr. William R. Hackett helped to modify
the sample preparation techniques for the semiquantitative X-ray method used
to identify bulk mineralogy and provided useful discussions on applying the
theory of X-ray diffraction to unknown mineral identification.
METHODS
Sample Collection
Sediment samples were collected from 13 sites for mineralogical and
grain-size analysis during August 1988. Sampling sites (fig. '!) were
selected on the basis of accessibility and topographic setting. Five
samples from the Little Lost River channel were collected from point bars
(LLRB-1 to LLRB-5), which may contain finer grained material than the rest
of the channel deposits (Davis, 1983, p. 254). The five samples were
collected at intervals of about 3 to 6 river mi between a location about
25 mi northwest of Howe and a location 1 mi north of Howe (fig. 1).
Overbank deposits of the Little Lost River (LLRL-2R and LLRL-5L) were
collected from two locations adjacent to two channel deposits (LLRB-2 and
LLRB-5) (fig. 1). Five samples from the Birch Creek channel were collected
from point bars and transverse braid bars (BCB-1 to BCB-5), which may
contain finer grained material than the rest of the channel deposits (Davis,
1983, p. 254; Smith, 1970, p. 2995). The five samples were collected at
intervals of about 5 to 8 river mi between a location about 3 mi north of
Lone Pine to a location 3 mi north of the Birch Creek Sinks (fig. 1). One

overbank deposit from Birch Creek (BCL-3L) was collected adjacent to channel
deposit BCB-3 (fig. 1).
The samples were collected by digging a hole approximately 1 to 2 ft
deep and filling each of four plastic vials with about 150 g (grams) of
sediment from the bottom of the hole. The samples were then labeled and
transported to the analyzing laboratory.
Sample Preparation and Analysis
Three of the four vials of sample from each of the 13 sites were used
for grain-size analysis. The fourth was used for X-ray diffraction
analysis.
Grain-size samples.--The 450 g of sample from the three vials for
grain-size analysis was uniformly mixed and passed through standard sieves
to determine the distribution of sand-sized and larger material--greater
than 0.062 mm (millimeter). Finer-grained samples were split one or two
times prior to sieving. The size fractions (0.062-0.125 mm, 0.125-0.25mm,
0.25-0.50mm, 0.50-1.00 mm, 1.00-2.00 mm, 2.00-4.00 mm, and greater than
4.00 mm) were collected and weighed. The distribution of the clay- and
silt-sized fractions--less than 0.062 mm--was determined using pipette
analysis.
The pipette method of analysis (Folk, 1974, p. 37-39) is based on
settling velocity of spherical particles in a fluid; an aliquot of sample
was collected from the settling cylinder at predetermined times--derived
from Wadell's modification of Stoke's law (Krumbein and Pettijohn, 1938, p.
105-107) --dried, and weighed. Correction factors were applied to the raw
data to account for weight changes resulting from adding the dispersing
agent--sodium hexame taphosphate--and to adjust the weights to account for
the larger volume of the settling cylinder.
The size fractions (less than 0.002 mm, 0.002-0.004 mm, 0.004-0.008 mm,
0.008-0.016 mm, 0.016-0.031 mm, and 0.031-0.062 mm) were collected and

weighed. The weights of the various fractions were converted to weight
percents of the bulk samples.
X-ray diffraction samples.--X-ray diffraction analysis was used to
determine bulk mineralogy of all particles in a sample less than 0.5 mm in
diameter and clay mineralogy of particles less than 0.004 mm in diameter.
Clay mineralogy was only determined on samples that had clay present in the
bulk analysis. For bulk mineralogy, the 150 g of sample from the vial for
X-ray diffraction analysis was passed through a 0.5 mm sieve. A represen
tative sample--approximately 2 g of sediment that passed through the 0.5 mm
sieve--was ground for 8 minutes in a ball and mill device to reduce grain
size and to homogenize the sample. The sample was subsequently ground with
a mortar and pestle until all of the sample passed through a 0.062 mm sieve.
The powdered sample was packed into an aluminum holder and scanned with a
diffractometer using copper Ka (wavelength of the characteristic line)
radiation at a rotation rate of 1 degree 2 theta per minute. The generator
was operated at 35 kilovolts and 15 milliamps. Diffractograms were prepared
at a scale factor of 4, a multiplier of 1, and a time constant of 4.
Semiquantitative analysis was used to determine the relative abundances
of minerals in the samples. A modification of the method described by
Diebold and others (1963) and Schultz (1964) was used to obtain the relative
mineral percentages. The raw percentage of each mineral was calculated by
dividing the intensity of each mineral peak height by the intensity of its
pure standard. The raw percentages were normalized to 100 percent. The
intensities of the pure standards were calculated from standard minerals
provided by the ISU Department of Geology. Because peaks of the detrital
micas, such as muscovite and biotite, overlap with the clay mineral illite,
detrital mica and total clays were reported together when both types of
minerals were present in a sample. Schultz (1964, p. Cl) reported
uncertainties of ±10 percent for minerals that make up at least 15 percent
of the sample. Diebold and others (1963, table 5, p. 130) calculated weight
percents within ±8 percent of the true concentrations using a 95-percent
confidence interval.

For samples that had total clay present in the bulk mineralogy
analyses, a qualitative identification of individual clay minerals was
undertaken. Approximately 1 g of the sample material less than 0.5 mm in
diameter was added to a 500 mL (milliliter) beaker of deionized water along
with about 0.2 g of sodium hexametaphosphate-- a dispersing agent--and
stirred for 1 to 2 minutes. Equal volumes of the suspension were placed in
two centrifuge tubes and centrifuged at 600 revolutions per minute for 2
minutes. After centrifugation, only particles less than 0.004 mm in
diameter remained in suspension. The liquid containing the suspended
particles was transferred to a glass thin-section slide and dried at room
temperature.
The slides were scanned with a diffractometer using copper Ka radiation
at a rotation rate of 1 degree 2 theta per minute. The generator was
operated at 35 kilovolts and 15 milliamps. Diffractograms were prepared at
a scale factor of 2, a multiplier of 1, and a time constant of 4. The
samples were glycolated and rescanned to differentiate between smectite and
chlorite clays. Smectite expands from 14 to 17 A (angstrom units) when
ethylene glycol replaces water in the mineral lattice. The expansion was
achieved by exposing the clay slides to an ethylene glycol atmosphere for 24
hours.
The results reported by the ISU X-ray diffraction laboratory for the 10
samples analyzed for clay mineralogy give qualitative estimates of the
abundance of clay minerals in the samples. The estimates were based on the
relative heights of the clay-mineral peaks on the X-ray diffractograms.
Five categories were designated in order of decreasing abundance: dominant,
major, minor, trace, and possibly present.
GRAIN-SIZE DISTRIBUTION OF SURFICIAL SEDIMENT
The distribution of grain size for 13 samples from the Little Lost
River and Birch Creek drainages is given as weight percents in tables 1 and
2 (all tables are located at end of report). A statistical summary of the
data for each drainage system is given in table 3. Overall, the Birch Creek

channel and overbank deposits are coarser than the Little Lost River channel
and overbank deposits. For example, six samples from Birch Creek had mean
and median weight percents of 7.8 and 2.5, respectively, for the size
fraction smaller than 0.062 mm (table 3). Conversely, seven samples from
the Little Lost River had mean and median weight percents of 34.5 and 23.8,
respectively, for the same size fraction (table 3). The minimum, maximum,
median, and mean values for all size fractions for channel deposits and
channel and overbank deposits for the two drainage systems are listed in
table 3. Curves showing the cumulative percentages by weight for each of
the 13 samples are shown in figures 2 and 3. For this report, size
fractions of <0.002 mm (tables 1-3) were reported because clay minerals
probably are the predominant constituent.
MINERALOGY OF SURFICIAL SEDIMENT
The mineralogy of seven bulk samples and six clay samples from the
Little Lost River is listed in table 4. The mineralogy of six bulk samples
and four clay samples from Birch Creek is listed in table 5 . Three of the
samples in tables 4 and 5 did not contain clay minerals and X-ray slides
were not prepared. A statistical summary of the semiquantitative bulk
mineralogy is given in table 6.
Statistical parameters for the semiquantitative bulk mineral analysis
for Birch Creek and the Little Lost River (table 6) show that Birch Creek
had larger mean percentages of quartz and calcite--44 and 28, respectively--
than the Little Lost River--32 and 16, respectively. The Little Lost River
had larger mean percentages of total feldspar and dolomite--29 and 10,
respectively--than Birch Creek--15 and 4, respectively (table 6). Detrital
mica was present in some of the Little Lost River samples, but was not
present in the Birch Creek samples (tables 4 and 5).
Qualitative determination of clay mineralogy for the Little Lost River
and Birch Creek drainages indicated that illite was the dominant clay
mineral present (tables 4 and 5). Smectite and mixed layer clay minerals
were in major abundance in four samples from the Little Lost River, but only

0)
10
O
(D
H«
ft
O p)
0> OM
0>
0>
3
PI
ftH
«
3
<^
0)
0)
rt
M
hh
W
O
OQ js- n> ,_.
H«
p.
ft ft
rt
w
M
a>
M»
H«
d
Wm
H
' (D
N
I-S
(D
Cum
ulat
ive
wei
ght
perc
ent
O bo p
p
Li r
o b
i -±
ro
01ro
o
§ 8
co CJl
o co
I ro
Q CD 3 ^5-"
S" c rt-"
0)
ro 00
<p
COO oo
I I
I T
DD
I I
I I
I I
DD
I I
II
I I
I I
1 I
T
1I
I
I I
I I

99.99
99.999.8
9998
95
9°
£1 O>
1<D
E3O
80
70605040
30
20
10
21
0.50.20.1
0.05
0.01
I I I I T T
BCB-1 BCB-3
BCB-4 BCB-3
-2 -1 2345
Grade limit (phi units)
99-0836
Figure 3.--Cumulative weight percent versus grade limits for grain-size analyses of surficial sediment from Birch Creek (locations are shown in fig. 1).
11

one sample from Birch Creek contained a trace of smectite and the possible
presence of mixed-layer clays (tables 4 and 5) . Kaolinite was present in
variable amounts in four samples from the Little Lost River but only one
sample from Birch Creek had possible, kaolinite. Some of the samples had
traces of quartz and calcite in the less than 0.004 mm fraction.
SUMMARY
The U.S. Geological Survey's project office at the INEL, in cooperation
with the U.S. Department of Energy, collected 13 samples of surficial
sediment from Little Lost River and Birch Creek drainages during August 1988
for analysis of grain-size distribution, bulk mineralogy, and clay
mineralogy. Samples were collected from five sites in the channel of the
Little Lost River, two sites from overbank deposits of the Little Lost
River, five sites in the channel of Birch Creek, and one site from an
overbank deposit of Birch Creek.
Semi quantitative X-ray diffraction analysis was used to determine bulk
mineralogy. Individual clay minerals were identified in 10 samples. Sieve
and pipette analyses were used to determine grain-size distribution.
The six Birch Creek channel and overbank deposits had a mean of 7.8 and
median of 2.5 weight percent in the less than 0.062 mm fraction. The seven
Little Lost River samples had a mean of 34.5 and median of 23.8 weight
percent for the same size fraction. Mineralogy data indicated that Birch
Creek had larger mean percentages of quartz and calcite, and smaller mean
percentages of total feldspar and dolomite than the Little Lost River
deposits. Illite was the dominant clay mineral present in both drainages,
but the Little Lost River deposits contained more smectite, mixed-layer
clays, and kaolinite than the Birch Creek deposits.
12

REFERENCES CITED
Bartholomay, R.C., Knobel, L.L., and Davis, L.C., 1989, Mineralogy and grain size of surficial sediment from the Big Lost River drainage and vicinity, with chemical and physical characteristics of geologic materials from selected sites at the Idaho National Engineering Laboratory, Idaho: U.S. Geological Survey Open-File Report 89-384 (DOE/ID-22081), 74 p.
Barraclough, J.T., Lewis, B.D., and Jensen, R.G., 1981, Hydrologic conditions at the Idaho National Engineering Laboratory, Idaho, Emphasis: 1974-1978: U.S. Geological Survey Water-Resources Investigations Open-File Report 81-526 (IDO-22060), 77 p.
Davis, R.A. , Jr., 1983, Depositional Systems, A genetic approach to sedi mentary geology: Englewood Cliffs, New Jersey, Prentice-Hall, 667 p.
Diebold, F.E., Lemish, John, and Hiltrop, C.L., 1963, Determination of calcite, dolomite, quartz, and clay content of carbonate rocks: Journal of Sedimentary Petrology, v. 33, no. 1, p. 124-139.
Dietrich, R.V., Dutro, J.T., Jr., and Foose, R.M., compilers, 1982, AGI data sheets: for geology in the field, laboratory, and office (2d ed.): American Geological Institute, 159 p.
Folk, R.L., 1974, Petrology of sedimentary rocks: Austin, Texas, Hemphill Publishing Company, 182 p.
Krumbein, W.C., and Pettijohn, F.J., 1938, Manual of sedimentary petrography: New York, New York, Appleton-Century-Crofts, Inc., 549 p.
Mann, L.J., Chew, E.W., Morton, J.S., and Randolph, R.B., 1988, Iodine-129 in the Snake River Plain aquifer at the Idaho National Engineering Laboratory, Idaho: U.S. Geological Survey Water-Resources Investigations Report 88-4165 (DOE/ID-22076), 27 p.
Mundorff, M.J., Crosthwaite, E.G., and Kilburn, Chabot, 1964, Ground water for irrigation in the Snake River Basin in Idaho: U.S. Geological Survey Water-Supply Paper 1654, 224 p.
Pittman, J.R., Jensen, R.G., and Fischer, P.R., 1988, Hydrologic conditions at the Idaho National Engineering Laboratory, 1982-1985: U.S. Geological Survey Water-Resources Investigations Report 89-4008 (DOE/ID-22078), 73 p.
Robertson, J.B., Schoen, Robert, and Barraclough, J.T., 1974, The influence of liquid waste disposal on the geochemistry of water at the National Reactor Testing Station, Idaho: 1952-1970: U.S. Geological Survey Open-File Report 73-238 (IDO-22053), 231 p.
Schultz, L.G., 1964, Quantitative interpretation of mineralogical composition from X-ray and chemical data for the Pierre Shale: U.S. Geological Survey Professional Paper 391-C, 33 p.
13

Smith, N.D., 1970, The braided stream depositional environment: Comparison of the Platte River with some silurian clastic rocks, North-Central Appalachians: Geological Society of America Bulletin, v. 81, part 4, p. 2993-3014.
14

Table 1.--Grain-size distribution for the Little Lost River channel and overbank deposits, in weight
percent
[Symbols: < indicates value is less than indicated number; > indicates value is greater than indicated number. Grade name: Categories modified from the Wentworth scale (Dietrich and others, 1982, p.17.1).]
Sample identifier
Date sampled
LLRB-1
08/16/88
LLRB-2 LLRL-2R LLRB-3 LLRB-4
08/16/88 08/16/88 08/16/88 08/16/88
LLRB-5
08/16/88
LLRL-5L
08/12/88
Grade limits
Mi 1 1 imeters
>4.02.0-4.01.0-2.00.5-1.00.25-0.0.125-00.062-00.031-00.016-00.008-00.004-00.002-0<0.002
5.25.125.062.031.016.008.004
-10123456789
Phi
<-2to -2to -1to 0to 1to 2to 3to 4to 5to 6to 7to 8>9
Grade name
Other gravelsVery fine gravelVery coarse sand
Coarse sandMedium sandFine sand
Very fine sandCoarse siltMedium siltFine silt
Very fine si ItCoarse clay
Clay
Weight percent
61.49.74.22.8
10.46.53.5
Pipetteanalysis
notdone,total
= 1.3
59.38.84.73.8
10.17.53.0
Pipetteanalysis
notdone,total
= 2.9
0.20.20.20.31.78.213.323.519.210.78.54.39.6
00.22.7
18.742.021.810.3
Pipetteanalysis
notdone,total
= 4.3
0000.1
13.532.330.113.81.63.20.80.83.6
0.80.90.40.44.912.621.531.611.23.71.93.76.5
5.80.20.10.92.25.99.8
33.411.99.54.82.4
13.1
Table 2.--Grain-size distribution for Birch Creek channel and overbank deposits, in weight
percent
[Symbols: < indicates value is less than indicated number; > indicates value is greater than indicated number. Grade name: Categories modified from the Wentworth scale (Dietrich and others, 1982, p.17.1).]
Sample identifier
Date sampled
BCB-1
08/19/88
BCB-2
08/19/88
BCB-3 BCL-3L
08/19/88 08/19/88
BCB-4 BCB-5
08/19/88 08/19/88
Grade limits
Mi 11 imeters
>4.02.0-4.01.0-2.00.5-1.00.25-0.0.125-00.062-00.031-00.016-00.008-00.004-00.002-0<0.002
5.25.125.062.031.016.008.004
-10123456789
Phi
tototototototototototo>9
>-2-1012345678
Grade name
Other gravelsVery fine gravelVery coarse sand
Coarse sandMedium sandFine sand
Very fine sandCoarse si ItMedium siltFine si It
Very fine siltCoarse clay
Clay
42.715.814.413.78.01.23.2
Pipetteanalysis
notdone,total
= 1.1
51.115.55.85.29.65.25.3
Pipetteanalysis
notdone,total
= 2.3
Weight
66.213.86.45.64.50.41.9
Pipetteanalysis
notdone,total
= 1.2
percent
37.95.84.14.213.05.412.52.40.42.48.31.22.6
67.34.72.34.911.32.24.6
Pipetteanalysis
notdone,total= 2.7
58.82.91.11.43.12.67.62.31.72.84.03.48.3
15

Table 3.--Summary of statistical parameters for grain-size data of surficial sediment for the Little Lost River and Birch Creek drainages
[Units are weight percents and are derived from tables 1 and 2. Grade limits: >4.0 indicates sum of all sizes larger than 4.0 millimeters; <0.062 indicates the sum of all sizes smaller than 0.062 millimeters; <0.002 indicates the sum of all sizes smaller than 0.002 millimeters.]
Statistical parametersGrade limits (millimeters) Minimum Maximum Median Mean
Sample size
>4.02.0-4.01.0-2.00.5-1.00.25-0.50.125-0.250.062-0.125<0.062
>4.02.0-4.01.0-2.00.5-1.00.25-0.50.125-0.250.062-0.125<0.062
>4.02.0-4.01.0-2.00.5-1.00.25-0.50.125-0.250.062-0.125<0.062
>4.02.0-4.01.0-2.00.5-1.00.25-0.50.125-0.250.062-0.1250.031-0.0620.016-0.0310.008-0.0160.004-0.0080.002-0.004<0.002<0.062
[Little Lost River channel deposits]
0000.14.96.53.01.3
42.72.91.11.43.10.41.91.1
[Birch
37.92.91.11.43.10.41.91.1
61.49.74.718.742.032.330.158.6
[Birch Creek
67.315.814.413.711.35.27.6
22.5
Creek channel
67.315.814.413.713.05.2
12.522.5
0.80.92.72.8
10.412.610.34.3
channel deposits]
58.813.85.85.28.02.24.62.3
24.33.92.45.2
16.216.113.718.2
57.210.56.06.27.32.34.56.0
and overbank deposits]
54.959.84.955.058.82.44.952.5
[Little Lost River channel and overbank
0000.11.75.93.0
13.81.63.20.80.83.61.3
61.49.74.718.742.032.330.133.419.210.78.54.313.175.8
0.80.20.40.9
10.18.2
10.327.5511.556.63.353.058.05
23.8
54.09.85.75.88.22.85.87.8
deposits]
18.22.91.83.9
12.113.513.125.611.06.84.02.88.2
34.5
16

Table 4.--Mineralogy of bulk and clay samples by X-ray diffraction analysis for the Little
Lost River
[Symbols: 5 number is the sum of percents for detrital mica and total clays; NO indicates not detected. Bulk analyses: Semiquantitative analysis. Clay analyses: dom indicates mineral is dominant; maj indicates mineral is major in abundance; min indicates a minor amount; tr indicates mineral is present in a trace amount; poss indicates mineral is possibly present.]
Bulk analyses (in percent mineral abundance)
Sample identi fier
LLRB-1 LLRB-2 LLRL-2R LLRB-3 LLRB-4 LLRB-5 LLRL-5L
Date sampled
08/16/88 08/16/88 08/16/88 08/16/88 08/16/88 08/16/88 08/12/88
Quartz
38 40 24 31 27 32 30
Plagio- clase
feldspar
2212 11 24 14 18 17
Potas sium
feldspar Calcite
15 11 8
11 13 12 12
Clay analyses
Sample identi fier
LLRB-2 LLRL-2R LLRB-3 LLRB-4 LLRB-5 LLRL-5L
Date sampled
08/16/88 08/16/88 08/16/88 08/16/88 08/16/88 08/12/88
Illite
poss dom poss dom maj dom
Smectite
NO maj NO
maj maj maj
Kaolinite
NO tr NO
min poss poss
5 26 25 10 20 13 15
Pyroxene
12 0 0
10 0 0 0
Dolomite
8 7
14 10 11 11 12
Detrital Total mica clays
0 0 5 18 4 15 15 14
(qualitative analysis)
Mixed layer
NO maj NO
maj maj maj
Chlorite
NO NO NO NO NO
poss
Quartz
NO NO NO NO NO
poss
Feldspar Calcite
ND NO ND tr ND ND ND tr- ND ND ND ND
17

Table 5. Mineralogy of bulk and clay samples by X-ray diffraction analysis for Birch
Creek
[Symbols: ND indicates not detected. Bulk analyses: Semiquantitative analysis. Clay analyses: dom indicates mineral is dominant; maj indicates mineral is major in abundance; min indicates mineral is present in a minor amount; tr indicates mineral is present in a trace amount; poss indicates mineral is possibly present.]
Sample identi fier
BCB-1 BCB-2 BCB-3 BCL-3L BCB-4 BCB-5
Sample identi fier
BCB-2 BCL-3L BCB-4 BCB-5
Date sampled
08/19/88 08/19/88 08/19/88 08/19/88 08/19/88 08/19/88
Quartz
54 34 52 37 52 33
Bulk
Plagio- clase
feldspar
8 6 6 7 6 6
analyses (in percent mineral abundance)
Potas sium
feldspar Calcite
10 9 9
11 9 4
Clay analyses
Date sampled
08/19/88 08/19/88 08/19/88 08/19/88
Illite
min dom maj dom
Smectite
ND ND
poss tr
Kaolinite
ND poss ND ND
26 37 25 22 22 36
Pyroxene
0 0 6 0 0 0
Dolomite
2 4 2 5 4 6
Detrital mica
0 0 0 0 0 0
Total clays
0 10 0
17 7
16
(qualitative analysis)
Mixed layer
ND ND ND poss
Chlorite
ND ND ND ND
Quartz
min tr tr tr
Feldspar
ND ND ND ND
Calcite
ND ND
min ND
18
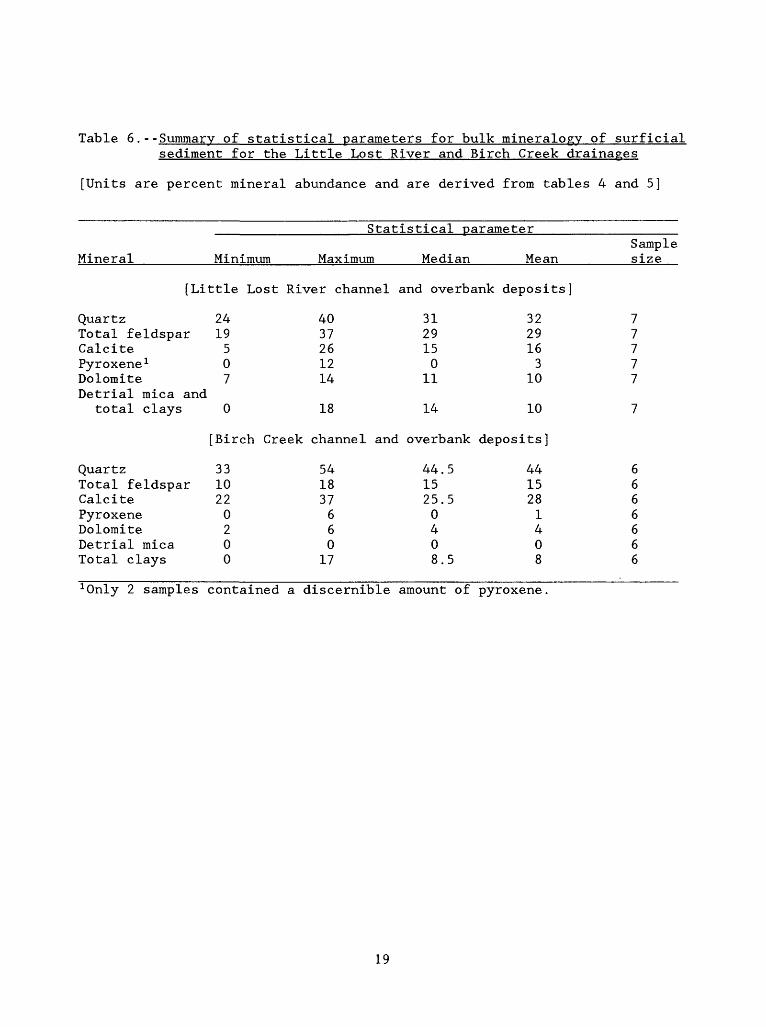
Table 6.--Summary of statistical parameters for bulk mineralogy of surflclalsediment for the Little Lost River and Birch Creek drainages
[Units are percent mineral abundance and are derived from tables 4 and 5]
Statistical parameter
Mineral Minimum Maximum
[Little Lost River channel
Quartz Total feldspar CalcitePyroxene 1 DolomiteDetrial mica and
total clays
Quartz Total feldspar CalcitePyroxene DolomiteDetrial micaTotal clays
24 19 507
0
[Birch Creek
33 10 220 200
40 37 2612 14
18
channel and
54 18 376 60
17
Median MeanSample size
and overbank deposits]
31 29 150
11
14
overbank
44.5 15 25.50 408.5
32 29 163
10
10
deposits]
44 15 281 408
7 7 77 7
7
6 6 66 666
1 0nly 2 samples contained a discernible amount of pyroxene
19