mineralogy and geochemistry of the sediments of...
TRANSCRIPT

CHAPTER 3

TEXTURE
3.1 INTRODUCTION AND REVIEW OF LITERATURE
In the past five decades, granulometric studies of
unconsolidated sediments have been a subject of intense research as it is
fundamentally related to the mechanism of transport and deposition of
sediments. Exhaustive studies on global scale reveal the existence of
sign if icant correlation between size frequency distribution and
depositional processes. Further, proper selection and combination of
statistical parameters can excellently be used to discriminate various
environments of deposition of ancient as well as recent sediments (Folk,
1966; Friedman, 1967 and Hails and Hoyt, 1969). Apart from
environmental implications, the particle size distribution bears
considerable influence on the mineralogical (Mishra, 1969 and Patro et
al., 1989) and chemical (Williams et al., 1978 and Forstner and
Wittmann, 1983) constitution of sediments as well. Hence, an attempt has
been made in this chapter to understand the particle size distribution of
the sediments of Muvattupuzha river and Central Vembanad estuary so as
to have proper insights of its influence on the mineralogy and
geochemistry.
The grain size analysis of clastic sediments is very important
on many ways and are as follows: (a) the grain size 1S a basic
descriptive measure of the sediment; (b) the grain size distributions
may be characteristic of sediments deposited in certain environments; (c)
the grain size distributions may yield information about the physical
mechanisms acted on the sediments during deposition; and (d) the grain
size may be related to other properties such as permeability,
mineralogy, geochemistry etc. The characteristics of grain size
distribution of sediments may be related to the source materials, process
of weathering, abrasion and corrosion of the grains and sorting processes

19
during transport and deposition.
Several studies of the size distributions of clastic sediments
have revealed the existence of statistical relationships between the
different size parameters such as mean size, sorting (standard deviation)
skewness and kurtosis. The relation between mean size and sorting is
particularly weJI established and many studies have shown that the best
sorted sediments are generally those with mean size in the fine sand
grade (Pettijohn, 1957; Griffiths, 1967 and AlIen, 1970). Several
attempts have been made to differentiate various env ironments from size
spectral analysis as particle distribution is highly sensitive to the
environment of deposition (Mason and Folk, 1958; Friedman, 1961, 1967;
Griffiths, 1962; Moiola et al., 1974; Stapor and Tanner, 1975;
Nordstrom, 1977; Goldberg, 1980; Sly et al., 1982 and Seralathan, 1988).
Friedman (1961, 1967) has studied the samples of relatively fine grained
sands taken from many different localities around the world from various
env ironments such as dunes, beaches and river. The most effective
distinction of sands from these three environments is shown by a
scatter diagram of moment standard deviation (sorting) versus moment
skewness. Visher (1969), based on the log normal distribution of grain
size, has identified three types of populations such as rolling, saltation
and suspension which indicate distinct modes of transportational and
depositional processes. Passega (1957, 1964) has established the
relationship between texture of sediments and process of deposition
rather than between texture and env ironment as a whole. According to
Passega, a clastic deposit is formed by sediments transported in
different ways. In particular, the finest fraction may be transported
independently of the coarser particles. Swift sedimentary agents be
characterised best by parameters which give more information on the
coarsest than on the finest fractions of their sediments. Hence, the
logarithmic relation between the first percentile (C) and median (\1) of
clastic sediments is highly significant in understanding the
transportational regimes.

20
In India, textural attributes of sediments from different
environments have been attempted by many researchers (Sahu, 1964;
Mishra, 1969; Veerayya and Varadachari, 1975; Rajamanickam, and Gujar,
1985; Samsuddin, 1986; Seralathan, 1988 and Jahan et al. , 1990) •
Subba Rao (1967) has made a detailed investigation on the composition
and texture of the shelf sediments of the east coast of India. Grain
size characteristics of sediments deposited at the mouth of Hoogl y river
were carried out by \1allik (1975). Rajamanickam ( 1983) and
Rajamanickam and Gujar ( 1985) have investigated the grain size
distribution of the surficial sediments of west coast of India. The
sediment characteristics of the continental shelf of Karnataka coast have
been carried out by Hashmi and Nair (1981). Murthy and Rao (1989)
have investigated the textural characteristics of the sediments of
Visakhapatnam coast. Like the shelves, considerable information exist
on the textural aspects of beach sands as well (Kidwai, 1971; Veerayya
and Varadachari, 1975; Samsuddin, 1986; Purandara et al., 1987;
Unnikrishnan, 1987 and Sasidharan and Damodaran, 1988) • But studies on
the textural characteristics of major river systems are meagre. Naidu
(1968) has studied the textural variations of Godavari river sediments.
Sediment texture of Krishna and Mahanadi drainage systems has been
covered by Seetharamaswamy (1970) and Satyanarayana (1973)
respecti vely. Dora (1978) has investigated the textural characteristics
of Vasishta Godavari drainage system. A detailed granulometric
investigation of the sediments of the major and subenvironments of the
modern deltaic sediments of Cauvery river has been carried out by
Seralathan (1979). Mohan (1990) has studied grain size parameters and
its significance of Vellar river and estuary. A few accounts also exist
on the grain size characteristic of Vembanad lake as well Josanto,
1971 b; Murthy and Veerayya, 1972a and Purandara and Dora, 1987).
Recentl y, Sundaresan P ilIai ( 1989) has studied the sediment input
mechanisms in the Vem banad lake around Willington island.
21
3.2 RESUL TS AND DISCUSSION
3.2.1 GRAIN SIZE VARIATION
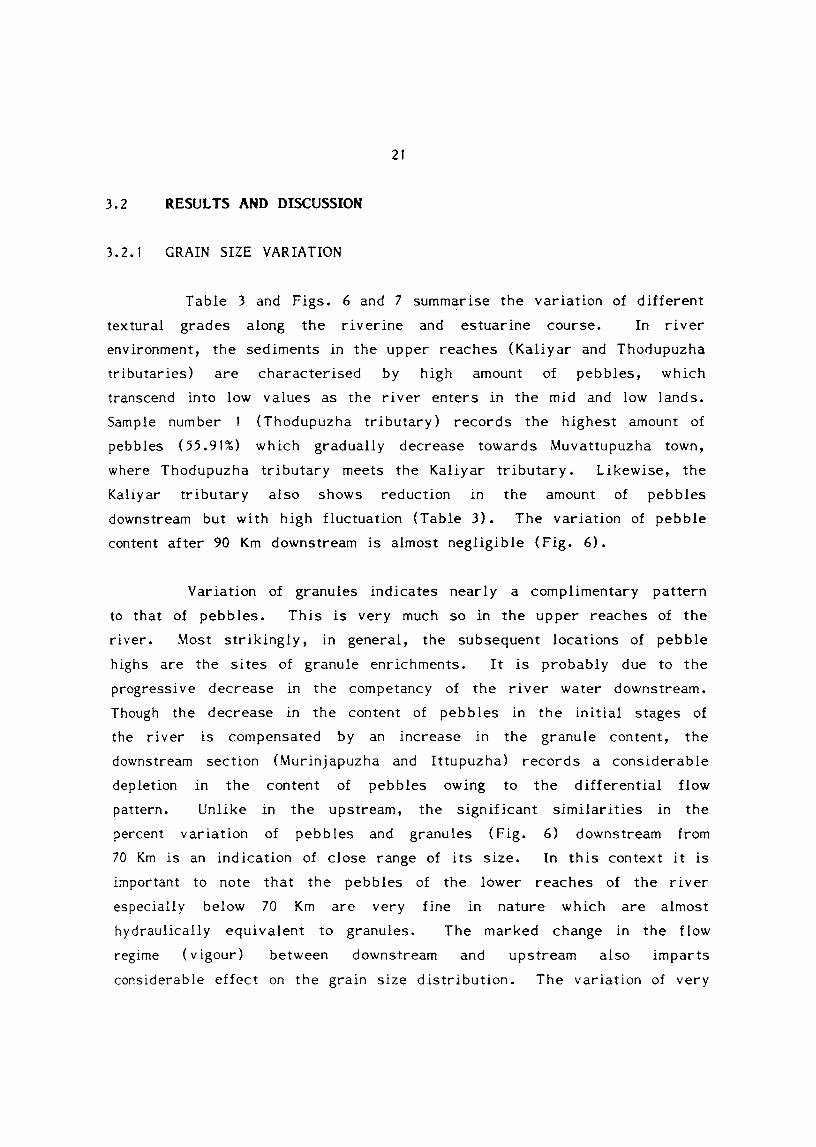
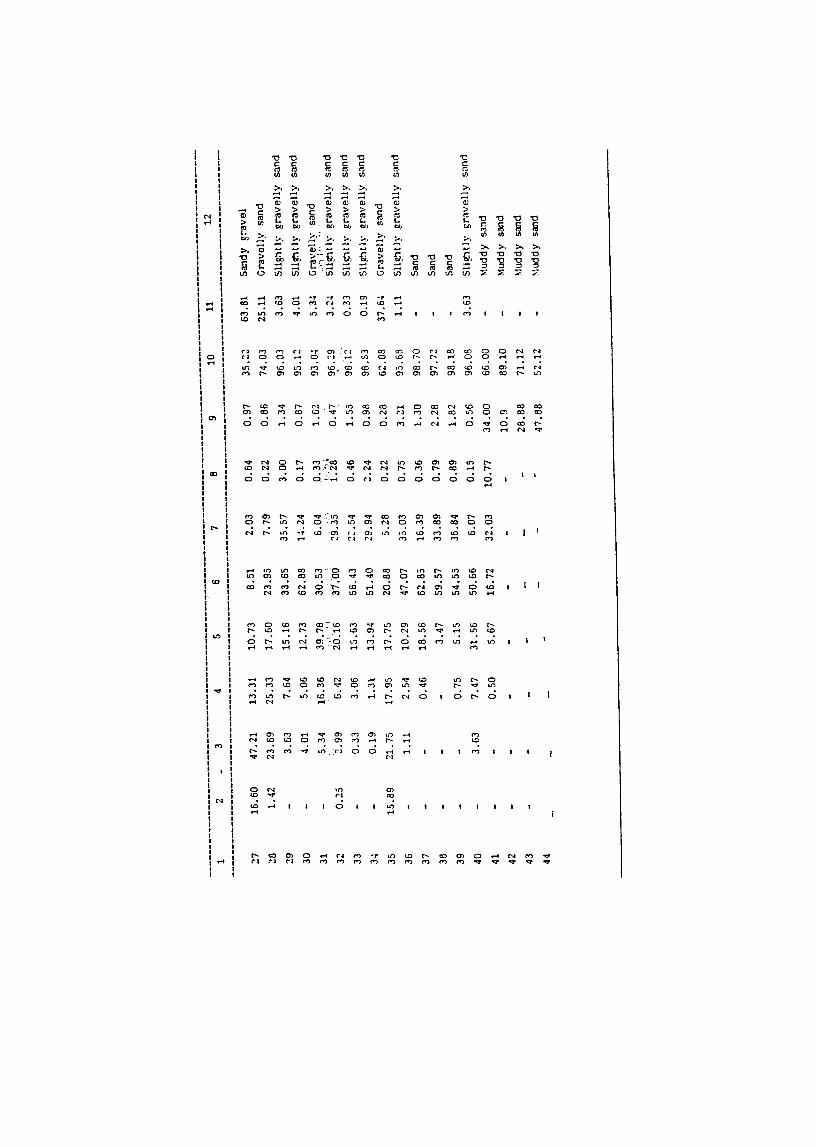
Table 3 and Figs. 6 and 7 summarise the variation of different
textural grades along the riverine and estuarine course. In river
em;,ironment, the sediments in the upper reaches (Kaliyar and Thodupuzha
tributaries) are characterised by high amount of pebbles, which
transcend into low values as the river enters in the mid and low lands.
Sample number 1 (Thodupuzha tributary) records the highest amount of
pebbles (55.91%) which gradually decrease towards Muvattupuzha town,
where Thodupuzha tributary meets the Kaliyar tributary. Likewise, the
Kaliyar tributary also shows reduction in the amount of pebbles
downstream but with high fluctuation (Table 3). The variation of pebble
content after 90 Km downstream is almost negligible (Fig. 6).
Variation of granules indicates nearly a complimentary pattern
to that of pebbles. This is very much so in the upper reaches of the
river. Most strikingly, in general, the subsequent locations of pebble
highs are the sites of granule enrichments. It is probably due to the
progressi ve decrease in the competancy of the river water downstream.
Though the decrease in the content of pebbles in the initial stages of
the river is compensated by an increase in the granule content, the
downstream section (Murinjapuzha and Ittupuzha) records a considerable
depletion in the content of pebbles owing to the differential flow
pattern. Unlike in the upstream, the significant similarities in the
percent variation of pebbles and granules (Fig. 6) downstream from
70 Km is an indication of close range of its size. In this context it is
important to note that the pebbles of the lower reaches of the river
especially below 70 Km are very fine in nature which are almost
hydraulically equivalent to granules. The marked change in the flow
regime (v igour) between downstream and upstream also imparts
considerable effect on the grain size distribution. The variation of very

.. T
AB
LE
3
Perc
en
tag
e
of
vari
ou
s
siz
e
gra
des
in
Cen
tral
Vem
ban
ad
estu
ary
th
e
sed
imen
ts
of
Mu
vatt
up
uzh
a
riv
er
an
d
a)
MU
VA
TT
UP
UZ
HA
R
IVE
R
Sam
ple
N
o.
1
1 2 3 4 5 6 7 8 9 10
11
12
13
14
15
15A
16
17
18
19
20
21
23
24
25
26
Peb
ble
G
ranu
le
Ver
y C
oars
e S
and
(a)
(b)
(c)
2
55.9
1
24.6
0
11.4
9
12.4
7
46.7
8
7.81
9.79
9.79
1.1
3
33.9
6
36.7
0
10.0
7
36.6
4
20.9
8
5.92
17.0
3
18.6
3
31.3
4
3.34
2.7·
3 5.
72
1.1
8
8.86
0.73
3
11.0
5
13.4
0
17.3
8
38.2
4
0.B
7
32.B
1
49.7
1
49.5
6
B.1
4
B.8
5
13.2
9
1B.B
3
12.3
2
16.6
7
30.3
2
6.10
1.65
19.1
7
21.B
6
16.3
3
,19.
45
7.44
15.3
2
22.3
7
4.B
7
4 2.35
B.BB
14.4
9
25.2
7
1.5B
2B.l
17.9
B
0.24
17.4
0
14.5
7
7.86
4.26
11.4
6
6.B
7
12.4
3
30.2
0
5.63
17.9
8
11.6
6
17.4
2
11.9
4
34.1
1
5.56
29.6
1
26.3
7
11.8
5
Co
arse
S
and
(d)
5 2.92
12.9
7
21.1
0
16.2
9
13.5
1
20.2
8
3.70
6.06
3.70
30.7
0
17.2
0
5.70
12.6
7
15.0
0
12.9
5
19.6
0
12.1
3
71
.66
17.1
1
14.0
8
17.4
4
32.9
0
9.16
33.7
2
30.3
2
34.0
6
Med
ium
S
and
(e) 6
17.1
7
22.5
2
22.0
5
5.7
3
23.6
6.1
1
4.24
65.7
0
4.24
31.6
8
20.4
6
16.6
4
29.6
2
16.2
3
21.2
6
4.84
31.2
0
4.37
26.5
0
10.9
3
28 ..
68
9.53
31.1
1
16.4
0
3.33
41.5
8
Fin
e Sa
nd
(f) 7 8.06
14.6
0
9.79
0.82
10.4
2
3.00
9.51
25.2
7
9.51
11.2
7
9.72
19.6
1
14.3
0
9.51
11.9
8
2.89
25.2
4
0.99
5.82
2.45
19.6
2
0.57
33.0
7
2.40
1.0
7
5.20
Ver
y M
ud
San
d G
rave
l
~:~
(S1l
t+C
lay)
(c+
d+e+
f+g)
(a+
b)
(g)
lOO
0/0
8 0.92
1. 7
7
1.2
9
0.66
2.17
1.39
4.42
1.8
7
1l.4
2
1.5
9
1.19
3.03
2.10
2.10
1. 9
2
3.54
1.4
7
1.1
8
0.66
0.30
2.39
0.26
5.72
0.78
0.45
0.75
9 1.62
1.21
2.41
0.57
0.67
0.32
LlB
0.84
1.2
0
0.92
0.74
0.75
0.75
1.3
3
1. 7
9
2.51
1.2
0
2.17
0.43
1.62
0.36
0.45
2.22
0.59
2.25
0.96
10
31. 4
2
60.7
9
66.7
2
46.7
2
51.6
6
59.0
6
39.3
2
99.1
6
39.1
6
69.6
1
56.4
5
49.2
6
70.3
5
49.7
1
39.4
4
61.2
5
75.6
7
96.1
8
61.7
7
45.1
6
79.9
7
76.2
7
B4.
62
82.9
1
66.5
2
93.4
4
11
66.9
6
3B.O
O
2B.B
7
50.7
1
47.6
5
40.6
2
59.5
0
59.6
2
9.27
42.B
1
49.9
9
2B.9
0
4B.9
6
37.6
5
36.2
6
23.1
3
1.65
37.8
0
53.2
0
19.6
7
22.1
6
13.1
6
16.5
0
31.2
3
5.60
Tex
tura
l te
rmin
olo
gy
(F
olk
et
a1
..
1970
)
12
San
dy
gra
vel
San
dy
gra
vel
Gra
vel
ly
sand
San
dy
gra
vel
San
dy
gra
vel
San
dy
gra
vel
San
dy
gra
vel
San
d
San
dy
gra
vel
Gra
vel
ly
sand
San
dy
gra
vel
San
dy
gra
vel
Gra
vel
ly
sand
San
dy ~ravel
San
dy
gra
vel
San
dy
gra
vel
Gra
vel
ly
sand
Sli
gh
tly
g
rav
elly
sa
nd
San
dy
gra
vel
San
dy
gra
vel
Gra
vel
ly
sand
Gra
vel
ly
sand
Gra
vel
ly
san
d
Gra
vel
ly
sand
San
dy
gra
vel
Gra
vel
ly
sand
--------------------------------------------------~---------------------------------------------------------------------------------
1 '27 '28
'29
30
31
32
33
34
35
36
37
38
39
40
41
42
43
44
2
16.6
0
1. 4
2
0.25
15.6
9
3
47.2
1
23.6
9
3.63
4.01
5.34
'2.9
9
0.33
0.19
21. 7
5
1.11
3.63
4
13.3
1
25.3
3
7.64
5.06
16.3
6
6.42
3.06
1.3
1
17.9
5
2.54
0.46
0.75
7.47
0.50
5
10.7
3
17.6
0
15.1
6
12.7
3
39.7
8
i6':1'
6' 15
.63
13.9
4
17.7
5
10.2
9
18.5
6
3.47
5.15
31
. 56
5.67
6 8.51
23.9
5
33.6
5
62.8
8
30.5
3
31:od
56
.43
51.4
0
20.8
8
47.0
7
62.8
5
59.5
7
54.5
5
50.6
6
16.7
2
7 2.03
7.79
35.5
7
1~.24
6.04
.
,I
29.3
5
::.5
4
29.9
4
5.28
35.0
3
16.3
9
33.8
9
36.8
4
6.07
32.0
3
8 0.64
0.22
3.00
0.17
.0.3
3 L
I.1
1 \
1.28
0.46
2.24
0.22
0.75
0.36
0.79
0.89
0.15
10.7
7
9 0.97
0.8
6
1.3
4
0.87
1.6
2
0.47
1.5
5
0.98
0.28
3.21
1.3
0
2.28
1.8
2
0.56
34.0
0
10
.9
28.8
8
47.8
8
10
35.2
2
74.0
3
96.0
3
95.1
2
93.0~
96
.:9
9B:1
2
98.3
3
6::.0
8
95.6
8
9B.iO
97.7
2
98.1
8
96.0
8
66.0
0
89.1
0
71.1
2
52.1
2
11
12
63.6
1 Sa
ndy
gra
vel
25.1
1 G
rave
lly
sand
3. 63
Slig~t ly
g
rav
elly
sa
nd
4.01
S
litl
tly
gra
vel
ly
sand
5.3~
Gra
vell
\' sa
nd
'11
"
.....
,
3.24
S
litl
tly
g
rav
elly
sa
nd
0.33
S
lip
tly
g
rav
elly
sa
nd
0.19
Slig~t1y
gra
vel
ly
sand
37.6~
Gra
vell
y sa
nd
1.11
S
lip
tly
g
rav
elly
sa
nd
Sand
Sand
Sand
3.63
S
lip
t ly
gra
vel
ly
sand
Mud
dy
sand
Mud
dy
sand
Mud
dy
sand
~luddy
sand
b)
CE
NT
RA
L VE~o1BANAD
ES
TU
AR
Y
----
----
----
----
----
----
----
----
----
----
----
----
----
----
----
----
----
----
----
----
----
----
----
----
----
----
----
----
----
--S
ampl
e N
o.
1 45
46
47
48
49
5'0
51
52
53
54
55
56
57
58
59
60
61
62
63
64
65
66
67
68
69
70
Coa
rse
Sand
(a)
2 0.79
3.6
9
0.82
2.22
3.8
0
15.4
4
2.7
0
1.0
8
4.11
2.10
0.7
9
1.8
0
12
.40
4.94
3.0
2
Med
ium
Sa
nd
(b)
3
23.0
6
5.69
6.41
4.05
0.96
15.6
1
20.7
6
51.4
0
16.6
9
20.5
4
29.6
2
6.66
13.4
0
12.2
4
47.6
0
44.4
9
0.63
30.0
2
Fin
e S"
and
(c)
4
59.0
4
23.7
5
1.39
22.3
2
16.6
7 ;
'1:
10:3
3
4.16
44.5
6
40.6
1
29.9
4
49.4
0
54.2
5
34.3
1
10.0
9
12.6
4
57.9
3
2.30
64.8
9
31.7
7
31.0
5
2.81
42.0
5
0.43
4.1
Ver
y F
ine
Sand
(d)
5 5.21
12.2
6
4.43
14.5
5
15.5
7
23.2
8
16.1
3
16.2
5
9.79
2.24
20.1
4
6.09
6.01
36.0
7
62.6
3
11
.66
13.0
3
4.67
12.1
1
3.1
0
3.56
9.7
2
6.04
6.26
6.37
1. 5
6
Coa
rse
Sil
t
(e)
6 0.3
6
22.5
9
24.8
8
11.3
4
15
.79
2!
L41
'
19.3
5
7.5
6
5.7
1
0.98
0.09
2.42
5.62
14.4
7
1.4
4
5.13
25.6
5
10.2
6
0.5
0
0.66
1.9
2
39.6
6
6.5
9
13.6
5
6.6
9
6.7
5
Med
ium
S
ilt
(f) 7 0.93
0.89
6.05
5.32
11
.60
2.90
21.8
0
1.8
6
2.32
0.12
2.65
2.45
4.15
5.35
2.63
2.35
4.13
12
.60
1.5
0
0.5
0
1.6
0
2.42
0.63
30.3
0
13.6
3
16.5
2
Fin
e +
V
ery
Fin
e S
ilt
(8)
6 2.35
4.85
21.0
0
14.9
0
15.1
B
17.7
4 1
.!I
' 9.
87
6.00
4.57
0.24
0.65
4.60
4.96
3.20
2.50
1.66
7.37
27.0
6
2.95
1.17
3.06
18.6
7
1. 7
9
14.6
3
26.7
3
34.4
2
Coa
rse
6 M
ediu
m
Cla
y
(h)
9 5.76
6.16
12.5
5
9.85
7.65
5.33
1B.1
5
4.91
6.42
0.20
4.66
3.13
4.87
10.0
3
2.26
2.11
10
.4
12.3
5
2.39
2.55
4.36
6.46
7.65
17.9
2
14.3
8
6.68
Fin
e 6
Ver
y F
ine
Cla
y (1
)
10
LlB
20.5
7
27.7
0
11. 4
8
13.6
5
14.2
8
8.63
0.63
6.6
0
0.32
2.6
0
3.52
4.65
21.7
3
5.05
5.91
36.9
0
32.6
8
2.03
0.15
4.6
0
16.7
7
0.35
16
.16
25.4
3
29
.73
Sand
S
ilt
(a+
b+
c+
d)
(e+
f+8
)
11
67.7
9
56.6
5
5.62
46.6
6
36.1
3
34.3
4
22.1
6
76.8
4
75.5
8
99.0
2
66.9
0
63.6
8
75.7
6
45.2
3
65.6
0
63.5
9
15.5
5
4.67
90.6
4
94.7
4
86.3
1
13.2
6
82.6
1
6.75
6.3
7
1. 5
6
100
"/. 12
6.23
12.1
9
53.9
3
32.0
1
42.3
7
46.0
6 I'
51.0
4
15.4
3
12.3
9
0.36
3.60
9.62
16.7
6
23.0
2
7.06
9.1
1
44.0
5
49.9
0
4.93
2.46
6.74
60.9
9
9.19
61.2
0
47.2
6
59.6
2
Cla
y
(h+
1)
13
Tex
tura
l te
rm
inol
ogy
(Fol
k et
al.
. 19
70) 14
3.98
M
uddy
sa
nd
30.9
6 C
laye
y sa
nd
40.2
5 M
ud
21. 3
3 S
andy
m
ud
21.5
0 S
andy
m
ud
19.6
0 S
andy
si
lt
26.7
8 S
andy
m
ud
5.7
3
12.0
3
0.52
7.5
0
6.50
5.46
31. 7
6
7.32
7.3
0
40.4
0
45.2
3
4.43
2.80
6.95
25.7
5
6.0
0
32.0
5
46.3
7
36.6
0
Sil
ty
sand
Mud
dy
sand
Sand
Cla
yey
sand
Mud
dy
sand
Sil
ty
sand
San
dy
mud
Mud
dy
sand
Mud
dy
sand
San
dy
mud
Mud
Sand
Sand
Mud
dy
sand
San
dy
silt
Mud
dy
sand
Mud
Mud
Mud

----
----
----
----
----
----
----
----
----
----
---,-
----
----
----
----
----
----
----
----
----
----
----
----
----
----
----
----
----
----
----
----
----
----
----
----
1 2
3 4
5 6
7 8
9 10
11
12
13
14
--
----
----
----
----
----
----
----
----
----
----
----
----
----
----
----
----
----
----
----
----
----
----
----
----
----
----
----
----
----
----
----
----
----
----
---
71
5.00
14
.99
5.71
0.
38
10.2
2 6.
83
15.8
3 15
.63
25.3
8 26
.08
32.9
2 41
.00
Sa
nd
y m
ud
72
1.05
11
.36
44.4
6 13
.88
3.46
6.
12
5.05
2.
55
10.3
5 70
.75
14.6
3 14
.62
Mu
dd
y sa
nd
73
1.2
2
8.68
30
.07
6.60
6.
45
9.88
10
.05
3.93
23
.43
46.2
4 26
.41
27.3
5 S
an
dy
74
7.19
41
. 74
46.3
7 1.
49
0.01
0.
33
1.96
0.
73
0.32
97
.22
1.73
1.
05
San
d
75
1.2
0
6.26
3.
07
3.49
21
.20
9.50
11
.20
16.9
6 22
.07
18.9
6 42
.34
36.6
8 S
an
dy
mud
76
1.6
0
15.2
7 53
.,14
7.50
2.
68
1. 7
5 4.
40
2.95
10
.51
77.3
7 9.
03
13.6
0 M
ud
dy
sand
77
0.91
11
.06
52.4
9 20
.87
2.00
2.
98
1.55
1
.98
6.
54
84.9
7 6.
53
8.50
M
ud
dy
sand
78
0.38
12
.79
41.6
5 31
.85
2.67
2.
68
1.1
0
1.9
0
5.65
85
.81
6.44
7.
75
Mu
dd
y sa
nd
79
0.39
5.
35
59.4
3 26
.40
0.06
2.
80
0.60
0.
61
4.75
91
.19
3.46
5.
35
San
d
80
1.82
10
.12
20.2
2 8.
78
17.7
0 11
.20
10.8
5 19
.17
34.2
9 37
.66
28.0
3 S
an
dy
mud
,\
82
0.22
9.
05
14.6
5 20
.97
16.4
5 38
.65
0.22
44
.68
55.1
0 M
ud
83
4.56
4.
65
20.1
0 4.
78
17.0
7 18
.62
30.3
0 9.
13
41. 9
4 48
.93
Mud
84
0.76
11
.34
9.48
31
.50
14.7
1 32
.65
0.78
51
.87
47.3
5 M
ud
65
1.26
44
.26
22.0
5 4.
94
3.45
7.
36
6.68
9.
96
67.5
9 15
.74
16.6
6 M
ud
dy
sand
66
3.55
19
.46
15.7
4,
3.37
11
.81
6.85
6.
72
11.6
5 19
.71
42.6
2 27
.03
30.5
5 S
an
dy
mud
87
1.61
16
.67
4.66
36
.63
32.2
6 7.
98
1.61
56
.17
40.2
3 M
ud
68
4.17
3.
41
2.74
2.
47
17.4
0 0.
47
22.8
9 21
.32
25.1
0 12
.80
40.7
7 46
.43
Sa
nd
y m
ud

22
coarse sand is also similar to that of granules along the profile of the
river (Fig. 6). A general increase in the content of coarse sand
downstream is noted, but the increase is only marginal in the
distributaries (Ittupuzha and Murinjapuzha). Variation of medium sand
clearly indicates deviation from coarser entities by showing an increase
towards river mouth. This is in consonance with the flow pattern
controlled by the gradient of the terrain (Fig. 3). Thus it can be seen
that coarse sand marks the transition phase of spectral changes in the
sUb-populations of size distribution. Fine sand also depicts a similar
kind of variation as that of medium sands. However the contents of
very fine sand and mud (silt + clay) are negligible and do not
characterise significant variation as the flow condition does not facilitate
its deposition.
shows
Thus
marked
the overall
variations in
spectral analysis of various size
the Muvattupuzha fluvial regime:
grades
(1) The
enhanced amount of pebbles, granules and very coarse sands in the two
tributar ies ind icate the existence of high energy cond i tions owing to the
high gradient of the tributaries and (2) a sand dominant domain of
Muvattupuzha river proper {main channel} with a progressive downstream
increase of medium and fine sands indicates a low energy regime. This
manifests the difference in the transportational pattern of bed load with
the former characterising rolling processes and the latter sal tation.
Unlike the ri ver, the estuarine hydrodynamics are
characterised by flow patterns coinciding with semidiurnal ebb and flood
tides. The granulometric variations exemplify the complexity of the flow
patterns prevailing within the Central Vembanad basin. However,
coarser entities, which are encountered in the river sediments, are
totally missing or present only in subtle quantities. High proportions of
fine and medium sands in the immediate vicinity of Thannirmukham bund
are obviously due to the scouring action of the water jet infiltration
which winnows silt and clay resulting in the deposition of fine and

20
oJ.- SI+CL . . ... ... . -----..................... (
20 VFSA o~~------~--------~
If)
50 40
20
o 70 60
40
20
t5 0 ~ 80
& 60 l.L
W 40 N
If) 20 z <! 0 ffi 40
~ 20 W 0 <..9 ~ 50 ifj 40 u ffi 20 0.. 0
60
40
20
VCSA
[
OT---.---~--~~-r---T~~~~--~ 4-0 50 GO 70 80 ~O 100 ltO 120
RIVER DISTAN CE Km
Fig. 6 Downstream vari2tion of grain size fractions through Thodupuzha Muvattupuzha Ittupuzha river channels (PE Pebble, GR Granule, VCSA Very coarse sand, CSA Coarse sand, MSA Medium sand, FSA Fine sand, VFSA Veryfine sand and Sl+CL Silt + Clay)

"'j 40
20
0 30
J 20
0 40
2~j Vl 2~J z 0 f- 40
j
'<i a:: 20 u.. w 0 N Vi 70 z 60 « 40 a:: l!>
"- 20 0
0 w 60 l!> ~ 40 z w
~ 20
0
"'J 40
20
0 20
1 o ,....." 0
[TB] • 4-
FSI.VJ'S.
MS.
CSI
~ CSA :r--B11'2 ~D J~ DISTANCE Km
f 28 [Fe]
Fig. 7 Variatjon of grain size frac tions in the sediments of Central Vembanad estuary j .e. from T hannirmukham Bund [TB] to Fort eachin [FC]. (CSA Coarse sand, MSA Medium sand, FSA Fine sand, VFSA Veryfine sand, CSI Coarse si! t I MS! Med ium si I t, FSI ... VFSI Fi ne silt ... Veryfine silt, CC+MC Coarse clay + Medjum cJay);ID lllUpuzha diSlribo!ary, MD MurilJj aptl2h. d(stril>ulary

23
medium sands. From thereon, fine particles (silt and clay) show marked
enrichment towards the estuarine mouth with some sporadic cases of sand
dominance (Table 3). These anomalous high values of medium and fine
sand fractions may be resulted from the seasonal maintenance dredging
activ ities by the Port authorities. The Muvattupuzha river mouth area
contains substantial amount of coarse and medium sands (Fig. 7) chiefly
reflecting the influx of sand load from Muvattupuzha river.
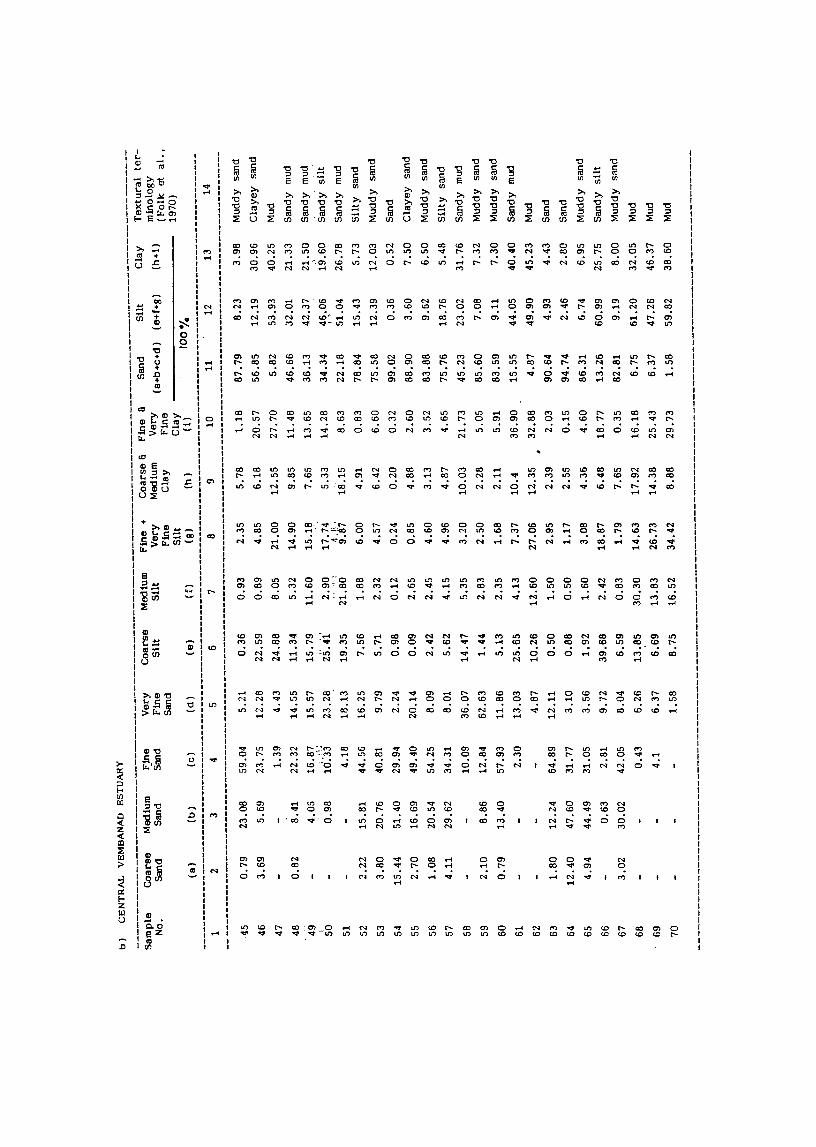
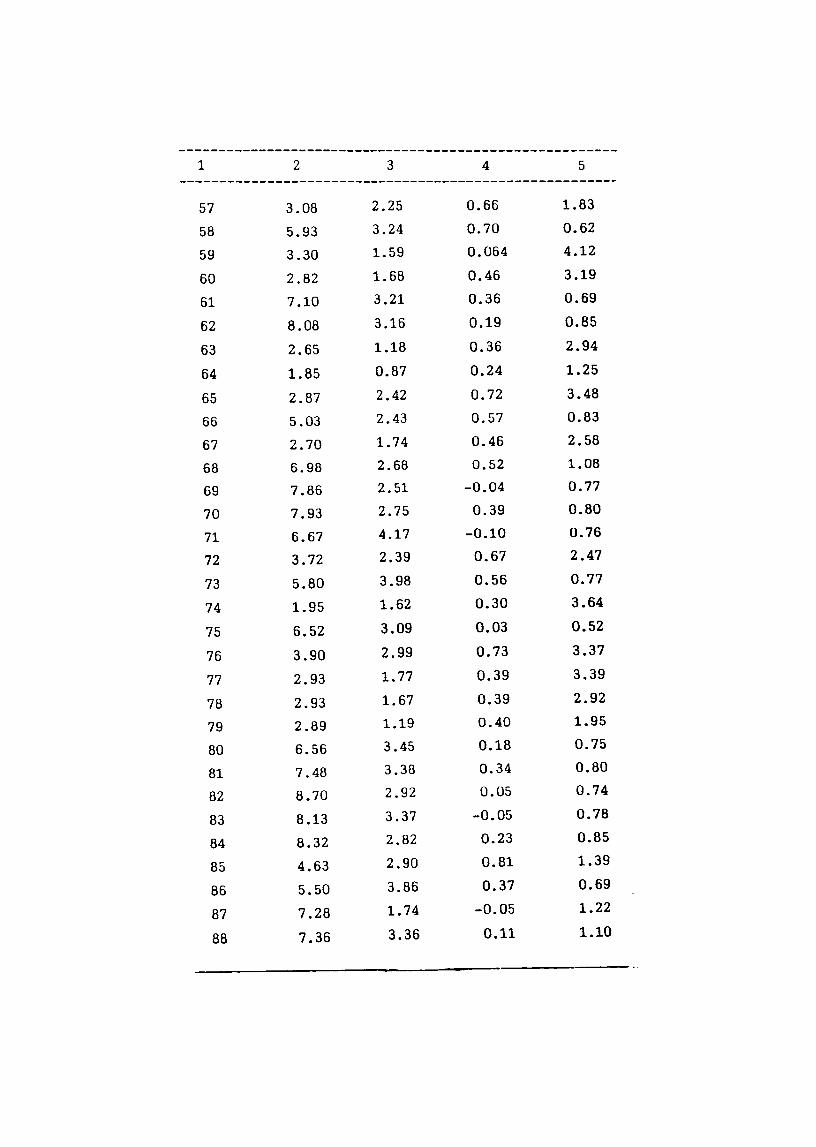
3.2.2 TEXTURAL PARAMETERS
a) Mean size: The mean size of clastic sediments is the statistical
average of grain size population expressed in phi <<j) units. Figs.8a
and 9a show the spatial variation of the phi mean size in riverine and
estuarine environments respectively. In river, the phi mean size ranges
from -0.90 to 2.58 (very coarse sand to very fine sand) and exhibits a
marked increase downstream (Table 4). Grain size spectral studies
reveal that pebbles and granules dominate upstream where as coarse,
medium and fine sands are progressively abundant in the mid lands with
an increase towards the river mouth. Allen ( 1970) stated that the
downstream decrease in phi mean and the progressive enrichment of finer
spectral classes would be ascribed by two processes; a) abrasion and b)
progressive sorting. Laboratory studies of Thiel (1940) and Berthois
and Portier (1957) have revealed that abrasion plays a significant role
in the transformation of textural classes downstream. But this view was
later countered by Kuenen (1959,
so significant in a fluvial set
1960) who opined that abrasion is not
up with sandy sediments. Instead,
progressive sorting will be prominent in causing the textural diversities.
Since the upper reaches of the Muvattupuzha river system show
abundance of pebbles and granules, abrasion plays a significant role in
the reduction of their SIzes. However, in the downstream section,
especially the Muvattupuzha river bed (occupied primarily by sand)
progressi ve sorting seems to be more important in the size segregation
of sediments than abrasion.

TABLE 4--
Sample No.
Grain size parameters of the Muvattupuzha riverine and Central Vembanad estuarine sediments.
Phi Mean
Standard Skewness Deviation
Kurtosis
--1-----------2----------------3-----------4-----------5--------------------------------------------------------------------a) MUVATTUPUZHA RIVER
1
2
3
4
5
6
7
8
9
10
11
12
13
14
15
15A
16
17
18
19
20
21
22
23
24
25
26
27
-0.87
0.15
0.17
-0.80
-0.05)
1.83
0.25
-0.47
0.03
0.78
-0.10
-0.23
-0.52
-0.43
-0.03
0.33
0.62
0.37
-0.17
-0.83
0.82
-0.18
2.58
1.35
0.13
-0.32
-0.81
-0.90
1.80
1.97
1.62
0.98
1.86
0.61
1.72
1.19
1.69
1.22
1. 73
2.04
1.69
1.86
1.83
1.20
1.95
0.82
1.69
1.42
1.58
1.47
1.09
1.61
1.30
1.06
0.94
1.25
0.93
-0.094
-0.004
0.36
-0.15
-0.28
0.67
0.28
-0.24
-0.16
0.01
0.46
-0.23
0.31
0.06
0.36
-0.44
0.42
-0.034
0.23
-0.15
0.06
-0.24
-0.43
-0.045
-0.22
-0.18
0.76
0.73
0.61
0.80
0.32
0.61
1.02
1.54
1.08
0.58
0.99
0.60
0.65
0.72
0.66
0.75
1.31
0.35
2.26
0.84
0.78
0.74
0.93
0.97
1.01
1.50
1.12
1.16
1.31
-----------------------------------------------------

-------------------------------------------------------1 2 3 4 5
------------------------------------------------------
28 0.20 1.31 0.32 0.69
29 1.63 1.15 -0.24 0.89
30 1.37 0.65 -0.052 1.06
31 2.14 0.98 -0.03 1.10
32 1.52 1.08 -0.11 0.89
33 1. 73 0.74 0.096 1.45
34 1. 76 0.77 0.24 0.77
35 0.30 1.53 -0.26 0.74
36 1.82 0.76 -0.16 1.10
37 1.50 0.65 0.065 0.567
38 1.93 0.55 0.21 0.82
39 1.97 0.62 0.165 0.96
40 1.02 0.83 -0.14 1.05
41 1. 70 0.79 -0.12 0.72
42 1.98 0.83 -0.14 0.98
43 2.07 0.68 0.12 1.13
44 1.98 0.72 0.42 0.86 .
b) C.VEMBANAD ESTUARY
45 2.85 1.65 0.30 2.02 46 5.57 3.91 0.54 1.12 47 7.4 2.78 0.29 0.64 48 5.3 3.24 0.43 0.81 49 5.63 3.12 0.44 1.09 50 5.61 2.84 0.57 1.04 51 5.67 1.93 0.30 0.83 52 3.07 1.84 0.83 1.81 53 3.40 2.37 0.58 1.82
54 1. 76 0.77 0.24 0.77
55 2.51 1.53 0.33 2.76
56 2.77 1.67 0.63 3.11
----------------------------------------------
-------------------------------------------------------1 2 3 4 5
-------------------------------------------------------
57 3.08 2.25 0.66 1.83
58 5.93 3.24 0.70 0.62
59 3.30 1.59 0.064 4.12
60 2.82 1.68 0.46 3.19
61 7.10 3.21 0.36 0.69
62 8.08 3.16 0.19 0.85
63 2.65 1.18 0.36 2.94
64 1.85 0.87 0.24 1.25
65 2.87 2.42 0.72 3.48
66 5.03 2.43 0.57 0.83
67 2.70 1. 74 0.46 2.58
68 6.98 2.68 0.52 1.08
69 7.86 2.51 -0.04 0.77
70 7.93 2.75 0.39 0.80
71 6.67 4.17 -0.10 0.76
72 3.72 2.39 0.67 2.47
73 5.80 3.98 0.56 0.77
74 1.95 1.62 0.30 3.64
75 6.52 3.09 0.03 0.52
76 3.90 2.99 0.73 3.37
77 2.93 1.77 0.39 3.39
78 2.93 1.67 0.39 2.92
79 2.89 1.19 0.40 1.95
80 6.56 3.45 0.18 0.75
81 7.48 3.38 0.34 0.80
82 8.70 2.92 0.05 0.74
83 8.13 3.37 -0.05 0.78
84 8.32 2.82 0.23 0.85
85 4.63 2.90 0.81 1.39
86 5.50 3.86 0.37 0.69
87 7.28 1. 74 -0.05 1.22
88 7.36 3.36 0.11 1.10

24
When the competency of the river water declines, the coarser
sediments will be deposited where as the finer will be transported
further downstream. However, from Fig. 8a, it is evident that the
competency of the river water fluctuates at many locations due to natural
and man made obstacles. The abrupt decrease in phi mean (increase in
grain size) at stations 21 and 26, (Table 4, Fig. 8) might be resulted
from the local turbulence induced by Piravom and Vettukattil bridges
respecti vel y. Other similar fluctuations in Fig. 8a are presumably due
to similar effects from natural turbulences.
In the estuary, the phi mean exhibits wide range of values
from 1.76 to 8.70 <p (medium sand to coarse clay). Contrary to the
river, the spatial variation of phi mean (Fig. 9a) shows greater
fluctuations in the estuarine environment. Near the river influenced
regions (8-13 Km) of the estuary, the phi mean decreases considerably.
It is due to the influx of medium and fine sands from the Muvattupuzha
river. From 13 Km to 28 Km, the phi mean shows a marked increase
except at stations 60,64,74 and 85 located at 16, 19,24 and 28 Km
from Thannirmukham bund. The anomalous decrease in phi mean at these
stations is due to dredging activities as said earlier. The increase in
the content of phi mean towards the high saline zones of the estuary is
resulted from the floc formation followed by the faster settling of fine
colloidal aggregates during estuarine mixing as observed elsewhere
(Krank, 1975; Carden and \1ayers, 1979; Seralathan, 1979; Syvitski and
Murray, 1981 and Schubel, 1982).
b) Standard deviation: Standard dev iation or
the particle spread on either side of the average.
sed iment sorting is
The sediment sorting
is good if the spread sizes are relatively narrow. Investigations show
that mean size and sorting correlate well in sand and pebb le grades and
the correlation worsens as the grain size increases. It is also claimed
that silt and clay show improved sorting as grain size increases.

Q< CiO 2 gi= <~ f ~~ t/)L:::J
0
3
Z 2
~ lU ~ 0
::x: CL -2
40 60 70 eo 90 100 110
RIVER DISTANCE Km
Fig. 8 D0wnstream variati0n of statistical parameters
5
4-(f') 3 (f')
o '2 t-o:: :::> 1 ~
OL---~----~--~----~--~~---r--~ o·~
(f') 0·7
~ 0·5
~ 0·3
~ O·j (f') -0.11----4----+----+--------i----+----+-------4
oZ6 0:: 04-~~ Z <:(2 <{> t-W If)OOL---+-----+---f-----I----t-----I--~
z <! w ~ I 0..
jo
8 G
4-2 0
0 4 8 12 16 20 28 [TB] DISTANCE Km [pcJ
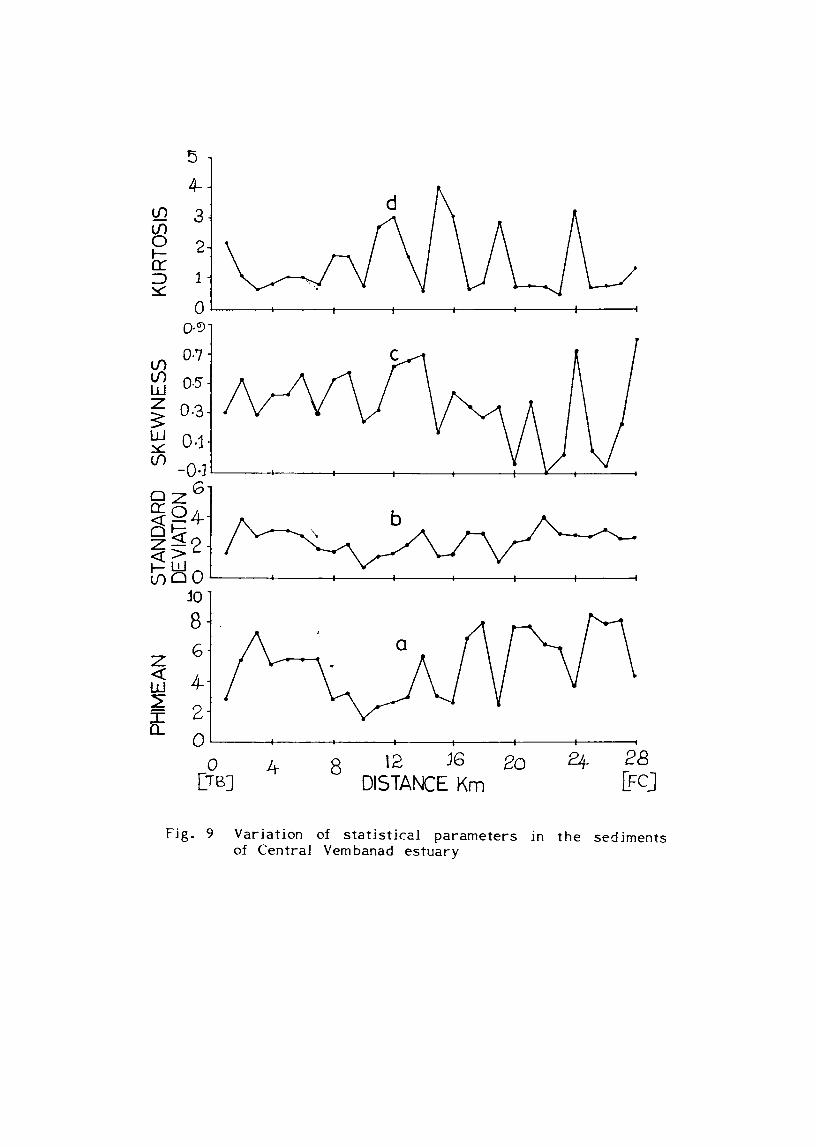
Fig. 9 Variation of statistkal parameters in the sediments of Central Vembanad estuary
25
In the Muvattupuzha river, the standard deviation. varies between
0.55 <p and 2.04 <p where as in estuary the range is between 0.77 <p and
4.17 <p. The spatial variation of standard deviation in riverine and
estuar ine env ironments is presented in Figs. 8b and 9b respecti vel y. In
river environment as the particle size decreases downstream, the sorting
improves. The observed increase in sorting is presumably due to the
differential transport of sediments downstream. Inmann (1949) opined
that once a sediment attains maximum sorting values, any further fall in
the competency of the transporting medium results in the increase of fine
particles in the sediments which will again impart immaturity to the
sediments. A comparative study of the sediment sorting between river
and estuary reveals that the best sorting occurs in medium and fine sand
grades. The existence of such a relationship has also been reported
earlier by Inmann (1949), Griffiths (1951), Pettijohn (1957), Folk and
Ward (1957) and Dyer (1987).
In estuary, more than 95% of the samples are of poorly and
very poorly sorted nature. The abundance of finer particles especially
silt and clay imparts broad particle dispersion which inturn causes very
poor sorting of sediments (Allen, 1970). In the estuary only two
samples (Nos. 54 and 64), which are collected at the mouth of the
Ittupuzha - Murinjapuzha distributaries
particle dispersion.
exhibit moderately sorted
Skewness: Skewness of sediments IS a measure of the
asymmetry of grain size population and reflects the environment of
deposition. In textural analysis skewness is considered as an important
parameter because of its extreme sensi ti vi ty in subpopulation mixing.
Well sorted unimodal sediments are usually symmetrical with zero
skewness. In a fine skewed sediment population, the distribution of
grains will be from coarser to finer and the frequency curve chops at
the coarser end and tails at the finer. The reverse cond ition is
character istic of coarse skewed sed iments. Martins (1965) has suggested

26
that coarse skewness in sediments could be due to two possible reasons.
1 )
2)
Addition of materials to the coarser terminal or
Selective removal of fine particles from a normal population by
winnow ing action.
In the Muvattupuzha river, the skewness varies from -0.44 to
0.93 (very coarse skewness to very fine skewness) and in Central
Vembanad estuary from -0.10 to 0.81 (nearly symmetrical to very fine
skewed) • The respective variations of skewness in riverine and
estuarine environments are depicted in Figs. 8c and 9c. In river, about
60% of the sediment samples are nearly symmetrical to coarse skewed,
36% are fine to very fine skewed and the remaining samples are very
coarse skewed. The river sections particularly the upstream, which
consists of abundance of coarse fraction with less amounts of fine modes,
yield coarse skewness. A similar type of changes has also been noticed
by Folk and Ward (1957), Cadigan (1961) and Martins (1965) in their
respective study areas. In the downstream the fine mode generally
increases and the skewness of sediments shifts to fine entities. The
skewness variation is more complex In the estuarine environment
(Fig. 9c). Here, about 70% of the samples exhibit very fine skewed
particle dispersion ( 1.6 to 0.3), while the remaining samples are nearly
symmetrical and fine skewed. The very fine skewness of estuarine
sediments is attributed to the addition of silt and clay modes to the
sand modes (Cronan, 1972). The presence of nearly symmetrical skewed
samples in the estuary indicates an equal proportion of different modes.
d) Kurtosis: Kurtosis, the peakedness of the frequency curve, is a
measure of the contrast between sorting at the central part of the size
distribution curve and that of the tails. Figs. 8d and 9d show the
spatial variation of Kurtosis along the profile of the river and estuary
respectively. Kurtosis of the river sediment ranges from very

27
leptokurtic to platykurtic (0.32 - 2.26). In the estuary, the sediments
are very leptokurtic to extremely leptokurtic (0.52-4.12). In natural
env ironments, the kurtosis values reflect the fluctuations in the velocity
of the depositing medium. A value greater than unity suggests greater
fluctuations (Verma and Prasad, 1981). From Figs. 8d and 9d, it is
ev ident that the estuarine environment is characterised more by severe
fluctuation in sed iment kurtosis than river environment.
3.2.3 BIVARIET PLOTS
Significant trends were observed by several investigators (Folk
and Ward, 1957; Sahu, 1964; Friedman, 1967; Abed, 1982 and Khan,
1984) when they plotted the grain size parameters among each other.
Figs. 10 and 11 depict the scatter plots of various statistical parameters
of the riverine and estuarine sediments. The phi mean versus standard
dev iation shows an almost linear relation. The sorting worsens as the
phi mean size decreases. This is true in the case of the pebble rich
tributary sediments. The medium and fine sands (1 $ - 3 $) show
moderate to moderately well sorted nature. The plots of mean size
versus skewness is curvelinear in both the environments. In river, the
curve faces upwards where as in the estuary, it is downwards.
Combining these two, yields a perfect sinusoidal curve. In this way,
the sediment distributional behaviour of the study area agrees to the
classic work of Folk and Ward (1957) and Friedman (1961). The scatter
plots betweentmean size and Kurtosis are unevenly distributed in river
env ironment. On the other hand, in estuary, the plots exhibit a perfect
curvelinear pattern characteristic of lacustrine deposits with an
admixture of coarser and finer particles. The observed pattern is
similar to that of the one reported by Hakanson and Jansson (1983) for
the Experimental lake sediments. The interrelationships between
standard deviation and skewness, standard deviation and kurtosis, and
skewness and kurtosis do not yield much information.

3 •
3,
1,
2 · .,'
• I·
"
• •
•
~ <J
.5 •
• '"
2
• •
• gj
••
• • · .
• •
• •
';;
'. .
• z
.... ••
« •
a:
:. "
'0
. •
~ 0
• ••
0 .0.
.'
~
.":
.....
• •
• •
• .'
.'
0° •
w
....
.
....
:'
. .
• •
::E
'" .
• •
• •
• 0
° •••
• •
'.
I •
• •
if _
) 0
.. " 0·
4 00
8 1·2
H
i 2·
02·2
<J
.4 <J
.8 1·
2 1·6
ao
2·2
STAN
DAR
D D
E\I1
ATO
N
STAN
DAR
D D
EVIA
TIO
N
-2
2·2
-1
'0
1 2
3 z
4,
KUR
TOSi
S 22
.0
• •
~ •
" •
• z.
,.
",(
).5
3
w 1
·6
• 0
• •
'" · /
I W
•
0 •
". .
2'
z '"
• ~ 1
·2 "
o·
" .,
. •
• ';
; -.
• •
iIi
• •
. ".
0 •
• w
•
• '.
D
~O
• '"
• '0
• ••
....
1 ~ .'
, '"
0·
5 a:
•
• ..
'", ',
' .
•
..' ~
'" '"
• ,.
'0
o.
.:'
... :~
.. :\ .
041
• 0
-1
, ,
, ,
, -2
-1
0
1 2
3 -2
-1
0
1 2
3 -
1 -
(}S
0
(}5
PH
IME
AN
P
HIM
EA
N
SK
EW
NE
SS
Fg
i.
10
Inte
rrel
atio
nsh
ip
bet
wee
n
vari
ous
sta
tist
ica
l p
aram
eter
s in
th
e se
dim
ents
of
M
uva
ttu
pu
zha
riv
er

l/)
l/) f2 a: ~
5
,. ,
,0
., . .
't ~ •
• :' I
t
I .' ,
01
, I
i i
i r
i 1
0·5
',0 '
,5 2
·0
2·5
3·0
3-5
4{) 4
~5
STA
ND
AR
D D
EV
IATI
ON
4·25
4·
0 "
z 03
-5'
0 0
0
0
~
'0
0 •
0
:> 3
·0
• w
. ' .
' C
l 2.5
0
0 C
l '
0-
0
~ 2
·0
Cl
Z
1'"
1-,0
,
~
l/)
1-0
. , , •
i i
i 1
i 1
I
2 3
4 5
6 7
8 9
PHI M
EAN
l/)
l/) 0
-5
w
0'
z .,
3: 0
·3
'" ,
o ,0
:
w"
0
, .. ~
. , l/)
0.'
, •
I'
-04
I •
0·5
',0 '
,5 2
·0 2
'5 3
{)
3·5
4{) 4
·25
STA
ND
AR
D
DE
VIA
TIO
N
1·3
H
~ 0
.9
w
•
f'7
, •
0 0
0.5
o ,.
• l/)
"
.'
0·3
0"
, , .
, •
'0
• 0
0
0·1
0
-0·1
0
0
1 i
1 r
i i
2 3
4 5
6 7
8 9
PH
IME
AN
9 I
0 · :1 I'
0 ,
0 0
, , , -, ., . -
~ 5J
· •
~ 4~
. .' .
it3
-
I
~.
't •
, .
2 •
1 0
1 2
3 44
·5
6 K
UR
TOS
IS
5
l/)4
{j"
) ~ 3~
,
" •
'.
f
:J
~ 2
, '.
.., .'
• I'
, ·.s
· It·.
J •
• •
If
•
0 -0·1
0-1
0-
3 (}
5 0·
7 0.
9 S
KE
WN
ES
S
Fig
_ 11
In
terr
ela
tio
nsh
ip
bet
wee
n
var
iou
s st
ati
stic
al
par
amet
ers
in
the
sed
imen
ts
of
Cen
tral
-V
em
ba
na
d
est
uary

28
3.2.4 TEXTURAL CLASSIFICATION OF SEDIMENTS
a) River: Table 3 summarises the weight percentages of gravel,
sand and mud in the sediments of the Muvattupuzha river. Since
majority of the river sediments contain a substantial amount of gravel,
the textural classification of FoLk et al. (1970) for gravel bearing sand
is followed to decipher the sediment types of the river basin. From
Fig. 12a, it is evident that the river sediments show a wide range of
sediment texture. Sandy gravel, gravelly sand, slightl y gravell y sand,
sand, and muddy sand are the dominant sediment types of the
Muvattupuzha river bed. Sandy gravel predominates upstream. Gravelly
sand and sand are progressi vel y enriched downstream. The muddy sand
types are found only in the Murinjapuzha tributary (stations 41, 42, 43
and 44).
b) Estuary: Fig. 13 furnishes the spatial distri bution of various
sediment types (Folk et al., 1970) in the Central Vembanad estuary.
Sand, mud d y sand, sand y mud, mud, clayey sand and sand y sil t are the
sediment types observed in the estuary (Fig. 12b). Of the various
sediment types, sandy mud, mud and muddy sand predominate the
estuarine substratum. In the southern region extensive distribution of
muddy sand and sandy mud is observed from Thannirmukham bund to
Perumbalam island. The area opposite to Thannirmukham bund as well
as the Ittupuzha river mouth, two separate zones of clayey sand have
been identified. Two patches of silty sand have also been found in the
study area of which one is midway between Thannirmukham bund and
Ittupuzha and the other is south of Perumbalam island. The central and
northern sectors of this estuary are mainly covered by mud and sandy
mud. The region around Willington island is a composite mixture of
vary ing proportions of muddy sand, mud and sandy mud. The highly
complex distributional pattern of sediments in the estuarine substratum is
the result of the highly variable hydrodynamic set up prevailing in the
estuary as wet! as the seasonal majntenance dredging operations by the
Port author i ties.

GRAVEL (>2rrrn)
(trace) '-:;-.,-___ -;-; ___ -+ ____ ::--___ +_=_~ O-o!·,.' M MUDL--.t-------~~----~L-----~~------~~~
(<O.()63 nm) a) MUVATTUPUZHA RIVER
SAND (2·0-0003 rrrn)
50·'.1----1-----4----......
sC
C M •• e. z CLAYL-_______ ~-~~~-~·~'~~----~~-~SU
«OOO4rrm) {(}0&3-O<lO4 mm)
b) CENTRAL VEM8ANAD ESTUARY
Fig. 12 Ternary diagram illustrating the nature of sediments in the river ine and estuarine env ironments

ABBREVIATIONS USED
IN FIG. 12
G = grovel sG = sandy grovel msG = muddy sandy grovel mG = muddy grovel gS = gravelly sand gmS = gravelly muddy sand gM = gravelly mud
(g)S = slightly gravelly sand (g)mS=slightly gravelly muddy sand (g)M = slightly gravelly mud
5= sand mS = muddy sand sM = sandy mud M=mud
5 = sand zS = silty sand
mS = muddy sand cS = clayey sand sZ = sandy silt sM = sandy mud sC = sandy cloy Z = silt M= mud C = clay

76:15' • 76'-25 -10-0'
20
INDEX [ill --- SAND - ,
~ SILTY SAND
~ MUDDY SAND
~ SANDY SILT I:f.';q .. SANDY MUD
~ MUD
m "" CLAYEY SAND , 55
Fig. 13 Spatia l distributjon of sediments jn the estuarine substratum

29
3.2.5 CM PATTERN
The CM pattern of the Muvattupuzha riverine and Central
Vembanad estuarine sediments are shown in Fig. 14 and the values of C
and M (in microns) are presented in Table 5. The Fig. 14 represents a
complete model of tractive current as shown by Passega ( 1964) and
consists of several segments such as NO, OP, PQ, QR and RS indicating
different modes of sedjment transport. A few samples of the estuary
show marked dev iation from the standard segments.
The rIver sediments fall jn the NO, OP and PQ segments. A
few samples also fall in the upper most part of QR segment. The
segment NO represents the coarsest bed materials which are larger than
5000 microns of C. These particles are transported by rolling and are
enriched in the upstream. The rolling mode of transportation is
intensively taking place in the pebble rich tributary channels in which
the competency of the water is enormously high due to the high gradient
of the terrain (Fig. 3). The segment OP consists of particles having
diameter roughly between 3500 and 5000 microns of C which are moved
by mainly rolling and suspension. The segment PQ represents particles
ranging from 1400 to 4000 microns of C and indicates that these particles
are moved predominantly by suspension and partly by rolling. The
segment QR is parallel to C = M line and is represented by only a few
samples. These sediments are transported primarily by graded
suspension. Since the river samples are predominantly gravelly and
sandy jn nature, the segment RS (uniform suspension) js totally missing
in the river environment.
Contrary to river, the estuarine environment is characterised
by well developed QR and RS segments. Graded suspension dominates jn
the medium and fine sand rich zones, particularly the sediments
collected in the vicinity of Ittupuzha and Murinjapuzha distributaries.
Samples collected from the dredging centres also show this pattern of
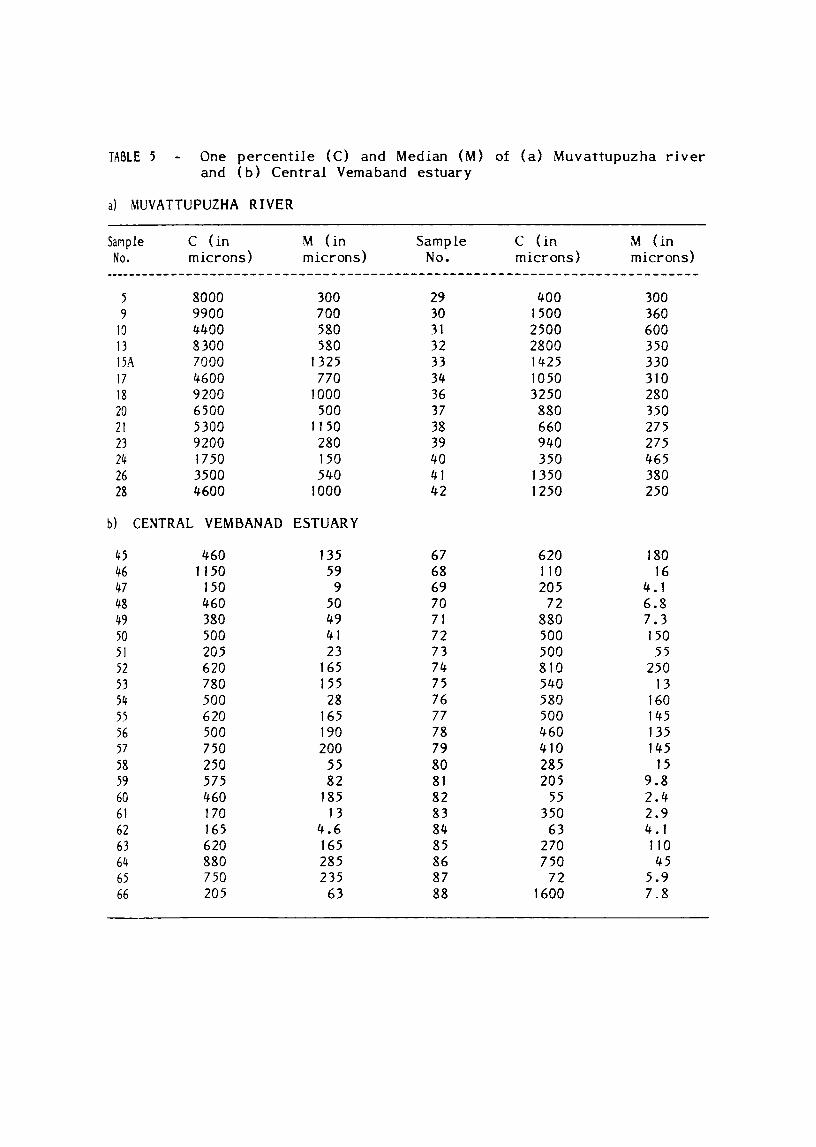
TABLE 5 One percentile (C) and Median (M) of (a) Muvattupuzha river and (b) Central Vemaband estuary
a) MUVATTUPUZHA RIVER
Sample C (in M (in Sample C (in M (in No. microns) microns) No. microns) microns)
---------- ------ - ----- - - - - - - -- - - ---- --- - ------ --- - -- ---- -- - -- - -- - -- - - - - - - - --
5 8000 300 29 400 300 9 9900 700 30 1500 360
10 4400 580 31 2500 600 13 8300 580 32 2800 350 15A 7000 1325 33 1425 330 17 4600 770 34 1050 310 18 9200 1000 36 3250 280 20 6500 500 37 880 350 21 5300 1150 38 660 275 23 9200 280 39 940 275 24 1750 150 40 350 465 26 3500 540 41 1350 380 28 4600 1000 42 1250 250
b) CENTRAL VEMBANAD ESTUARY
45 460 135 67 620 180 46 1150 59 68 110 16 47 150 9 69 205 4. 1 48 460 50 70 72 6.8 49 380 49 71 880 7.3 50 500 41 72 500 150 51 205 23 73 500 55 52 620 165 74 810 250 53 780 155 75 540 13 54 500 28 76 580 160 5) 620 165 77 500 145 56 500 190 78 460 135 57 750 200 79 410 145 58 250 55 80 285 15 59 575 82 81 205 9.8 60 460 185 82 55 2.4 61 170 13 83 350 2.9 62 165 4.6 84 63 4. 1 63 620 165 85 270 110 64 880 285 86 750 45 65 750 235 87 72 5.9 66 205 63 88 1600 7.8

10000 r----y---,---y--,--y-r--.,------",--r-~ -.. ...,....--,
:~ ~--1-~~-4000 p2 0 0 ~
~ v+----~ z 0 ~V o 0 .r c
~ 2000 t----+---+--+~-!I---l-O---l-f---t+--t-1f--+/--~2(XX)
~ 1000r---·-~-~--~-~·~+--~'4~-O~~~:4+-4-4-U w 800 • / e.f I~ '1000
~ ~ 600 ../.... '·0 /Z 800 P u. • Ii, ,:.w.V 1 / 600 - 0 • e.- V '.. 1/ __ .~ ~ 400 r--S-.--+--..+--+'3./-.::.:.....t-~:A--IV~t-;.41--/---Jtl,oo
~ U~ 200 /.'.--.-+----+1-.---r- '8 IL ~. ~
~ 100 • •• V I~ u: 80 I~O
'--J 60 •• • [:::? · tz 60 40r----~---4-/-~40
20'----__ ---IL-_..J/
10 20 M in microns
(MEDIAN (F SIZE OISlRIBU110N)
Fig. 14 CM pattern of the sediments of Muvattupuzha river (0) and Central Vembanad estuary (.)

30
sediment transport. The si! t and clay rich samples fall in the RS
segment which jndicate the role of uniform suspension in transporting
these sediments. The samples scattered above the ideal pattern indicate
the complexity in the transportational regime which also reflects from
the poorl y sorted nature of these deposits.
3.2.6 SURFACE TEXTURES
Surface textures of clastic particles are repositories of
informatjon about the physical and chemical processes to which the
particles have been subjected (Krinsley and Doornkamp, 1973). A grain
of quartz sand taken from the beach bears characteristic textural
signature on its surface which strongly reflects wave action. This
signature is quite distinct from those produced by the action of rivers,
wind or glaciers. Surface textures can be grouped into two categories.
One class deals with the dullness or polish of the fragment and the
other concerns the marking on the surface. Many investigators opined
that a systematic study of the above two classes provides an insight
into the history of transportation and deposition of clastic particles
(Krinsley and Doornkamp, 1973; Baker, 1976 and Marshall, 1987). Waugh
(1965, 1970) used the surface textural studies to unravel the extent of
diagenesis in ancient deposits.
In v iew of the above, an attempt has been made in this
investigation to study the surface textural patterns of quartz grains
(from + 80 mesh) collected from Muvattupuzha river (Sample No. 2) and
Central Vembanad estuary (Samples No. 76). The study reveals a marked
variation in the surface textural patterns of these grains. The riverine
quartz sand (Plate la) shows sharp edges and planar surfaces. High
magnification (2400 X) photograph exhibits IV I shaped impact pits
(Plate 1 b) which are only in the primitive stage. These IV'S indicate
that the grain under examination is subjected to only small amount of
wear and tear. On the other hand the estuarine quartz grain is rounded

Plate la A quartz grain of the Muvattupuzha river (upstream) showing sharp edges and planar surfaces
Plate I b Quartz grain surface (riverine) showing V-pits in initial stages

Plate 2b A well rounded quartz grain of the Central Vembanad estuary showing bulbous edges
Plate 2b Photomicrograph of estuarine quartz showing pitted surface and diagenetically derived surface textures

31
and possesses bulbous edges (Plate 2a) which is characteristic of high
energy subaqueous action (Marshall, 1987). Pitted surfaces are present
on these bulbous projection. These pits are smooth and sharply cut and
appear as if scooped with a small spoon (Plate 2b). Quartz grains with
similar microstructures are recorded abundantly in the sandy beaches of
Kerala (Samsuddin, 1990). In addition to the above surface textures,
the estuarine quartz grains also register a wide spectrum of chemical
dissolution structures. The complexity of these mechanical and chemical
structures is also evidenced from the surface morphometry of heavy
minerals especially zircon (Chapter 4; Plate 5a). Perfect rounding of
the estuarine quartz grain with bulbous projections, pitted surfaces and
other unoriented etch pits results from mechanical and chemical
activities, distinctly indicate subaqueous impact and agitation of water
with prolonged chemical activity and long residence time under which
the grains are subjected to. All these structures depict a polycyclic
nature of estuarine sands
beach environment) under
and a high energy environment (presumably
which the sands are moulded prior to the
deposition in the estuarine bed. From satellite imagery trace of the
Landsat Frames, Mallik and Suchindan (1984) revealed that the southern
and central parts of Vembanad estuary are marked by a number of beach
ridges nearly parallel to the coast and form boundary of the lake margin
in some places (Fig. 15). These beach ridges are resulted from the
repeated trangression and regression of shore during P leistocene time and
their orientations have been controlled by the changes in deviation of
the waves. During southwest monsoon, considerable amounts of sediments
are reworked from these beach ridges and deposited into the estuarine
basin. The surface morphometry of estuarine sillimanite, zircon as well
as the heavy mineralogical studies discussed in the subsequent sections
(Chapter 4) also confirm the above view.
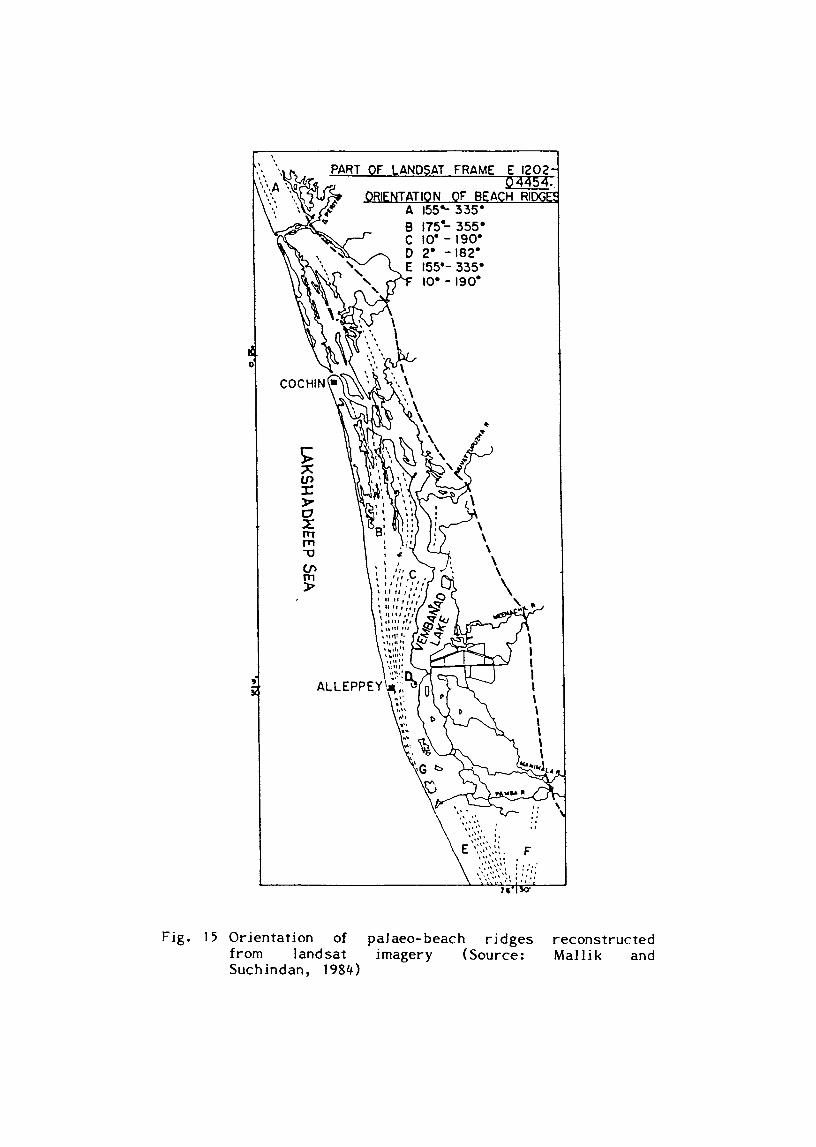
Fig. 15 Orientation of from landsat Suchindan, 1984)
paJaeo-beach ridges imagery (Source:
reconstructed Mallik and