measuring economic policy...
TRANSCRIPT
Measuring Economic Policy Uncertainty
Scott R. Bakera, Nicholas Bloomb, and Steven J. Davisc
19 May 2013
Abstract: Many commentators argue that uncertainty about fiscal, monetary and regulatory policy slowed recovery from the 2007-2009 recession. To assess this view, we develop a new index of economic policy uncertainty (EPU) that draws on the frequency of newspaper references to policy uncertainty and other indicators. Our index spikes near tight presidential elections, after the Gulf wars, 9/11 attack and Lehman Bros. bankruptcy, and during the 2011 debt ceiling debate. Several pieces of evidence and analysis – including a human audit of 4,300 newspaper articles – indicate that our EPU index offers a good proxy for movements in policy-related economic uncertainty over time. Using micro data, we investigate the effects of EPU on investment and hiring, finding negative effects for firms heavily exposed to government contracts. At the macro level, positive innovations in our EPU index foreshadow declines in investment, output and employment in VAR models. Extending our measurement efforts back to 1900, we find that EPU rose dramatically in the Great Depression, but only from 1932 onwards when Hoover and then Roosevelt initiated a period of intense policy activism. We also find a secular rise in policy uncertainty since the 1960s, coincident with government fiscal and regulatory expansion. JEL No. D80, E22, E66, G18, L50
Keywords: economic uncertainty, policy uncertainty, business cycles
Acknowledgements: We thank Matt Gentzkow, Kevin Hassett, Greg Ip, John Makin, Johannes Pfeifer, Itay Saporta, Sam Schulhofer-Wohl, Jesse Shapiro, Erik Sims, Stephen Terry and many seminar and conference audiences for comments. We thank Sophie Biffar, Eddie Dinh, Kyle Kost, Megan Lu and Rebecca Sachs, for extensive research support, and the National Science Foundation, the Sloan Foundation and the Initiative on Global Markets and the Stigler Center at Chicago for financial support. a Stanford; [email protected] b Stanford, Centre for Economic Performance, CEPR and NBER; [email protected] c University of Chicago Booth School of Business and NBER; [email protected]

1
1. INTRODUCTION
Many commentators make two claims about economic policy uncertainty.1 First,
that it rose to historically high levels after the 2007-2009 recession because of uncertainty
about tax, spending, regulatory, and monetary policies. Second, that the rise in policy
uncertainty slowed recovery from the recession by causing businesses and households to
cutback or postpone investment, hiring and consumption.
We seek to investigate both claims. To do so, we first construct a new measure of
economic policy uncertainty (EPU) and examine its evolution since 1985.2 Figure 1 plots
our index, which captures three aspects of economic policy uncertainty: (i) the frequency
of references to policy-related economic uncertainty in 10 leading U.S. newspapers; (ii) the
number and revenue impact of federal tax code provisions set to expire in future years; and
(iii) the extent of disagreement among economic forecasters over future government
purchases and future inflation. The EPU index spikes near tight presidential elections, Gulf
Wars I and II, the 9/11 attack, and other major shocks. Recently, the index rose to historic
highs after the Lehman bankruptcy and TARP legislation, the 2010 midterm elections, the
Eurozone crisis, and the U.S. debt-ceiling dispute.
We evaluate our EPU index in several ways. First, as a proof-of-concept check, we
construct a separate news-based index of equity market uncertainty and compare it to the
market-based VIX, finding a high correlation. Second, we led a team of research assistants
in reviewing 4,300 newspaper articles. Our automated news-based EPU index corresponds
closely to an index based on the human readings. Third, we investigate the role of political
slant and find that slant, while present, plays little role in our news-based index
movements. Fourth, we compare our EPU index to “uncertainty” counts and discussions in
the Beige Book, a 15,000-word summary of the state of the economy produced before
every Federal Open Market Committee (FOMC) meeting, again finding a good 1 See, for example, the IMF’s World Economic Outlooks (April and September 2012). 2 Our data are available on www.policyuncertainty.com 3 Stock and Watson (2011) use our EPU index to investigate the factors behind the 2007-2009 recession and slow recovery and come to a similar conclusion – namely, that policy uncertainty is a strong candidate for explaining the poor economic performance, but identifying causality is hard. 4 The Federal Register records all new Federal government regulations introduced each year. 5 Dixit and Pindyck (1994) offer a good and detailed review of the early theoretical literature. Recent empirical papers include Bloom (2009), Alexopolous and Cohen (2011), Bloom, Floetotto, Jaimovich, Saporta and Terry (2012) and Bachman et al. (2013). 2 Our data are available on www.policyuncertainty.com

2
correspondence. Finally, a separate analysis finds an unusually large number of large U.S.
equity market jumps triggered by policy-related developments in the 2008-2011 period, as
compared to earlier decades.
Drilling into specific policy areas using a large database of around 2,000 national
and local U.S. newspapers, we find that the most frequent references to policy uncertainty
concern taxes, spending, monetary, and regulatory policy. Interestingly, while these four
policy areas are the most frequent in levels, the increase in policy uncertainty since 2008
mainly reflects greater uncertainty about tax, spending and regulatory (particularly
healthcare) policy. We find no evidence in news-based sources of greater monetary policy
uncertainty since 2008, suggesting that mainstream media did not perceive monetary
policy as more uncertain over this period. Our human reading of uncertainty discussions in
the FOMC Beige Books yields broadly similar conclusions.
Together, these pieces of evidence support the first claim – that policy uncertainty
rose to unusually high levels from the 2007-2009 recession onwards – and they point to
tax, spending, and regulatory policy as the main contributors.
We then turn to assessing the effects of EPU on the economy through two separate
methods. First, we exploit industry differences in exposure to one aspect of policy to
estimate the impact of policy uncertainty on firm-level investment and employment.
Specifically, some industries – defense and construction, for example – are more
dependent on government contracts than others. Firms in those industries should react
more strongly to EPU, if it matters at all. Using a database of all Federal Government
contracting to build policy exposure measures and Compustat data to measure firm-level
investment and employment, we find large and significant negative effects of rising policy
uncertainty, as measured by our EPU index. These results are robust to including a full set
of firm and time fixed effects, plus controls for current and expected future government
purchases interacted with the firm-level exposure measures.
The microdata results point to a negative causal impact of policy uncertainty on
investment and hiring, but they provide little guidance about the magnitude of aggregate
effects because they capture only one policy channel (government contracting). As a
rough guide to the potential overall size of EPU effects, we estimate simple vector
autoregressive (VAR) models. The VAR results indicate that an innovation in policy

3
uncertainty equivalent to the actual EPU increase from 2006 to 2011 is associated with a
decline of about 2.5% in industrial production and 2.3 million in employment. These
results are not necessarily causal, as policy is forward looking, but they suggest that the
magnitude of deleterious policy uncertainty effects is potentially large.3
Finally, we also extend our news-based index of policy uncertainty to 1900, using a
panel of 6 U.S. newspapers that reach back to the start of the last century. We find two
notable results. First, policy uncertainty also displayed a striking increase in the Great
Depression but, unlike the pattern in the 2007-2009 recession, EPU only increased from
1932 when Hoover and then Roosevelt adopted a much more activist approach to policy.
Second, we find a secular rise in policy uncertainty starting in the 1960s, continuing
through the 1980s, and resuming again in the 2000s. While there are many potential
reasons for this secular increase, one obvious candidate is growth in the size and scope of
government. EPU rose in line with the secular growth of government expenditures from
about 30% of GDP in 1960 to about 45% in the recent recession. The Federal Register
page count, a rough indicator of regulatory reach, rose from 14,000 in 1960 to an average
of 54,000 per year in the mid 1970s and an average 78,000 pages per year since 2000.4
This paper relates to at least two literatures. The first is research on the impact of
general economic uncertainty on investment. Theoretical work on this topic dates at least
to Bernanke (1983), who points out that high uncertainty gives firms an incentive to delay
investment and hiring when investment projects are expensive to cancel or workers are
costly to hire and fire.5 Of course, once uncertainty falls back down, firms start hiring and
investing again to address pent-up demand. Other reasons for a depressing effect of
uncertainty include precautionary spending cutbacks by households, upward pressure on
the cost of finance (e.g., Gilchrist et al., 2010, and Pastor and Veronesi, 2011a), and
increased managerial risk-aversion (Panousi and Papanikolaou, 2011).
Second, there is a literature focused on policy uncertainty. Friedman (1968), Rodrik
(1991), Higgs (1997) and Hassett and Metcalf (1999), among others, consider the 3 Stock and Watson (2011) use our EPU index to investigate the factors behind the 2007-2009 recession and slow recovery and come to a similar conclusion – namely, that policy uncertainty is a strong candidate for explaining the poor economic performance, but identifying causality is hard. 4 The Federal Register records all new Federal government regulations introduced each year. 5 Dixit and Pindyck (1994) offer a good and detailed review of the early theoretical literature. Recent empirical papers include Bloom (2009), Alexopolous and Cohen (2011), Bloom, Floetotto, Jaimovich, Saporta and Terry (2012) and Bachman et al. (2013).
4
detrimental economic effects of monetary, fiscal, and regulatory policy uncertainty. More
recently, Bonn and Pfeifer (2011) and Fernandez-Villaverde at al. (2011) study policy
uncertainty in DSGE models, finding moderately negative effects, while Pastor and
Veronesi (2011a, 2011b) model the theoretical links among the business cycle, policy
uncertainty, and stock market volatility. In recent empirical research, Julio and Yook
(2010) find that corporate investment falls around national elections, Durnev (2010) finds
that corporate investment is 40 percent less sensitive to stock prices in election years,
Brogaard and Detzel (2012) show that policy uncertainty reduces asset returns, Handley
and Limao (2012) find that trade-policy uncertainty delays firm entry, and Gulen and Ion
(2012) find negative responses of corporate investment to our EPU index.
The paper proceeds as follows. Section 2 describes the data we use to construct our
policy uncertainty indices. Section 3 evaluates our EPU measures in several ways and and
develops additional evidence about movements in policy-related uncertainty over time.
Section 4 identifies specific policy areas that underlie policy uncertainty levels and
movements over time. Section 5 estimates firm-level effects of policy uncertainty and the
dynamic responses of aggregate economic outcomes to policy uncertainty shocks. Section
6 presents a news-based measure of policy uncertainty extending back to 1900. Section 7
concludes and discusses some directions for future research.
2. MEASURING ECONOMIC POLICY UNCERTAINTY To measure policy-related economic uncertainty, we build an index from three
underlying components. One component quantifies newspaper coverage of policy-related
economic uncertainty. A second component reflects the number and projected revenue
effects of federal tax code provisions set to expire in future years. The third component
uses disagreement among economic forecasters about policy relevant variables as a proxy
for economic policy uncertainty.
2.1 Newspaper coverage of Policy-Related Economic Uncertainty
For our first index component, we treat coverage of policy-related economic
uncertainty in leading newspapers as an indicator for the intensity of concerns about
economic policy uncertainty. We seek to capture uncertainty about who will make
economic policy decisions, what economic policy actions will be undertaken and when, the
5
economic effects of past, present and future policy actions, and uncertainty induced by
policy inaction. We also want our news-based EPU index to capture economic uncertainty
related to national security concerns and other policy matters that are not mainly economic
in character.
Our news-based EPU index reflects automated text-search results for 10 large
newspapers: USA Today, Miami Herald, Chicago Tribune, Washington Post, Los Angeles
Times, Boston Globe, San Francisco Chronicle, Dallas Morning News, New York Times,
and the Wall Street Journal. To construct the news-based index, we search the archives of
each paper from January 1985 onwards for articles that contain terms related to economic
policy uncertainty. In particular, we identify articles containing ‘uncertainty’ or
‘uncertain’, ‘economic’ or ‘economy’, and one or more of the following terms: ‘congress’,
‘deficit’, ‘federal reserve’, ‘legislation’, ‘regulation’ or ‘white house’ (including related
terms like ‘regulatory’ or ‘the fed’). In other words, to meet our criteria the article must
include terms in all three categories pertaining to uncertainty, the economy, and policy.
The goal is to select articles in major U.S. newspapers that discuss something about
uncertainty over economic policy. Based on our search criteria, we obtain a monthly
article count for each newspaper.
A difficulty with this raw EPU count is that the overall volume of articles produced
by and archived for each newspaper varies over time. Thus we scale the raw counts by the
total number of articles in the same newspaper and month. This process yields a monthly
EPU series for each newspaper, each of which we normalize to unit standard deviation
over the 1985-2010 period. Using these normalized values, we sum across the ten
newspapers in each month. Finally, we rescale this 10-paper series to an average value of
100 from 1985 to 2009.
Figure 2 plots the resulting news-based EPU index. There are clear spikes
corresponding to Black Monday, the first and second Gulf Wars, the 1992 presidential
election, 9/11, the 2009 stimulus debate, the Lehman Brothers bankruptcy and TARP
bailout, intensification of the European debt crisis, the 2010 midterm elections, and the
recent debt-ceiling dispute, among other events.6
6 Some notable political events do not generate high levels of economic policy uncertainty according to our news-based index. For instance, we find no large spike around the time of the federal government shutdowns
6
2.2 Scheduled Tax Code Expirations
The second component of our index draws on Congressional Budget Office (CBO)
sources that list federal tax code provisions set to expire in coming years and their
projected revenue effects. Scheduled tax code expirations are a source of uncertainty
because Congress often waits till the last hour before deciding whether to extend them,
undermining stability in and certainty about the future path of taxes. One recent example
involves the Bush-era income tax cuts originally set to expire at the end of 2010.
Democrats and Republicans staked out opposing positions about whether to reverse these
tax cuts and, if so, for which taxpayers. Rather than resolving the uncertainty in advance,
Congress waited until December 2010 before acting, much as they did more recently in the
2012 Fiscal Cliff dispute. Similarly, the 2010 Payroll Tax Cut was initially set to expire
after one year but was twice extended just weeks before its scheduled expiration.
Temporary tax code provisions also lead to murkier outlooks for federal spending
and borrowing and to discrepancies between CBO tax revenue projections and those of the
Office of Management and Budget (OMB). The CBO uses ‘current law’ as a baseline,
taking into account all scheduled tax expirations, while the OMB uses ‘current policy’ as a
baseline under its assessment of which temporary provisions are likely to be extended.
Over the past several years, the gap between these two federal spending projections has
grown along with a greater use of temporary tax provisions.
The CBO reports include data on scheduled expirations of federal tax code
provisions in the contemporaneous calendar year and each of the next 10 years. The CBO
documents briefly describe the tax code provision, its projected revenue effect, and its
scheduled expiration year and month, typically but not always in December. We use the
CBO data as follows. First, we compute the absolute dollar value of the expiring tax
provisions in each year over the 10-year horizon. We then discount future expirations at
50% per year, and sum the discounted dollar-weighted tax code expirations to obtain an
index value for each January, which we hold constant during the calendar year. We apply a
from November 1995 to January 1996. While we found more than 8,000 articles mentioning these government shutdowns, less than 25% also mention the economy, less than 2% mention uncertainty, and only 1% mentions both. We take this finding to mean that politically tumultuous episodes do not necessarily raise economic policy uncertainty.

7
high annual discount rate because tax code provisions set to expire in the distant out years
are unlikely to be a major source of current concern.
Figure 3 plots the discounted dollar-weighted sum of expiring federal tax
provisions. The figure shows comparatively tiny values before 2003, a bump in 2003-2004
that reflects the expiration of accelerated capital depreciation allowances, greatly elevated
levels from 2009 to 2012, and a very sharp drop off in 2013 that reflects the resolution of
the so-called Fiscal Cliff. The overall pattern shows a dramatic increase in temporary tax
measures subject to continual renewal, debate and uncertainty. This heavy reliance on
scheduled tax code expirations with large dollar impact is a recent phenomenon in the U.S.
policymaking process. The undiscounted projected 10-year revenue impact of expiring
federal tax code provisions never exceeded 250 billion dollars before 2002 but ranges from
3 to 5 trillion dollars in the years from 2009 to 2012.
2.3 Forecaster Disagreement About Inflation and Government Purchases
The third component of our EPU index draws on the Federal Reserve Bank of
Philadelphia’s Survey of Professional Forecasters (SPF). Each quarter, SPF participants
receive a request to provide forecast values for a range of variables at various horizons.7
We exploit individual-level forecast data for inflation, purchases of goods and services by
the federal government, and purchases of goods and services by state and local
governments. We use these variables because they are heavily influenced by monetary and
fiscal policy decisions, and because they are available back to 1985.
We treat the cross-sectional dispersion of individual forecasts in the SPF data as
proxies for uncertainty about future outcomes, an approach that builds on a long literature.8
For inflation, we use individual forecasts of the quarter-on-quarter annualized CPI inflation
rate four quarters hence. To measure dispersion, we compute the interquartile range of
7 A sample form for 2010 Q1 is available at http://www.philadelphiafed.org/research-and-data/real-time-center/survey-of-professional-forecasters/form-examples/SpfForm-10Q1.pdf. SPF participants receive questionnaires at the end of the first month in a quarter and have about 10 days to return it, so SPF data pertain to forecasts made in the second month of the quarter. We assign the forecast dispersion measures described below to the second and third month of the same quarter and the first month of the next quarter. 8 See, for example, Zarnowitz and Lambros (1987), Bomberger (1996), Giordani and Soderlind (2004) and Boero, Smith and Wallis (2008). These papers find a significant correlation between forecaster disagreement about inflation and other measures of inflation uncertainty. Researchers differ about the strength and interpretation of this relationship. Rich and Tracy (2010), for example, find a very weak link. Bachman et al. (2013) reach more positive conclusions about the usefulness of forecaster disagreement as a proxy for uncertainty.
8
inflation rate forecasts. Figure 4 reveals relatively high inflation forecast disagreement in
the earlier and later parts of our sample, including notable spikes during the recent banking
crisis and near major Federal Reserve policy decisions. Inflation forecast disagreement
falls to pre-crisis levels by the last two quarters of 2012.
For federal government purchases, we divide the interquartile range of four-
quarter-ahead forecasts by the median four-quarter-ahead forecast and multiply by a 5-year
backward-looking moving average for the ratio of nominal federal purchases to nominal
GDP.9 We follow the same approach for four-quarter-ahead forecasts of state and local
government purchases. We then sum these two measures to obtain an overall measure of
forecaster disagreement about future government purchases, expressed as a percentage of
GDP. Figure 5 shows the resulting forecast dispersion measure for government purchases.
Noteworthy jumps occur around the passage of major budget legislation in 1985 and 1987,
the 1992 presidential election, 9/11 and Gulf War II, the stimulus spending debates in 2008
and 2009, and the debt ceiling dispute of 2011.
2.4 Our Overall U.S. Economic Policy Uncertainty Index
To construct our overall EPU index, we first normalize each component by its own
standard deviation prior to January 2012 and then average over the components month by
month, using weights of 1/2 on our broad news-based policy uncertainty index and 1/6 on
each of the other components (tax expirations, inflation forecast disagreement, and
government purchases forecast disagreement). These weights roughly reflect the
distribution of specific sources of policy-related uncertainty in Table 2 below. We set the
pre-1991 values of the tax expirations index to its 1991 value, as temporary tax provisions
were rare or nonexistent in the 1980s. Finally, we normalize our overall index to 100 from
1985 to 2009, the first 25 years of the period covered by our data.
In addition to our preferred weighting, we also consider EPU indices with two
other weightings. First, we equally weight the news-based measure, the combination of the
forecast disagreement measures, and the tax expiration measure. The resulting series,
shown in Figure A1, is very similar to our preferred measure. Second, we perform a
principle component factor analysis on our four series, obtaining weights of 0.22 on our
9 The backward-looking measure of government purchases relative to GDP facilitates real-time updating of our EPU index in the absence of real-time data about current government purchases and GDP.

9
news-based index, 0.27 on the tax expirations index, 0.29 on the inflation disagreement
measure, and 0.21 on the government purchases disagreement measure. We again find a
similar final index, also plotted in Figure A1. Our preferred index has correlations of 0.962
and 0.945 with the equally weighted and principle components weighted indices,
respectively. All three versions yield very similar results in the microdata and VAR
analyses in Section 4 below.
Figure 1 displays our preferred version of the overall EPU Index. We find EPU
jumps corresponding to several prominent events, and much elevated levels of policy
uncertainty since the 2007-09 recession. In particular, we find spikes associated with tight
presidential elections, wars, 9/11, contentious budget battles, and major policy decisions
and battles during and after the recent recession. The average index value is 71 in 2006 (the
last full year before the financial crisis) and 173 in 2011, a difference of 102 index points.
We use this increase in the index value when quantifying the responses of output,
investment and employment to policy uncertainty shocks. We update our Economic Policy
Uncertainty Index on a monthly basis at www.policyuncertainty.com.
2.5 Measuring Economic Policy Uncertainty in Europe
We also construct EPU indices for several other countries. Because a major role for
expiring tax code provisions is an idiosyncratic feature of U.S. policy, our indices for other
countries place a 50% weight on news-based index components and a 50% weight on
forecaster disagreement components. The news-based components draw on two
newspapers for each of the five largest European economies: Handelsblatt and Frankfurter
Allgemeine Zeitung for Germany, El Pais and El Mundo for Spain, Corriere della Sera and
La Repubblica for Italy, Le Monde and Le Figaro for France, and Financial Times and The
Times of London for the United Kingdom.
As with our American newspaper index, we count the number of articles containing
the terms uncertain or uncertainty, economic or economy, as well as the following policy
relevant terms: ‘policy’, ‘tax’, ‘spending’, ‘regulation’, ‘central bank’, ‘budget’, and
‘deficit’.10 We perform all news searches in the native language of the paper in question,
10 These terms reflect the terms used in our initial U.S. index, before undertaking a detailed audit. When we revised our policy term set for the U.S. news-based index, we decided to hold off on revisions to our European index until we perform a similarly detailed audit of our European news-based index components.
10
and we scale by the smoothed number of articles containing the word ‘today’.11 We
rescale the resulting series for each newspaper to unit standard deviation prior to 2011 and
then sum across papers by month. We normalize the resulting 10-paper sum to a mean
value of 100 prior to 2011.
For forecaster disagreement measures, we rely on individual forecasts of CPI
inflation and federal government budget balance variables collected by Consensus
Economics (CE).12 We compute the raw IQR of CPI forecasts by country and month for
our inflation disagreement measures and the IQR of budget balance forecasts scaled by
own-country GDP for our fiscal disagreement measure. Because all CE forecasts during a
given calendar year pertain to the following calendar year, they tend to become more
accurate over the course of the year. To adjust for this aspect of the data, we deseasonalize
the IQR of the forecast values.
After combining the index components at the country level, we scale each country-
level series to a unit standard deviation and sum across countries to obtain a single
European EPU index, shown in Figure 6. The European EPU index exhibits many of the
same spikes as the U.S. EPU index, but several European developments stand out –
including surprisingly close German elections in September 2005, emergency liquidity
support for Northern Rock in September 2007, the first Greek bailout in May 2010, and
then Prime Minister Papandreou’s aborted call on 31 October 2011 for a national
referendum on a second Greek bailout deal. We provide regular monthly EPU updates for
Europe (France, Germany, Italy, Spain and the U.K.) and for Canada, China and India at
www.policyuncertainty.com.
3. EVALUATING OUR POLICY UNCERTAINTY MEASURES This section considers several pieces of evidence and analysis that help assess
whether our EPU indices provide useful measures of policy-related uncertainty. Along the
way, we find additional support for the claim that U.S. economic policy uncertainty rose to
historically high levels in recent years.
11 Technical barriers make it difficult to scale by counts of all articles published in the European papers. 12 From Consensus Economics at http://www.consensuseconomics.com/. The SPF covers the U.S. only.

11
3.1 Can our News-Based Approach Quantify Uncertainty?
Our news-based measure of policy uncertainty raises a basic question: Can
frequency counts of newspaper articles serve to quantify economic uncertainty in a useful
manner? To shed light on this question, we create a separate news-based index of equity
market uncertainty and compare it to the market-based VIX, a widely used measure of
uncertainty in equity returns that is firmly grounded in option pricing theory.
To construct a news-based measure of equity market uncertainty, we parallel the
approach in Section 2.1 above. Specifically, we use the same newspapers, scaling methods
and search criteria – except for dropping the policy-related term set and, instead, requiring
an article to contain ‘stock price’, ‘equity price’ or ‘stock market’. Figure 7 plots the
resulting news-based index of equity market uncertainty against the monthly average of
daily VIX values from 1990 to 2012. The two series are highly correlated. While the news-
based index is clearly noisier, it picks up every major move in the VIX during the sample
period.13
3.2 Auditing the News-Based Approach with Human Readings
Figure 7 indicates that our news-based approach can produce a reasonable
quantitative indicator of economic uncertainty. However, it says nothing about the
accuracy of EPU counts produced by our particular choice of policy-relevant search terms.
To address that issue, we undertake a large-scale human audit of newspaper articles with
the help of several research assistants.14 We use the human audit to choose policy-relevant
search terms, evaluate the error properties of our preferred computer-automated index, and
extract additional information from newspaper articles.
We began the audit process with an extensive pre-audit phase, during which we
read 200 articles and oversaw the reading of another 1,800 articles by several research
assistants. The pre-audit phase enabled us to refine the audit template described in the
appendix, improve our sampling procedures, and, most important, develop an extensive
13 The VIX reflects implied volatility over a 30-day look-ahead period. In contrast, our news-based policy uncertainty index involves no explicit horizon. This conceptual difference is one source of discrepancies between the two measures. We return to this matter in Section 4 below. 14 Our audit work continues as of this writing. The audit results reported in this draft are preliminary and subject to revision as we expand our audit sample and improve our audit methods.

12
audit guide for our assistants. The guide provides numerous FAQs, examples, and
instructions to help the auditors code the articles they read.15
To perform the actual audit, we randomly select three articles per month per
newspaper from the universe of articles in the Los Angeles Times, New York Times,
Dallas Morning News, San Francisco Chronicle, and Miami Herald that contain the words
“uncertain” or “uncertainty” and “economic” or “economy”. We work with these five
newspapers, because they provide online access to the full article text, rather than abstracts
or search counts only. This sampling scheme yields 15 articles per month from January
1985 to June 2012.16 We then led a team of five undergraduate research assistants in
reading and coding our audit sample, with about 4,300 completed audits at this writing.
We hired a new team of assistants for this phase of the audit process. To ensure auditor
learning does not distort our results, we randomized the order in which each auditor
reviews his or her assigned articles. We also introduced some overlap in article
assignments to help us evaluate auditor quality and consistency.
Given the audits, our first piece of analysis selects a preferred term set for the
automated searches. For this purpose, we consider all combinations of four or more policy-
relevant terms drawn from the following list: regulation, budget, spending, policy, deficit,
tax, ‘federal reserve’, ‘white house’, ‘house of representatives’, government, congress,
senate, president, and legislation. We consider these terms because, according to our
human readings, they appear frequently in articles coded EPU=1 and not too often in those
coded EPU=0. In addition to the roughly 16,000 permutations afforded by these 14 policy-
relevant terms, we considered 14,000 other term sets that replace terms such as ‘policy’,
‘government’, ‘spending’ and ‘deficit’ with more restrictive multi-word terms:
‘government regulation,’ ‘government deficit’, ‘government spending’, ‘government
budget’, ‘government policy’, ‘monetary policy’, ‘fiscal policy’, ‘regulatory policy’,
‘federal deficit’ and ‘federal spending’.
Interpreting the human coding as truth, we calculate error rates for each term set.
Articles coded EPU=0 by the human and EPU=1 by the computer are false positives, and 15 The audit guide, available at www.policyuncertainty.com/Audit_Guide.pptx, is complementary to the discussion of our audit design template and audit methodology in the appendix. 16 Our current audit sample contains only 12 articles per month from 1992-94 and 9 per month from 1985-91, because our online access to full articles starts in 1995 for the San Francisco Chronicle and 1992 for the Dallas Morning News. We are seeking to extend our audit sample for these two newspapers back to 1985.
13
those coded EPU=1 by the human and EPU=0 by the computer are false negatives.
Dividing by the number of human-coded EPU=1 articles converts these error measures to
rates. We calculate error rates for the 30,000 permutations of policy-relevant terms and
select the one that minimizes the sum of false positive and false negative error rates. Figure
2 above uses the term set that emerges from this process.
We now evaluate the time-series properties of our news-based EPU index. First, we
compare an automated implementation of our preferred term set to the evolution of EPU
according to the human readers. Figure 8 displays this comparison for the articles in the
audit sample. It shows that the news-based EPU index generated by computer
implementation of our preferred term set closely tracks the news-based EPU index derived
from human readings. Second, for econometric purposes we also care about the time-
series properties of net error rates in the automated news-based EPU index. Calculating
this net error rate from the series in Figure 8, we find that it is virtually uncorrelated with
quarterly real GDP growth rates (correlation of -0.02) and uncorrelated with the true EPU
rate in the audit sample (correlation of 0.004). Third, our human audit finds that only 1.8%
of articles about EPU discuss low or declining policy uncertainty. That is, newspapers
publish articles about EPU mainly when it is high or rising. In summary, our computer-
generated EPU index closely tracks EPU movements derived from human readings, and
the tracking errors are uncorrelated with the business cycle and with true EPU.
Our human audit also uncovers other results. First, 21% of EPU=1 articles in our audit
sample discuss uncertainty about who will make future economic policy decisions, 69%
discuss uncertainty about what economic policies will be undertaken and when, and 40%
discuss uncertainty about the economic effects of past, present or future policy actions.
Second, the percentage discussing who will make future economic policy decisions nearly
doubles in presidential election years, indicating that the nature of policy uncertainty shifts
substantially over the election cycle. Third, the vast majority of EPU discussions in
American newspapers pertain mostly or entirely to U.S. developments and policy matters.
Only 29% of the EPU=1 articles are mainly about policy matters in other countries.
3.3 Political Slant in Newspaper Coverage of EPU
Another possible concern is the potential for political slant to skew newspaper
coverage of EPU. If right-leaning (left-leaning) newspapers seriously overplay EPU when
14
Democrats (Republicans) are in power, political slant could distort measured changes in
our news-based EPU index over time. To investigate this issue, we split our 10
newspapers into the 5 most ‘Republican’ and 5 most ‘Democratic’ papers using the
Gentzkow and Shapiro (2010) media slant index. They assign slant values based on the
frequency with which newspapers use words used relatively heavily by one party in
Congress. For example, a newspaper that frequently uses “death tax”, “personal accounts”
and “war on terror” (terms often used by Republicans) falls on the right side of their slant
index, and a newspaper that frequently uses “estate tax”, “private accounts” and “war in
Iraq” (terms often used by Democrats) falls on the left side.
Figure 9 displays the “right” and “left” versions of our news-based EPU index.
Clearly, the two index versions move together over time, indicating that most variations in
reporting about policy uncertainty are apolitical. Appendix Table A1 reports a more
detailed statistical analysis of how political slant affects EPU coverage. We find evidence
that political slant colors EPU coverage, but the effects are modest in size, as suggested by
Figure 9. We conclude that political slant in news coverage of policy uncertainty is an
interesting issue, but it is not a serious concern for our EPU index.
3.4 Beige Book Analysis
We turn now to a different text source. In particular, we examine the frequency of
“uncertainty” in the so-called Beige Books released before each regularly scheduled
meeting of the Federal Open Market Committee (FOMC) since 1983. Each Beige Book
summarizes in roughly 15,000 words the views and concerns expressed by contacts of the
twelve regional Federal Reserve Banks to Fed staff members. We count the frequency of
“uncertain” (and variants like “uncertainty”) in each Beige Book. A research assistant read
each passage about “uncertainty” in the Beige Books to determine whether they pertained
to policy-related matters and, if so, recording the specific policy area discussed.
Based on this analysis, Figure 10 plots the average frequency of “uncertainty” and
policy-related “uncertainty” discussions per Beige Book from 1983Q4 to 2012Q4. The
frequency of uncertainty discussions in the Beige Books show a similar pattern to our
overall EPU index (correlation=0.802), with high levels post 2008 and smaller spikes after
Gulf Wars I and II and 9/11. Interestingly, the incidence of policy-related uncertainty
discussions in the Beige Books rose even more sharply from 2008. These results for the
15
Beige Books reinforce the view that the United States experienced historically high levels
of economic policy uncertainty since 2008.
3.5 Large Stock-Market Jumps
The evidence developed above points to unusually elevated levels of policy-related
economic uncertainty during and after the financial crisis of 2008-09. As a check on this
conclusion, we investigate the factors that trigger large jumps in U.S. equity markets,
following the approach in Baker, Bloom and Davis (2013). The idea is that higher
uncertainty leads to a greater frequency of large equity market moves and, in particular,
higher policy uncertainty leads to a greater frequency of jumps triggered by policy-related
developments. Consider, for example, a model in which an equity market index (X)
follows a geometric Brownian motion with stochastic volatility:
dXt = µdt + + σPt-1dwP
t + σEt-1dwE
t, where dwit ~ N(0,1), i=P or E, (1)
where µ is a long-run trend, and wP and wE denote policy and non-policy shocks to equity
values. The σP and σE terms index the stochastic volatility of the policy and non-policy
shocks. Thus, when policy uncertainty (σP) is high, we expect a greater frequency of large
equity market jumps triggered by policy-related shocks.
To implement this idea, we first identified all trading days for which the S&P 500
equity index moved at least 2.5%, up or down, from open to close. There were 290 such
moves from 1980 to 2011, 120 in the 2008-2011 period alone. In sharp contrast, the 2004-
2006 period saw no daily moves of 2.5% or more. We then consulted next-day New York
Times articles to record the explanation for the market jump, as seen by the newspaper.
When the equity market moves 2.5% or more in a single day, the next-day Times nearly
always carries a news article about the event, and the article typically offers an explanation
for the market move. We assign the newspaper explanations for the equity market jump
into one of several categories.
Table 1 summarizes the results of this analysis and highlights the stark difference
between the 2008-2011 period and the previous 28 years. The recent period exhibits
tremendously higher volatility, as measured by the frequency of large daily equity market
jumps. The recent period also exhibits a dramatically greater frequency of market jumps
triggered by policy factors, according to the next-day news accounts. Even the share of
jumps triggered by policy factors is greater in the 2008-2011 period.
16
A possible concern about Table 1 is our reliance on the New York Times to
characterize the reason for stock-market jumps. We address this concern in Baker, Bloom
and Davis (2013), obtaining similar results for the Wall Street Journal, Los Angeles Times,
Boston Globe, and Washington Post. BBD also document an unusually high frequency of
large daily jumps in the national equity markets of other major economies in recent years,
and an important role for policy-related factors in the recent high volatility levels. In short,
the high frequency of large equity market jumps and their characterization in next-day
news accounts supports the view that policy-related uncertainty has been at historically
high levels in recent years.
4. THE SOURCES AND HORIZON OF POLICY UNCERTAINTY In this section we investigate what particular types of policy are driving our overall policy
uncertainty index, to what extent policy uncertainty is linked to other types of uncertainty,
and what is the time-horizon it reflects.
4.1 Sources of Policy Uncertainty
One obvious question that arises from our index is what types of policies are
causing these changes overall economy policy uncertainty. To investigate this we create
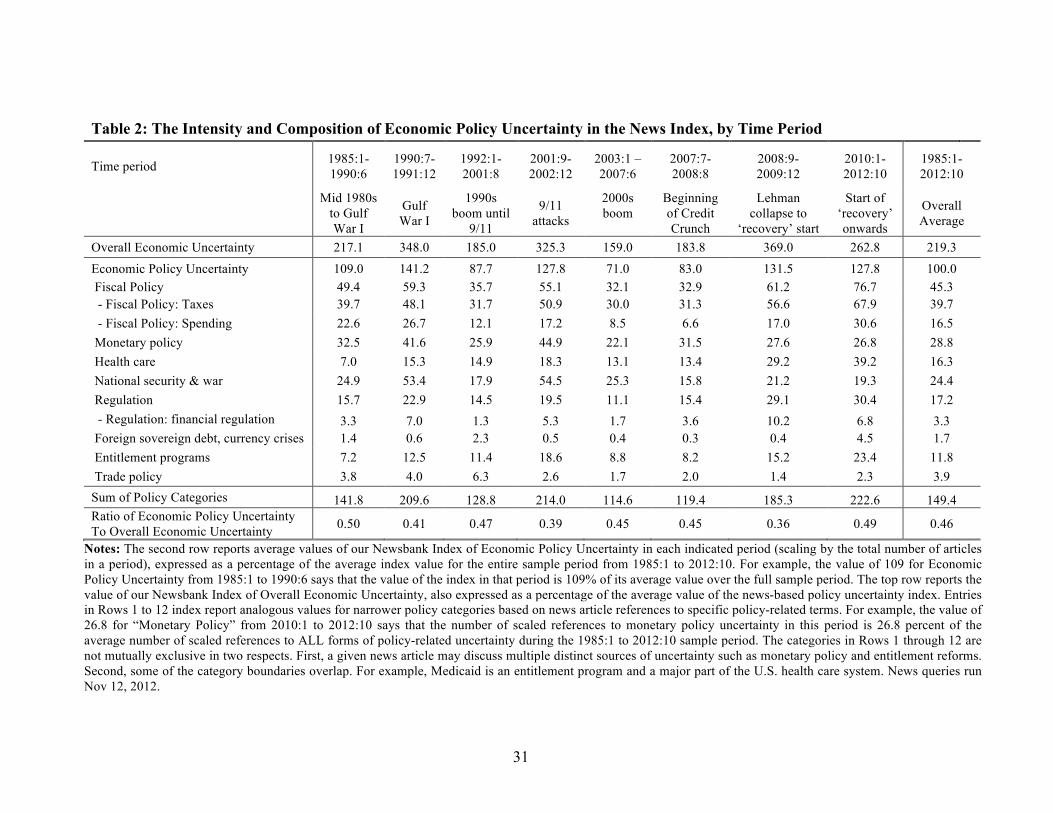
sub-indices for specific policy areas, like taxes, monetary policy and regulation. To do this
we require an article to satisfy all the search criteria for our main policy uncertainty index
plus mention category-specific terms such as “Federal Reserve Board”, “The Fed, “interest
rate” or “inflation” for our Monetary Policy category, or “taxes” for our Taxes category.
This is undertaken using the Access World News Newsbank (“Newsbank”), which
is a news source covering about 2,000 national and regional newspapers in the United
States. We use Newsbank for these sub-indices due to its larger sample size of 2,000
(rather than 10) newspapers which means we can drill down in more detail on individual
policy areas while maintaining a sufficient volume of articles for an analysis. However, the
downside of Newsbank is that the composition of papers changes over time, so for our
primary index we use our 10-paper news-based measure due to its stability and reliability.
The correlation between for the basic monthly policy uncertainty index generated from our
10 newspapers and from Newsbank is 0.94, suggesting the two sources would give similar
results if used to create the overall index.

17
Table 2 reports the results for nine categories of policy uncertainty. The second row
reports average values of our Newsbank Index of Economic Policy Uncertainty in each
indicated period (scaling by the total number of articles in a period), expressed as a
percentage of the average index value for the entire sample period from 1985:1 to 2012:10.
For example, the value of 109.0 for Economic Policy Uncertainty from 1985:1 to 1990:6
says that the value of the index in that period is 109.0% of its average value over the full
sample period.
The top row of Table 2 reports the value of our Newsbank Index of Overall
Economic Uncertainty, also expressed as a percentage of the average value of our
Newsbank Index of Economic Policy Uncertainty. Entries in the lower rows report the
values for specific policy categories. For example, the value of 76.7 for “Fiscal Policy”
from 2010:1 to 2012:10 says that the number of scaled references to fiscal policy (tax or
spending) uncertainty in this period is 76.7% of the average number of scaled references to
all forms of policy-related uncertainty during the full 1985:1 to 2012:10 period. That is
more than three quarters of all articles on economic policy uncertainty over this period also
mentioned words connected with fiscal policy like “Tax”, “Government Spending” or
“Budget Deficit” (see notes to Table 2 for details).
The key finding from Table 2 is that fiscal policy – both tax and spending – and
health care and entitlement policies have been the big drivers of the recent overall increase
in policy uncertainty. Strikingly, monetary policy uncertainty does not appear to have
increased, presumably because the typical paper in the Newsbank index of about 2000
papers – which is a regional newspaper – does not consider monetary policy uncertainty to
have increased given relatively low and stable inflation and interest rates.
Looking further as Table 2 we also see that both “financial regulation” policy
uncertainty rises three-fold post 2008, and “foreign sovereign debt and currency crisis”
policy uncertainty rises ten-fold post 2010. However, both categories how low absolute
levels so these increases do not have much impact on the overall index. This suggests that
the typical US regional newspaper in the Newsbank sample is not focusing much on
financial regulation and the European debt crisis, but is more concerned with policy
uncertainty around taxes, government spending, healthcare and entitlement reform.
18
Looking at earlier periods, we also “national security and war” policy uncertainty looms
large around Gulf War I and after 9/11.
In Table 3 we also provide a breakdown of policy uncertainty areas using our
FOMC Beige Book data, which reveals broadly similar patterns to our news analysis in
Table 2. The increase in policy uncertainty post 2010 is heavily driven by “fiscal policy”,
which alone accounts for more than 50% of the overall increase.17 There is also an increase
in “health care”, “financial regulation” and “foreign sovereign debt and currency crisis”
policy uncertainty. The category “U.S. Elections & Leadership Changes” uncertainty also
rises reflecting the presidential election in 2012, as do two residual categories (other
specified and unspecified policies). Maybe not surprisingly, given that this is a FOMC
produced document, there is no discussion of monetary policy uncertainty.
4.2 Policy Uncertainty and the VIX
Another commonly used high-frequency measure of uncertainty is the VIX index
of 30-day implied volatility on the S&P500 index, provided by the Chicago Board of
Options and Exchange (CBOE). This is an index constructed from a weighted average of
European-style call and put options on the S&P500 that straddle the 30-day maturity and
cover a wide range of strikes (see CBOE (2004) for details).
Figure 11 shows the VIX plotted alongside our policy uncertainty index, and it is
clear these are linked (correlation=0.578) but also have substantial independent variation.
In particular, the VIX appeared to rise far more after the Asian crisis of 1997, the LTCM
and Russian Debt crisis of 1998, after the stock-market scandals of early 2002 (WorldCom,
Enron etc) and right after Lehman’s collapsed in 2008. These are all clearly events that
have a strong financial and stock-market connection. In contrast the policy-uncertainty
index spiked relatively more after Gulf Wars, the Clinton and Obama Election, and from
2009 onwards especially during the debt-ceiling dispute during the summer of 2011. These
are more policy relevant events, in that while they have financial implications (for
example, the impact of the Gulf Wars on oil prices) they also have much broader policy
implications.
17 The mentions of uncertainty in the Beige Book that have enough discussion around can be broken down into tax and government spending sub-components of fiscal policy, with both elements showing an increase in 2010. However, several times when the Beige Book mentions the word uncertainty there is too little discussion to attribute this to tax or spending.
19
These differences could also reflect differences in measurement, since the VIX is
based on traded put and call options while the EPU index is based 50% on newspaper
coverage. To investigate whether this matters we created an “equity market uncertainty”
news index, which calculates an index of the proportion of articles in our 10 newspapers
that contain the words “uncertain/uncertainty” and “economic/economy” and words
referring to financial markets like “stock price” or “equity price” or “stock market”. This
created in exactly the same way as our newspaper policy uncertainty index, except that we
search for these stock-market terms rather than the policy terms. Figure 11 plots this equity
market uncertainty index is clearly much more correlated with the VIX than our general
policy uncertainty index was (correlations of 0.733 and 0.578 respectively). Our equity
market uncertainty index appears to jump and fall in line with the VIX, and in particular is
not as highly elevated since 2009 in contrast with our EPU index. Hence, we believe that
the difference between the VIX and the EPU index is not simply due to one being market
based and the other being partially news based.
Another difference is of course that the VIX is focused on a 30-day measure of
volatility while our policy uncertainty index has no explicit timeframe, something we turn
to next. To evaluate we compare our policy uncertainty index against 30-day implied
volatility from the VIX index and against 10-year implied volatility calculated using the
same formula as for the VIX (see CBOE 2004) but for a basket of 10 year put and call
options18. We find the EPU index has a much higher correlation (correlation=0.855) with
the 10-year financial uncertainty index than with the 1-month financial uncertainty index
(correlation=0.578). In particular, since late 2008 the 1-month implied volatility index has
fallen, while both our EPU index and the 10-year implied volatility indices remain high
(see also figure A2 in the Appendix).
In fact looking across a range of different maturities of financial volatility indices
we find these are increasingly correlated with our EPU index as the time horizon moves
out. In particular the correlations of the 1-month, 3-month, 6-month, 1-year, 2-year, 3-year,
5-year and 10-year implied volatility indices with the EPU index are 0.578, 0.644, 0.715,
0.777, 0.820, 0.840, 0.857 and 0.855 respectively. Hence, at least over the time-period of
18 We thank Krag Gregory and Jose Rangel from Goldman Sachs for providing this data for this, which was came from (Gregory and Rangel, 2012).
20
2002-2012 spanned by this data our policy uncertainty index seems to be more long-run
than short-run focused.
5. THE POTENTIAL EFFECTS OF POLICY UNCERTAINTY As we discussed in the introduction, an open question is to what extent – if any –
has heightened policy uncertainty acted to impede the recovery from the recession of 2007-
2009, and more generally drive the business cycle. To investigate this, we first estimate the
impact using micro data exploiting variations in exposure of firms to government
contracts, and then using simple VARs to try and characterize the rough magnitude of the
relationship between policy uncertainty and economic outcomes.
5.1 Policy Uncertainty Effects on Firm-Level Investment and Employment
We utilize firm-level micro data to investigate the impact of policy uncertainty on
relevant firm-level financial indicators such as investment and hiring. Given the wide
variation among firms and industries in their dependence on government contracts, firms
with high levels of dependence on government contracts should be more responsive to
economic policy uncertainty than firms wholly focused on private sector contracting and
sales.
We construct a measure of industry-level (SIC 4-digit) exposure to government
contracting and spending through the use of the universe of federal contracting data from
2000-2013. We match firms in the contracting database to Compustat using their names
and the names of their subsidiaries19 then collapse to an industry level, obtaining total
industry contract receipts and total industry revenue. Dividing total contracts by total
revenue, we arrive at our industry-level measure of ‘contract intensity’. The dozen most
contract intensive industries can be seen in Table 4, with military, infrastructure, and
healthcare industries dominating the list.
Table 5 displays results from a range of regressions utilizing the interaction
between changes in economic policy uncertainty and our measure of government exposure
at a firm-quarter level. Columns (1) – (3) display results from regressing firm-level
investment on this interaction term as well as interactions between actual federal
19 This was done using Dunn & Bradstreet’s US database of all public and private firms, which includes an firm name, ownership information and ticker symbol for all publicly listed firm.
21
government spending and forecasts of federal spending. We find negative and highly
significant effects of policy uncertainty for firms more exposed to government contracting
and positive effects of forecast federal spending on these firms. All specifications have a
full set of time and firm fixed-effects and are clustered at an industry level.
The magnitude of these effects is significant for firms who are more exposed to
government contracts. Given an average investment rate of 10%-15% (median of 10.4%
and mean of 16.7%) for firms in our sample, a doubling of the level of EPU would cause a
decline in investment of only 0.078 percentage points for a firm with the average amount
of government exposure (~1.2%). However, for firms in the 90th percentile of exposure
rates, the impact is much more dramatic, with predicted declines in investment of 0.8-5.0
percentage points.
One worry might be that the firms more exposed to government contracting are
simply more sensitive to economic uncertainty in general and not policy uncertainty in
particular. Columns (4) and (5) also include the interaction of changes in the VIX with our
measure of government exposure. On its own, in column (4), we see negative and
significant effects of increases in the VIX for more exposed firms. However, when
including both the interactions with the VIX as well as interactions with EPU, we find
negative and significant effects of EPU (similar in size to our initial estimates) and the
interaction with the VIX becomes much smaller in magnitude and statistically
insignificant. This suggests that it is policy uncertainty impacting these firms and not
overall economic uncertainty.
Finally, we perform a similar exercise using changes in employment in columns (6)
and (7). We again find negative effects of EPU for firms most exposed to government
contracting, but insignificant when not also controlling for actual government
expenditures.
5.2 Policy Uncertainty and Aggregate Economic Activity
We start by estimating a VAR and recovering orthogonal shocks using a Cholesky
decomposition of the following variables: our policy uncertainty index, the log of the S&P
500 index to control for broader economic conditions, the federal funds rate to control for
interest rates, log employment, and log real industrial production. In our baseline
22
specification, we run the VAR on monthly data with six monthly lags, and a monthly time
trend.
This approach identifies dynamic relationships among the variables using our
Cholesky ordering and differences in the timing of movements in the variables. So, for
example, it could be that policy uncertainty causes recessions, or that policy uncertainty is
a forward-looking variable that rises in advance of anticipated recessions. With these
caveats in mind, our VAR-based results provide evidence at least of important co-
movements between our index of policy-related uncertainty and economic activity, with
some suggestive evidence on causation.
Looking at Figure 12, we see that a 102 point innovation in policy uncertainty (the
rise in our policy uncertainty index from 2006 to 2011) is followed by a persistent fall in
real industrial production with a peak negative impact of about -2.5% at 14 months.
Similarly, there is a persistent fall in aggregate employment following a policy uncertainty
shocks, with a peak response of 2.3 million jobs after 18 months. These dynamic responses
are substantial, lending support to recent concerns about the potentially damaging
economic consequences of policy uncertainty.
The estimated effects of political uncertainty on output and employment are robust
to several modifications to the VAR specification, Cholesky ordering, and policy
uncertainty index construction. Figure 13 shows the results of a sensitivity analysis for the
industrial production response to policy uncertainty shocks. We consider three months and
nine months of lags rather than six months, reverse the Cholesky ordering used to construct
orthogonal shocks, use a version of the policy uncertainty index that weights all
components equally, consider a bivariate VAR with policy uncertainty and industrial
production only, and add the VIX index as the first measure in the VAR to control for
overall economic uncertainty. Robustness results for employment look similar, with
estimated falls of around 1.5 to 3 million jobs following a policy uncertainty shock across
all the specifications estimated in Figure 13. We also consider a VAR-based estimated
effect of policy uncertainty shocks on real GDP and investment using quarterly data from
the national income accounts. Using the same size shock as before, we find a peak
estimated effect on GDP of 2.3% after four quarters. We find a much larger effect on
private investment, with a peak decline of 14% after three quarters. Although based on a
23
different empirical approach, our investment results are very much in line with the
estimated effects of election uncertainty in Julio and Yook (2010) and Durnev (2010).
Consumption (not shown in the figures) also drops in a similar fashion to GDP, with
durable consumption showing a slightly larger drop and recovery than non-durable
consumption.
Another question is to what extent our estimated impact of uncertainty reflects the
response of economic activity to an increase in uncertainty (a mean preserving increase in
the variance of policy) versus the response to increased uncertainty alongside bad news.
This is important as periods of increased economic policy uncertainty also tend to be
periods of bad economic news. So our changes in “uncertainty” could be reflecting
changes in “confidence”, a term which often implies both mean and variance effects.
To control for this we first include the level of the S&P500 stock-market index in
all our VAR estimations. Given stock-markets are forward looking this should hopefully
reflect future expectations of business conditions. But as a second robustness test we also
try including the index of consumer confidence from the Michigan Consumer Sentiment
Index.20 We also test the VAR estimates after including this consumer confidence index as
the second measure after uncertainty and as the first measure before uncertainty. In both
cases the estimated impact is lower, suggesting that consumer confidence does proxy for
part of the predictive power of our economic policy uncertainty measure. But, nevertheless
we still get a drop and recovery in production after an economic policy uncertainty shock,
suggesting EPU has significant additional predictive power over and above consumer
confidence.
6. POLICY UNCERTAINTY BACK TO 1900
20 This index is constructed through phone surveys of consumers and seeks to determine how consumers view the short-term economy, the long-term economy, and their own financial situation. It takes the difference between the percent answering positively and that answering negatively for each of 5 questions, then averages these differences and normalizes by the base period (December 1968) total. This has a correlation with our uncertainty index of -0.742. We chose the Michigan index as the more commonly used consumer confidence index, but other indices give similar results as they are highly correlated with the Michigan Index – for example, the Bloomberg Confidence index has a correlation of 0.943 with the Michigan index and the Conference Board Confidence index has a correlation of 0.912 with the Michigan index.

24
In addition to our main series extending back to 1985, we construct a historical
news-based index of economic policy uncertainty from newspaper data extending back to
1900. We turn to our same set of 10 major US newspapers, with a set of 6 newspapers
extending back to 1900: the New York Times, the Boston Globe, the Wall Street Journal,
the LA Times, the Chicago Tribune, and the Washington Post.
As with our main index, we count the number of articles that feature a term about
the economy, a term about uncertainty, and a term about policy. The policy and uncertainty
terms are the same as in our primary index. The set of economic terms is expanded to
include ‘business’ and ‘commerce’ in addition to ‘economic’ and ‘economy’ as ‘economic’
and ‘economy’ were used much less frequently when discussing economic matters prior to
the 1980s. Moreover, for the historical index, we employ two different normalizing series,
one where we normalize by the total number of articles in a given paper-month (shown in
Figure 14), and a second where we instead normalize by the total number of articles that
mention one of the ‘economic’ terms in a given paper-month (show in Figure A3). This
second method is to better control for systematic changes in newspaper reporting over time
wherein coverage of business, financial, and economic news grew at the expense of other
topics.
Looking at either index we find two distinct results. First, policy uncertainty spiked
with important events throughout the 20th century, most notably during the Great
Depression. However, policy uncertainty did not immediately spike when output started to
decline and stock-market volatility jumped at the outset of Great Depression in 1929.
Instead, EPU only rose from 1932 onwards when policy activism jumped up during the last
year of Hoover’s presidency and then from 1933 onwards under Roosevelt. While
Roosevelt was famous for policy activism, most notably the New Deal, in his last year
Hoover was also extremely active. For example, in 1932 he introduced the Revenue Act
(the largest peace time increase in tax revenue), the Glass-Steagal banking reforms, and the
Emergency Relief and Construction Act.
Second, there was a clear secular rise in policy uncertainty from the early 1960s
until the mid-1980s. There are a range of potential explanations for this, but one obvious
one is the expansion of the Government’s role in the economy that occurred over the same
period. For example, as shown in Figure 15 the ratio of the share of Government
25
expenditure as a fraction of GDP rose from 25% to 45% over the same period (correlation
0.812) while there was also a simultaneous increase in the extent of Government
regulatory reach with, for example, the number of pages of the Federal Register rising
steadily from around 10,000 in 1960 to 80,000 by 1980 (annual correlation at 0.845).
7. CONCLUSION Economic policy uncertainty (EPU) has become the subject of contentious debate
since the recession of 2007-2009. Commentators have made two broad claims: first, that
policy uncertainty has increased since the onset of the recession, and second that this
increase in policy uncertainty has impeded the recovery. This paper seeks to investigate
both claims, finding strong support for the first claim and evidence in line with the second
claim as well. To the first, we find evidence of substantial increases in policy uncertainty
in the United States and worldwide since 2007, with our economic policy uncertainty
index increasing by more than 50%. Regarding the second claim, we find negative effects
of EPU at both firm and national levels. We find negative effects on firm-level investment
and hiring by leveraging a differences-in-differences type strategy using cross-firm
variation in exposure to government contracting. In addition, we use a VAR framework at
a national level, finding that innovations in EPU foreshadow sizable declines in GDP and
employment, although this evidence is associative rather than necessarily causal.
Our EPU index is built on three components: the frequency of news media
references to economic policy uncertainty, the number of federal tax code provisions set to
expire, and the extent of forecaster disagreement over future inflation and government
purchases. This EPU index spikes near consequential presidential elections and major
events such as the Gulf wars and the 9/11 attack. It also rises steeply from 2008 onward.
We also evaluate our EPU index, first on a sample of 5,000 human audited news
articles, and second against other measures of policy uncertainty like the frequency of the
word “uncertainty” in the FOMC Beige Book and the number of policy related jumps in
the stock-market, finding evidence suggesting our EPU index is a good proxy for real
economic policy uncertainty.
Drilling down into our index we find that the post-2008 increases are driven mainly
by tax, spending and healthcare policy uncertainty. Perhaps surprisingly we find no

26
evidence of an increase in monetary policy uncertainty after 2008. One interpretation is
that since inflation and interest rates have both been low and stable since mid-2008
onwards, monetary policy is not seen by the news media as contributing to economic
policy uncertainty.
Finally, VAR estimates show that an innovation in policy uncertainty equal to the
actual increase from 2006 to 2011 foreshadows declines in production peaking at 2.5% and
in employment peaking at 2.3 million. These effects peak at about 18 months out, and
appear to be robust to a variety of different measures, choices of VAR variables and
ordering and even detrending. But while the VAR results are empirically robust, it is less
clear whether rises in policy uncertainty cause the subsequent drops in economic activity,
or simply forecast them because policy making is a forward looking process.
In terms of future work we want to extend our measurement of policy uncertainty,
first by pushing the data across more countries and back in time. We also want to refine the
methodology, for example using information on the location of terms about economic
policy uncertainty within news articles, such as whether all our key search terms are in the
same sentence or paragraph. As importantly we want to try and extend our research to
improve our identification of the causal impact of policy uncertainty on the economy.
Right now it is hard to empirically distinguish cause and effect because of the forward
looking nature of policy making, requiring us to exploit exogenous policy-shocks to try to
deal with this.

27
REFERENCES: Alexopoulos, M. and J. Cohen, (2009), “Nothing to Fear but Fear itself? Exploring the
effect of economic uncertainty”, Manuscript, University of Toronto working paper. Bachmann, Rüdiger, Steffen Elstener, and Eric Sims (2013). “Uncertainty and Economic
Activity: Evidence from Business Survey Data,”, forthcoming AEJ Macro. Baker, Scott, Bloom, Nicholas and Davis, Steven J. (2013), “What triggers stock market
jumps?” Work in progress presented at the January 2013 ASSA meetings. Baker, Scott, Bloom, Nicholas and Davis, Steven J., (2012), “Measuring economic policy
uncertainty”, Stanford mimeo. Bernanke, B. (1983): “Irreversibility, Uncertainty and Cyclical Investment,” Quarterly
Journal of Economics, 98, pp. 85–106. Bloom, Nick. (2009): “The Impact of Uncertainty Shocks,” Econometrica, 77, pp. 623-
685. Boero, Gianna, Jeremy Smith, and Kenneth F. Wallis, “Uncertainty and Disagreement in
Economic Prediction” Economic Journal 118 (2008), 1107–1127. Bomberger, W. A. (1996), "Disagreement as a Measure of Uncertainty", Journal of Money,
Credit and Banking, 28(3), 381-392. Born, Benjamin and Johannes Pfeifer, 2011. “Policy Risk and the Business Cycle,”
University of Bonn. Brogaard, J and Detzel, A. (2012), “The Asset Pricing Implications of Government
Economic Policy Uncertainty”, University of Washington mimeo Chicago Board Options Exchange (2004). “VIX CBOE Volatility Index,” White Paper. Dixit, A. and R. Pindyck (1994): Investment Under Uncertainty. Princeton, NJ: Princeton
University Press. Durnev, Art, 2010. “The Real Effects of Political Uncertainty: Elections and Investment
Sensitivity to Stock Prices,” working paper, McGill University, September. Fernandez-Villaverde, Jesus, Guerron-Quintana, Pablo, Kuester, Keith and Juan Rubio-
Ramirez (2011), “Fiscal volatility shocks and economic activity”, Penn mimeo. Friedman, Milton, 1968, “The Role of Monetary Policy” The American Economic Review,
58. Gentzkow, M and Shapiro, J (2010), “What drives media slant? Evidence from US Daily
newspapers”, Econometrica 78(1), pp. 35-71. Gilchrist, Simon, Jae W. Sim and Egon Zakrajsek, 2010, “Uncertainty, Financial Friction
and Investment Dynamics, Giordani, P. and Soderlind, P. (2003). Inflation forecast uncertainty. European Economic
Review, 47, 1037-1059. Gregory, Krag and Rangel, Jose (2012), “Links between policy uncertainty and equity
volatility”, The Buzz, published by Goldman Sachs November 12, 2012. Gulen, Huseyin and Ion, Mihai (2012), “Policy uncertainty and corporate investment”,
Purdue mimeo. Handley, Kyle and Limao, Nuno (2012), “Trade and investment under policy uncertainty:
theory and firm evidence”, Maryland mimeo. Hassett, Kevin A. and Gilbert E. Metcalf, 1999. “Investment with Uncertain Tax Policy:
Does Random Tax Policy Discourage Investment?” Economic Journal, 109, no. 457 (July), 372-393.

28
Higgs, Robert, 1997, “Why the Great Depression Lasted So Long and Why Prosperity Resumed After the War” The Independent Review, Vol 1, No. 4.
Joint Committee on Taxation, 2011. List of Expiring Tax Provisions, 2010-2020 (JCX-2-11), January 21, and similar documents for earlier years. Available at www.jct.gov.
Julio, Brandon and Youngsung Yook, 2010. “Political Uncertainty and Corporate Investment Cycles,” Journal of Finance, forthcoming.
Panousi, Vasia and Papanikolaou, Dimitris (2011), “Investment, idiosyncratic risk and ownership”, forthcoming Journal of Finance.
Pastor, Lubos and Veronesi, Pietro, (2011a), “Uncertainty about government policy and stock prices”, forthcoming Journal of Finance.
Pastor, Lubos and Veronesi, Pietro, (2011b), “Political Uncertainty and Risk Premia,” working paper, University of Chicago, September.
Rich, Robert and Tracy, Joseph. (2010), “The relationship among expected inflation, disagreement, and uncertainty: evidence from matched point and density forecasts”, Review of Economic Studies, 92(1), 200-207.
Rodrik, Dani, 1991. “Policy Uncertainty and Private Investment,” Journal of Development Economics, 36, 229-242.
Stock, James and Mark Watson. (2012): “Disentangling the Channels of the 2007-2009 Recession” Brookings Panel on Economic Activity.
Zarnowitz, Victor, and Louis A. Lambros, “Consensus and Uncertainty in Economic Prediction,” Journal of Political Economy 95 (1987), 591–621.

29
Table A1: Effects of Political Media Slant on News-Based Economic Policy Uncertainty Time period (1) (2) (3) (4) (5) (6)
News Uncert News Uncert News Uncert News Uncert News Uncert Log(News Uncert)
Media Slant 0.00132 0.831 2.105 -0.285 -0.618*** 0.0702* (0.045) (2.862) (3.036) (0.156) (0.173) (0.0322) Media Slant * Dem. President -1.94 -3.237 0.700* 1.007** -0.0841 (6.661) (6.808) (0.367 (0.386) (0.0484) Media Slant * Dem. Congress -3.416* 0.839*** -0.0247 (1.765) (0.142) (0.0286)
Observations 3,299 3,299 3,299 3,299 3,299 3,299 R2 0.407 0.407 0.409 0.008 0.050 0.315
Year-Month Controls YES YES YES NO NO YES

30
Table 1: Proximate Determinants of Large Daily Jumps in the S&P 500 Equity Market Index, 1980-2011
Time Period Policy-Related Macroeconomic
Corporate Earnings War/Terror
Interest Rates Oil Other Unknown Other Total Events
1980-2007 14% 31% 12% 11% 9% 2% 22% 3% 17% 170
2008-2011 39% 35% 12% 0% 3% 2% 11% 1% 8% 120
Other Recession Periods
1981-1982 20% 50% 0% 0% 10% 0% 20% 10% 10% 10
1990-1991 0% 9% 9% 73% 9% 0% 0% 0% 0% 11
2001 0% 36% 21% 14% 14% 0% 14% 0% 14.3% 14
Notes: Based on human readings of the next-day New York Times for daily moves in the S&P 500 index of 2.5% or more, up or down.
31
Table 2: The Intensity and Composition of Economic Policy Uncertainty in the News Index, by Time Period
Time period 1985:1- 1990:6
1990:7- 1991:12
1992:1- 2001:8
2001:9- 2002:12
2003:1 – 2007:6
2007:7- 2008:8
2008:9- 2009:12
2010:1- 2012:10
1985:1- 2012:10
Mid 1980s
to Gulf War I
Gulf War I
1990s boom until
9/11
9/11 attacks
2000s boom
Beginning of Credit Crunch
Lehman collapse to
‘recovery’ start
Start of ‘recovery’ onwards
Overall Average
Overall Economic Uncertainty 217.1 348.0 185.0 325.3 159.0 183.8 369.0 262.8 219.3 Economic Policy Uncertainty 109.0 141.2 87.7 127.8 71.0 83.0 131.5 127.8 100.0 Fiscal Policy 49.4 59.3 35.7 55.1 32.1 32.9 61.2 76.7 45.3 - Fiscal Policy: Taxes 39.7 48.1 31.7 50.9 30.0 31.3 56.6 67.9 39.7 - Fiscal Policy: Spending 22.6 26.7 12.1 17.2 8.5 6.6 17.0 30.6 16.5 Monetary policy 32.5 41.6 25.9 44.9 22.1 31.5 27.6 26.8 28.8 Health care 7.0 15.3 14.9 18.3 13.1 13.4 29.2 39.2 16.3 National security & war 24.9 53.4 17.9 54.5 25.3 15.8 21.2 19.3 24.4 Regulation 15.7 22.9 14.5 19.5 11.1 15.4 29.1 30.4 17.2 - Regulation: financial regulation 3.3 7.0 1.3 5.3 1.7 3.6 10.2 6.8 3.3 Foreign sovereign debt, currency crises 1.4 0.6 2.3 0.5 0.4 0.3 0.4 4.5 1.7 Entitlement programs 7.2 12.5 11.4 18.6 8.8 8.2 15.2 23.4 11.8 Trade policy 3.8 4.0 6.3 2.6 1.7 2.0 1.4 2.3 3.9 Sum of Policy Categories 141.8 209.6 128.8 214.0 114.6 119.4 185.3 222.6 149.4 Ratio of Economic Policy Uncertainty To Overall Economic Uncertainty 0.50 0.41 0.47 0.39 0.45 0.45 0.36 0.49 0.46
Notes: The second row reports average values of our Newsbank Index of Economic Policy Uncertainty in each indicated period (scaling by the total number of articles in a period), expressed as a percentage of the average index value for the entire sample period from 1985:1 to 2012:10. For example, the value of 109 for Economic Policy Uncertainty from 1985:1 to 1990:6 says that the value of the index in that period is 109% of its average value over the full sample period. The top row reports the value of our Newsbank Index of Overall Economic Uncertainty, also expressed as a percentage of the average value of the news-based policy uncertainty index. Entries in Rows 1 to 12 index report analogous values for narrower policy categories based on news article references to specific policy-related terms. For example, the value of 26.8 for “Monetary Policy” from 2010:1 to 2012:10 says that the number of scaled references to monetary policy uncertainty in this period is 26.8 percent of the average number of scaled references to ALL forms of policy-related uncertainty during the 1985:1 to 2012:10 sample period. The categories in Rows 1 through 12 are not mutually exclusive in two respects. First, a given news article may discuss multiple distinct sources of uncertainty such as monetary policy and entitlement reforms. Second, some of the category boundaries overlap. For example, Medicaid is an entitlement program and a major part of the U.S. health care system. News queries run Nov 12, 2012.
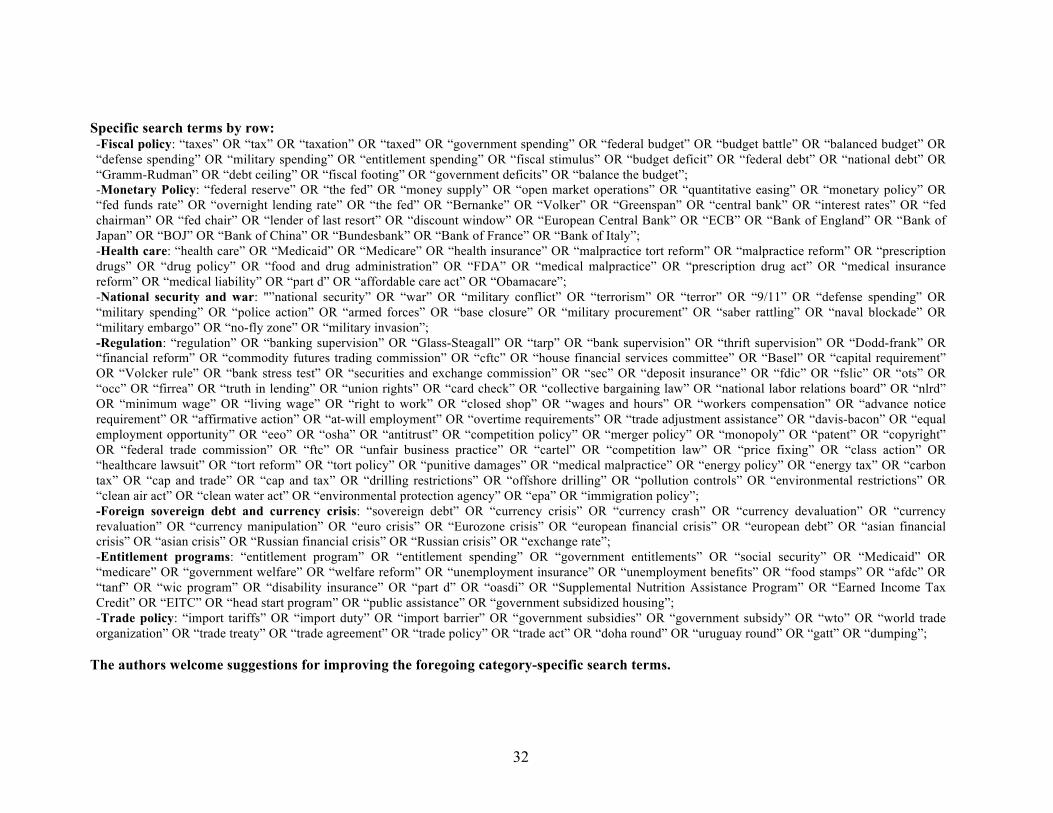
32
Specific search terms by row: -Fiscal policy: “taxes” OR “tax” OR “taxation” OR “taxed” OR “government spending” OR “federal budget” OR “budget battle” OR “balanced budget” OR “defense spending” OR “military spending” OR “entitlement spending” OR “fiscal stimulus” OR “budget deficit” OR “federal debt” OR “national debt” OR “Gramm-Rudman” OR “debt ceiling” OR “fiscal footing” OR “government deficits” OR “balance the budget”; -Monetary Policy: “federal reserve” OR “the fed” OR “money supply” OR “open market operations” OR “quantitative easing” OR “monetary policy” OR “fed funds rate” OR “overnight lending rate” OR “the fed” OR “Bernanke” OR “Volker” OR “Greenspan” OR “central bank” OR “interest rates” OR “fed chairman” OR “fed chair” OR “lender of last resort” OR “discount window” OR “European Central Bank” OR “ECB” OR “Bank of England” OR “Bank of Japan” OR “BOJ” OR “Bank of China” OR “Bundesbank” OR “Bank of France” OR “Bank of Italy”; -Health care: “health care” OR “Medicaid” OR “Medicare” OR “health insurance” OR “malpractice tort reform” OR “malpractice reform” OR “prescription drugs” OR “drug policy” OR “food and drug administration” OR “FDA” OR “medical malpractice” OR “prescription drug act” OR “medical insurance reform” OR “medical liability” OR “part d” OR “affordable care act” OR “Obamacare”; -National security and war: "”national security” OR “war” OR “military conflict” OR “terrorism” OR “terror” OR “9/11” OR “defense spending” OR “military spending” OR “police action” OR “armed forces” OR “base closure” OR “military procurement” OR “saber rattling” OR “naval blockade” OR “military embargo” OR “no-fly zone” OR “military invasion”; -Regulation: “regulation” OR “banking supervision” OR “Glass-Steagall” OR “tarp” OR “bank supervision” OR “thrift supervision” OR “Dodd-frank” OR “financial reform” OR “commodity futures trading commission” OR “cftc” OR “house financial services committee” OR “Basel” OR “capital requirement” OR “Volcker rule” OR “bank stress test” OR “securities and exchange commission” OR “sec” OR “deposit insurance” OR “fdic” OR “fslic” OR “ots” OR “occ” OR “firrea” OR “truth in lending” OR “union rights” OR “card check” OR “collective bargaining law” OR “national labor relations board” OR “nlrd” OR “minimum wage” OR “living wage” OR “right to work” OR “closed shop” OR “wages and hours” OR “workers compensation” OR “advance notice requirement” OR “affirmative action” OR “at-will employment” OR “overtime requirements” OR “trade adjustment assistance” OR “davis-bacon” OR “equal employment opportunity” OR “eeo” OR “osha” OR “antitrust” OR “competition policy” OR “merger policy” OR “monopoly” OR “patent” OR “copyright” OR “federal trade commission” OR “ftc” OR “unfair business practice” OR “cartel” OR “competition law” OR “price fixing” OR “class action” OR “healthcare lawsuit” OR “tort reform” OR “tort policy” OR “punitive damages” OR “medical malpractice” OR “energy policy” OR “energy tax” OR “carbon tax” OR “cap and trade” OR “cap and tax” OR “drilling restrictions” OR “offshore drilling” OR “pollution controls” OR “environmental restrictions” OR “clean air act” OR “clean water act” OR “environmental protection agency” OR “epa” OR “immigration policy”; -Foreign sovereign debt and currency crisis: “sovereign debt” OR “currency crisis” OR “currency crash” OR “currency devaluation” OR “currency revaluation” OR “currency manipulation” OR “euro crisis” OR “Eurozone crisis” OR “european financial crisis” OR “european debt” OR “asian financial crisis” OR “asian crisis” OR “Russian financial crisis” OR “Russian crisis” OR “exchange rate”; -Entitlement programs: “entitlement program” OR “entitlement spending” OR “government entitlements” OR “social security” OR “Medicaid” OR “medicare” OR “government welfare” OR “welfare reform” OR “unemployment insurance” OR “unemployment benefits” OR “food stamps” OR “afdc” OR “tanf” OR “wic program” OR “disability insurance” OR “part d” OR “oasdi” OR “Supplemental Nutrition Assistance Program” OR “Earned Income Tax Credit” OR “EITC” OR “head start program” OR “public assistance” OR “government subsidized housing”; -Trade policy: “import tariffs” OR “import duty” OR “import barrier” OR “government subsidies” OR “government subsidy” OR “wto” OR “world trade organization” OR “trade treaty” OR “trade agreement” OR “trade policy” OR “trade act” OR “doha round” OR “uruguay round” OR “gatt” OR “dumping”;
The authors welcome suggestions for improving the foregoing category-specific search terms.
33
Table 3. Frequency of Discussions about Uncertainty in FOMC Beige Books, Counts By Policy Category and Overall Time period 1990Q4-
1991Q1 1993Q2- 1993Q3
2001Q4- 2002Q2
2002Q4- 2003Q2
2004Q2- 2004Q4
2008Q3- 2009Q4
2010Q1- 2012Q4
1983Q3- 2012Q4
Gulf War I
Clinton tax reforms
9/11 attacks Gulf War II
Bush/Kerry Election
Lehman’s and recession
Debt-ceiling crisis
Overall Average
Overall Economic Uncertainty 11 8.8 7.7 13.5 5.2 10.2 15.3 5.28 Economic Policy Uncertainty 5.5 6.3 1.2 4.8 2.8 0.8 6.3 1.49 Fiscal Policy 1 5.5 1.5 0 0 0.4 3.4 0.74 - Fiscal Policy: Taxes 0 3.3 0.2 0 0 0.3 1.0 0.27 - Fiscal Policy: Spending 0.5 1 1 0 0 0.2 0.8 0.23 Monetary Policy 0 0 0 0 0 0 0 0 Health Care 0 2 0 0 0 0.2 0.5 0.13 National Security & War 5.3 0.3 0 2 0 0 0.1 0.20 Regulation (All Financial Regulation) 0 0 0 0 0 0.2 1.3 0.16 Foreign sovereign debt, currency crisis 0 0 0 0 0 0 0.8 0.09 U.S. Elections & Leadership Changes 0 0 0 0.2 2.2 0 1.0 0.20 Other Specified Policy Matters 0 0.5 0.7 0 0 0 0.6 0.17 Politics, Unspecified 0.5 1.0 0 3.0 0.7 0 1.4 0.29 Sum of Policy Categories 6.8 9.5 2.2 5.2 3.1 0.9 9.1 1.97 Notes: Table entries report average frequency counts per Federal Open Market Committee (FOMC) Beige Book issued during the indicated time period. For example, the top left figure of 11 means that the word “uncertainty” – our measure of the occurrence of discussions about overall economic uncertainty – arose 11 times on average in the Beige Book during 1990Q4-1991Q1. The Beige Book is typically released two weeks before regularly scheduled FOMC meetings, which occur about once every six weeks. The first FOMC Beige Book was issued in the third quarter of 1983. Frequency counts are classified into policy categories based on human readings of the text surrounding each discussion of “uncertainty” in FOMC Beige Books. “Other Specified Policy Matters” covers legal policy, trade policy, labor regulations, environmental regulations, and elections and leadership changes abroad. “Politics, Unspecified” covers generic references to “politics” and “political” concerns that do not mention a specific policy or political matter. The sum of policy categories can exceed the count of “All Policy & Politics” because some Beige Book discussions of uncertainty reference more than one policy-related source of uncertainty.!
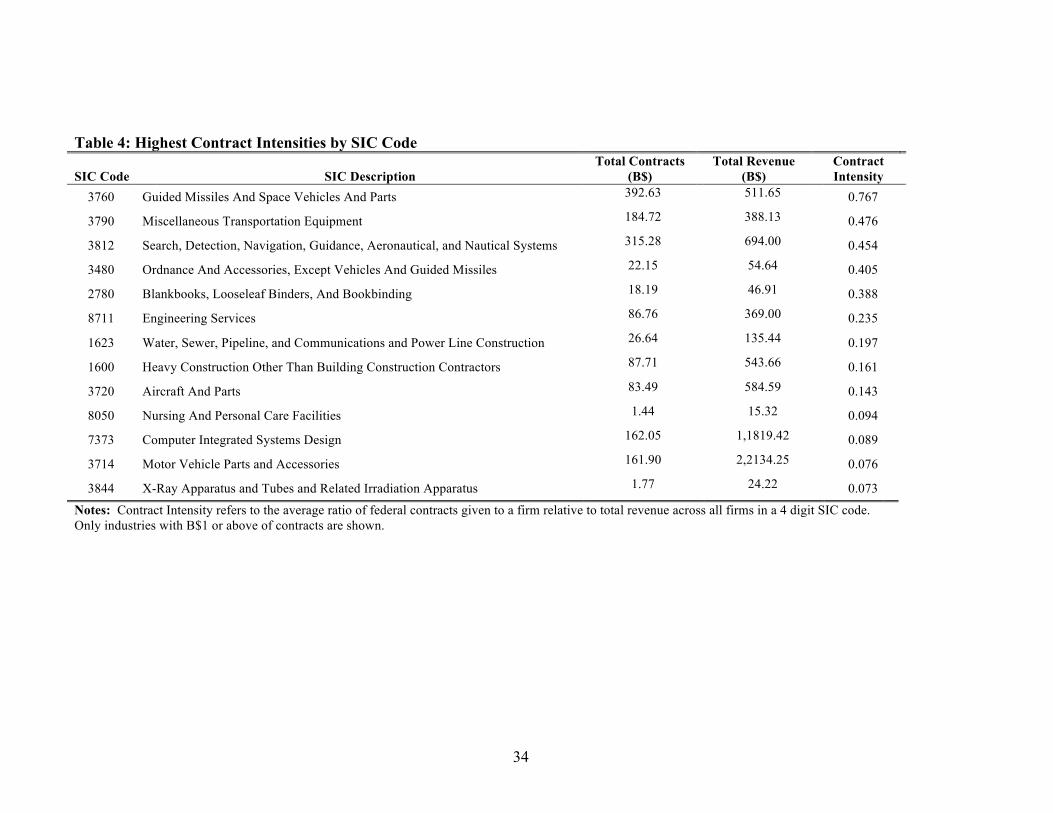
34
Table 4: Highest Contract Intensities by SIC Code
SIC Code SIC Description Total Contracts
(B$) Total Revenue
(B$) Contract Intensity
3760 Guided Missiles And Space Vehicles And Parts 392.63 511.65 0.767
3790 Miscellaneous Transportation Equipment 184.72 388.13 0.476
3812 Search, Detection, Navigation, Guidance, Aeronautical, and Nautical Systems 315.28 694.00 0.454
3480 Ordnance And Accessories, Except Vehicles And Guided Missiles 22.15 54.64 0.405
2780 Blankbooks, Looseleaf Binders, And Bookbinding 18.19 46.91 0.388
8711 Engineering Services 86.76 369.00 0.235
1623 Water, Sewer, Pipeline, and Communications and Power Line Construction 26.64 135.44 0.197
1600 Heavy Construction Other Than Building Construction Contractors 87.71 543.66 0.161
3720 Aircraft And Parts 83.49 584.59 0.143
8050 Nursing And Personal Care Facilities 1.44 15.32 0.094
7373 Computer Integrated Systems Design 162.05 1,1819.42 0.089
3714 Motor Vehicle Parts and Accessories 161.90 2,2134.25 0.076
3844 X-Ray Apparatus and Tubes and Related Irradiation Apparatus 1.77 24.22 0.073
Notes: Contract Intensity refers to the average ratio of federal contracts given to a firm relative to total revenue across all firms in a 4 digit SIC code. Only industries with B$1 or above of contracts are shown.

35
Table 5: Cross-Firm Effects of Policy Uncertainty (1) (2) (3) (4) (5) (6) (7) Dependent Variable Investment (It/Kt-1) Investment (It/Kt-1) ΔLog(Emp) ΔLog(EPU)×SIC Intensity -0.0578*** -0.064*** -0.065*** -0.056*** -0.009 -0.019**
(0.008) (0.008) (0.008) (0.012) (0.008) (0.009) ΔForecast Fed Exp/GDP×SIC Intensity
2.103*** 2.004*** 2.394*** 2.989*** 1.208*** 0.441 (0.607) (0.678) (0.633) (0.612) (0.362) (0.423)
ΔFederal Exp/GDP×SIC Intensity
2.269 1.961 1.507 3.886*** (3.639) (3.270) (3.344) (1.311)
ΔVIX×SIC Intensity -0.034*** -0.011 (0.004) (0.007)
Periodicity Quarterly Quarterly Quarterly Quarterly Quarterly Yearly Yearly Firm and Time Fixed-Effects Yes Yes Yes Yes Yes Yes Yes Observations 717,104 717,104 717,104 717,104 717,104 184,804 184,804 Number of Firms 22,638 22,638 22,638 22,638 22,638 21,667 21,667 Number of SIC codes 440 440 440 440 440 440 440 Notes: All columns include a full set of firm and time fixed effects (year by quarter in columns 1 to 5, and yearly in columns 6 and 7). For
columns 1-5, independent variables are lagged by one quarter. Standard errors clustered at the 4-digit SIC code level.

50
100
150
200
Figure 1: Index of Economic Policy Uncertainty (Jan 1985 – Mar 2013)
Notes: Index of Policy-Related Economic Uncertainty composed of 4 series: monthly news articles containing uncertain or uncertainty, economic or economy, and policy relevant terms (scaled by the smoothed number of articles containing ‘today’); the number of tax laws expiring in coming years, and a composite of IQ ranges for quarterly forecasts of federal, state, and local government expenditures and 1-year CPI from the Phil. Fed Survey of Forecasters. Weights: 1/2 News-based, 1/6 tax expirations, 1/6 CPI disagreement, 1/6 expenditures disagreement after each index normalized to have a standard-deviation of 1. Data from Jan 1985-Mar 2013. Index normalized mean 100 from 1985-2009. Data at www.policyuncertainty.com
Polic
y U
ncer
tain
ty In
dex Gulf
War I 9/11
Clinton Election
Gulf War II Bush
Election Balanced Budget
Act
Lehman and
TARP
Large interest
rate cuts, Stimulus
Ongoing Banking
Crisis
Debt Ceiling Dispute; Euro Debt
Russian Crisis/LTCM
Black Monday
Obama Election
Fisc
al C
liff
2010 Midterm Elections

50
100
150
200
250
300
New
s-B
ased
Pol
icy
Unc
erta
inty
Inde
x
Gulf War I
9/11
Clinton Election
Gulf War II
Bush Election
Stimulus Debate
Lehman and
TARP
Euro Crisis and 2010 Midterms
Notes: The news-based EPU Index reflects scaled monthly counts of articles containing ‘uncertain’ or ‘uncertainty’, ‘economic’ or ‘economy’, and one or more policy relevant terms: ‘regulation’, ‘federal reserve’, ‘deficit’, ‘congress’, ‘legislation’, and ‘white house’. The series is normalized to mean 100 from 1985-2009 and based on queries run on 4 April 4 2013 for the following newspapers: USA Today, Miami Herald, Chicago Tribune, Washington Post, LA Times, Boston Globe, SF Chronicle, Dallas Morning News, NY Times, and the Wall Street Journal.
Russian Crisis/LTCM
Debt Ceiling;
Euro Debt
Black Monday
Figure 2: News-Based Economic Policy Uncertainty Index (Jan 1985 – Mar 2013)
Fisc
al C
liff Obama
Election

Figure 3: Federal Tax Code Expirations Index, 1991-2013
Notes: Based on Congressional Budget Office data on projected revenue effects of federal tax code provisions set to expire in the current calendar year and next ten years. For a given year, the index value is calculated as the discounted sum of projected revenue effects associated with expiring tax code provisions, using a discount factor of 0.5^T applied to future revenue effects for T=0,1,…10 years. Index normalized to a mean of 100 before 2010.
Fede
ral T
ax C
ode
Expi
ratio
n In
dex
0 50
0 10
00
1500
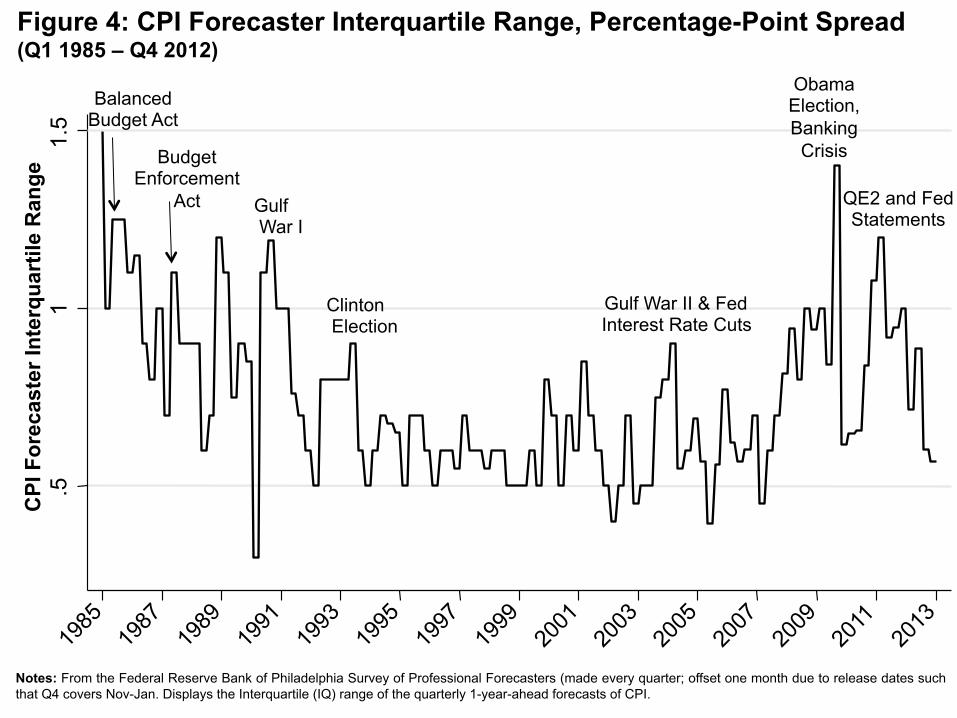
.5
1 1.
5
Gulf War II & Fed Interest Rate Cuts
Gulf War I
Clinton Election
Budget Enforcement
Act
Obama Election, Banking
Crisis
Balanced Budget Act
Figure 4: CPI Forecaster Interquartile Range, Percentage-Point Spread (Q1 1985 – Q4 2012)
Notes: From the Federal Reserve Bank of Philadelphia Survey of Professional Forecasters (made every quarter; offset one month due to release dates such that Q4 covers Nov-Jan. Displays the Interquartile (IQ) range of the quarterly 1-year-ahead forecasts of CPI.
CPI
For
ecas
ter I
nter
quar
tile
Ran
ge
QE2 and Fed Statements

0 .0
05
.01
.015
.0
2 .0
25
IQR
of G
over
nmen
t Pur
chas
es F
orec
asts
, % o
f GD
P
Notes: Based on data from the Federal Reserve Bank of Philadelphia Survey of Professional Forecasters. We compute the interquartile range (IQR) of 1-year ahead forecasts of government purchases of goods and services and scale the IQR by the median forecast. We carry out these calculations separately for federal purchases and state & local purchases, then aggregate using the purchases share of nominal GDP for each level of government. See the main text for additional details.
Figure 5: Interquartile Range of Government Purchases Forecasts, Q1 1985 – Q2 2013
Balanced Budget Act
Clinton Election
9/11
Budget Enforcement Act
Obama Election, Banking
Crisis
Debt Ceiling Dispute
Gulf War II

Notes: Index composed of a News-Based Index (0.5 weight), and country-level components measuring forecaster disagreement about inflation rates and federal government budget balance (each 0.25 weight). News-Based component composed of the monthly number of news articles containing uncertain or uncertainty, economic or economy, as well as policy relevant terms (scaled by the smoothed number of articles containing ‘today’). Policy relevant terms include: ‘policy’, ‘tax’, ‘spending’, ‘regulation’, ‘central bank’, ‘budget’, and ‘deficit’. Series is normalized to mean 100 from 1997-2010. Index covers Jan 1997 – Nov 2012. Papers include El Pais, El Mundo, Corriere della Sera, La Repubblica, Le Monde, Le Figaro, Financial Times, The Times, Handelsblatt, FAZ. All searches done in the native language of the paper in question.
Euro
pean
Pol
icy
Unc
erta
inty
Inde
x Figure 6: European Policy Uncertainty Index (Jan 1997 – Nov 2012)
50
100
150
200
9/11 Treaty of Accession and
Gulf War II
Russian Crisis/LTCM Asian
Crisis
Papandreou calls for
referendum; later resigns
Italy Rating Cut
French and Dutch Voters Reject European Constitution
Lehman Bros.
Greek Bailout Request, Rating
Cuts
Northern Rock & Ensuing Financial Turmoil
Nice Treaty Referendum
Ongoing Eurozone
Debt Concerns German Elections

0 20
0 40
0 60
0 Figure 7: News-based index of equity market uncertainty compared to market-based VIX, January 1990 to December 2012
Notes: The news-based index of equity market uncertainty is based on the count of articles that reference ‘economy’ or ‘economic’, and ‘uncertain’ or ‘uncertainty” and one of ‘stock price’, ‘equity price’, or ‘stock market’ in 10 major U.S. newspapers, scaled by the number of articles in each month and paper. The news-based index and the VIX are normalized to a mean of 100 over sthe period.
Correlation=0.733
Monthly News-Based
Index of Equity Market Uncertainty
Monthly Average of Daily VIX Values
42#
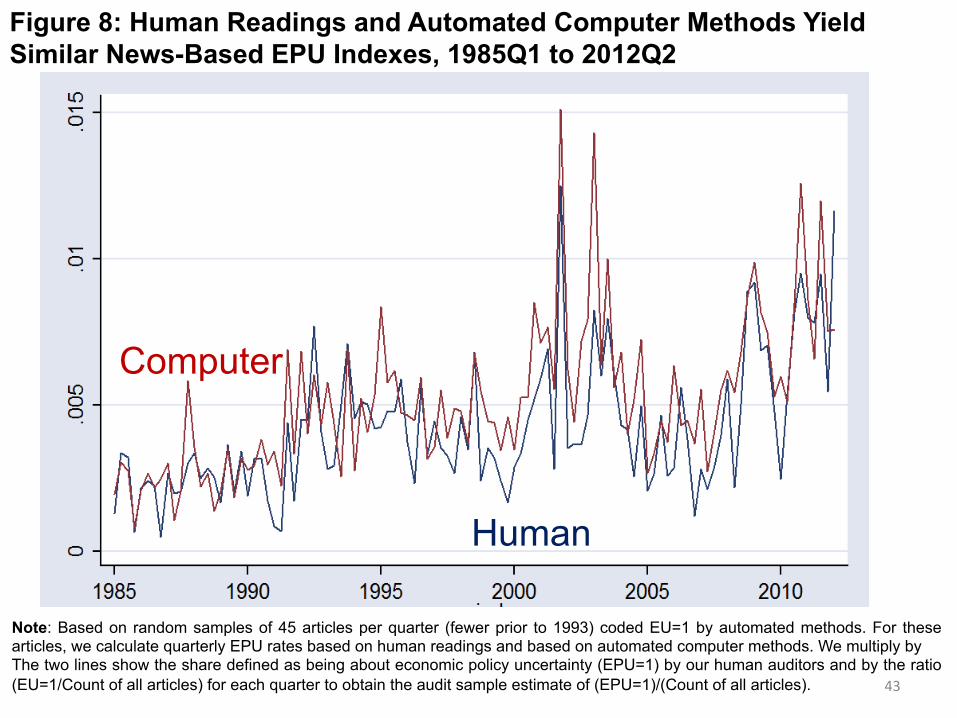
Figure 8: Human Readings and Automated Computer Methods Yield Similar News-Based EPU Indexes, 1985Q1 to 2012Q2
Note: Based on random samples of 45 articles per quarter (fewer prior to 1993) coded EU=1 by automated methods. For these articles, we calculate quarterly EPU rates based on human readings and based on automated computer methods. We multiply by The two lines show the share defined as being about economic policy uncertainty (EPU=1) by our human auditors and by the ratio (EU=1/Count of all articles) for each quarter to obtain the audit sample estimate of (EPU=1)/(Count of all articles).
Computer
Human
43#

Figure 9: Political slant plays little role in our news-based EPU index
Source: Papers sorted into 5 most ‘Republican’ and 5 most ‘Democratic’ groups using the media slant measure from Gentzkow and Shapiro (2010).
0 10
0 20
0 30
0 40
0
1985 1990 1995 2000 2005 2010
Reagan, Bush I Bush II Clinton
Obama
5 most Republican papers
5 most Democrat papers
44#
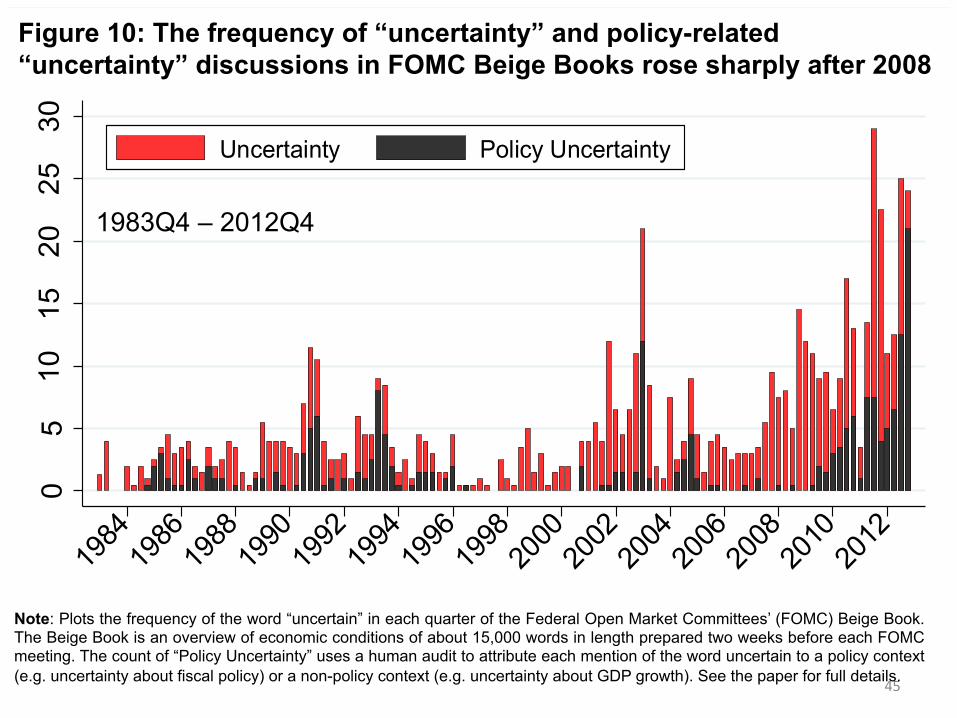
05
1015
2025
30
1984
1986
1988
1990
1992
1994
1996
1998
2000
2002
2004
2006
2008
2010
2012
Uncertainty Policy Uncertainty
45#
Figure 10: The frequency of “uncertainty” and policy-related “uncertainty” discussions in FOMC Beige Books rose sharply after 2008
Note: Plots the frequency of the word “uncertain” in each quarter of the Federal Open Market Committees’ (FOMC) Beige Book. The Beige Book is an overview of economic conditions of about 15,000 words in length prepared two weeks before each FOMC meeting. The count of “Policy Uncertainty” uses a human audit to attribute each mention of the word uncertain to a policy context (e.g. uncertainty about fiscal policy) or a non-policy context (e.g. uncertainty about GDP growth). See the paper for full details.
1983Q4 – 2012Q4

10
20
30
40
50
60
VIX
(red
)
50
100
150
200
250
Econ
omic
Pol
icy
Unc
erta
inty
Inde
x (B
lue)
1990 1992 1994 1996 1998 2000 2002 2004 2006 2008 2010 2012
9/11
WorldCom & Enron
Gulf War II
Credit Crunch
Asian crisis
Gulf War I
Obama Election, Banking Crisis
Debt Ceiling
LTCM default
Large interest
rate cuts
Clinton election
Source: www.policyuncertainty.com. Data until October 2012
Figure 11: U.S. Economic Policy Uncertainty and the VIX
46#
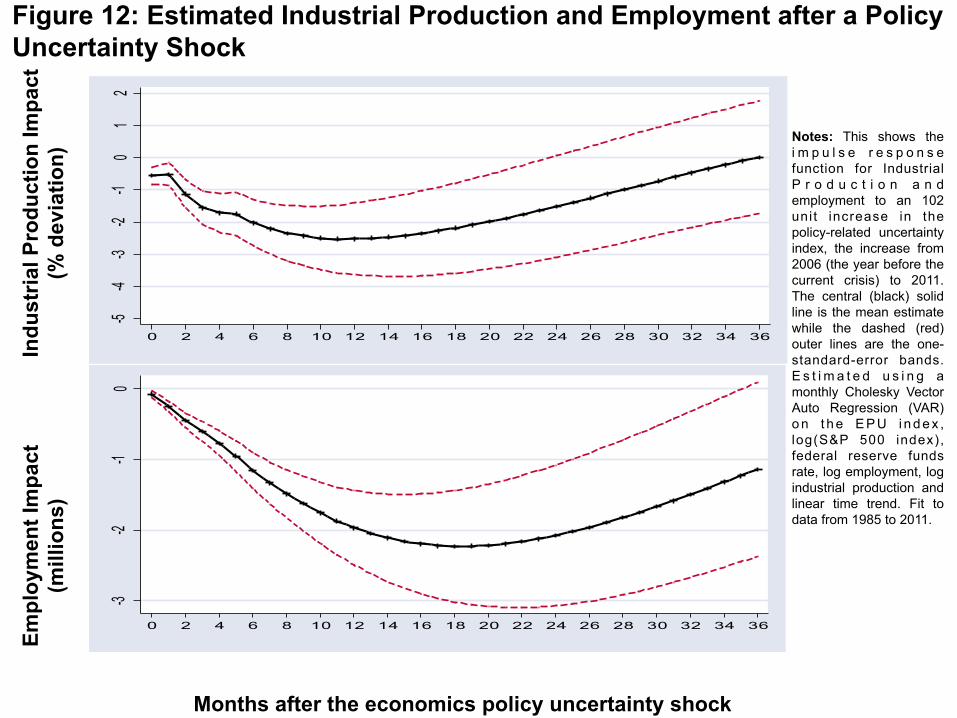
Figure 12: Estimated Industrial Production and Employment after a Policy Uncertainty Shock
Indu
stria
l Pro
duct
ion
Impa
ct
(% d
evia
tion)
Months after the economics policy uncertainty shock
Notes: This shows the i m p u l s e r e s p o n s e function for Industrial P r o d u c t i o n a n d employment to an 102 unit increase in the policy-related uncertainty index, the increase from 2006 (the year before the current crisis) to 2011. The central (black) solid line is the mean estimate while the dashed (red) outer lines are the one-standard-error bands. E s t i m a t e d u s i n g a monthly Cholesky Vector Auto Regression (VAR) o n t h e E P U i n d e x , log(S&P 500 index), federal reserve funds rate, log employment, log industrial production and linear time trend. Fit to data from 1985 to 2011.
Empl
oym
ent I
mpa
ct
(mill
ions
)
-5-4
-3-2
-10
12
0 2 4 6 8 10 12 14 16 18 20 22 24 26 28 30 32 34 36
-3-2
-10
0 2 4 6 8 10 12 14 16 18 20 22 24 26 28 30 32 34 36

-4-3
-2-1
0
Est
imat
ed im
pact
on
indu
stria
l pro
duct
ion
0 5 10 15 20 25 30 35
Figure 13: Robustness of Estimates to Different VAR Specifications
Months after the policy uncertainty shock Notes: This shows the impulse response function for GDP and employment to an 102 unit increase in the policy-related uncertainty index. Estimated using a monthly Cholesky Vector Auto Regression (VAR) of the uncertainty index, log(S&P 500 index), federal reserve funds rate, log employment, log industrial production and time trend unless otherwise specified. Data from 1985 to 2011.
Indu
stria
l Pro
duct
ion
Impa
ct
(% d
evia
tion)
Baseline
Bivariate (uncertainty and log industrial production)
Three months of lags
Nine months of lags
Uncertainty index has equal weight
on measures Adding VIX and putting it first

0 10
0 20
0 30
0 40
0
1900 1910 1920 1930 1940 1950 1960 1970 1980 1990 2000 2010
Figure 14: The policy uncertainty news index extended back to 1900
Notes: Index of Policy-Related Economic Uncertainty composed of quarterly news articles containing uncertain or uncertainty, economic or economy or business or commerce, and policy relevant terms (scaled by the smoothed total number of articles) in 6 newspapers (WP, BG, LAT, NYT, WSJ and CHT). Data normalized to 100 from 1900-2011.
Polic
y U
ncer
tain
ty In
dex
US WWI Entry
9/11 and Gulf War II
Debt Ceiling
OPEC II
Lehman and TARP
Hoover Policy Activism in 1932 and Roosevelt Election
Post-War Strikes,
Recession
Great Depression Relapse
Gulf War I
Black Monday
Panic of 1907
Founding Of Fed
OPEC I
Asian Fin. Crisis
Watergate
Reagan Calls For Domestic Spending Freeze

.25
.3
.35
.4
.45
0 10
0 20
0 30
0
1950 1960 1970 1980 1990 2000 2010
Polic
y U
ncer
tain
ty
Gov
ernm
ent e
xpen
ditu
re a
s sh
are
of G
DP
Notes: Index of Policy-Related Economic Uncertainty composed of quarterly news articles containing uncertain or uncertainty, economic or economy, and policy relevant terms (scaled by the smoothed total number of articles) in 6 newspapers (WP, BG, LAT, NYT, WSJ and CHT). Data normalized to 100 from Jan 1900-Dec 2011. Government expenditure is total federal, state, and local expenditures over GDP, annually.
Figure 15: Policy uncertainty and government expenditure share of GDP

Polic
y U
ncer
tain
ty In
dex
Appendix Figure A1: Baseline EPU Index, Equal-Weighted EPU Index, PCF-Weighted EPU Index
Notes: Index of Policy-Related Economic Uncertainty composed of 4 series: monthly news articles containing uncertain or uncertainty from 10 leading papers, economic or economy, and policy relevant terms (scaled by the total number of articles); the number and size of tax laws expiring in coming years, and a composite of IQ ranges for quarterly forecasts of federal, state, and local government expenditures and 1-year CPI from the Phil. Fed Survey of Forecasters. PCF Weights: .22 News, .27 tax expirations, .29 CPI disagreement, .21 Fed, State, and Local purchases. Equal-Weighted Index weights: .33 News, .33 tax expirations, .167 CPI disagreement, .167 Fed. expenditures after each index normalized to have a standard-deviation of 1. News query run Dec 4, 2012. Index normalized mean 100 from 1985-2009.
50
100
150
200
250
1985 1990 1995 2000 2005 2010
Baseline Index (blue solid line)
PCF-Weighted Index (green dashed line)
Equal-Weighted Index (red dot-dash line)
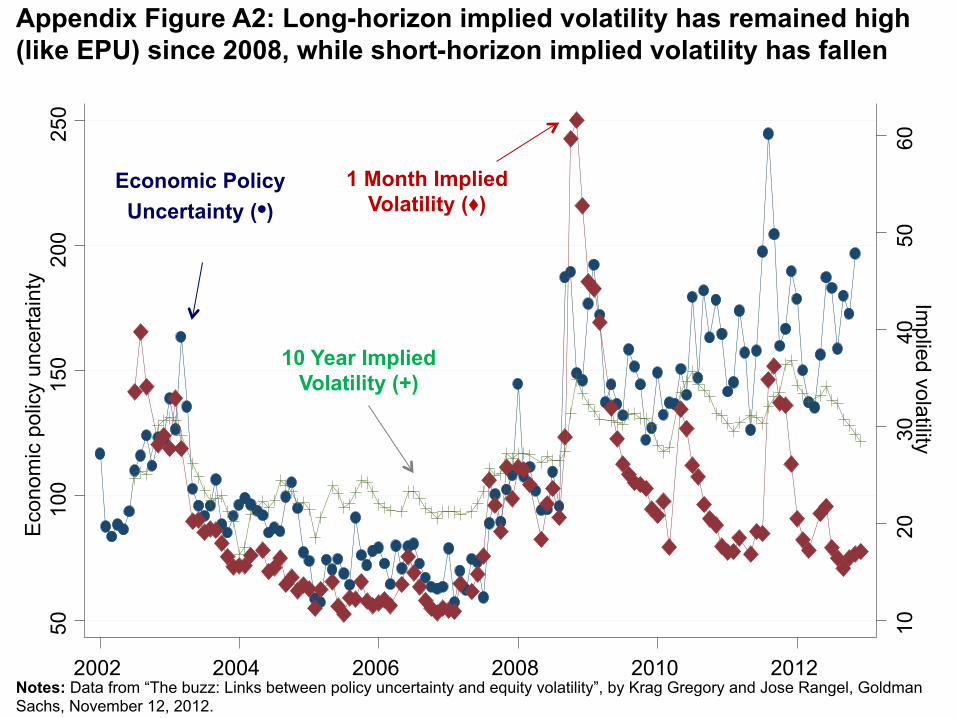
Notes: Data from “The buzz: Links between policy uncertainty and equity volatility”, by Krag Gregory and Jose Rangel, Goldman Sachs, November 12, 2012.
Appendix Figure A2: Long-horizon implied volatility has remained high (like EPU) since 2008, while short-horizon implied volatility has fallen
Correlation EPU and 1 month=0.578 Correlation EPU and 10 years=0.855
10
20
30
40
50
60
50
100
150
200
250
Eco
nom
ic p
olic
y un
certa
inty
2002 2004 2006 2008 2010 2012
Implied volatility
1 Month Implied Volatility (♦)
10 Year Implied Volatility (+)
Economic Policy Uncertainty (•)

0 10
0 20
0 30
0
1900 1910 1920 1930 1940 1950 1960 1970 1980 1990 2000 2010
Figure A3: Policy uncertainty index normalized by the “economic” index
Notes: Index of Policy-Related Economic Uncertainty composed of quarterly news articles containing uncertain or uncertainty, economic or economy or business or commerce, and policy relevant terms in 6 newspapers (WP, BG, LAT, NYT, WSJ and CHT). This is normalized by the frequency of the words economic or economy or business or commerce to control for potential changes in business coverage in the media. Data normalized to 100 from 1900-2011.
Polic
y U
ncer
tain
ty In
dex US WWI
Entry
9/11 and Gulf War II
Debt Ceiling
OPEC II
Lehman and TARP
Hoover Policy Activism in 1932 and Roosevelt Election
Post-War Strikes,
Recession
Great Depression Relapse
Gulf War I
Black Monday
Panic of 1907
Fed Creation
OPEC I
Asian Fin. Crisis
Watergate

Figure A4: Main EPU index compared with Expanded EPU
Notes: Main EPU composed of quarterly news articles containing uncertain or uncertainty, economic or economy, and policy relevant terms in 10 newspapers (SFC, USA Today, DMN, MiH, WP, BG, LAT, NYT, WSJ and CHT). Expanded EPU Index is the same but using commerce or business in addition to economic or economy. the This is normalized by the frequency of the words economic or economy or business or commerce to control for potential changes in business coverage in the media. Data normalized to 100 from 1900-2011.
Polic
y U
ncer
tain
ty In
dex
50
100
150
200
250
300
1985 1990 1995 2000 2005 2010 period
Expanded EPU Index Main EPU Index