policy uncertainty and the brexit shockfaculty.chicagobooth.edu/steven.davis/pdf/policy uncertainty...
TRANSCRIPT

Policy UncertaintyAnd the Brexit Shock
Steven J. DavisResearch with Scott Baker and Nick Bloom
US Treasury Department14 September 2016

Today’sRemarks1. ReviewofBBDapproachtomeasuring
EconomicPolicyUncertainty(EPU)2. OurnewestEPUindices3. AcloserlookattheBrexituncertainty
shockanditslikelynear-termeffects

Our Economic Policy Uncertainty Indices rely on computer-automated newspaper searches
• For 10 major US papers, get monthly counts of articles that contain at least one word from each of three term sets:E: {economic or economy}P: {regulation or deficit or “federal reserve” or congress or
legislation or “white house”}U: {uncertain or uncertainty}
Include “the Fed”, “regulatory” and other variants.
• Scale the EPU count for each paper and month by the count of all articles in the same paper and month
• Standardize each paper’s scaled count to unit St. Dev., then sum over the 10 papers by month to get the U.S monthly index 3
HowitworksfortheUnitedStates:

5010
015
020
025
030
0
1985 1990 1995 2000 2005 2010 2015
GulfWar I
9/11
ClintonElection
Gulf War IIBush
Election
Stimulus Debate
Lehman and TARP
Russian Crisis/LTCM
Debt Ceiling Debate
Black Monday
Fisc
al C
liff
Shu
tdow
n
Polic
y U
ncer
tain
ty In
dex
US Newspaper-Based EPU Index, 1985 to Aug. 2016
Source: “Measuring Economic Policy Uncertainty” by Scott R. Baker, Nicholas Bloom and Steven J. Davis, all data at www.policyuncertainty.com. Monthly data normalized to 100 prior to 2010. Data to August 2016
Bre
xit
Euro Crisis, and Midterm Elections

MoreNewspaper-BasedEPUIndices• U.S.category-specificEPUindices• MonthlyEPUindicesfor15countries• HistoricalEPUindicesbackto1900fortheUSandtheUK
• DailyEPUindicesfortheUSandUK• DailyEquityMarketUncertaintyindex• ImmigrationFearandPolicyUncertaintyindicesfortheUS,France,Germany,UK
Downloadableandregularlyupdatedathttp://www.policyuncertainty.com

Selected category-specific EPU Indices, Quarterly0
100
200
300
400
1985 1990 1995 2000 2005 2010 2015Year
National Security Policy UncertaintyHealthcare Policy Uncertainty
Notes: Indices reflect scaled monthly counts of articles containing the same triple as in Figure 1 and one or more terms pertaining tonational security (e.g., “war”, “terrorism”, or “department of defense”) and healthcare (e.g., “healthcare”, “hospital”, or “healthinsurance”), respectively, for the National Security and Healthcare indices. Each series is normalized to mean 100 from 1985-2009 andbased on queries run Jan 18, 2015 on Access World News Newsbank newspaper archive,which covers about1,500 US papers.
Inde
x Va
lue
Gulf War I
Gulf War II
9/11Clinton healthcare reform effort
Affordable care act

NewEPUStatisticalProducts
• Australia,monthly• Brazil,monthly• Global,monthly• UnitedKingdom,daily

EconomicPolicyUncertaintyIndexforAustralia,1998toApril20160
100
200
300
400
1998 2002 2006 2010 2014
Russian Economic Crisis, Close Australian Election FoughtOver GSTIntroduction
9/11Attacks
Invasion of Iraq
Labor Party Wins in
Landslide
Lehman Failure,Global
FinancialCrisis
Fiscal AndMiningPolicyUncertainty,EurozoneConcerns
U.S. Debt
Ceiling Dispute
Rudd Ousts Gillard as Labor Leader and PM
Greek Debt Crisis,Mining Tax &
Carbon Policy Uncertainty
Notes: Index reflects scaled monthly counts of articles in eight Australian newspapers containing “uncertain” or “uncertainty”,“economic” or “economy”, and one or more policy-relevant terms: regulation, “Reserve Bank of Australia”, RBA, deficit, tax, taxation,taxes, parliament, senate, "cash rate", legislation, tariff, war. Normalized to a mean of 100 from 1998 to 2013. Index methods follow“Measuring Economic Policy Uncertainty” by Baker, Bloom and Davis. Data available atwww.PolicyUncertainty.com.
010
020
030
040
050
0Po
licy
Unc
erta
inty
Inde
x
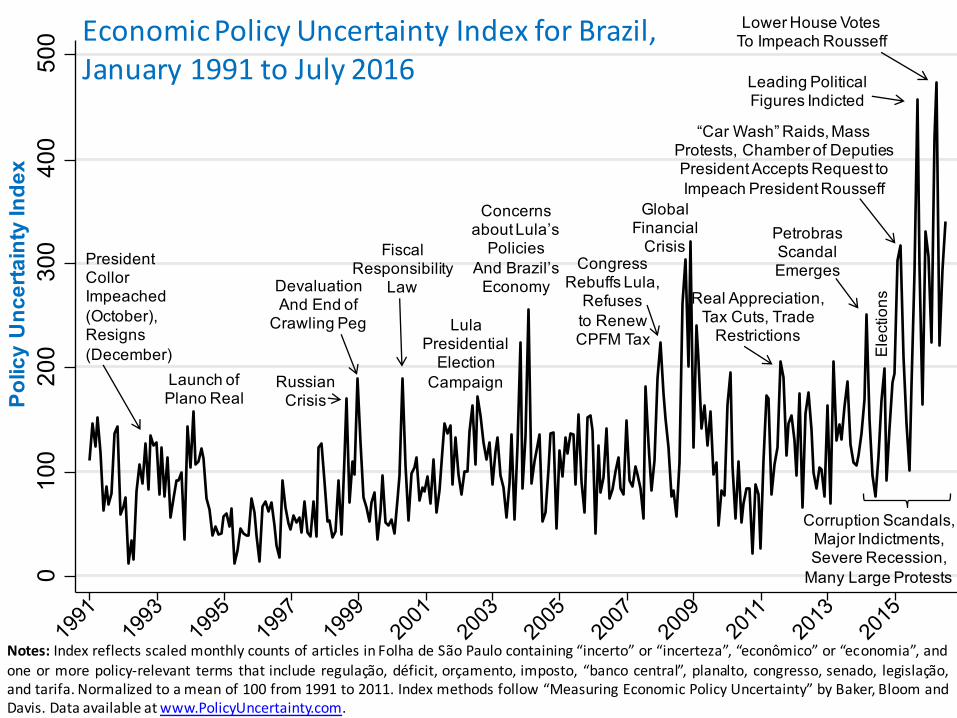
Notes: Index reflects scaled monthly counts of articles in Folha de São Paulo containing “incerto” or “incerteza”, “econômico” or “economia”, andone or more policy-relevant terms that include regulação, déficit, orçamento, imposto, “banco central”, planalto, congresso, senado, legislação,and tarifa. Normalized to amean of 100 from 1991 to 2011. Index methods follow “Measuring Economic Policy Uncertainty” by Baker, Bloom andDavis. Data available atwww.PolicyUncertainty.com.
President CollorImpeached (October), Resigns (December)
Launch ofPlano Real
Russian Crisis
DevaluationAnd End of
Crawling Peg
Fiscal Responsibility
Law
Lula Presidential
ElectionCampaign
Concerns about Lula’s
Policies And Brazil’s
EconomyCongress
Rebuffs Lula, Refuses to Renew CPFM Tax
Lower House Votes To Impeach Rousseff
“Car Wash” Raids, Mass Protests, Chamber of Deputies President Accepts Request to Impeach President Rousseff
Leading Political Figures Indicted
Corruption Scandals, Major Indictments, Severe Recession,
Many Large Protests
Elec
tions
Petrobras Scandal Emerges
Global Financial
Crisis
Real Appreciation, Tax Cuts, Trade
Restrictions
EconomicPolicyUncertaintyIndexforBrazil,January1991toJuly2016

GlobalEPUIndex,January1997toAugust2016
10
25
75
125
175
225
275
1997 1998 1999 2000 2001 2002 2003 2004 2005 2006 2007 2008 2009 2010 2011 2012 2013 2014 2015 2016
GlobalEPU,CurrentPricesGDP
GlobalEPU,PPP-AdjustedGDP
Notes: GlobalEPUcalculated astheGDP-weightedaverageofmonthlyEPUindexvaluesfor the US,Canada,Brazil,UK,Germany,Italy,Spain,France,Netherlands, Russia,India,China,SouthKorea,Japan andAustralia,usingGDPdatafrom theIMF’sWorldEconomicOutlookDatabase. Thecountry-levelEPUindexvaluesarefromwww.PolicyUncertainty.com and"Measuring EconomicPolicyUncertainty" byBaker,BloomandDavis. Eachcountry-levelEPUIndexisrenormalizedtoameanof100from1997to2015beforecalculating theGlobalEPUIndex.
Asian&RussianFinancialCrises
9/11GulfWarII
GlobalFinancialCrisis
EurozoneCrises,U.S.FiscalFights,ChinaLeadership
Transition
Brexit

TheBrexitUncertaintyShock
• Asurprisereferendumoutcome• IttriggeredahugespikeinUKEPU• GlobalEPUreverberations• ButconcernsaboutBrexit-relateduncertaintyhaveabatedrapidly,atleastaccordingtoourindices

TheBrexitShockandItsImmediateWake,DailyData
12
1.2
1.25
1.3
1.35
1.4
1.45
1.5
1.55
1.6
1.65
0
500
1000
1500
2000
2500
3000
1 3 5 7 9 11 13 15 17 19 21 23 25 27 29 1 3 5 7 9 11 13 15 17 19 21 23 25 27 29 31
June July
UKDailyEPUIndex(LeftScale)1+LeaveVictoryProbabilityDollar-Pound ExchangeRateNormalizedFTSE250
LeavevictoryprobabilitydatafromOddschecker; FTSE250andPound-Dollarexchangerate fromBloomberg; DailyEPUIndicesfromwww.PolicyUncertainty.com and"Measuring EconomicPolicyUncertainty"byBaker,BloomandDavis.
ABigSurprise!!

TheBrexitShockandItsImmediateWake,DailyData
13
1.2
1.25
1.3
1.35
1.4
1.45
1.5
1.55
1.6
1.65
0
500
1000
1500
2000
2500
3000
1 3 5 7 9 11 13 15 17 19 21 23 25 27 29 1 3 5 7 9 11 13 15 17 19 21 23 25 27 29 31
June July
UKDailyEPUIndex(LeftScale)1+LeaveVictoryProbabilityDollar-Pound ExchangeRateNormalizedFTSE250
LeavevictoryprobabilitydatafromOddschecker; FTSE250andPound-Dollarexchangerate fromBloomberg; DailyEPUIndicesfromwww.PolicyUncertainty.com and"Measuring EconomicPolicyUncertainty"byBaker,BloomandDavis.
MassiveSurgeInUKEPU!!
ABigSurprise!!

TheBrexitShockandItsImmediateWake,DailyData
14
1.2
1.25
1.3
1.35
1.4
1.45
1.5
1.55
1.6
1.65
0
500
1000
1500
2000
2500
3000
1 3 5 7 9 11 13 15 17 19 21 23 25 27 29 1 3 5 7 9 11 13 15 17 19 21 23 25 27 29 31
June July
LeavevictoryprobabilitydatafromOddschecker; FTSE250andPound-Dollarexchangerate fromBloomberg; DailyEPUIndicesfromwww.PolicyUncertainty.com and"Measuring EconomicPolicyUncertainty"byBaker,BloomandDavis.
ButEPUSurgeLargelyReverseswithin2Weeks

TheBrexitShockandItsImmediateWake,DailyData
15
1.2
1.25
1.3
1.35
1.4
1.45
1.5
1.55
1.6
1.65
0
500
1000
1500
2000
2500
3000
1 3 5 7 9 11 13 15 17 19 21 23 25 27 29 1 3 5 7 9 11 13 15 17 19 21 23 25 27 29 31
June July
UKDailyEPUIndex(LeftScale)1+LeaveVictoryProbabilityDollar-Pound ExchangeRateNormalizedFTSE250
LeavevictoryprobabilitydatafromOddschecker; FTSE250andPound-Dollarexchangerate fromBloomberg; DailyEPUIndicesfromwww.PolicyUncertainty.com and"Measuring EconomicPolicyUncertainty"byBaker,BloomandDavis.
FastRecoveryinEquityMarkets

TheBrexitShockandItsImmediateWake,DailyData
16
1.2
1.25
1.3
1.35
1.4
1.45
1.5
1.55
1.6
1.65
0
500
1000
1500
2000
2500
3000
1 3 5 7 9 11 13 15 17 19 21 23 25 27 29 1 3 5 7 9 11 13 15 17 19 21 23 25 27 29 31
June July
UKDailyEPUIndex(LeftScale)1+LeaveVictoryProbabilityDollar-Pound ExchangeRateNormalizedFTSE250
LeavevictoryprobabilitydatafromOddschecker; FTSE250andPound-Dollarexchangerate fromBloomberg; DailyEPUIndicesfromwww.PolicyUncertainty.com and"Measuring EconomicPolicyUncertainty"byBaker,BloomandDavis.
LargeDepreciationInPoundPersists

USDailyEPUIndexTheDailyUSEPUIndexdrawsonhundredsofnewspapersandislessnoisythantheDailyUKEPUIndex.
SmallerresponseforUSEPU,butsamepattern:Largeimpacteffectofsurprisereferendumoutcome,followedbyrapiddissipation.NoapparentEPUeffectbeyondthefirstthreeorfourweeks.

GlobalEPUIndex,January1997toAugust2016
18
25
75
125
175
225
275
1997 1998 1999 2000 2001 2002 2003 2004 2005 2006 2007 2008 2009 2010 2011 2012 2013 2014 2015 2016
GlobalEPU,CurrentPricesGDP
GlobalEPU,PPP-AdjustedGDP
Notes: GlobalEPUcalculated astheGDP-weightedaverageofmonthlyEPUindexvaluesfor the US,Canada,Brazil,UK,Germany,Italy,Spain,France,Netherlands, Russia,India,China,SouthKorea,Japan andAustralia,usingGDPdatafrom theIMF’sWorldEconomicOutlookDatabase. Thecountry-levelEPUindexvaluesarefromwww.PolicyUncertainty.com and"Measuring EconomicPolicyUncertainty" byBaker,BloomandDavis. Eachcountry-levelEPUIndexisrenormalizedtoameanof100from1997to2015beforecalculating theGlobalEPUIndex.
Globalindextellsthesamestory:Largeimpacteffect,rapidreturntopre-Brexitlevel

UKMonthlyEPUIndex,January2005toAugust2016
0
200
400
600
800
1000
1200
2005 2006 2007 2008 2009 2010 2011 2012 2013 2014 2015 2016
March
June
July
August
UKMonthlyIndex:Again,thesamestory.

BBD Time-Series Approach
• Include Monthly EPU Indices in Vector Autoregressive (VAR) statistical models of the sort that macroeconomists routinely use to characterize dynamic co-movements in aggregate data.
• Fit to monthly and quarterly data for the United States and to a dozen countries in a panel VAR.
• Examine Impulse Response Functions to EPU innovations implied by Cholesky orderings.
• Main Question: What do EPU innovations portend for future movements in output growth, investment rates, employment growth, etc.?
20

-.6-.4
-.20
.2
0 6 12 18 24 30 36Months
-2-1
01
0 6 12 18 24 30 36Months
Figure 8: Industrial Production and Employment Responses to EPU Shock,VAR Fit to Monthly U.S. Data
IP R
espo
nse,
%
Notes: VAR-estimatedimpulse responsefunctions for industrialproduction andemployment to an EPUinnovation equal to theincrease in the EPUindex from its 2005-2006to its 2011-2012 averagevalue, with 90 percentconfidence bands.Identification based onthree lags and aCholesky decompositionwith the followingordering: EPU index,log(S&P 500 index),federal reserve fundsrate, log employment,log industrial production.Fit to monthly data from1985 to 2014.
Empl
oym
ent R
espo
nse,
%

-1.5
-1-.5
0.5
0 6 12 18 24 30 36Months
Figure 9: U.S. Industrial Production Response to an EPU Shock,Alternative Samples, Specifications and Identification Assumptions
Notes: The baseline case involves the same sample period, VAR specification and identification as in Figure 8. The other casesdepart from the baseline as indicated. We place EU and VIX after EPU in the ordering. For the “1920-1984” response function, weuse monthly data from 1920 to 1984 on log industrial production and EPU in a bivariate VAR with EPU ordered first.
Indu
stria
l Pro
duct
ion
Res
pons
e, %
Baseline(+ symbols)
Bivariate: EPU and logindustrial production
Six monthsof lags
1920-1984Sample
Adding EU
Adding VIX
Reverse bivariate: log industrial production, EPU
Adding a time trend
No S&P index

Figure 10: Responses to an EPU Shock in a Twelve-Country Panel VARIn
dust
rial P
rodu
ctio
n, %
Months after EPU shock
Notes: Panel-VAR estimatedimpulse response functionsfor industrial production andunemployment to an EPUinnovation equal to theincrease in the average USEPU value from 2005-2006 to2011-2012, with 90%confidence bands.Identification based on threelags and a Choleskydecomposition with thefollowing ordering: EPUindex, log(stock marketindex), unemployment rate,and log industrial production.We use own-country data anda full set of country fixed-effects in the panel VAR.Country-level data areweighted by the square rootof the number of newspapersused in the EPU index. Fit tomonthly data for Canada,China, France, Germany,India, Italy, Japan, Korea,Russia, Spain, UK and theUS from January 1985 toDecember 2014, whereavailable.
Une
mpl
oym
ent R
ate
Res
pons
e -1
.5-1
-.50
0 6 12 18 24 30 36
0.1
.2.3
.4
0 6 12 18 24 30 36

UKMonthlyEPUIndex,January
0
200
400
600
800
1000
1200
2005 2006 2007 2008 2009 2010 2011 2012 2013 2014 2015 2016
March
June
JulyWhatsizeEPUinnovationintheVARmodelcorrespondstotheBrexituncertaintyshock?Unclear.IfUKEPUsettlesdowntoabout250fortherestof2016,theaveragevaluein2016willbeabout200pointshigherthanin2015.
That’sabouttwiceaslargeastheUSEPUincreasefrom2005-06to2011-12,whichisthesizeoftheimpulseweusedtogeneratetheresponsefunctionschartedIntheprecedingslides.
August

(Really) Crude Quantitative Assessment
- Treat the Brexit uncertainty shock as being twice as large as the EPU innovation that BBD used to generate their IRFs.
- For industrial production, they found a peak negative effect of about 1 log point after 6-12 months.
- Doubling yields a peak negative effect of about 2 log points- The large pound depreciation triggered by the Brexit
referendum outcome may mute this effect. (BBD did not account for the exchange rate channel.)
- GDP is typically less sensitive to shocks than IP, so it’s reasonable to anticipate a somewhat smaller GDP effect –perhaps with a peak effect in the range of -1 log point.
- This estimate seems high, perhaps because it does not fully reflect the aggressive BOE response to the referendum

Summary1. Brexit referendum outcome was a big surprise and a
massive shock to UK EPU, with global reverberations.2. But (concerns about) Brexit-related uncertainty dissipated
very rapidly, according to our EPU indices.3. The British Pound fell more than 10% against the US Dollar
in wake of Brexit referendum, and it remains down. 4. Equity markets, however, rebounded within a few weeks.5. Quantifying the likely near-term output effects of Brexit is
really, really hard – at least for us.6. For industrial production, our VAR models suggest a peak
negative effect of Brexit uncertainty shock of about minus 2 log points 6-12 months later.
7. Best guess for peak GDP response is about -1 log point, after considering less volatile nature of GDP, muting effect of Pound depreciation and aggressive BOE response.

Our Data Are Online at www.PolicyUncertainty.com
• MonthlyEPUindicesfor15countries,includingallG10economies,withmorecountriesintheworks.Regularupdatesinthefirstfewdaysofeachmonth.
• HistoricalEPUindicesbackto1900fortheUnitedStatesandUnitedKingdom• DailyEPUindicesfortheUSandUK,withdailyupdates• Manycategory-specificEPUindicesbackto1985fortheUnitedStates• SpecialU.S.tabulationsfor“governmentshutdown”and“debtceiling”• SpecialU.K.tabulationsforBrexit-relatedEPU.• Dailynewspaper-basedindexofequitymarketuncertaintybackto1985• Migration-relatedFearandPolicyUncertaintyIndicesforFrance,Germany,the
U.K.,andtheU.S.

ReferencesBaker, Bloom, Canes-Wrone, Davis and Rodden, 2014. “Why Has
U.S. Policy Uncertainty Risen Since 1960?” American Economic Review Papers & Proceedings, May 2014.
Baker, Bloom and Davis, 2012. “Has Economic Policy Uncertainty Hampered the Recovery?” in Government Policies and the Delayed Economic Recovery, edited by Lee Ohanian, John B. Taylor and Ian Wright, Hoover Institution Press.
Baker, Bloom and Davis, 2015. “Immigration Fears and Policy Uncertainty,” with Scott Baker and Nicholas Bloom, VoxEU, http://www.voxeu.org/article/immigration-fears-and-policy-uncertainty.
Baker, Bloom and Davis, 2016. Measuring Economic Policy Uncertainty,” NBER Working Paper No. 21633, revised in March 2016. Forthcoming in the Quarterly Journal of Economics.
Davis, 2015. “Regulatory Complexity and Policy Uncertainty: Headwinds of Our Own Making,” Hoover Institution.
Thesepapersandmoreavailableathttp://www.policyuncertainty.com/research.html.

Additional Slides –Not for Prepared Remarks
30
020
040
060
0Fi
nanc
ial R
egula
tion
Unce
rtaint
y
1985 1990 1995 2000 2005 2010 2015Year
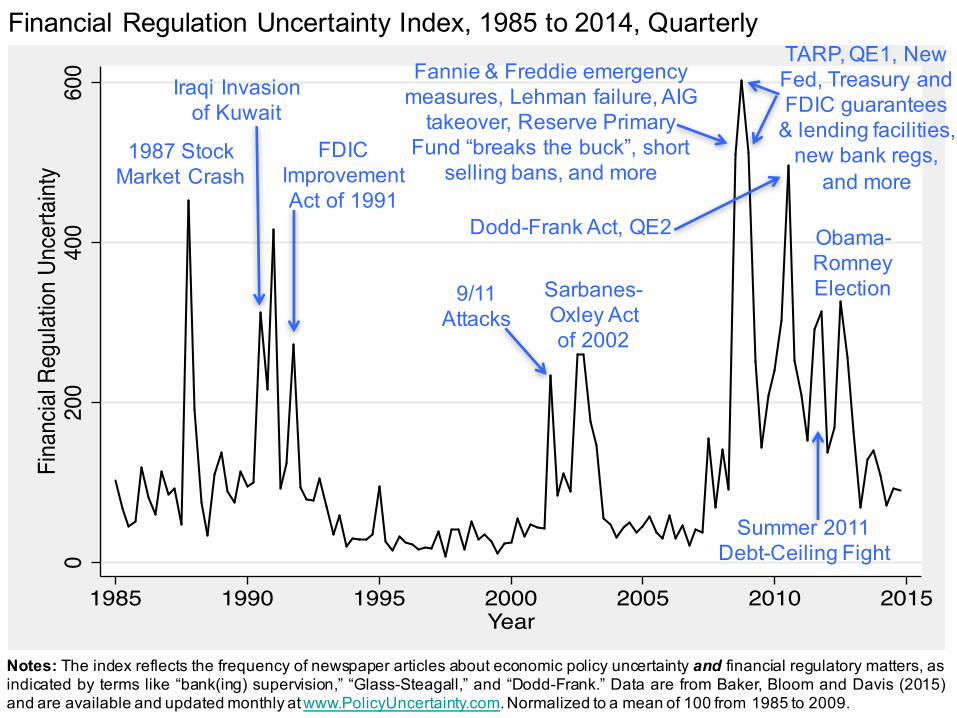
Financial Regulation Uncertainty Index, 1985 to 2014, Quarterly
Notes: The index reflects the frequency of newspaper articles about economic policy uncertainty and financial regulatory matters, asindicated by terms like “bank(ing) supervision,” “Glass-Steagall,” and “Dodd-Frank.” Data are from Baker, Bloom and Davis (2015)and are available and updated monthly atwww.PolicyUncertainty.com.Normalized to a mean of 100 from 1985 to 2009.
1987 Stock Market Crash
Iraqi Invasion of Kuwait
FDIC ImprovementAct of 1991
Sarbanes-Oxley Act of 2002
9/11Attacks
Fannie & Freddie emergency measures, Lehman failure, AIG
takeover, Reserve Primary Fund “breaks the buck”, short
selling bans, and more
TARP, QE1, New Fed, Treasury and FDIC guarantees
& lending facilities, new bank regs,
and more
Dodd-Frank Act, QE2
Summer 2011 Debt-Ceiling Fight
Obama-Romney Election

-8-6
-4-2
0
0 6 12Quarters
-2-1
.5-1
-.50
0 6 12Quarters
USVARforImpactonGDPandInvestment(quarterly)G
DP
Res
pons
e, %
Notes: VAR-estimatedimpulse responsefunctions for GDP andGross Fixedinvestment to an EPUinnovation equal to theincrease in the EPUindex from its 2005-2006 to its 2011-2012average value, with 90percent confidencebands. Identificationbased on three lagsand a Choleskydecomposition with thefollowing ordering:EPU index, log(S&P500 index), federalreserve funds rate, loggross investment, loggross domesticproduct). Fit to datafrom 195 to 2014.
Inve
stm
ent R
espo
nse,
%