policy uncertainty in japan - booth school of...
TRANSCRIPT

Policy Uncertainty in Japan
By Elif C. Arbatli, Steven J. Davis, Arata Ito, Naoko Miake and Ikuo Saito1
21 April 2017
Abstract We develop new economic policy uncertainty (EPU) indices for Japan from January 1987 onwardsbuilding on the approach of Baker, Bloom and Davis (2016). Each index reflects the frequency of newspaper articles that contain certain terms pertaining to the economy, policy matters and uncertainty. Our overall EPU index co-varies positively with implied volatilities for Japanese equities, exchange rates and interest rates and with a survey-based measure of political uncertainty. The EPU index rises around contested national elections and major leadership transitions in Japan, during the Asian Financial Crisis and in reaction to the Lehman Brothers failure, U.S. debt downgrade in 2011, Brexit referendum, and Japan’s recent decision to defer a consumption tax hike. Our uncertainty indices for fiscal, monetary, trade and exchange rate policy co-vary positively but also display distinct dynamics. VAR models imply that upward EPU innovations foreshadow deteriorations in Japan’s macroeconomic performance, as reflected by impulse response functions for investment, employment and output. Our study adds to evidence that credible policy plans and strong policy frameworks can favorably influence macroeconomic performance by, in part, reducing policy uncertainty.
JEL Classification Numbers: D80, E20, E52, E62, F13
Keywords: Policy uncertainty, Japan, aggregate investment
Author’s E-Mail Addresses: [email protected], [email protected], [email protected], [email protected], [email protected]
1 We would like to thank Luc Everaert, Divya Kirti, Masayuki Morikawa, Carlos Mulas-Granados, Atsushi Nakajima, Todd Schneider, Yasushi Sugayama, Katsiaryna Svirydzenka, Vlodomyr Tulin, Francis Vitek and Sungwook Yoon for very useful comments and suggestions and Yihan Liu for excellent research assistance. Davis gratefully acknowledges financial support from the U.S. National Science Foundation and the Booth School of Business at the University of Chicago. The views expressed in this paper are those of the author(s) and do not necessarily represent the views of the IMF, its Executive Board, or IMF management.

I. INTRODUCTION
Efforts to reinvigorate Japan’s economy have proved challenging. Despite significant policy accommodation, growth over the past two decades has been weak, the share of non-regular employment has increased, wages have been stagnant, and inflation expectations lie below the Bank of Japan’s inflation target. Observers cite demographic headwinds, other structural factors, the zero lower bound, external shocks, and policy mistakes as reasons for Japan’s chronically weak economic performance. We focus on another, overlapping factor: uncertainty about policy and its effects. Previous studies and policymaker remarks suggest that uncertainty about U.S. and European policies contributed to a steep economic decline in 2008-09 and slow recoveries thereafter.2 Policy uncertainty has returned to the forefront amid concerns over the European immigration crisis, the Brexit referendum, a failed coup in Turkey, the U.S. election outcome, China’s tightening capital controls, presidential removals in Brazil and South Korea, and populist political forces in several countries.3 According to an aggregation of newspaper-based indices for 16 countries in Davis (2016), global economic policy uncertainty in 2016 exceeds even the high levels reached in 2008 Q4 and 2009 Q1. In Japan, an unsustainable fiscal trajectory, constraints on monetary policy, and weak growth present major challenges that intensify policy uncertainty. Shinzo Abe’s election as Prime Minister in December 2012 and his economic reform initiatives (“Abenomics”) marked an important milestone and a clearer policy direction after six prime ministers in six years. There was some acceleration in growth during this period as well as some success in boosting inflation and progress with structural reforms. However, maintaining confidence in Abenomics has proved difficult. Fiscal policy targets are no longer seen as credible, contributing to policy uncertainty. A consumption tax hike initially scheduled for 2015 was postponed twice, first to 2017 and then to 2019. Frequent use of supplementary budgets adds to uncertainty about the near-term fiscal stance. New monetary easing measures and technical changes to the monetary policy framework also contributed to uncertainty. Structural reforms related to labor markets, immigration and trade policy could improve growth prospects, but whether and how Japan will achieve these reforms is highly uncertain.4 Against this backdrop, we take up three questions: How has policy uncertainty moved over time in Japan? Which policy areas account for the largest share of policy uncertainty and its movements? What do changes in policy-related uncertainty portend for Japan’s economic
2 Examples include the minutes of the Federal Open Market Committee meeting on 15-16 December 2009, the International Monetary Fund (2012, pages xv-xvi and 49-53, and 2013, pages 70-76), Baker et al., (2012, 2016), and Stock and Watson (2012). 3 For example, see “Global Political Uncertainty Weighs on Growth Outlook,” Ian Talley, Wall Street Journal, 10 October 2016. 4 A survey of A survey of 3,438 Japanese firms in 2015 finds (a) firms perceive policies related to the social security system, taxes, government spending, and international trade to be highly uncertain, and (b) uncertainty about tax policy, labor market regulations, the social security system, and environmental regulations had the largest effect on firm’s decisions about investment and hiring. See Morikawa (2013, 2016) for details.

2
performance? To address these questions, we construct several newspaper-based policy uncertainty measures for Japan following the methods in Baker et al. (2016). We interpret these measures as proxies for policy-related uncertainty, as perceived by households and businesses. We relate our measures to other uncertainty measures, examine their behavior over time, and consider their dynamic relationship to aggregate economic performance. Our measures aim to capture uncertainty about who will make economically relevant policy decisions, what policy actions will be undertaken and when, and the economic effects of policy actions (or inaction). To construct our overall measure of economic policy uncertainty (EPU), we count articles in four major Japanese newspapers (Yomiuri, Asahi, Mainichi and Nikkei) that contain at least one term in each of three categories: (E) ‘economic’ or ‘economy’; (P) ‘tax,’ ‘government spending’, ‘regulation,’ ‘central bank’ or certain other policy-related terms; and (U) ‘uncertain’ or ‘uncertainty’. We scale the EPU counts by the number of articles in the same newspaper and month, standardize each paper’s series of scaled counts to the same variability over time, adjust for seasonality, and then average across papers by month to obtain our EPU index. We also construct uncertainty indices for monetary policy, fiscal policy, trade policy and exchange rate policy. To do so, we specify additional criteria for those articles that contain our triple of terms about the economy, policy and uncertainty. All of our measures are monthly from 1987 to the present, and we plan monthly updates. Our overall EPU index co-varies positively with implied volatilities for Japanese equities, exchange rates and interest rates and with Ito’s (2016) survey-based measure of political uncertainty in Japan. Our index peaks during the Asian Financial Crisis and in reaction to the failure of Lehman Brothers, the U.S. debt-ceiling fight in 2011, the Brexit referendum and the recent deferral of a hike in the consumption tax rate. The index also shows a clear tendency to rise around contested national elections and major leadership transitions. It displays moderately countercyclical fluctuations,5 perhaps because policymakers are more inclined to experiment with new policies in bad times (Pastor and Veronesi, 2013). Uncertainty indices for fiscal, monetary, trade and exchange rate policy correlate positively with one another, while also displaying distinct and intuitive dynamics. For example, implied interest rate volatility correlates more highly with our monetary policy uncertainty index than with our fiscal policy uncertainty index. In contrast, Ito’s (2016) measure of political uncertainty, which weighs the approval ratings of ruling and opposition parties, correlates more highly with fiscal policy uncertainty. Among all articles that satisfy our E, P and U criteria, 57 percent reference fiscal policy matters, 27 percent reference monetary policy, 8 percent reference trade policy, and only 3 percent reference exchange rate policy. This finding strongly suggests that fiscal matters are the most important source of policy uncertainty in Japan, at least in the perception of journalists and their editors and, presumably, typical newspaper readers as well.
5 In line with the evidence for other national and global EPU indices in Baker et al. (2016) and Davis (2016), and the broader tendency for economic uncertainty measures to fluctuate counter cyclically (Bloom, 2014).

3
Our EPU measures have predictive power for Japan’s economic performance conditional on standard measures of economic activity and uncertainty. In particular, vector autoregressive (VAR) specifications imply that upward EPU innovations foreshadow deteriorations in Japan’s macroeconomic performance, as reflected in impulse response functions for investment, employment and output. We also find a significant effect of global economic policy uncertainty on Japan’s economic performance when we use the Global EPU index of Davis (2016). These VAR results do not prove a causal effect of policy uncertainty on economic performance, but they show that our EPU index contains useful information not captured by other forward-looking indicators. Upward innovations to our EPU index for Japan also foreshadows a larger decline in macroeconomic aggregates than innovations to the Japan EPU index in Baker et al. (2016), suggesting that our efforts to improve the index deliver a better measure and stronger results in downstream econometric work.
II. RELATED LITERATURE
Compared to the Japan EPU index in Baker et al. (2016), we expand coverage from two to four major newspapers, and we deploy a better term set that reflects our auditing efforts and our expertise in Japanese economic policy. Unlike Baker et al. (2016), we also develop indices for several policy categories, which we see as helpful in diagnosing the proximate sources of policy uncertainty and potentially quite useful in analyzing policy uncertainty effects on industry- and firm-level outcomes. Alexopoulos and Cohen (2015), Azzimonti (2015), Hassan et al. (2016), Hlatshwayo and Saxegaard (2016) and Husted, Rogers and Sun (2016a) also use text analysis to quantify policy uncertainty and related concepts. Other approaches to the quantification of policy uncertainty include Ito’s (2016) survey-based measure for Japan, the country-level volatility of government consumption shocks in Fátas and Mihov (2013), the use of multivariate GARCH models in Grier and Perry (2000) and Vitek (2002), and time-varying measures of fiscal policy uncertainty derived from an estimated New Keynesian model in Fernandez-Villaverde et al. (2015). Theoretical work identifies several channels through which uncertainty can affect economic outcomes. First, heightened uncertainty provides an incentive to delay or forego investments that are costly to reverse (Bernanke, 1983, McDonald and Siegel, 1986, Dixit and Pindyck, 1994, Bloom et al., 2007 and Bloom, 2009). High uncertainty also encourages households to postpone costly-to-reverse purchases of durable goods (Eberly, 1994). Second, search frictions in labor markets and fixed costs of hiring and firing can retard hiring or induce firms to adjust on flexible margins such as part-time employment (Schaal, 2015, and Valetta and Bengali, 2013). Leduc and Liu (2016) show how nominal rigidities can interact with labor market search frictions to amplify the negative effects of uncertainty in DSGE models. Related to these channels, uncertainty can slow the growth of productivity and output by discouraging the reallocation of capital and labor inputs (Bloom et al., 2012). Third, uncertainty can depress investment by raising risk premiums, as stressed by several models with financial frictions (Arellano et al., 2010, Christiano et al., 2014, and Gilchrist et al., 2014). Fourth, greater uncertainty raises precautionary savings by households, which can reduce output in the presence of nominal rigidities, especially under constraints on monetary policy (Johansen, 2014, and Fernandez-Villaverde et al., 2015). Fiscal policy uncertainty also reduces output by intensifying monopoly pricing distortions in the model of Fernandez-Villaverde et al. Fifth, uncertainty can stimulate investment by increasing the value of growth

4
options (Paddock et al., 1988, and Bar-Ilan and Strange, 1996). See Bloom (2014) for a fuller discussion of how uncertainty affects economic activity.6 Several recent empirical studies investigate the effects of policy uncertainty on economic outcomes in Japan and elsewhere. Ito (2016) finds negative effects of policy uncertainty on employment and expenditures for consumer durables. Morikawa (2013, 2016) provides survey-based evidence of how Japanese companies perceive the relevance of policy uncertainty. Morikawa (2010), Ono and Sullivan (2013) and Matsuura (2013) find a greater use of non-regular workers at firms with greater sales growth volatility. Beyond the Japanese context, Durnev (2012), Julio and Yook (2012, 2016), Giavazzi and McMahon (2012) and Kelly, Pastor and Veronesi (2016) investigate the effects of election-related uncertainty on corporate investment, international capital flows, precautionary savings, and stock price volatility. Handley and Limao (2015) develop evidence that lower uncertainty about trade policy stimulates investment in export capacity. Gulen and Ion (2016) find negative effects of policy uncertainty on corporate investment using the Baker et al. (2016) EPU measure for the United States. Similarly, Baker et al. (2016) find larger negative effects of their newspaper-based EPU measures on investment rates and employment growth, and larger positive effects on stock price volatility, for firms with greater exposure to policy risks. Using the EPU index for India in Baker et al., Anand and Tulin (2014) find negative effects of policy uncertainty on firm-level investment flows, with stronger effects on new projects than ongoing ones. Another branch of the literature investigates the dynamic relationship of policy uncertainty, or economic uncertainty more broadly, to macroeconomic performance. Examples include Stock and Watson (2012), Colombo (2013), International Monetary Fund (2013), Jurado et al. (2015), Ludvigson et al. (2015), Baker et al. (2016) and Leduc and Liu (2016). These studies find that higher (policy) uncertainty foreshadows a deterioration in macroeconomic performance, broadly in line with our evidence for Japan. Romer (1990) marshals evidence that the 1929 stock market crash triggered a sharp rise in income uncertainty that led households to forego purchases of consumer durables, accentuating the collapse of aggregate demand at the onset of the U.S. Great Depression. Evidence in Constantinescu et al. (2017) suggests that high policy uncertainty depresses international trade in goods and services. In summary, a variety of studies find evidence that high (policy) uncertainty undermines economic performance by leading firms to forego investments and new hires, by slowing productivity-enhancing factor reallocation, and by depressing expenditures on consumer durables. This evidence points to a positive payoff in the form of stronger macroeconomic performance if policymakers can deliver greater predictability in the policy environment. For Japan, possibilities in this regard include a concrete and credible medium-term fiscal plan, clear follow through on structural reform plans, and a stronger communications framework at the Bank of Japan. A smaller literature finds that greater uncertainty causes households and firms to become less responsive on the margin to cuts in interest rates and taxes, in line with predictions of real options theory. See Bertola et al. (2005), Bloom et al. (2007), Bloom
6 A smaller literature examines the welfare consequences of policy uncertainty. Kitao (2016), for example, quantifies the welfare effects of uncertainty about the timing and nature of social security reform in Japan using a calibrated general equilibrium life-cycle model.

5
(2009), Aastveit et al. (2013) and Vavra (2014). These studies suggest that a stronger policy framework also increases the potency of countercyclical stabilization policies.
III. MEASURING ECONOMIC POLICY UNCERTAINTY IN JAPAN
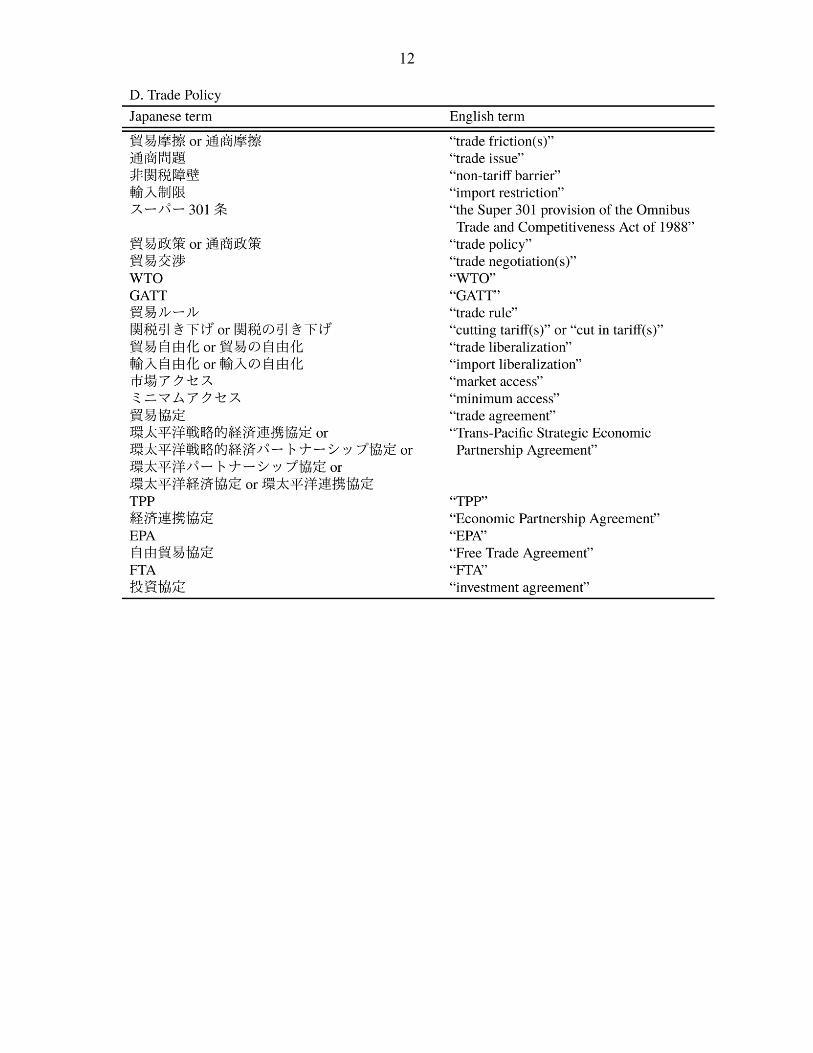
Following Baker et al. (2016), we use frequency counts of newspaper articles to construct our EPU indices. As a first step, we obtain raw monthly EPU article counts for Yomiuri, Asahi, Mainichi and Nikkei from January 1987 onwards. Our primary data sources are Kikuzo II, MAISAKU, Nikkei Telecom, and Yomidas Rekishikan. To meet our EPU criteria, an article must contain at least one term in the “economy” (E), “policy” (P) and “uncertainty” (U) categories listed in Table 1. The E and U categories are straightforward. For the P category, we sought to cover major policymaking institutions (e.g., “lower” and “upper house”, “Diet”, “central bank” and “Prime Minister”) and major policy areas (e.g., “taxes”, “government deficit”, “government debt”, “(de)regulation” and “structural reform”). We conducted a series of small-scale audits and other investigations to help select and refine the E, P and U term sets, as detailed in the appendix.
In a second step, we scale the raw EPU counts by the total number of articles in the same newspaper and month to obtain a relative EPU frequency count. Scaling in this manner adjusts for differences in article volume across newspapers and volume changes over time. Third, we standardize each newspaper’s relative EPU counts to unit standard deviation from 1987 to 2015. Fourth, we seasonally adjust the resulting newspaper-level series in view of the pronounced and distinctive seasonal pattern at certain papers. The appendix provides more information about seasonality and explains how we performed the adjustment. Fifth, after the scaling, standardization and seasonal adjustment steps, we average the resulting series across the four papers by month to obtain our overall monthly Japan EPU index. The third, fourth and fifth steps ensure that each newspaper receives (roughly) equal weight in determining the behavior of the overall index, despite differences across papers in the share and variability of articles about business and economics. Finally, we multiplicatively normalize the four-paper average EPU series to a mean of 100 from 1987 to 2015.
To accurately mirror variation in policy-related uncertainty over time, our EPU index must satisfy two requirements. First, the E, P and U criteria must yield counts that move in line with actual newspaper coverage of economic policy uncertainty. We relied on several small-scale audits to evaluate and refine our choice of terms, with an eye towards minimizing classification errors. See the appendix for details. Second, newspaper coverage must reflect movements in policy uncertainty. To address this requirement, we compared our newspaper-based EPU measures to other measures of economic and political uncertainty for Japan. We also conducted a descriptive assessment of the key economic and policy developments associated with heightened levels of policy uncertainty according to our index. We report the results of these investigations below.

6
Table1.TermSetsfortheOverallJapanEPUIndex

7
The Japan Economic Policy Uncertainty Index
Figure 1 plots our overall EPU index for Japan from January 1987 to March 2017. The index peaks during the Asian Financial Crisis and in reaction to the “Twisted Diet” election outcome in 1998, 7 the introduction of Quantitative Easing in 2001, the Takenaka Plan for tackling longstanding problems with non-performing loans at Japanese banks, the Lehman Brothers failure in September 2008, and the Greek Crisis and Twisted Diet election outcome in 2010, and the U.S. debt-ceiling fight in summer 2011. The Japan EPU index is moderately countercyclical, but it also displays many strong movements not tied directly to cyclical conditions. In April 2001, Junichiro Koizumi became Prime Minister, a position he held until 2006, making him one of the longest serving Prime Ministers in Japan’s history. The EPU index drifts down during this period of political continuity and reaches some of its lowest values in our sample period. The index also exhibits a period of gradual decline starting in 2013, coinciding with the launch of Abenomics and an improvement in confidence indicators.8 Since 2015, policy uncertainty has risen again amid concerns about developments in China, a new negative interest rate policy, the Brexit referendum, consumption tax hike delays and elections in the US.
Figure A.1 compares our overall Japan EPU index to the one in Baker et al. (2016). The two indices are highly correlated, as expected given the overlap in newspapers and term sets, but there are differences. For example, the Baker et al. index displays higher volatility during the late 1980s and early 1990s. Our Japan EPU index shows a more persistent rise during the Asian Financial Crisis. It also shows larger spikes in reaction to the Lehman Brothers failure and the US debt downgrade. As mentioned earlier, our index reflects articles in four rather than two Japanese newspapers – including the Nikkei, which specializes in business and economics. Doubling the number of papers lets us average out more of the idiosyncratic, newspaper-level noise. Unlike Baker et al. (2016), we also adjust for seasonality. Finally, our expanded and refined set of terms also leads to differences between the two indices.
7 “Twisted Diet” means that no single party controls both the upper and lower houses of Japan’s parliament and no party has a super majority (two-thirds) in the Lower House. 8 The Bank of Japan Tankan index (business confidence indicator) bottomed out in December 2012 and peaked in March 2014. The Opinion Survey conducted by the Bank of Japan also showed a similar improvement during this period.

8
Figure1.JapanEconomicPolicyUncertaintyIndex(1987M1-2017M3)
A,October1987:BlackMonday.TakeshitabecomesnextLDPPresident.BudgetconflictsbetweenPresidentReaganandCongress.FXintervention.B,March1995:BailoutplansfortwoShinkinbanksinTokyofaceobjectionatmetropolitancongress.YensurgesdespiteFXintervention.Debateaboutpolicyratecut.C,November-December1997:AsianFinancialCrisis,successivefailuresofbanksandsecuritiesfirms,andpolicydebatesaboutfiscalconsolidation.D,July-August1998:LDP’sdefeatinUpperHouseelectionyieldsTwistedDiet.Russiancrisis.E,June2000:LowerHouseelection.F,February-March2001:PoliticalconfusionoverPMMori’sresignation.IntroductionofQuantitativeEasing.G,July2001:UpperHouseelection.H,October2002:Takenaka’splantotacklenon-performingbankloans.IntroductionofFinancialRevitalizationProgram.Stimulusdebate.ExpansionofQE.I,March2008:DPJrejectsBOJGovernornominations.J,September-October2008:LehmanBrothersfailure.BOJcutspolicyrate.Stimulusdebate.K,February2009:ConcernsoverdelayinpassingUSstimuluspackage.“BuyAmerican”provisionsinCongress.L,May-June2010:Greekcrisis.PMHatoyama’sresignation.InaugurationofPMKan’scabinet.M,August2011:U.S.debtdowngrade.ConcernsoverEuropeandebtcrisis.Enhancementofmonetaryeasing.JapanFXintervention.PMKanresigns.N,June2012:Greekparliamentaryre-election.ConcernsoverSpain’sfinancialsystem.Tri-partyagreementontaxesandsocialsecurity.O,January-February2016:Introductionofnegativeinterestrates.P,May-June2016:Consumptiontaxhikedelay.Brexit.Q,November2016-January2017:USPresidentialelection,worriesaboutratificationofTPPintheUS.Note:Shadedareasindicaterecessionperiods.
0
50
100
150
200
250
300
1987 1989 1991 1993 1995 1997 1999 2001 2003 2005 2007 2009 2011 2013 2015 2017
Sources:Authors'calculations.
C D
FE G H
J
L
K
M
N
P
O
AsianFinancialCrisis
TwistedDietRussianCrisis
Political ConfusionoverPMMori'sResignation,BOJadoptsQEPolicy
LehmanFailure,Stimulusdebate Consumption
Tax HikeDelay
US Downgrade,EurozoneCrisis,PMKanresigns
AB
I
BlackMonday,TakeshitaNewLDPPresident
Q
LowerHou
seElection
GreekCrisis,PMHatoyamaresigns

9
Uncertainty Indices for Policy Categories
We also constructed uncertainty indices for fiscal, monetary, trade and exchange rate policy. To obtain raw frequency counts for these indices, we flagged articles that meet the E, P and U criteria, as before, and that contain one or more of the terms listed in Table 2 for particular policy categories. We then followed the same sequence of steps as for the overall EPU index. Here as well, we relied on informal audits and other investigations to inform our choice of term sets in Table 2. See the appendix for details.
Figures 2 and 3 display our Japan uncertainty indices for fiscal and monetary policy.9 Their movements broadly conform to our priors – rising around major economic and political events and policy announcements. The two indices correlate at 0.68. Both indices exhibit large jumps during the Asian financial crisis and in reaction to the Brexit referendum.10
They also display distinct movements. For example, the fiscal policy uncertainty index responds (more) to contested elections, Twisted Diet episodes, political confusion surrounding Prime Minister Mori’s resignation, debates over stimulus packages in 2002 and 2008, and the ruling DPJ party’s talks with the opposition LDP and Komeito parties in 2012 about social security and tax bills. The fiscal policy uncertainty index also picks up major external developments such as the US government debt downgrade and the European debt crisis. In contrast, the monetary policy uncertainty index spikes around the introduction of Quantitative Easing (QE) in 2001, uncertainty over its expansion in 2001-02 and 2010-11, and the introduction of negative rates in 2016. It also peaks in March 2008 amid concerns surrounding a vacancy in the Bank of Japan’s Governor position, which arose because the ruling parties could not secure Diet approval for the proposed appointee.
9 The Bank of Japan is responsible for financial stability, and it played a prominent role during the banking crisis of the 1990s. It also has a role in exchange rate policy through foreign exchange (FX) intervention on behalf of the Ministry of Finance. These multiple, overlapping responsibilities make it hard to construct a pure measure of monetary policy uncertainty for Japan. 10 Table A.1 reports pairwise correlations between policy category uncertainty indices. Husted, Rogers and Sun (2016b) construct another newspaper-based index of monetary policy uncertainty for Japan. Figure A.2 compares their index to ours; the correlation is 0.22 and 0.32 at monthly and quarterly frequencies, respectively. While both indices are news-based, we use Japanese newspapers, while they use three major international and American papers (Financial Times, New York Times, Wall Street Journal). Another difference is that our index relies on a broader term set that includes "quantitative easing", "negative interest rate" and "inflation target".

10
Table2.TermSetsforPolicyCategoryUncertaintyIndices

11
12

13
Figure2.FiscalPolicyUncertaintyIndex (1987M1-2017M3)
A:October1987.BlackMonday.TakeshitabecomesnextLDPPresident.BudgetconflictsbetweenPresidentReaganandCongress.B:November-December1997.AsianFinancialCrisisandpolicydebatesaboutfiscalconsolidation.C:July1998.LDP’sdefeatatUpperHouseelectionyieldsTwistedDiet.D:May1999.Politicalconflictregardingpensionreformandlong-termcareinsurancesystem.E:June2000.LowerHouseelection.F:February-March2001.PoliticalconfusionoverPMMori’sresignation.G:July2001.UpperHouseElection.H:October2002.Debateoneconomicstimuluspackage.I:August2005.Politicalconflictoverthepostalprivatizationbills.PMKoizumidissolvesthelowerhouse.J:January2008.StimuluspackageconflictsbetweenPresidentBushandCongress.PoliticalconflictregardingextensionofprovisionalgasolineandothertaxesintheDiet.K:October2008.LehmanBrothersfailureandstimulusdebate.L:August2009.LowerHouseelection,DPJtakesoffice.M:May-June2010.Greekcrisis.PMHatoyama’sresignation.InaugurationofPMKan’scabinet.N:August2011.U.S.debtdowngradeandconcernsaboutEuropeandebtcrisis.PMKan’sresignationandDPJ’sleadershipelection.O:June2012.SovereigndebtproblemsinGreeceandSpain.Tri-partyagreementontaxandsocialsecurityreform.P:May-June2016.ConsumptiontaxhikedelayandBrexit.Note:Shadedareasindicaterecessionperiods.
0
50
100
150
200
250
300
350
400
1987 1989 1991 1993 1995 1997 1999 2001 2003 2005 2007 2009 2011 2013 2015 2017
Sources:Authors'calculations.
CB
K
GL
M
P
N
O
AsianFinancialCrisis
TwistedDietRussianCrisis
U.S. Downgrade,EuropeanDebtCrisis
Lehman Failure,Stimulusdebate
ConsumptionTax HikeDelay
J
FE
DA
BlackMonday,TakeshitaNewLDPPresident
H
ILowerHou
seElection Political Confusion
overPMMori'sResignation
GreekCrisis,PMHatoyamaresigns

14
Figure3.MonetaryPolicyUncertaintyIndex(1987M1-2017M3)
A:October1987.BlackMonday.FXintervention.B:July1992.BOJcutspolicyrate.C:March1995.Japan’sbankingcrisis.CoordinatedFXintervention.Debateaboutpolicyratecut.D:November1997.AsianFinancialCrisis.SpecialBOJloanstostabilizefinancialsystemafterbankruptcyofHokkaidoTakushokuBankandYamaichiSecurities.E:March1998.BOJGovernorMatsushitaresigns.F:October1998.Debateonfurthermonetaryeasingamidmountingconcernoverthefinancialsystem.G:March2001.IntroductionofQE.H:February2002.DebateonexpansionofQE.I:September-October2002.DebateonexpansionofQE.J:May2003.ConcernsoverthespreadofSARSepidemic.ExpansionofQE.BOJ’sprovisionofspecialloanstoResonaBank.K:August2007.DisarrayinglobalfinancialmarketswiththeoutbreakofU.S.subprimeloancrisis.Injectionofliquiditybycentralbanks.DebateaboutpolicyratecutinJapanandtheUS.L:March2008.ConcernsovervacancyofBOJGovernor.M:October2008.LehmanBrothersfailure.BOJcutspolicyrate.N:August2010.DebateonQEenhancementamidsharpyenappreciation.O:August2011.QEenhancementandtheBOJ’sunilateralFXintervention.P:June2013.ConcernsoverFEDQEtapering.Q:November2014.DebateontheBOJ’sQEprogramunderPMAbe’sdecisiontodelaytheconsumptiontaxhikeplannedforOctober2015.R:January-February2016.Introductionofnegativeinterestrates.S:May-July2016.DebateonFXinterventionamidsurgeinyen.Brexit.Enhancementofmonetaryeasing.Note:Shadedareasindicaterecessionperiods.
0
50
100
150
200
250
300
350
400
450
1987 1989 1991 1993 1995 1997 1999 2001 2003 2005 2007 2009 2011 2013 2015 2017
Sources:Authors'calculations.
B F
D GH
L
J
N
OR
S
PC E I M
Q
AsianFinancialCrisis,BoJ supportto financialinstitutions
Black Monday,FXintervention
BoJ cutspolicyrate
BankingCrisis,CoordinatedFXintervention
IntroductionofQE
LehmanFailure,BOJcutspolicy rate
Enhancement of QE,FXintervention Negative
Rates
KA
DebatesonexpansionofQE
Vacancyof BOJGovernor Brexit
ExpansionofQE

15
Figures 4 and 5 compare our fiscal and monetary policy uncertainty indices with their US counterparts in Baker et al. (2016).11 They correlate at about 0.3 for both fiscal and monetary policy. Fiscal policy uncertainty was higher and more volatile in the U.S. during the late 1980s and early 1990s. The reverse pattern held during the Asian Financial Crisis. In recent years, U.S. fiscal policy uncertainty has been relatively muted, except for a jump in response to the November 2016 elections. In contrast, Japan has experienced elevated levels of fiscal policy uncertainty, partly due to uncertainty surrounding consumption tax hikes. Monetary policy uncertainty indices rose for both countries around the stock market crash of 1987, the Asian Financial Crisis and in the early 2000s. They fell for both during the mid-to-late 2000s and rose again during the global financial crisis of 2008-09. The Japan monetary policy uncertainty index has been highly elevated since the introduction of negative interest rates in late January 2016, while the U.S. index has remained at low levels except for a temporary spike in reaction to the Brexit referendum. See Cecchetti and Schoenholtz (2016) for a fuller discussion of recent policy shifts by the Bank of Japan. Figure 6 exhibits two periods of elevated trade policy uncertainty: the late 1980s and early 1990s, and the years since 2011. The first period reflects pressure on Japan from major trading partners to reduce import barriers. Our index responds to several bilateral talks between Japan and the US in this period. For example, the US named Japan an unfair trading partner under the “Super 301” provision of the Omnibus Trade and Competitiveness Act of 1988. Negotiations began on certain products under threat of retaliation against Japanese exports to the United States. The US also pushed for quantitative targets for imports in semiconductors, autos and auto parts in this period. Since 2011, developments related to the Trans Pacific Partnership (TPP) loom large. Sources of trade policy uncertainty include whether Japan would join the talks, whether an agreement could be reached with all parties, and whether the agreement would be ratified. More recently, the Brexit referendum outcome in the United Kingdom and the US elections triggered major spikes due to uncertainty about Japan’s future trade arrangements with these countries. Figure 7 shows our uncertainty index for exchange rate policy. Unlike our other indices, it displays no persistent swings. Instead, it shows short-lived spikes near Ministry of Finance interventions in foreign exchange (FX) markets and during periods of high concern about large swings in the value of the yen. Notable episodes include the Asian financial crisis – when the yen depreciated sharply against the U.S. dollar, prompting both countries to intervene – strong yen appreciation in 2010 that triggered intervention, yen appreciation in 2011 amidst uncertainty around the US debt-ceiling debate, and the US debt downgrade. The index captures heightened uncertainty about exchange rate policy even when no FX intervention materialized. A good example is uncertainty related to sharp yen appreciation in 2016 and speculation about the possibilities for FX intervention.
11 The U.S. fiscal policy uncertainty index in Baker et al. reflects terms for taxes, government spending, government debt and deficits, fiscal stimulus, debt ceilings and the like.

16
Figure4.FiscalPolicyUncertaintyIndicesforJapanandtheUnitedStates(1987M1-2016M12)
Figure5.MonetaryPolicyUncertaintyIndicesforJapanandtheUnitedStates(1987M1-
2016M12)
0
50
100
150
200
250
300
350
400
450
1987 1989 1991 1993 1995 1997 1999 2001 2003 2005 2007 2009 2011 2013 2015 2017
Japan US
Sources:Bakeretal.(2016)andauthors'calculations.
0
50
100
150
200
250
300
350
400
450
1987 1989 1991 1993 1995 1997 1999 2001 2003 2005 2007 2009 2011 2013 2015 2017
Japan US
Sources:Bakeretal.(2016)andauthors'calculations.

17
Figure6.TradePolicyUncertaintyIndex(1987M1-2017M3)
A:March1987.USsanctionsonJapanesesemi-conductors.B:January1988.DeliberationonOmnibustradebillinUSCongress.C:December1993.GATTUruguayRoundofmultilateraltradetalks.Partialopeningofricemarketandtariffcutonimportedbeef.D:March1994.RevivalofSuper301provisioninUSOmnibusTradeActof1988.E:September1997.AsianFinancialCrisis.F:February2009.Deliberationon“BuyAmerican”provisioninUSCongress.G:November2010.ConflictoverparticipationinTPPtalkswiththerulingcoalition.PMKanannouncesJapanwillbeginconsultationsonparticipatinginTPPtalks.H:January2011.PMKan’sstatementonTPP.Cabinetreshuffling.I:November2011.PoliticalconflictsoverJapan’sparticipationinTPPtalks.J:November-December2012.UncertaintyoverJapan’sparticipationinTPPtalks.PMNodadecidesnottoannounceparticipationanddissolvestheLowerHouse.LDPreturnstopower,intensifyinguncertaintyaroundJapan’sparticipationinTPP.K:March2013.PMAbeannouncesJapan’sparticipationinTPPtalks.L:July2013.UpperHouseelection.M:October2013.TPPsummitendswithoutreachingbroadagreement.N:April2014.UncertaintyaboutwhetherJapanandtheUSwouldreachagreementonTPP,andconcernswhetherUSCongresswouldgrantPresidentObamatradepromotionauthority.O:October2015.UncertaintyoverTPPratificationinJapan,CanadaandtheUSdespitebroadagreementatministerialmeetingearlierinmonth,P:January2016.UncertaintyoverTPPratificationbyUSamidupcomingpresidentialelections.ResignationofMinisterAmariinchargeofTPPnegotiationsduetocorruptionallegations.Q:June2016.Brexit.R:November2016-January2017.USPresidentialelection,worriesaboutratificationofTPPintheUS.Note:Shadedareasindicaterecessionperiods.
0
100
200
300
400
500
600
700
1987 1989 1991 1993 1995 1997 1999 2001 2003 2005 2007 2009 2011 2013 2015 2017Sources:Authors'calculations.
G
NH
DeliberationontheOmnibustradebillintheU.S.Congress
GATTUruguayRound
PMKan'sstatementonTPP,Reshuffleofcabinet
F
USsanctionsonJapanesesemi-conductors
RevivaloftheSuper301provisionoftheOmnibus
Asian financialcrisis
Deliberation on"BuyAmerican"provisioninCongress
ML
Sources:Authors'calculations.
CB
J
DeliberationontheOmnibustradebillintheU.S.Congress
E
DA
PoliticalconflictoverTPP
K
O
PQ
R
UncertaintyoverTPPtalks
Brexit
I
USPresidentialelection

18
Figure7.ExchangeRatePolicyUncertaintyIndex(1987M1-2017M3)
A:October1987.BlackMonday.SharpyenappreciationagainstUSdollarandFXintervention.B:December1987.FXinterventionwiththeUSandEuropetostemyenappreciation.C:September1992.EuropeancurrencycrisiswithtemporarysuspensionofERM,andcontinuedyenappreciationagainsttheUSdollaramiduncertaintyaroundUSpresidentialelection.D:April1993.Rapidyenappreciation,interventionbyJapanandtheUS.E:August1993.Continuedyenappreciation,FXintervention,uncertaintyaboutcoordinatedinterventionwiththeUS.F:June1994.Excessiveyenappreciation,JapanintervenesintheFXmarket,jointinterventiontogetherwiththeUSandEurope.G:March1995.Japan,USandEuropeagaininterveneinefforttostemyenappreciation.H:August1995.Japan,USandEuropeconductjointdollar-buyinginterventiontosupportU.S.dollar.I:June1998.Concernsaboutrapidyendepreciationandmountingconcernsoverthefinancialsystem,severedownturninJapanandAsianfinancialcrisis.JapanandUSintervenetosupportyen.J:September1999.RapidyenappreciationagainstUSdollarpromptsintervention.K:September2000.LargeEurodepreciationtriggersdebateanduncertaintyaboutcoordinatedintervention,L:September2001.9/11attacksM:June2002.Yenappreciationandintervention.N:January2003-March2004.Large,sustainedFXinterventionthrough2003.O:August-September2010.Debateoveryenappreciationandcoordinatedintervention.P:March2011.GreatEastJapanearthquaketriggerssharpyenappreciationandcoordinatedinterventionwithUSandEurope.Q:August2011.Sharpyenappreciation,FXintervention,andUSdebt-ceilingcrisis.R:June2012.Europeansovereigndebtcrisisandyenappreciation.S:May-June2016.Rapidyenappreciation.UncertaintyoverBrexitandFXintervention.Note:ShadedareasindicateperiodsofFXintervention.
0
100
200
300
400
500
600
700
800
900
1987 1989 1991 1993 1995 1997 1999 2001 2003 2005 2007 2009 2011 2013 2015 2017Sources:Authors'calculations.
GJ
M
Q
EuropeancurrencyandERMcrisis I
F
A
USdebtdowngrade
EastJapanEarthquake
SustainedFXintervention
R
Sources:Authors'calculations.
CB
KED
H
Debate onconcertedintervention
Asian financialcrisis
DebateonFXinterventionamidsurgeinyen
SLN
O
P
Europeandebtcrisis
9/11Attacks
CoordinatedFXintervention

19
Relationship to Other Economic Uncertainty Measures As seen in Table 3, our overall Japan EPU index correlates at above 0.5 with option-implied volatilities for the Japanese stock market and for the yen-dollar exchange rate. Figure 8 reveals notable similarities between the EPU index and implied equity volatility, especially during the global financial crisis. Each measure exhibits distinct dynamics as well. For example, the implied equity market volatility falls rapidly after the global financial crisis, but the EPU index does not. The EPU index reacts much more strongly to the Asian financial crisis, and it is highly elevated during much of 2015 and 2016, unlike stock market volatility.
Table3. CorrelationofJapanEPUIndiceswithOtherUncertaintyMeasures
Note:EquitymarketvolatilityistheNikkeiStockAverageVolatilityIndexoveronemonthcalculatedfromNikkei225futuresandoptions.ExchangeratevolatilityistheoptionimpliedvolatilityoverthenextmonthfortheUSD-Japaneseyenexchangerate.Interestratevolatilityistheoption-impliedvolatilityoverthenextthreemonthsbasedonJapanesegovernmentbondswith1-yeartenor.ThepoliticaluncertaintymeasurefromIto(2016)reflectstherelativeapprovalratingsofrulingandoppositionparties.TheGlobalEPUindexfromDavis(2016)istheGDP-weightedaverageofnewspaper-basedEPUindicesfor18countries.TheEPUindicesfortheUS,JapanandEuropearefromBakeretal.(2016).
Our Japan EPU indices also correlate positively with policy and economic uncertainty measures for other advanced economies and regions. This pattern points to common forces behind uncertainty movements in Japan and other major economies. The cross-country correlations are higher since the global financial crisis. For example, the correlation of our Japan EPU index and EPU indices for the US and Europe are about 0.3 in the pre-2007 period and 0.6 for the 2007-2016 period. Figure 9 compares our fiscal policy uncertainty index with Ito’s measure of political uncertainty for Japan. The two measures reflect some of the same underlying developments. For example, both rose during 1997-98, peaking with the LDP’s defeat in July 1998 and the resulting Twisted Diet. They rose again in the 2007-12 period characterized by frequent turnover of the Prime Minister. The two indices correlate at 0.31 in monthly data and about 0.44 at the annual frequency. In contrast, Ito’s political uncertainty index correlates at only 0.07 with our uncertainty index for monetary policy. These results reassure us that our monetary and fiscal policy indices capture some distinct sources of uncertainty.
Overall Fiscal Monetary Trade ExchangeRate SampleEquityMarketVolatility 0,50 0,42 0,44 -0,01 0,16 1990M6-2017M3ExchangeRateVolatility 0,53 0,43 0,34 0,04 0,13 2003M1-2017M2InterestRateVolatility 0,22 0,06 0,27 -0,12 -0,04 2007M1-2016M8PoliticalUncertainty 0,23 0,30 0,07 -0,04 0,19 1987M1-2017M3EPU-Global 0,50 0,40 0,47 0,69 0,22 1997M1-2017M3EPU-US 0,49 0,44 0,48 0,36 0,26 1987M1-2017M3EPU-Japan(Old) 0,66 0,61 0,52 0,22 0,20 1988M6-2016M4EPU-Europe 0,49 0,42 0,51 0,57 0,15 1987M1-2017M3VIX-US 0,52 0,51 0,33 -0,14 0,17 1990M1-2017M3
DifferentEUIndicatorsOurJapanEPUIndices

20
Figure8.JapanEPUIndexandOption-ImpliedVolatilityofNikkeiEquityIndex(1987M1-2017M3)
Figure9.OurFiscalPolicyUncertaintyIndexComparedtoIto’sPoliticalUncertaintyIndex(1987M1-2017M3)
0
10
20
30
40
50
60
70
80
0
50
100
150
200
250
300
1987 1989 1991 1993 1995 1997 1999 2001 2003 2005 2007 2009 2011 2013 2015 2017
EPUIndex
ImpliedEquityMarketVolatility(RHS)
Sources:NIKKEIandauthors'calculations.
0
50
100
150
200
250
300
350
1987 1989 1991 1993 1995 1997 1999 2001 2003 2005 2007 2009 2011 2013 2015 2017
PoliticalUncertaintyIndex(Ito(2016)) FiscalPolicyUncertaintyIndexSources:Ito(2016)andauthors'calculations.Note:ThebluelinesindicatechangesinPrimeMinister.

21
Proximate Sources of Economic Policy Uncertainty in Japan Figure 10 provides information about the proximate sources of policy uncertainty, and how those sources vary through time. On average, 57 percent of EPU articles contain one or more of the fiscal policy terms in Table 2, 27 percent contain monetary policy terms, 8 percent contain trade policy terms, and only 3 percent refer to exchange rate policy terms.12 These results strongly point to fiscal matters as the leading source of policy uncertainty in Japan. The fiscal policy share of EPU articles fell to relatively low levels in the early1990s and again in the 2006-07 period, before rising to high levels during and after the global financial crisis. The monetary policy share fluctuates around an upward drift and reaches its highest levels of about 30 percent near the end of our sample period. The share of EPU articles that discuss currency and trade policy matters are modest throughout the sample, although the trade policy uncertainty share has risen persistently since 2011.
Figure10.ProximateSourcesofEconomicPolicyUncertainty(PercentofOverallEPUIndex,12-monthMA)
12 An article that meets our E, P and U criteria may contain terms from zero, one or multiple of the category-specific term sets listed in Table 2. Thus, the shares displayed in Figure 10 can sum to more or less than 100 percent of all EPU articles in the month.
0
10
20
30
40
50
60
70
80
1988 1990 1992 1994 1996 1998 2000 2002 2004 2006 2008 2010 2012 2014 2016
FiscalPolicy MonetaryPolicy
ExchangeRatePolicy TradePolicy

22
The Interplay between Policy Uncertainty and Economic Performance
As suggested by the foregoing discussion and our annotated charts, the interplay between policy uncertainty and economic performance is complex. Causal effects can operate in both directions, and rather differently across episodes. The potential for negative shocks to create policy uncertainty depends on the underlying environment, which in turn is shaped by previous policy decisions and institutions. For example, the case for discretionary fiscal stimulus in response to negative shocks is weaker when robust automatic fiscal stabilizers are in place. That is, the presence of automatic fiscal stabilizers diminishes the need for discretionary fiscal stimulus, and the political conflicts and policy uncertainty that often accompanies efforts to deploy discretionary fiscal tools. As a separate point, policy uncertainty may co-move with other hard-to-measure factors that influence, or are influenced by, economic performance. These factors include confidence about future economic performance, political polarization, and governance quality in the public sector.
This complexity is evident in the behavior of our policy uncertainty indices for Japan. Contested elections, major political transitions and Twisted Diet outcomes are often associated with higher levels of overall policy uncertainty and fiscal policy uncertainty (Figures 1 and 2). Prime Minister Abe’s election at the end of 2012 brought greater political stability, a clearer policy direction, and several years of declining or low policy uncertainty (Figure 1). A similar pattern held during the long tenure of Prime Minister Koizumi (Figure 1). It seems likely that these periods of political stability contributed to a moderation of policy uncertainty, and that a relatively benign or hopeful economic outlook during these episodes helped sustain stable political leadership.
Leadership transitions and policy shifts at the Bank of Japan sometimes brought spikes in monetary policy uncertainty (Figure 3). While leadership changes are inevitable and major developments may require policy shifts, their impact on economic uncertainty depends on previously established institutions and policy frameworks. Clear communications about the objectives of monetary policy, backed by strong analytical and empirical underpinnings, are likely to bring more continuity in the conduct of monetary policy, less anxiety and uncertainty about its future direction, and greater confidence about economic performance.
To appreciate how the past conduct of monetary policy shapes the current policy environment – and the scope for negative shocks to trigger a rise in policy uncertainty – consider recent proposals to raise the target rate of inflation (e.g., Blanchard et al., 2010 and Ball, 2014). The logic behind these proposals is straightforward: Raising the underlying rate of inflation reduces the likelihood that monetary policy becomes constrained by the zero lower bound on nominal interest rates during future downturns. In this way, a higher target rate enlarges the scope for using traditional monetary policy tools to stabilize economic activity and lessens the need for quantitative easing, forward guidance, direct credit market interventions and discretionary fiscal stimulus. Because less is known about the effectiveness of less conventional policy tools, their use involves greater uncertainty about effects. Heavy reliance on unconventional tools may also erode political support for the central bank, undermining sound monetary policy in the future.

23
Several episodes in recent decades illustrate the potential for negative economic shocks to create high levels of economic uncertainty. Examples include the Asian Financial Crisis, the downturn of 2001-02 and the Global Financial Crisis of 2008-09, all of which led to spikes in our measures of fiscal and monetary policy uncertainty (Figures 2 and 3). The experience of Asian countries during the Asian Financial Crisis also illustrates how past policy decisions shape the contemporaneous response of policy uncertainty to negative shocks. The build-up of financial excesses, funded through large dollar-denominated debts in the banking system and the private sector, made some Asian economies highly vulnerable to exchange rate adjustments. This vulnerability accentuated policy uncertainty during the Asian Financial Crisis. In contrast, stronger policy frameworks, better financial supervision and larger reserve buffers helped Asian economies weather the Global Financial Crisis under much better terms. See Davis (2017) for a broader discussion of how sound regulatory design can temper policy uncertainty.
IV. POLICY UNCERTAINTY AND AGGREGATE ECONOMIC PERFORMANCE
We consider VAR models that yield output, employment, consumption and investment responses to Cholesky-identified EPU innovations. Specifically, we estimate VAR models using data on the (natural) log of our Japan EPU indices, log Nikkei stock price index, nominal interest rate (yields on 2-year JGBs), log employment, log of GDP or industrial production (or major components), log household consumption expenditures or synthetic consumption index, and log gross private investment. Our sample for the baseline VAR model runs from 1994M1 to 2016M12 for monthly data and from 1987Q1 to 2016Q4 for quarterly data13. We use two lags in all VAR specifications.14 Our specifications rely on standard Cholesky decompositions to identify shocks, with log Japan EPU ordered first unless noted otherwise.15 Figure A.3 resents the time series of EPU shocks (in standardized units) identified from the monthly and quarterly VAR systems. At the monthly frequency, the largest EPU shock takes place in 2008M10 during the global financial crisis, followed by 2011M8 (U.S. debt downgrade, concerns over European debt crisis, and PM Kan’s resignation and the DPJ’s leadership election) and 1997M11 (policy debates about fiscal consolidation and Asian financial crisis). The European debt crisis in 2010 also led to a very large and positive EPU shock. It’s worth noting that large, positive EPU shocks sometimes occur during expansions, as in 2010M5, and 2011M8. According to our baseline monthly results in Figure 11, upward EPU innovations foreshadow statistically significant declines in output, employment and consumption expenditures. Gray
13 Our sample for monthly VAR models is shorter reflecting the more limited sample period for the synthetic consumption index. If we exclude the tertiary activity index and the synthetic consumption index and use the whole sample (1987M1-201M12), we get a slightly smaller impact of EPU innovations on employment and industrial production, but qualitatively our results remain the same. 14 Based on the Akaike and Schwarz information criteria. 15 Granger causality tests fail to reject the hypothesis that economic indicators such as real GDP and industrial production have zero predictive power for our EPU index. The reverse is not true.

24
shading shows 95% confidence intervals. A unit standard deviation EPU innovation yields a peak estimated fall after about one year of 0.8 percent in industrial production and 0.2 percent in tertiary sector activity. We also find a smaller, marginally significant and less persistent response in consumption. The employment response is modest in size but highly persistent. While we do not measure gross investment at a monthly frequency, a breakdown of monthly IP data reveals much larger estimated output responses in sectors that produce investment goods.16 Figure A.4 shows that results for our fiscal policy uncertainty index are very similar to results for the overall EPU index, while results for monetary policy uncertainty are somewhat weaker. The quarterly VAR results in Figure 12 also show that upward EPU innovations foreshadow weaker aggregate performance. Specifically, a unit standard deviation upward EPU innovation foreshadows a peak fall in real GDP of about 0.3 percent after one year. The employment response is smaller but more drawn out. The investment response peaks at an estimated 1 percent. Figure 13 shows the historical contribution of EPU shocks to fluctuations in real GDP and investment. EPU shocks account for sizable movements in both variables—with peak investment and GDP swings of about 6 and 2 percent, respectively. EPU-induced movements are most pronounced in 1997-1999, 2001-2002 and 2008-2012. Figure 14 displays estimated real GDP responses to EPU innovations for alternative specifications and samples in the quarterly data. The basic pattern whereby upward EPU innovations foreshadow future output declines is robust to alternative Cholesky orderings, the inclusion of option-implied equity price volatility in the VAR system, and the inclusion of the Global EPU index from Davis (2016). These modifications to the VAR specification and identification assumptions lead to somewhat smaller output responses and somewhat wider confidence intervals. Discarding data after 2006 also yields somewhat smaller responses. If we instead restrict attention to the post-1995 period when the BOJ was up against the zero lower bound, we obtain larger responses, consistent with our priors. Broadly speaking, we see three ways to interpret our VAR-based evidence. Under the first interpretation, an upward EPU innovation corresponds to an unforeseen policy uncertainty shock that causes the worsening of macroeconomic performance through real options effects, cost-of-capital effects or other mechanisms. Under the second interpretation, an upward EPU innovation captures bad news about the economic outlook that is not (fully) captured by the other variables in the VAR system, and that bad news triggers a rise in EPU that has harmful effects on the economy. Under this interpretation, EPU amplifies and propagates a causal impulse that originates elsewhere. Third, EPU has no role as either an impulse or a propagation mechanism; instead, it simply acts as a useful summary statistic for information missing from the other variables in our system. This third interpretation is hard to fully reconcile with the evidence of policy uncertainty effects in studies that use micro data, which allows for more compelling identification strategies. See, for example, Handley and Limao (2015), Baker et al. (2016), Gulen and Ion (2016), and Hassan et al. (2016). 16 We explore the responses of different components of industrial production to innovations in the EPU index by running separate VARs, replacing the overall industrial production in the baseline VAR with different components.

25
25
Figure 11. Impulse Responses to Unit Standard Deviation EPU Innovation, Monthly Data
-.0015
-.001
-.0005
0
.0005
0 2 4 6 8 10 12 14 16 18 20 22 24
Response of Log Employment
month
-.014
-.012
-.01
-.008
-.006
-.004
-.002
0
.002
.004
0 2 4 6 8 10 12 14 16 18 20 22 24
Response of Log Industrial Production
month
-.004
-.003
-.002
-.001
0
.001
0 2 4 6 8 10 12 14 16 18 20 22 24
Response of Log Tertiary Activity Index
month
-.002
-.001
0
.001
0 2 4 6 8 10 12 14 16 18 20 22 24
Response of Log Synthetic Consumption Index
month
-.005
0
.005
0 2 4 6 8 10 12 14 16 18 20 22 24
Response of Log Industrial Production-Consumption Goods
month
-.02
-.01
0
.01
0 2 4 6 8 10 12 14 16 18 20 22 24
Response of Log Industrial Production-Investment Goods
month

26
26
Figure 12. Impulse Responses to Unit Standard Deviation EPU Innovation, Quarterly Data
0
.1
.2
0 5 10
Response of Log EPU Index
quarter
-.0035
-.003
-.0025
-.002
-.0015
-.001
-.0005
0
.0005
0 5 10
Response of Log Employment
quarter
-.006
-.004
-.002
0
.002
0 5 10
Response of Log GDP
quarter
-.02
-.01
0
.01
0 5 10
Response of Log Investment
quarter

27
Figure13.HistoricalContributionofJapanEPUShockstoGDPandInvestmentFluctuations,QuarterlyData
Finally, Figure A.5 compares (a) the impulse responses of gross investment and GDP to policy uncertainty shocks using our Japan EPU index to (b) the corresponding responses using the Japan EPU index in Baker et al. (2016). For both investment and GDP, our Japan EPU index generates larger impulse responses and somewhat tighter confidence bands.17 These comparisons highlight the benefits from the additional steps we undertook to refine and improve the original Japan EPU index in Baker et al. (2016).
17 The peak effect on GDP is 0.38 percent using our Japan EPU index, while it is 0.18 using the Japan EPU index in Baker et al. (2016). The peak effect on investment is 1.1 percent using our Japan EPU index, while it is 0.6 using the Japan EPU index in Baker et al. (2016). Monthly results (not reported in the paper) also show a larger effect of EPU on macroeconomic performance using our Japan EPU index.
-0,08
-0,06
-0,04
-0,02
0,00
0,02
0,04
0,06
0,08
1987Q3 1990Q3 1993Q3 1996Q3 1999Q3 2002Q3 2005Q3 2008Q3 2011Q3 2014Q3
Log RealInvestment
Log RealGDP

28
28
Figure 14. Robustness to Alternative VAR Specifications with Quarterly Data: GDP Impulse Responses to a Unit Standard Deviation Japan EPU Innovation
-.006
-.004
-.002
0
.002
0 5 10
Including Japan Implied Equity Volatility
quarter
-.004
-.002
0
.002
0 5 10
EPU after Nikkei Index
quarter
-.004
-.002
0
.002
0 5 10
EPU Last
quarter
-.004
-.002
0
.002
0 5 10
Including Global EPU, Ordering It First
quarter
-.006
-.004
-.002
0
.002
0 5 10
Post-1995 Period
quarter
-.004
-.002
0
.002
0 5 10
Pre-2007 Period
quarter

29
V. CONCLUDING REMARKS
We construct several new measures of economic policy uncertainty for Japan. Our measures reflect frequency counts of articles in major Japanese newspapers that contain specific terms related to the economy, policy matters and uncertainty.
Our overall EPU index co-varies positively with implied volatilities for Japanese equities, exchange rates and interest rates, and with a survey-based measure of political uncertainty. Our Japan EPU index rises around contested national elections and major leadership transitions. It peaks during the Asian Financial Crisis and in reaction to the Lehman Brothers failure, U.S. debt-ceiling fight in 2011, Brexit referendum, and Japan’s recent consumption tax-hike deferral. Terms related to fiscal policy appear in about 57 percent of all articles that meet our EPU criteria. Terms related to monetary policy appear in about 27 percent, while terms related to trade and exchange rate policy appear less often. These results point to fiscal policy concerns as the most important proximate source of policy uncertainty in Japan.
In VAR investigations, upward EPU innovations foreshadow declines in aggregate employment, output, consumption and investment. Investment responds much more than consumption expenditures, and output responds much more in sectors that produce capital goods. These results survive when we include option-implied equity price volatility in the VAR system. When we include a Global EPU measure, both Japan EPU and Global EPU shocks yield material, statistically significant output and investment responses. This result suggests the effects of policy uncertainty shocks spill across national borders, in line with other evidence in Colombo (2013), International Monetary Fund (2013), Klössner and Sekkel (2014), Julio and Yook (2016), and Costantinescu (2017).
While it is hard to establish causal effects, we see our results as favoring the view that high policy uncertainty undermines macroeconomic performance. It may do so by acting as an impulse behind fluctuations, as a mechanism for amplifying and propagating causal impulses that originate elsewhere, or both. We also stress that past policy decisions and institutions shape the policy uncertainty response to contemporaneous economic shocks. In particular, well-designed policy institution and rules can limit the scope for negative shocks to trigger large jumps in policy uncertainty.
Our evidence and discussion suggest that credible policy plans and strong policy frameworks can favorably influence macroeconomic performance by, in part, reducing policy uncertainty. In the Japanese context, credible plans to follow through on trade reforms would promote trade-creating investments. Credible medium-term budget plans would foster confidence about Japan’s fiscal trajectory. Further efforts to improve the BOJ’s communications framework would lessen uncertainty about the direction of monetary policy.

30
REFERENCES
Aastveit, K. A., G. J. Natvik and S. Sola, 2013. “Economic Uncertainty and the Effectiveness of Monetary Policy,” Norges Bank Working Paper, 2013-17. Alexopoulos, M. and J. Cohen, 2015. “The Power of Print: Uncertainty Shocks, Markets, and the Economy,” International Review of Economics and Finance, 40, 8-28. Anand, R. and V. Tulin, 2014. “Disentangling India’s Investment Slowdown,” IMF Working Paper 14/47. Arellano, C., Y. Bai, and P. Kehoe, 2010. “Financial Markets and Fluctuations in Uncertainty,” Working paper, Federal Reserve Bank of Minneapolis. Azzimonti, M., 2015. “Partisan Conflict and Private Investment,” NBER Working Paper 21723. Baker, S. R., N. Bloom, and S. J. Davis, 2012. “Has Economic Policy Uncertainty Hampered the Recovery,” in Lee Ohanian, John B. Taylor and Ian Wright, editors, Government Policies and the Delayed Economic Recovery, Hoover Institution Press. Baker, S. R., N. Bloom, and S. J. Davis, 2016. “Measuring Economic Policy Uncertainty,” Quarterly Journal of Economics, 131, no. 4 (November), 1593-1636. Ball, L., 2014. “The Case for a Long-Run Inflation Target of Four Percent,” IMF Working Paper 14/92. Bar-Ilan, A. and W. Strange, 1996. “Investment lags,” American Economic Review, 86, no. 3, 610-622. Bernanke, B. S. 1983. “Irreversibility, Uncertainty, and Cyclical Investment.” Quarterly Journal of Economics, 98(1): 85 –106. Bertola, G., L. Guiso and L. Pistaferri, 2005. “Uncertainty and Consumer Durables Adjustment,” Review of Economic Studies,72, no. 4, 973-1007. Blachard, O., G. Dell’Arriccia and P. Mauro, 2010. “Rethinking Macroeconomic Policy,” IMF Staff Position Note SPN/10/03, 2010. Bloom, N., 2009. “The Impact of Uncertainty Shocks,” Econometrica, 77 no. 3 (May), 623-685. Bloom, N., 2014. “Fluctuations in Uncertainty,” Journal of Economic Perspectives, Volume 28, No: 2, Spring 2014, p. 153-176. Bloom, N., S. Bond, and J. van Reenen, 2007. “Uncertainty and Investment Dynamics,” Review of Economic Studies, 74, 391-415.

31
Bloom, N., M. Floetotto, N. Jaimovich, I. Saporta-Eksten, and S. J. Terry. 2012. “Really Uncertain Business Cycles.” NBER Working Paper 18245. Cecchetti, S. and K. Schoenholtz, 2016. “The Bank of Japan at the Policy Frontier,” VoxEU, 7 December. Colombo, V., 2013. “Economic policy uncertainty in the US: Does it matter for the Euro area?” Economics Letters, 121(1): 39-42. Christiano, L. J., R. Motto, and M. Rostagno, 2014. “Risk Shocks.” American Economic Review 104(1): 27–65. Constantinescu, C., Aaditya M., and M. Ruta, 2017. “Trade Developments in 2016: Policy Uncertainty Weighs on World Trade,” World Bank Global Trade Watch. Davis, S.J., 2017. “Regulatory Complexity and Policy Uncertainty: Headwinds of Our Own Making”, mimeo, University of Chicago. Davis, S.J., 2016. “An Index of Global Economic Policy Uncertainty.” NBER Working Paper No. 22740, October. Dixit, A. K., and R. S. Pindyck. 1994. “Investment under Uncertainty.” Princeton: Princeton University Press. Durnev, A., 2012. “The Real Effects of Political Uncertainty: Elections and Investment Sensitivity to Stock Prices." Mimeo, University of Iowa. Eberly, J., 1994. “Adjustment of Consumers’ Durables Stocks: Evidence from Automobile Purchases,” Journal of Political Economy, 102, no. 3, 403-436. Fátas, A. and I. Mihov, 2013. “Policy Volatility, Institutions, and Economic Growth,” Review of Economics and Statistics, May 2013, Vol. 95, No. 2, p. 362-376. Fernandez-Villaverde, J., P. Guerron-Quintana, K. Kuester, and J. Rubio-Ramirez, 2015. “Fiscal volatility shocks and economic activity,” American Economic Review, 105, No. 11 (November). Giavazzi, F. and M. McMahon, 2012. “Policy Uncertainty and Household Savings” Review of Economics and Statistics 94(2), 517-531. Gilchrist, S., J. Sim, and E. Zakrajˇsek, 2014. “Uncertainty, Financial Frictions, and Investment Dynamics,” Working paper, Finance and Economics Discussion Series, Divisions of Research & Statistics and Monetary Affairs Federal Reserve Board, Washington, D.C. 2014-69. Grier, K. and M. Perry, 2000. “The Effects of Real and Nominal Uncertainty on Inflation and Output Growth: Some GARCH-M Evidence”, Journal of Applied Econometrics, 17, 45-58.

32
Gulen, H. and M. Ion, 2016. “Policy uncertainty and corporate investment,” Review of Financial Studies, 29, no. 3 (March), 523-564. Handley, K. and N. Limao, 2015. “Trade and Investment under Policy Uncertainty: Theory and Firm Evidence,” American Economic Journal: Policy, 7, no. 4, 189-222. Hassan, Tarek, Stephan Hollander, Laurence van Lent and Ahmed Tahoun, 2016. “Aggregate and Idiosyncratic Political Risk: Measurement and Effects,” working paper, September. Hlatshwayo, S. and M. Saxegaard 2016. “The Consequences of Policy Uncertainty: Disconnects and Dilutions in the South African Real Effective Exchange Rate-Export Relationship”, IMF Working Paper No: 16/113. Husted, L., J. Rogers, and B. Sun, 2016a, “Measuring Monetary Policy Uncertainty: The Federal Reserve, January 1985-January 2016,” IFDP Notes, Board of Governors of the Federal Reserve System, April 2016. Husted, L., J. Rogers, and B. Sun, 2016b, “Measuring Cross Country Monetary Policy Uncertainty," IFDP Notes, Board of Governors of the Federal Reserve System, November 23. International Monetary Fund, 2012. “World Economic Outlook: Coping with High Debt and Sluggish Growth,” IMF Press, October 2012. International Monetary Fund, 2013. “World Economic Outlook: Hopes, Realities, Risks,” IMF Press, April 2013. Ito, A., 2016. “Government Policy Uncertainty and Economic Activities”, RIETI Discussion Paper Series, 16-J-016. Johannsen, B., 2014. “When are the Effects of Fiscal Policy Uncertainty Large?”, Finance and Economics Discussion Series 2014-40, Federal Reserve Board, Washington DC. Julio, B. and Y. Yook, 2012. “Political Uncertainty and Corporate Investment Cycles,” Journal of Finance, 67, no. 1 (February), p. 45-83. Julio, B. and Y. Yook, 2016. “Policy Uncertainty, Irreversibility, and Cross-Border Flows of Capital,” Journal of International Economics, 103, 13-26. Jurado, K. S. C. Ludvigson and S. Ng, 2015, “Measuring Uncertainty,” American Economic Review, 105, No. 3 (March), p. 1177-1216. Kelly, B., L. Pastor and P. Veronesi, 2016. “The Price of Political Uncertainty: Theory and Evidence from the Option Market,” Journal of Finance, 71, no. 5 (October), 2417-2480. Kitao, S., 2016. “Policy Uncertainty and the Cost of Delaying Reform: A case of aging Japan”, RIETI Discussion Paper Series, 16-E-013.

33
Klössner, S. and R. Sekkel, “International Spillovers of Policy Uncertainty,” Economics Letters, 124, no. 3 (2014), 508-512. Leduc, S. and Z. Liu, 2016. “Uncertainty Shocks Are Aggregate Demand Shocks,” Journal of Monetary Economics, 82 (September), 20-35. Ludvigson, S. C., S. Ma and S. Ng, 2015. “Uncertainty and Business Cycles: Exogenous Impulse or Endogenous Response?”, NBER Working Paper No. 21803, December 2015. Matsuura, T., 2013. “Why Did Manufacturing Firms Increase the Number of Non-regular Workers in the 2000s? Does International Trade Matter?” RIETI Discussion Paper, 13-E-036. McDonald, R. and D. Siegel, 1986. “The Value of Waiting to Invest,” Quarterly Journal of Economics 101(4): 707–728. Morikawa, M., 2010. “Volatility, Nonstandard Employment, and Productivity: An Empirical Analysis Using Firm-Level Data,” RIETI Discussion Paper, 10-E-025. Morikawa, M., 2013. “What Type of Policy Uncertainty Matters for Business?” RIETI Discussion Paper Series 13-E-076. Morikawa, M., 2016. "How Uncertain Are Economic Policies? Evidence from a survey on Japanese firms." RIETI Policy Discussion Paper Series 16-P-008. Ono, Y. and D. Sullivan, 2013. “Manufacturing Plants' Use of Temporary Workers: An Analysis Using Census Microdata,” Industrial Relations, Vol. 52, No. 2, pp. 419-443. Paddock, J.L., D.R. Siegel and J.L. Smith, 1988. “Option Valuation of Claims in Real Assets: The Case of Offshore Petroleum Leases,” Quarterly Journal of Economics, 103, no. 3 (August), 479-508. Pastor, L. and P. Veronesi, 2013. “Political Uncertainty and Risk Premia,” Journal of Financial Economics, December 2013, 110, 3, p. 520-545 Romer, C., 1990. “The Great Crash and the Onset of the Great Depression,” Quarterly Journal of Economics, August 1990, Vol. 105, No. 3, p. 597-624. Schaal, E., 2015. “Uncertainty and Unemployment”, mimeo, NYU. Stock, J. H. and M. W. Watson, 2012. “Disentangling the Channels of the 2007-09 Recession,” Brookings Papers on Economic Activity, Spring 2012, p. 81-156. Vavra, Joseph, 2014. “Inflation Dynamics and Time-Varying Volatility: New Evidence and an Ss Interpretation,” Quarterly Journal of Economics, 129, no. 1, 215-258.

34
Valletta, R. and L. Bengali, 2013. “What’s Behind the Increase in Part-time Work?” San Francisco Federal Reserve Bank Economic Letter, August 26. Vitek, F., 2002. “An Empirical Analysis of Dynamic Interrelationships Among Inflation, Inflation Uncertainty, Relative Price Dispersion, and Output Growth”, Bank of Canada Working Paper, 39.

35
APPENDIX
Additional Information about Our Japan Economic Policy Uncertainty Indices We used Nikkei Telecom18 as the main interface to access the archives of the four Japanese-language newspapers. We used Kikuzo II to obtain data on the total number of newspaper articles and the number of articles meeting the E, P, and U criteria each month for the Asahi Shimbun. We also used MAISAKU for the Mainichi Shimbun and Yomidas Rekishikan for the Yomiuri Shimbun. As the first step in constructing the EPU index, we conducted an extensive analysis of the archives for the four newspapers to ensure that potential changes in their coverage do not bias our results, and to ensure we have a consistent measure of uncertainty over time. For example, the inclusion of a new section on arts and fashion can lead to a spurious movement in our index by artificially increasing the total number of articles that are used to scale the number of economic policy uncertainty articles. For each newspaper, we identified the reasons behind large movements in the total number of articles available over time and potential changes in seasonality. Based on this exercise, we decided to exclude local newspaper editions of national papers, as they introduced significant jumps in the total number of articles and the local edition content typically had little to do with policies or economic matters at a national level. The availability and coverage of archives dictated the start of our sample (January 1987) and the newspapers we used. We identified our term sets in several steps using small-scale audits. We first used the English-language versions of the newspapers to search for articles that contain the keywords for economic uncertainty used in Baker et al. (2016).19 We then randomly selected articles every year and went to the Japanese version of the same article to make a list of potential keywords in Japanese. We identified two keywords, “経済” and “景気”, as the Japanese term for “economy” or “economic” and identified six keywords, “不透明”, “不安”, “微妙”, “不確実”, “不安定”, and “不確定” for “uncertainty” or “uncertain”. We then conducted a small-scale audit to narrow down our set of “uncertainty” or “uncertain” terms, drawing randomly selected articles in Japanese that contain both “経済” and one of the six keywords. For each keyword, we determined whether the context was indeed related to “uncertainty” or “uncertain”. This exercise led us to narrow down our keywords for “uncertainty” or “uncertain” to four words in Japanese, “不透明”, “不安”, “不確実” and “不確定”. As a check on our “economic” and “uncertainty” keywords, we constructed an “economic uncertainty” index and confirmed that it had the expected correlation with the economic cycle and other measures of economic uncertainty (such as stock market volatility indices). As expected, the economic uncertainty and economic policy uncertainty indices are highly correlated. About 65 percent of articles that contain the “economy” and “uncertainty” keywords also contain one of our “policy” terms. There is, however, meaningful variation over time in this ratio—with a minimum of 0.45 and a maximum of 0.8—suggesting that the EPU index contains additional information on policies and economic uncertainty.
18 Nikkei Telecom covers leading Japanese newspapers, magazines and journals, and cross-searchable from over 400 different sources. 19 These are “uncertain” or “uncertainty” and “economic” or “economy”.

36
We identified the “policy” keywords using a similar approach. We started with a broad group of potential keywords informed by our priors, reading through numerous articles and similar newspaper-based indices constructed for the US and Japan in Baker et al. (2016). Using this initial set of terms, we conducted another round of audits using the English versions of Nikkei and Yomiuri to identify the Japanese words that best capture the corresponding English-language words. In choosing the keywords for different policy categories (Table 2), we started with a comprehensive set of potential words informed by our priors and our reading of newspaper articles and the government’s Annual Report on the Japanese Economy and Public Finance (Economic and Fiscal Policy Whitepaper) since 1987. At the second stage, we eliminated terms likely to trigger many false positives such as “interest rate” for monetary policy or “public works” for fiscal policy.20
Detailed Description of Episodes with Heightened Economic Policy Uncertainty In this section, we provide more details about episodes when our EPU index either reached high levels or increased significantly in any given month, both defined as movements exceeding 1.64 standard deviations from their average levels. We review these episodes in chronological order below. October 1987: Several events were associated with heightened policy uncertainty during this period. On October 20th, Prime Minister Nakasone officially announced his nomination of Noboru Takeshita as the next LDP President. PM Nakasone held the position for two consecutive terms and could not run a third time. Other candidates were Shintaro Abe and Kiichi Miyazawa. Second, on the 19th of October, stock markets around the world collapsed—an event also known as Black Monday. Asian markets including the Nikkei tumbled with the opening of markets on Tuesday. Heightened volatility in the Tokyo Stock Exchange led the BOJ to inject liquidity. Yen appreciated sharply and was followed by FX intervention by the Ministry of Finance. March 1995: With the bursting of the asset price boom in early 1990s, Japan’s financial institutions had faced considerable pressure resulting in the failure of several credit institutions. In March, the failures of two credit cooperatives, Toyo Kyowa and Anzen, were handled by establishing a new bank, Tokyo Kyodo Bank. The new bank received an infusion of capital contributions from the BOJ. This rescue plan was heavily criticized and received opposition in the metropolitan congress given that the management of the bank had been involved in fraudulent activity. The use of government funds to rescue an institution that had failed because of fraud was questioned, even though management was purged and prosecuted. At the same time the Japanese yen surged reflecting interest rate differentials, despite coordinated FX intervention with Germany and the US.
20 Baker et al. (2016) conduct an extensive human audit of articles to measure the accuracy of their US EPU index and to optimize their choice of policy terms. However, our interface for accessing the digital archives of Japanese newspapers does not allow automated searches. Since we cannot conduct automated searches, we cannot optimize over tens of thousands of possible term set combinations in the same manner as Baker et al. (2016).

37
November-December 1997: This period coincides with the intensification of the Asian financial crisis. In November 1997, Korea was struck with a currency and banking crisis. On the domestic front, PM Hashimoto's fiscal consolidation plan faced headwinds due to bankruptcy of financial institutions. Policy debate intensified whether to interrupt the fiscal consolidation process due to the economic downturn. PM Hashimoto decided to provide a tax break of JPY 2 trillion (financed by JGB issuance) but to continue with fiscal consolidation. July-August 1998: Mr. Obuchi replaced Mr. Hashimoto as PM on July 30 as their ruling party lost many seats in the Upper House elections on July 12. The resulting Twisted Diet heightened political uncertainty when restoring the health of the financial sector was still a priority. PM Obuchi submitted Finance Revitalization Bill—a legislation that overhauled financial regulation in Japan, establishing the Financial Reconstruction Commission to manage and dispose nationalized assets—but faced objections at the Twisted Diet (the Bill passed in October 1998). Ruling and opposition parties clashed on the public bailout of Long-Term Credit Bank (LTCB was nationalized in October 1998). On the international front, the Russian financial crisis erupted in August, raising uncertainty and weakening the global economic outlook. June 2000: The ruling parties took a big loss at the Lower House elections (reduction in their share from 66 to 56 percent; the LDP lost the majority) due to PM Mori’s unpopularity, but they maintained the government. February-March 2001: The BOJ cut the policy rate by 10 bps from 0.25 to 0.15 percent on February 28. Discussion intensified on quantitative easing as the policy rate neared the zero lower bound. On March 19, the BOJ introduced QE (switching the monetary policy target from the overnight call rate to the current account balance). PM Mori's approval rate had been on the decline and went below 10 percent partly because he mishandled a maritime accident in February. He was reported in March to resign soon (Mr. Koizumi replaced him after winning the LDP presidency in April). July 2001: PM Koizumi won the Upper House election. PM Koizumi's administrative reform triggered debate between fiscal consolidation and fiscal expansion. PM Koizumi was transforming traditional decision-making process. One key pillar was his heavy usage of the Council on Economic and Fiscal Policy (CEFP) to discuss big-picture policy issues. The CEFP produced its first annual report, Honebuto-no-Hoshin (big-boned principles), on June 26. October 2002: Conflict intensified between Koizumi administration and LDP regarding NPL issues. PM Koizumi dismissed the Minister of State for Financial Services, Hakuo Yanagisawa, and appointed Heizo Takenaka. Minister Takenaka submitted the Financial Revitalization Plan (known as the Takenaka Plan), which forced banks to apply a stricter approach for asset evaluation, to raise banks reserves and to compress deferred tax assets. If banks were evaluated as insolvent, public money was injected (e.g. Resona Bank and Ashikaga Bank). This plan was regarded as a hard landing scenario for the financial sector, and was opposed by LDP and the banking industry. The BOJ eased monetary policy by increasing the current account balances from JPY 10-15 trillion to 15-20 trillion, and by raising long-term JGB purchases from JPY 1 trillion to 1.2 trillion per month.

38
March 2008: The Twisted Diet produced two large uncertainties. First, the government was trying to pass a tax law on gasoline before the end of the fiscal year (March), but eventually failed. Second, the nomination of the BOJ Governor was rejected a few times. Deputy Governor Masaaki Shirakawa became Acting Governor on March 20 and then Governor on April 9. September-October 2008: The global financial crisis “started” with the bankruptcy of the Lehman Brothers in September 2008. The Japanese economy shrank by 12.4 and 15.4 percent (saar) in the fourth quarter of 2008 and the first quarter of 2009, respectively. The Nikkei plummeted to below 7,000 from around 12,000 before the bankruptcy; the yen appreciated from around 120 in 2007 to 93 per dollar by end-2009. The global economy collectively and individually responded: the first G20 Summit took place in November 2008 in Washington, D.C. The Japanese government formulated two supplementary budgets in October 2008 and January 2009. The BOJ reduced the policy rate twice in October and December 2008. February 2009: The government published its estimate of growth of the fourth quarter of 2008 at negative 12.4 percent, the largest decline in about 35 years. The yen depreciated by around 10 percent. The US formulated a stimulus package, the American Recovery and Reinvestment Act of 2009, after long discussions in the Congress. The rise in uncertainty seems to reflect concerns over the delay in the passage of the stimulus package in the US. May-June 2010: The European sovereign debt crisis, which had been brewed since the fiscal deficit of Greece was found much larger than previously published, accelerated in May 2010, when the first plan to rescue Greece was announced. The Nikkei lost more than 10 percent in May. The yen-dollar rate briefly went below 90. Also domestically, PM Hatoyama resigned in June less than a year after his party took power for the first time. Anticipation of a Twisted Diet as a result of the July Upper House elections seems to have contributed to the rise in economic policy uncertainty. August 2011: A law to allow deficit-financing bonds, which was always passed by the end of the previous fiscal year, finally got the Diet’s approval for fiscal year 2011 (starting in April) in August posing risk of a Japanese “fiscal cliff”. The delay was due to a Twisted Diet caused by the ruling parties’ loss of the majority in the Upper House in the July 2010 election. In Europe, in addition to Greece, Ireland and Portugal had started receiving financial support from the troika, but interest rates on their debt were on the rise leading to the intensification of the European debt crisis. The yen had been below 80 against the dollar since mid-July. S&P announced in July that it was putting US sovereign debt rating on negative watch which was later followed up with a downgrade in August. The US debt ceiling conflict was only recently resolved (at the end of July) but the solution to the conflict did not raise confidence in the future course of US fiscal policy and left open the possibility of the use of the debt ceiling in future budgetary conflicts. Responding to appreciation which resumed after the March 2011 earthquake, the Japanese government intervened in the foreign exchange market. June 2012: The three major parties including the ruling DPJ and the largest opposition party, LDP, accelerated discussions on a comprehensive reform of tax and social security systems in June. They reached an agreement on the 21st, which included a two-step consumption tax

39
increase in April 2014 and October 2015. Leading up to the agreement, policy uncertainty was elevated reflecting conflicts within DPJ on tax and social security reform. January-February 2016: Beginning of 2016 was associated with significant policy uncertainty related to the announcement of negative interest rates on January 29th. Leading up to the January decision, there was significant speculation about the BOJ’s next policy move amid declining inflation momentum, rising risks from emerging markets and yen appreciation. The decision came as a surprise to market participants, with Governor Kuroda ruling out negative rates earlier. The negative rate decision lowered the whole yield curve and initially led to the depreciation of the currency. However, the effect on the exchange rate was short-lived and inflation expectations continued to decline. There were concerns about the implications of negative rates on the banking sector, which also contributed to the perception of limited policy space and effectiveness. The policy move was also highly unpopular within the general public and led to concerns about the implications for returns earned on bank deposits. May-June 2016: During May-June 2016 there were rising concerns globally and in Japan about a potential exit of Great Britain from the EU. The yen appreciated substantially as a result. The decision by voters to leave the EU on June 23rd shocked markets and the yen appreciated further. The BOJ noted the heightened global economic uncertainty in its July meeting and doubled its purchase of ETFs and expanded its US dollar lending program to ensure smooth funding conditions. During this period, there was also rising uncertainty about whether PM Abe would postpone the consumption tax hike scheduled for April 2017. There were mixed reports and speculation leading up to the decision on June 1st. On the one hand, there was significant pressure to reinforce fiscal sustainability and credibility. With the consumption tax hike being delayed earlier in 2015 and the 2017 tax hike legislated to take place without explicit escape clauses, the political hurdle to postpone the tax hike was perceived to be high. On the other hand, upcoming Upper House elections and weakness in economic outlook were perceived as potential reasons for delaying the tax hike. PM Abe had earlier said that they would go ahead with the tax hike unless there was an economic shock comparable to the 2008 global financial crisis or the 2011 Great East Japan Earthquake. While the postponement of the tax hike was received well by the public, it also led to significant uncertainty about the feasibility of achieving the government’s primary balance goal by 2020. November 2016-January 2017: Leading up to the elections in the US in November, policy uncertainty picked up reflecting the significant role of the US as a major trading partner and the potential implications of the election for the ratification of TPP. The election of Donald Trump came as a surprise and generated further uncertainty about the US fiscal, trade and other policies during the period immediately following the election. President Trump pulled the US out of TPP on January 23rd, 2017.
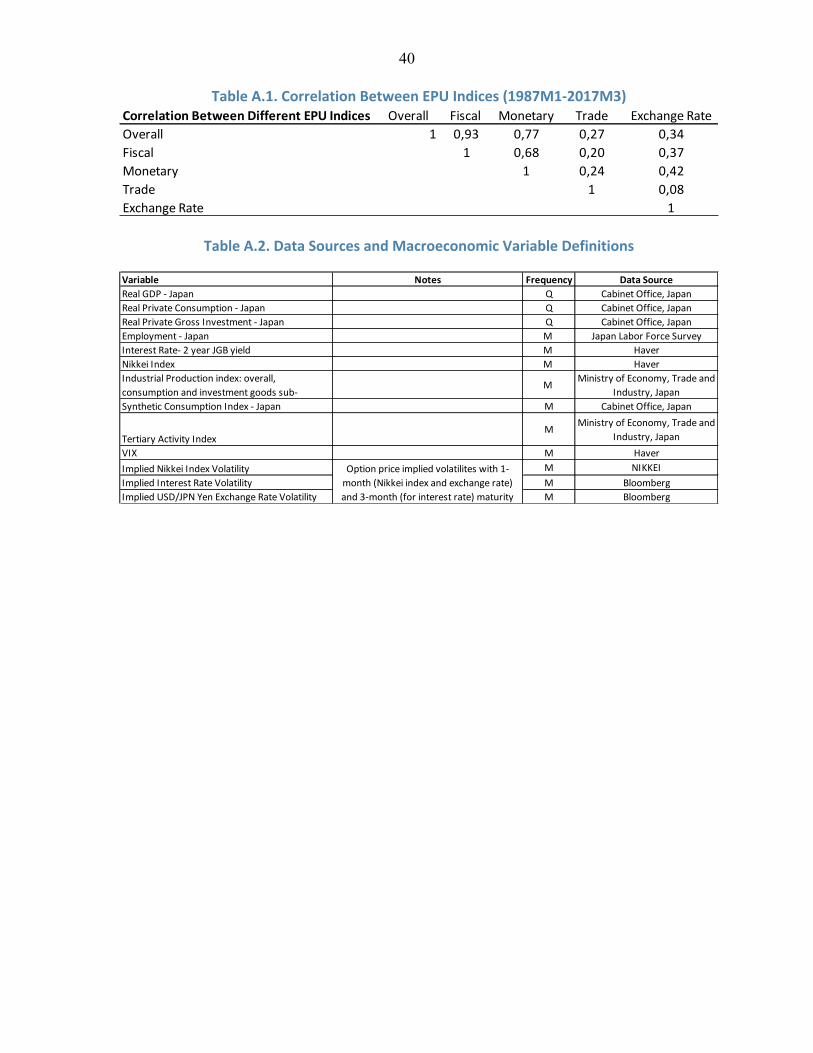
40
TableA.1.CorrelationBetweenEPUIndices(1987M1-2017M3)
TableA.2.DataSourcesandMacroeconomicVariableDefinitions
CorrelationBetweenDifferentEPUIndices Overall Fiscal Monetary Trade ExchangeRateOverall 1 0,93 0,77 0,27 0,34Fiscal 1 0,68 0,20 0,37Monetary 1 0,24 0,42Trade 1 0,08ExchangeRate 1
Variable Notes Frequency DataSourceRealGDP-Japan Q CabinetOffice,JapanRealPrivateConsumption-Japan Q CabinetOffice,JapanRealPrivateGrossInvestment-Japan Q CabinetOffice,JapanEmployment-Japan M JapanLaborForceSurveyInterestRate-2yearJGByield M HaverNikkeiIndex M HaverIndustrialProductionindex:overall,consumptionandinvestmentgoodssub-
M MinistryofEconomy,TradeandIndustry,Japan
SyntheticConsumptionIndex-Japan M CabinetOffice,Japan
TertiaryActivityIndexM MinistryofEconomy,Tradeand
Industry,JapanVIX M HaverImpliedNikkeiIndexVolatility M NIKKEIImpliedInterestRateVolatility M BloombergImpliedUSD/JPNYenExchangeRateVolatility M Bloomberg
Optionpriceimpliedvolatiliteswith1-month(Nikkeiindexandexchangerate)and3-month(forinterestrate)maturity

41
FigureA.1.OurJapanEPUIndexComparedtotheOneinBakeretal.(2016)
Note:Shadedareasindicaterecessionperiods.
FigureA.2.OurJapanMonetaryPolicyUncertaintyIndexComparedtotheOneinHusted,RogersandSun(2016b)
0
50
100
150
200
250
300
1987 1989 1991 1993 1995 1997 1999 2001 2003 2005 2007 2009 2011 2013 2015 2017
NewJapanEPUIndex Bakeret.al.(2016)
Sources:Bakeretal.(2016)andauthors'calculations.
0
100
200
300
400
500
600
1987 1989 1991 1993 1995 1997 1999 2001 2003 2005 2007 2009 2011 2013 2015
OurMonetaryPolicyUncertaintyIndexforJapan
JapanMonetaryPolicyUncertaintyIndexHusted,RogersandSun(2016b)
Sources:Husted,RogersandSun(2016b)andauthors'calculations.

42
FigureA.3.EPUInnovationsinBaselineVARSpecifications
StandardizedResidualsfromtheEPUEquation,BaselineMonthlyVARSpecification
StandardizedResidualsfromtheEPUEquation,BaselineQuarterlyVARSpecification
-4
-3
-2
-1
0
1
2
3
4
1987 1989 1991 1993 1995 1997 1999 2001 2003 2005 2007 2009 2011 2013 2015
-4
-3
-2
-1
0
1
2
3
4
1987 1989 1991 1993 1995 1997 1999 2001 2003 2005 2007 2009 2011 2013 2015

43
43
Figure A.4. Impulse Responses to Unit Standard Deviations Innovations in the Fiscal Policy and Monetary Policy Uncertainty Indices, Monthly Data
Figure A.5. Impulse Responses to Unit St. Dev. EPU Innovations in Quarterly
Data, Our Japan EPU Index Compared to the One in Baker et al. (2016)
-.012
-.01
-.008
-.006
-.004
-.002
0
.002
0 2 4 6 8 10 12 14 16 18 20 22 24
Response of Log Industrial Production to EPU-Fiscal Policy
month
-.008
-.006
-.004
-.002
0
.002
.004
0 2 4 6 8 10 12 14 16 18 20 22 24
Response of Log Industrial Production to EPU-Monetary Policy
month
-.008
-.006
-.004
-.002
0
.002
.004
0 5 10
Response of Log GDP to Our Japan EPU Index
quarter
-.008
-.006
-.004
-.002
0
.002
.004
0 5 10
Response of Log GDP to Old Japan EPU Index
quarter
-.02
-.01
0
.01
0 5 10
Response of Log Investment to Our Japan EPU Index
quarter
-.02
-.01
0
.01
0 5 10
Response of Log Investment to Old Japan Index
quarter