m: top 10 cost reduction strategies for and … m: top 10 cost reduction strategies for science...
TRANSCRIPT
Forum M: Top 10 Cost Reduction Strategies for Science Facility Operations and Maintenance
Forum M: Top 10 Cost Reduction Strategies for Science Facility Operations and Maintenance
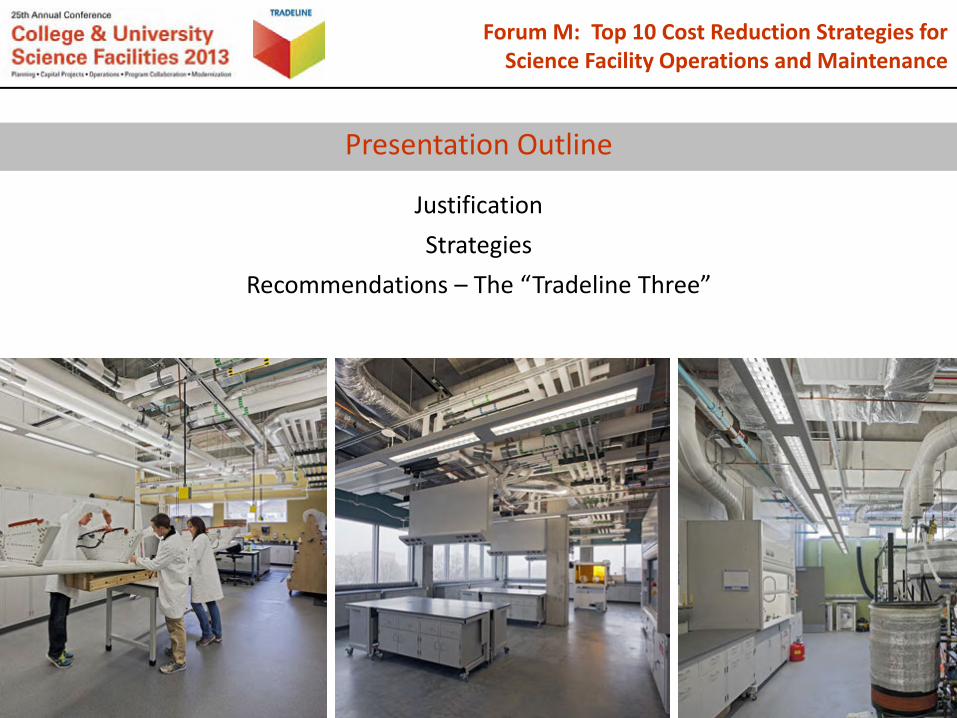
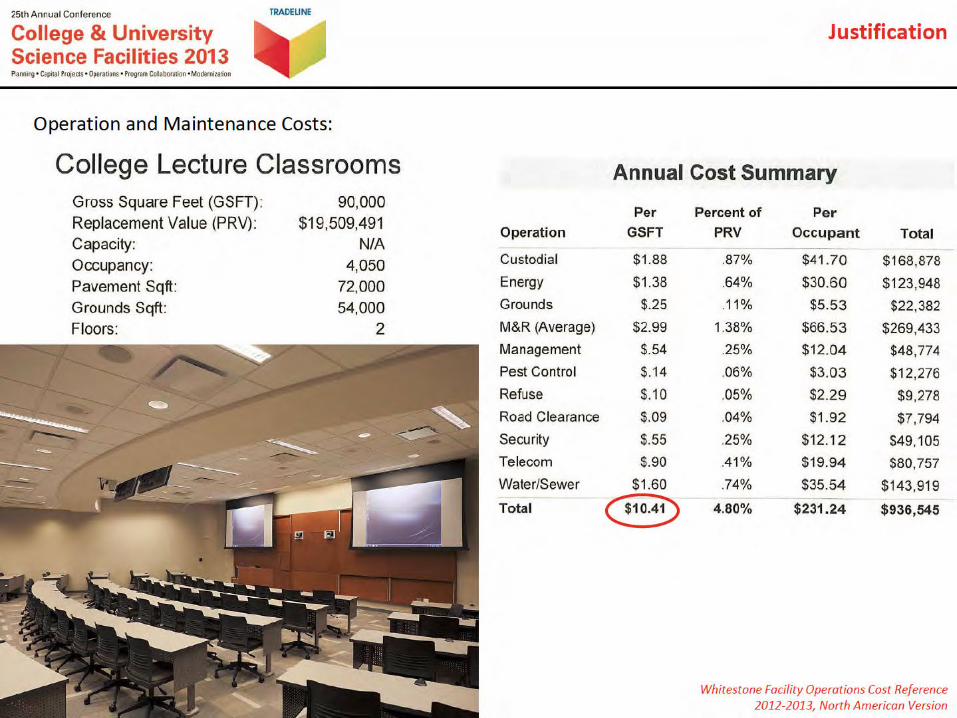
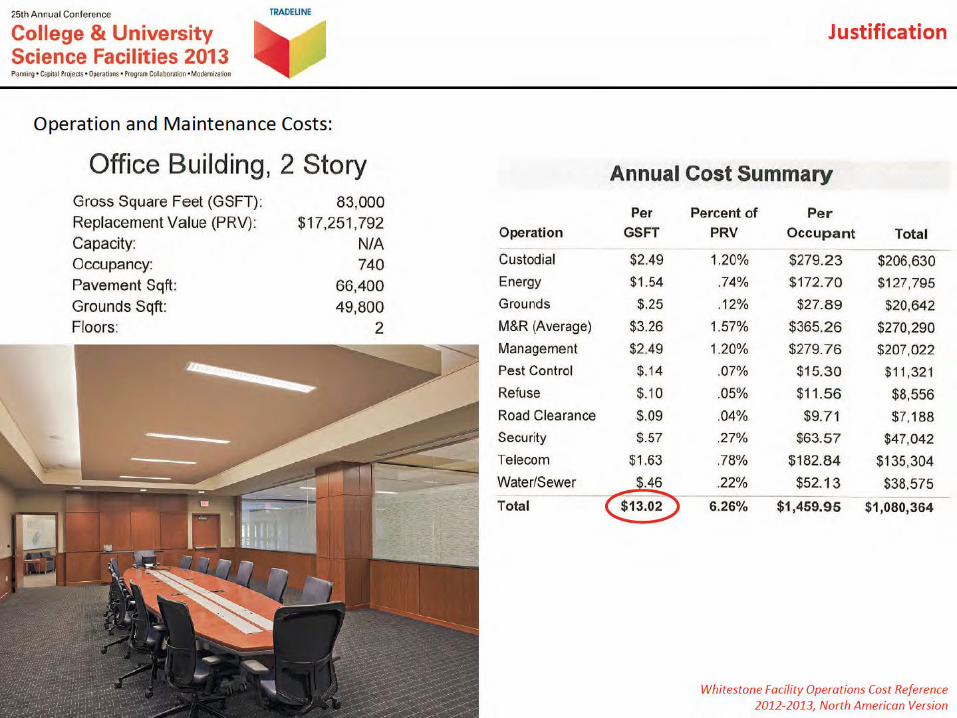
JustificationStrategies
Recommendations – The “Tradeline Three”
Presentation Outline


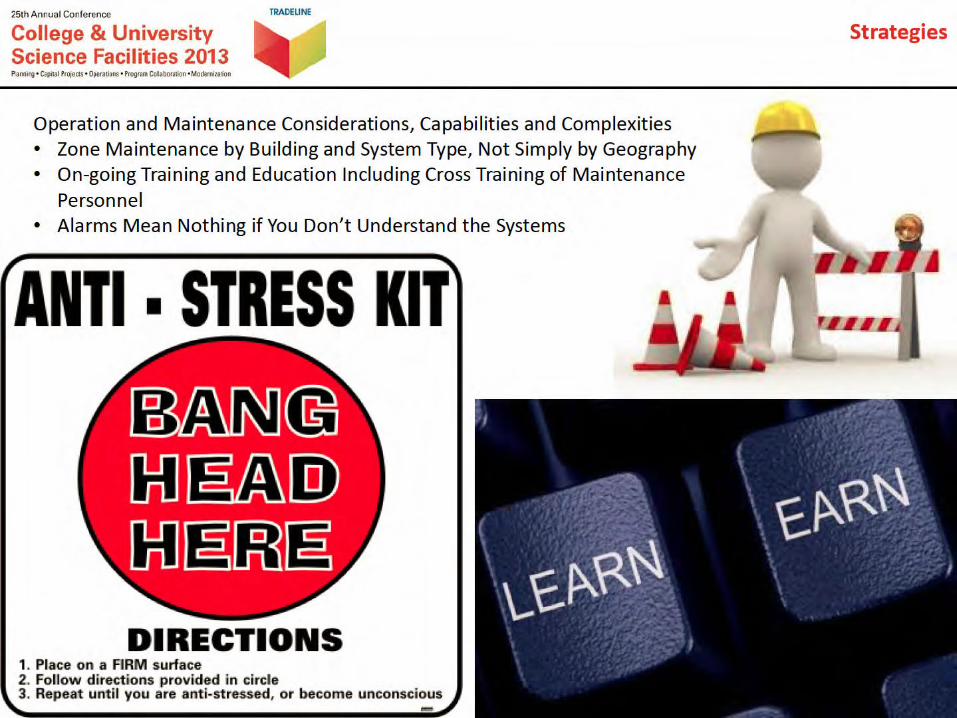
Strategies
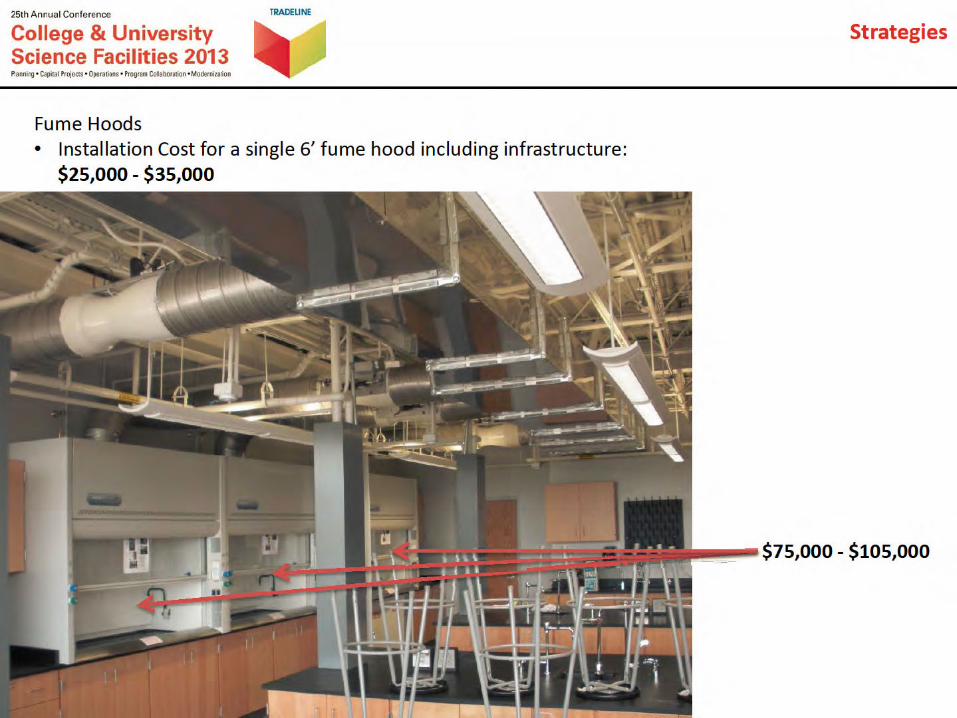
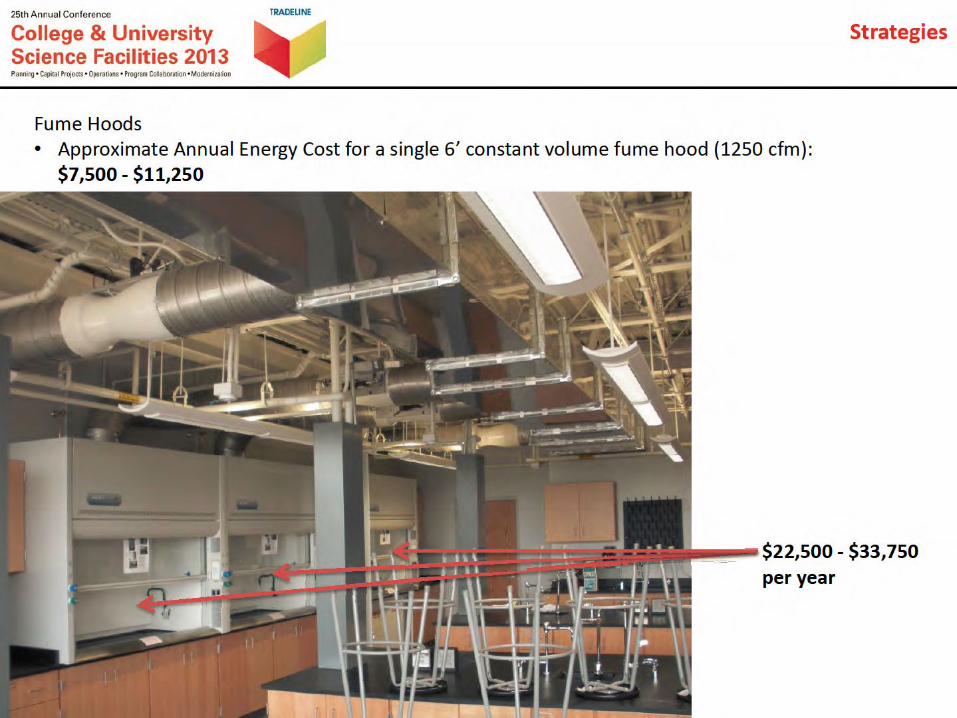
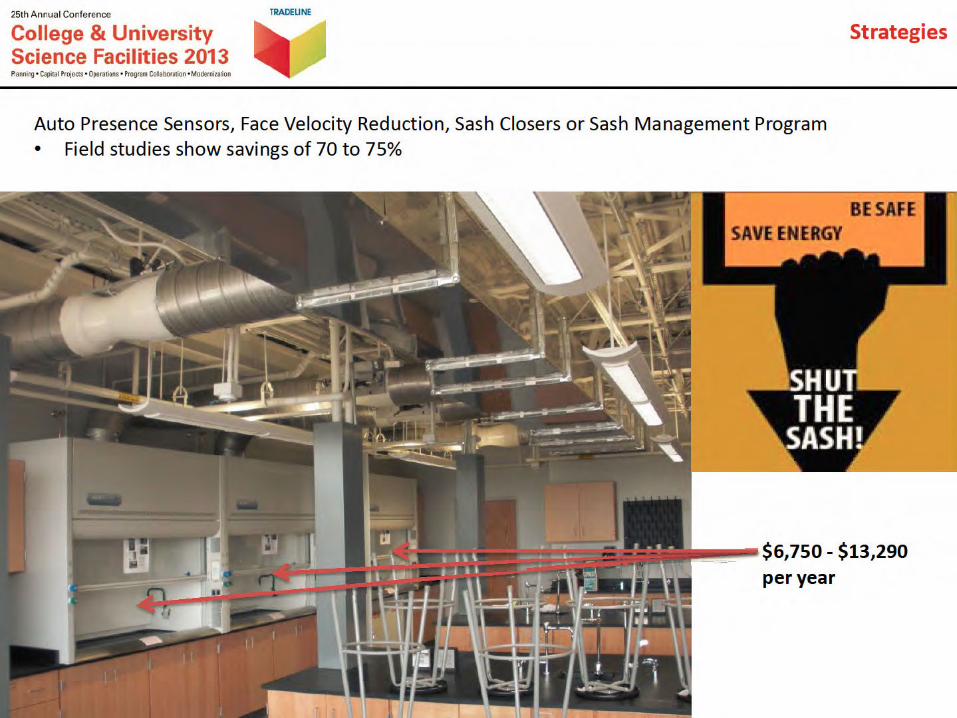
Fume Hoods• Install Only What is Needed• Consider a restricted sash opening – 18”
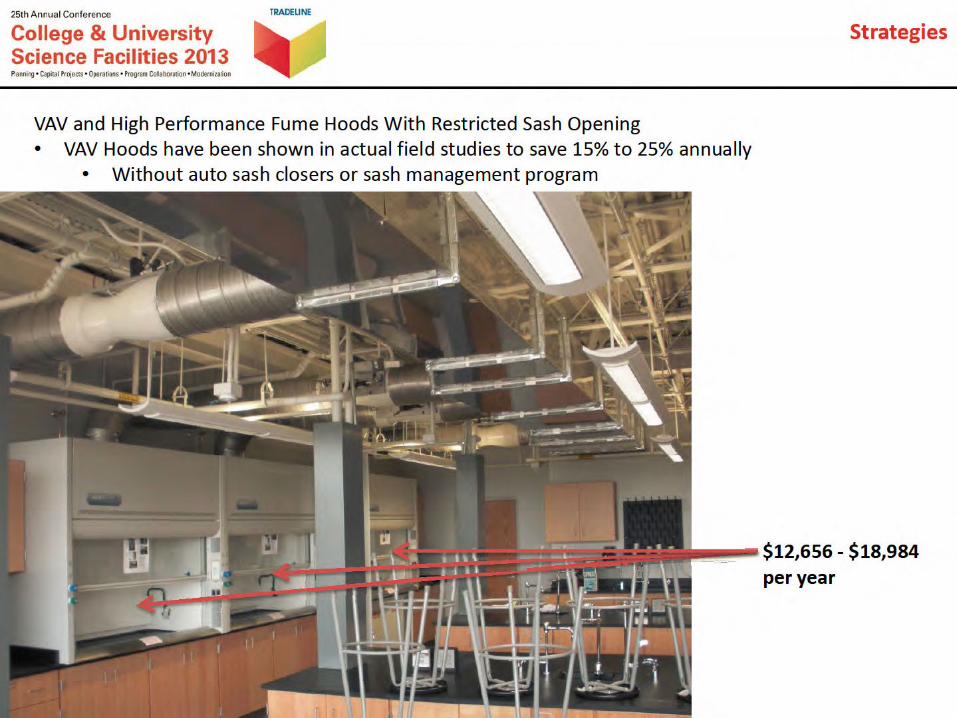
• This can save 25% of annual energy cost


Strategies
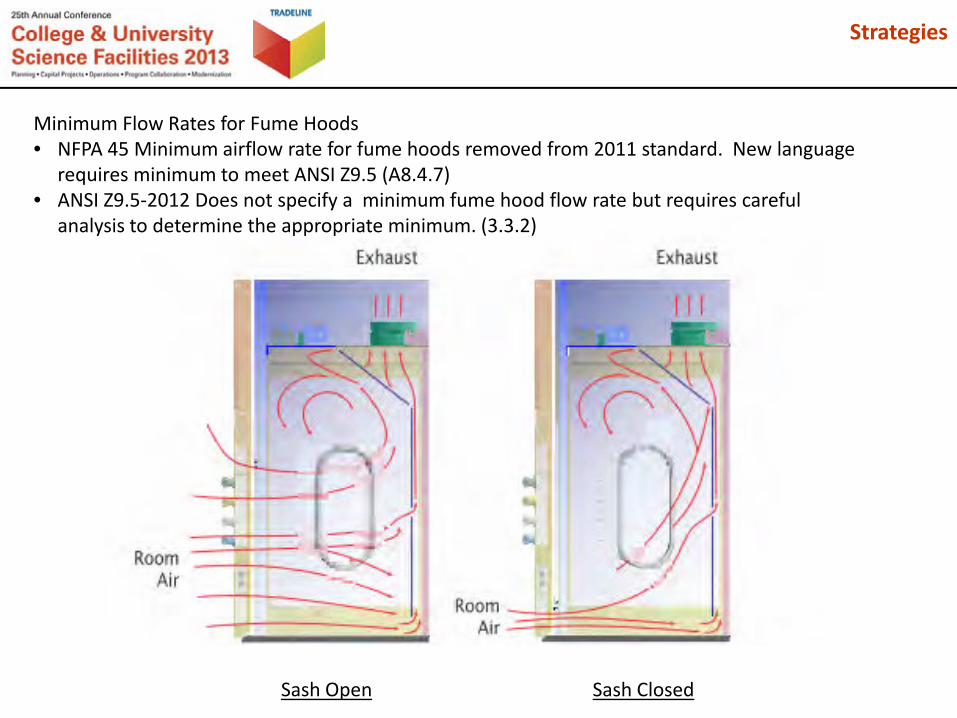
Minimum Flow Rates for Fume Hoods• NFPA 45 Minimum airflow rate for fume hoods removed from 2011 standard. New language
requires minimum to meet ANSI Z9.5 (A8.4.7)• ANSI Z9.5‐2012 Does not specify a minimum fume hood flow rate but requires careful
analysis to determine the appropriate minimum. (3.3.2)
Sash Open Sash Closed
Strategies
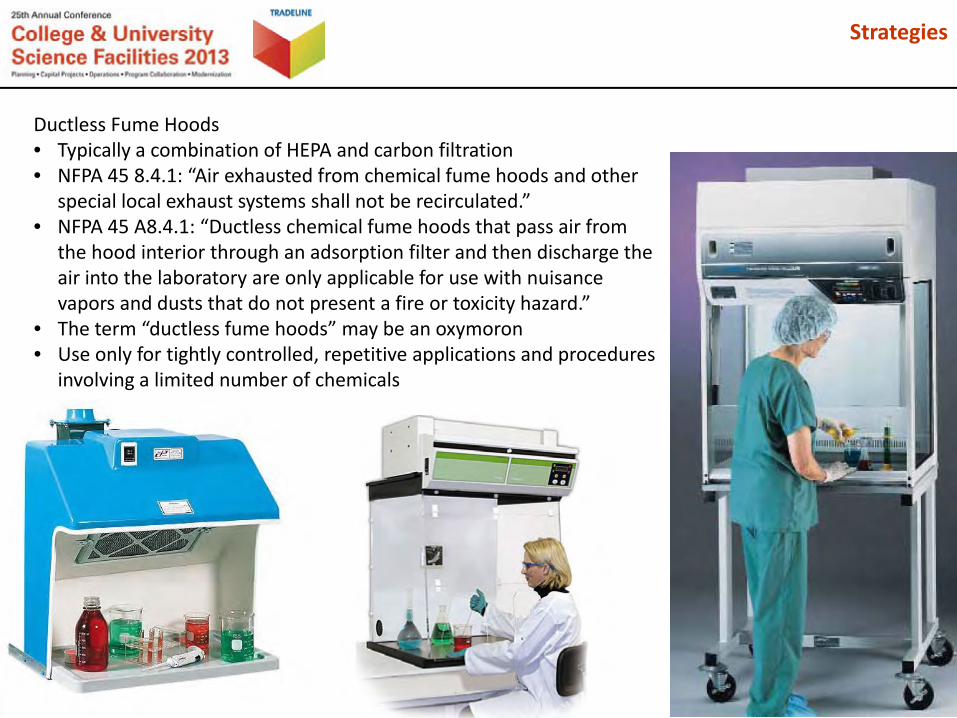
Ductless Fume Hoods• Typically a combination of HEPA and carbon filtration• NFPA 45 8.4.1: “Air exhausted from chemical fume hoods and other
special local exhaust systems shall not be recirculated.”• NFPA 45 A8.4.1: “Ductless chemical fume hoods that pass air from
the hood interior through an adsorption filter and then discharge the air into the laboratory are only applicable for use with nuisance vapors and dusts that do not present a fire or toxicity hazard.”
• The term “ductless fume hoods” may be an oxymoron• Use only for tightly controlled, repetitive applications and procedures
involving a limited number of chemicals

Strategies
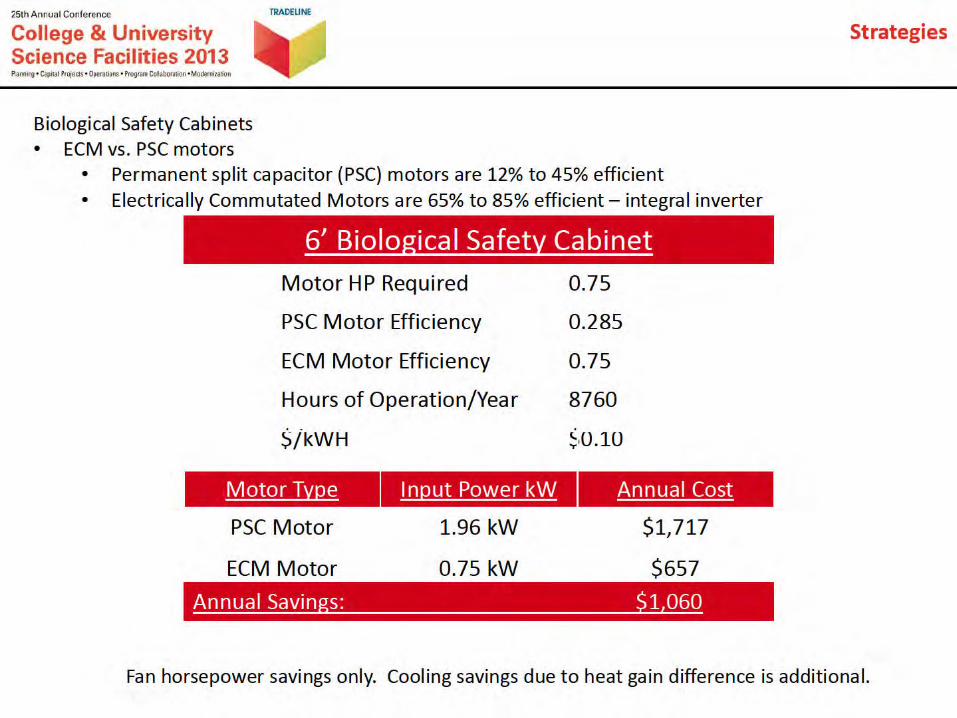
Biological Safety Cabinets• Use the correct cabinet for the application
• Class II Cabinets• Type A2 – No external exhaust,
lowest energy consumption• Type A2 Canopy Connected – 30%
exhausted, moderate energy consumption
• Type B2 – 100% exhausted, high energy consumption
• Class III Cabinets• Totally enclosed leak tight
ventilated cabinet held at ‐0.5” wg

Strategies
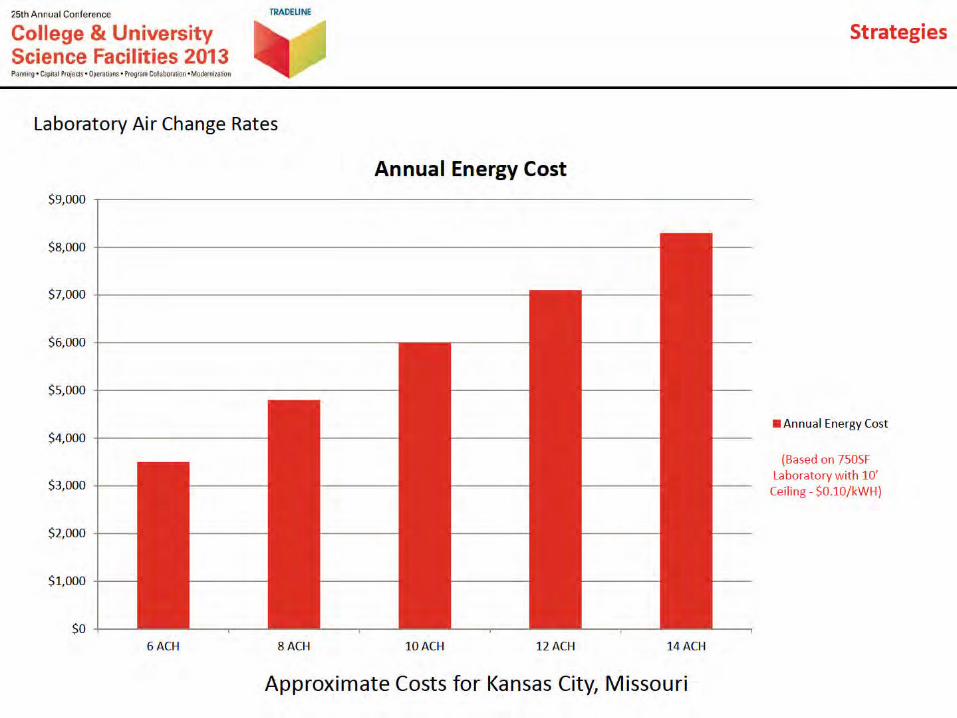
Laboratory Air Change Rates
• NFPA 45 – Fire Protection for Laboratories Using Chemicals• 2011 version eliminated ACH recommendations
• ANSI Z9.5 – Laboratory Ventilation • Does not specify a minimum rate
• 2012 NIH Design Requirements Manual• Minimum 6 AC/Hour at all times
• ASHRAE Applications Manual• 6‐12 AC/Hour used in the past• Research shows 8 may be sweet spot in many situations• Diminshing returns at 12
• Labs 21• Recommends 1 CFM/SF or 6 AC/Hour minimum
Choose Minimum Air Change Rate Thoughtfully!

Strategies
Occupancy Sensors and Setbacks• Reduce room air change rates• Reduce fume hood face velocity

Strategies
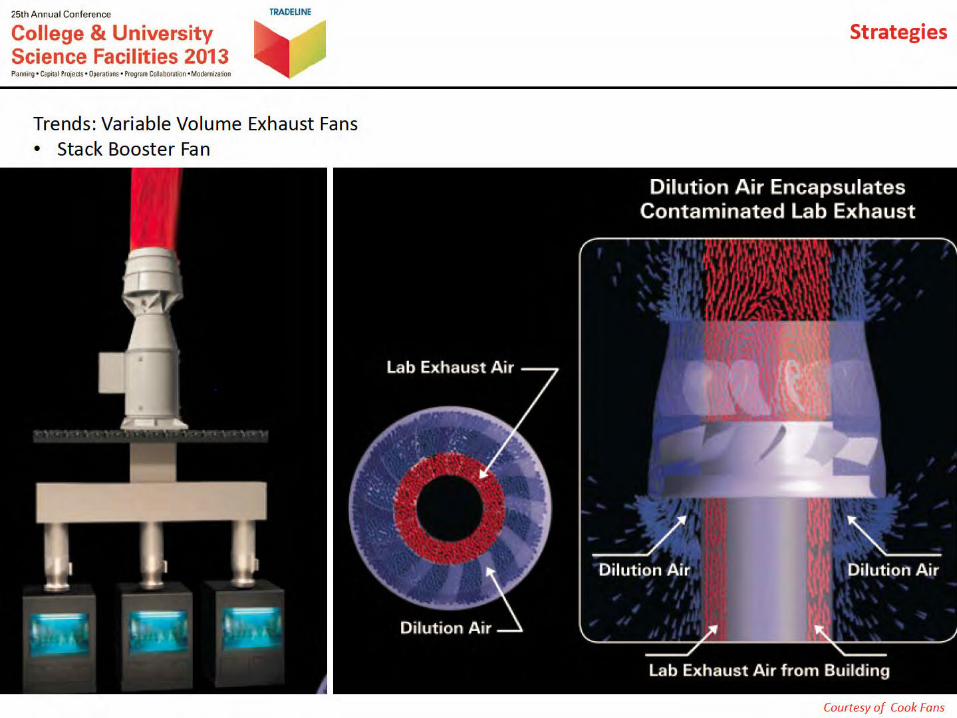
Trends: Variable Volume Exhaust Fans• Variable Discharge Nozzle
Courtesy of Greenheck FansCourtesy of Michigan Air Products
Strategies
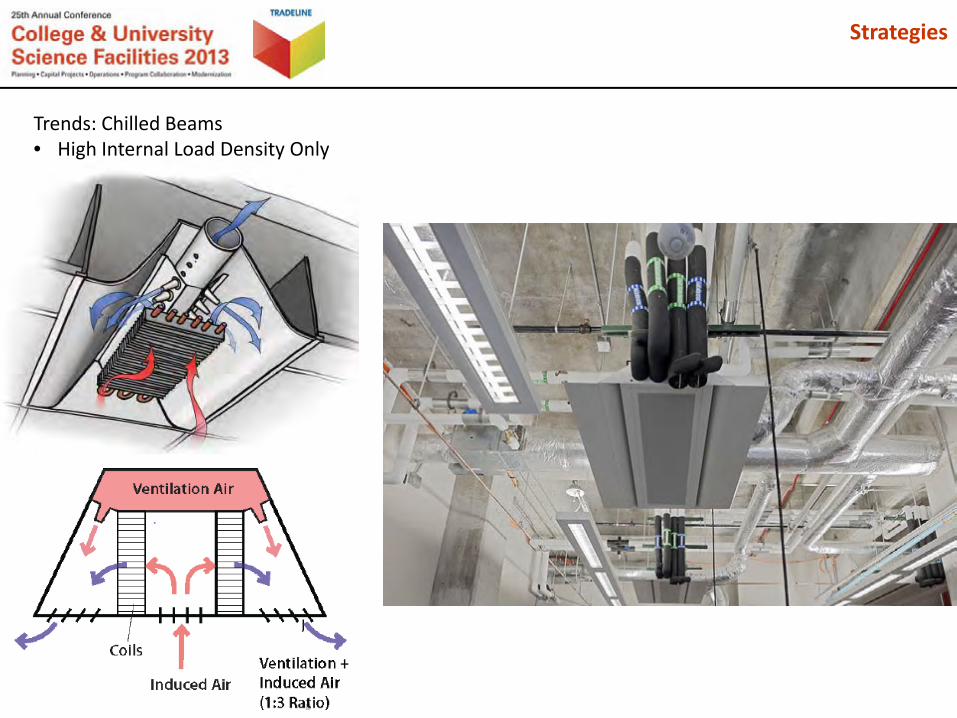
Trends: Chilled Beams• High Internal Load Density Only
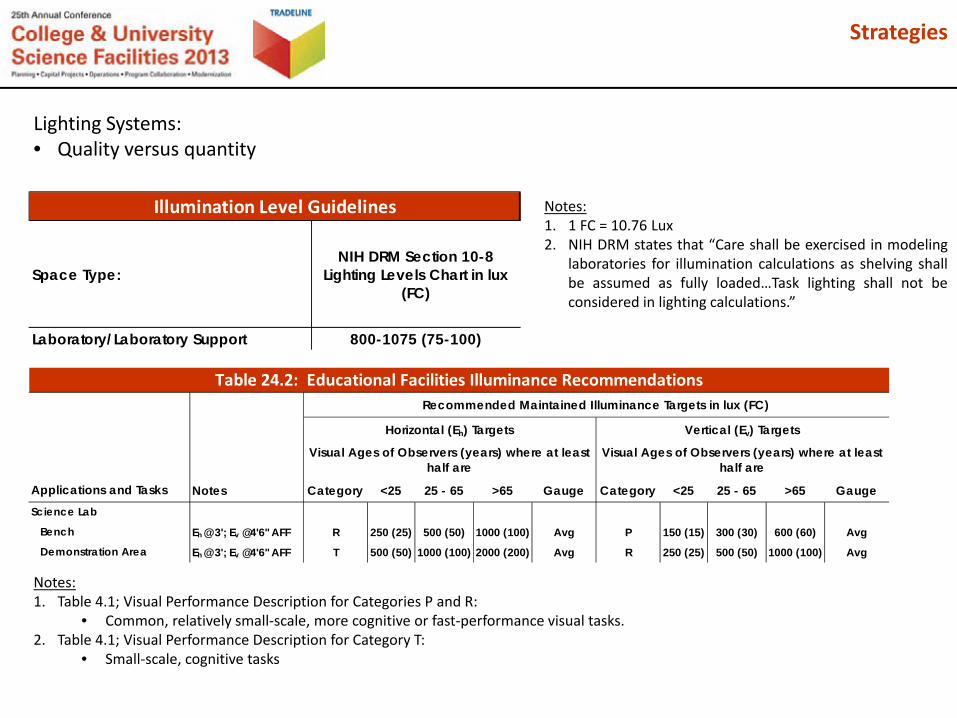
Lighting Systems:• Quality versus quantity
Notes:1. 1 FC = 10.76 Lux2. NIH DRM states that “Care shall be exercised in modeling
laboratories for illumination calculations as shelving shallbe assumed as fully loaded…Task lighting shall not beconsidered in lighting calculations.”
Illumination Level Guidelines
Space Type:NIH DRM Section 10-8
Lighting Levels Chart in lux (FC)
Laboratory/Laboratory Support 800-1075 (75-100)
Notes Category <25 25 - 65 >65 Gauge Category <25 25 - 65 >65 Gauge
Eh @ 3'; Ev @4'6" AFF R 250 (25) 500 (50) 1000 (100) Avg P 150 (15) 300 (30) 600 (60) Avg
Eh @ 3'; Ev @4'6" AFF T 500 (50) 1000 (100) 2000 (200) Avg R 250 (25) 500 (50) 1000 (100) Avg
Vertical (Ev) Targets
Visual Ages of Observers (years) where at least half are
Applications and TasksScience Lab
Bench
Demonstration Area
Table 24.2: Educational Facilities Illuminance Recommendations
Visual Ages of Observers (years) where at least half are
Recommended Maintained Illuminance Targets in lux (FC)
Horizontal (Eh) Targets
Notes:1. Table 4.1; Visual Performance Description for Categories P and R:
• Common, relatively small‐scale, more cognitive or fast‐performance visual tasks.2. Table 4.1; Visual Performance Description for Category T:
• Small‐scale, cognitive tasks
Strategies
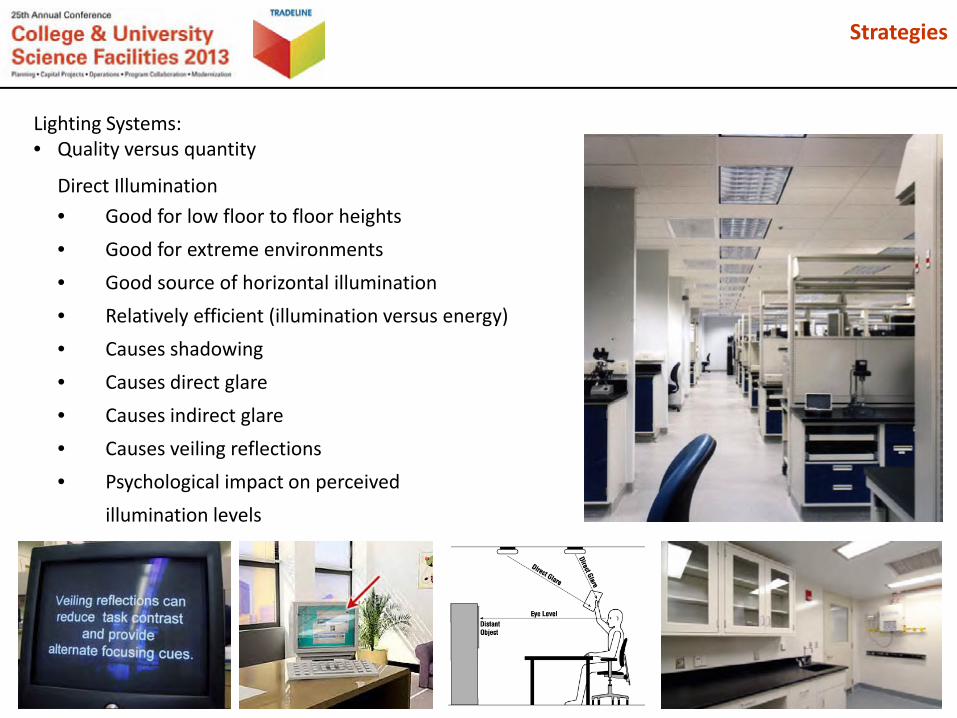
Lighting Systems:• Quality versus quantity
Direct Illumination• Good for low floor to floor heights• Good for extreme environments• Good source of horizontal illumination• Relatively efficient (illumination versus energy)• Causes shadowing• Causes direct glare• Causes indirect glare• Causes veiling reflections• Psychological impact on perceived
illumination levels
Strategies
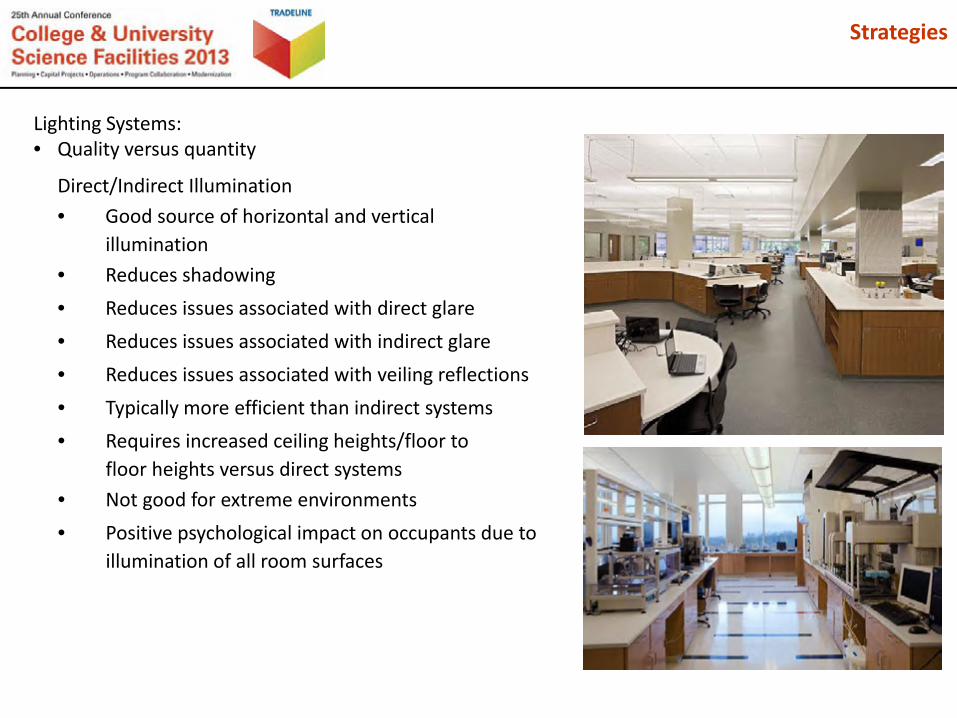
Direct/Indirect Illumination• Good source of horizontal and vertical
illumination• Reduces shadowing• Reduces issues associated with direct glare• Reduces issues associated with indirect glare• Reduces issues associated with veiling reflections• Typically more efficient than indirect systems• Requires increased ceiling heights/floor to
floor heights versus direct systems• Not good for extreme environments• Positive psychological impact on occupants due to
illumination of all room surfaces
Lighting Systems:• Quality versus quantity
Strategies
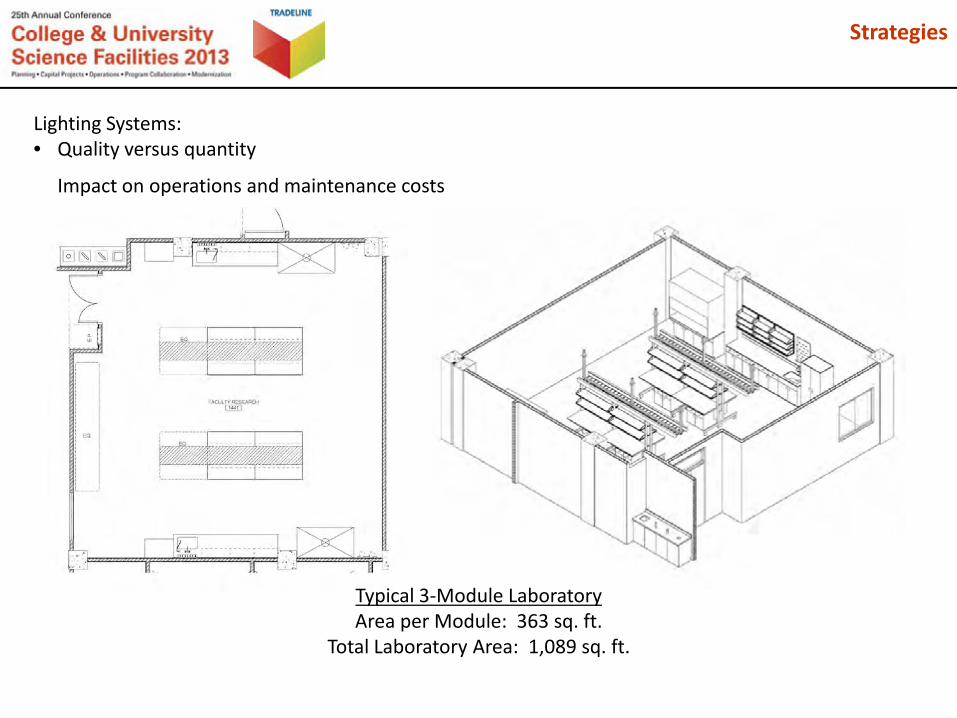
Lighting Systems:• Quality versus quantity
Impact on operations and maintenance costs
Typical 3‐Module LaboratoryArea per Module: 363 sq. ft.
Total Laboratory Area: 1,089 sq. ft.
Strategies

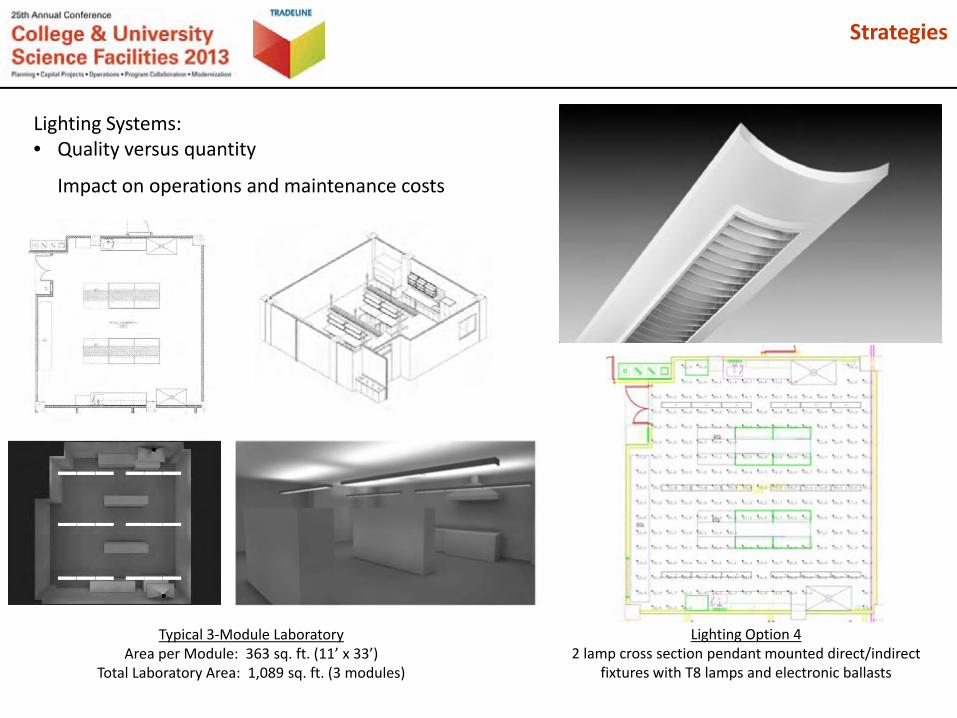
Typical 3‐Module LaboratoryArea per Module: 363 sq. ft. (11’ x 33’)
Total Laboratory Area: 1,089 sq. ft. (3 modules)
Lighting Systems:• Quality versus quantity
Impact on operations and maintenance costs
Lighting Option 12 lamp cross section pendant mounted direct/indirect
fixtures with T5HO lamps and electronic ballasts
Strategies

• 2 lamp cross section pendant mounted direct/indirect fixtures with T5HO lamps and electronic ballasts
• Six – 12’‐0” long fixtures; 36 lamps• Total first cost: $4,797 ($4.41/SF)
• Fixtures: $4,597• Lamps: $200
• Total Watts = 2,160• Lighting power density (LPD) = 1.98W/SF (exceeds
allowable LPD of 0.99 or 1.28W/SF)• Maintained Horizontal Illumination Level at
Benchtop = 96.17 FC (meets NIH criteria; exceeds IES criteria)
• First year energy cost: $648.00• Assumes 12 hours per day (time of day scheduling); 5 days
per week; 50 weeks per year; $0.10/kWH
• 30 year life cycle cost: $40,395.38$ 4,597.00 (light fixtures) $ 30,828.87 (energy)$ 2,279.48 (lamps)$ 2,690.03 (ballasts)
Lighting Option 1
Lighting Systems:• Quality versus quantity
Impact on operations and maintenance costs
Assumes group relamping every 5 yearsAssumes new electronic ballasts every 15 yearsAssumes 3% escalation per year
Strategies

Typical 3‐Module LaboratoryArea per Module: 363 sq. ft. (11’ x 33’)
Total Laboratory Area: 1,089 sq. ft. (3 modules)
Lighting Systems:• Quality versus quantity
Impact on operations and maintenance costs
Lighting Option 22 lamp high efficiency recessed fluorescent fixtures
with T8 lamps and electronic ballasts
Strategies

• 2 lamp high efficiency recessed fluorescent fixtures with T8 lamps and electronic ballasts
• Thirty – 4’‐0” long fixtures; 60 lamps• Total first cost: $6,491 ($3.81/SF)
• Fixtures: $6,300• Lamps: $191
• Total Watts = 1,680• Lighting power density (LPD) = 1.54W/SF (exceeds
allowable LPD of 0.99 or 1.28W/SF)• Maintained Horizontal Illumination Level at
Benchtop = 75.13 FC (meets lower end of NIH criteria; exceeds IES criteria)
• First year energy cost: $504.00• Assumes 12 hours per day (time of day scheduling); 5 days
per week; 50 weeks per year; $0.10/kWH
• 30 year life cycle cost: $34,998.32$ 6,300.00 (light fixtures) $ 23,978.01 (energy)$ 2,179.72 (lamps)$ 2,540.58 (ballasts)
Lighting Option 2
Lighting Systems:• Quality versus quantity
Impact on operations and maintenance costs
Assumes group relamping every 5 yearsAssumes new electronic ballasts every 15 yearsAssumes 3% escalation per year
Strategies

Typical 3‐Module LaboratoryArea per Module: 363 sq. ft. (11’ x 33’)
Total Laboratory Area: 1,089 sq. ft. (3 modules)
Lighting Systems:• Quality versus quantity
Impact on operations and maintenance costs
Lighting Option 345W LED recessed fixtures
Strategies
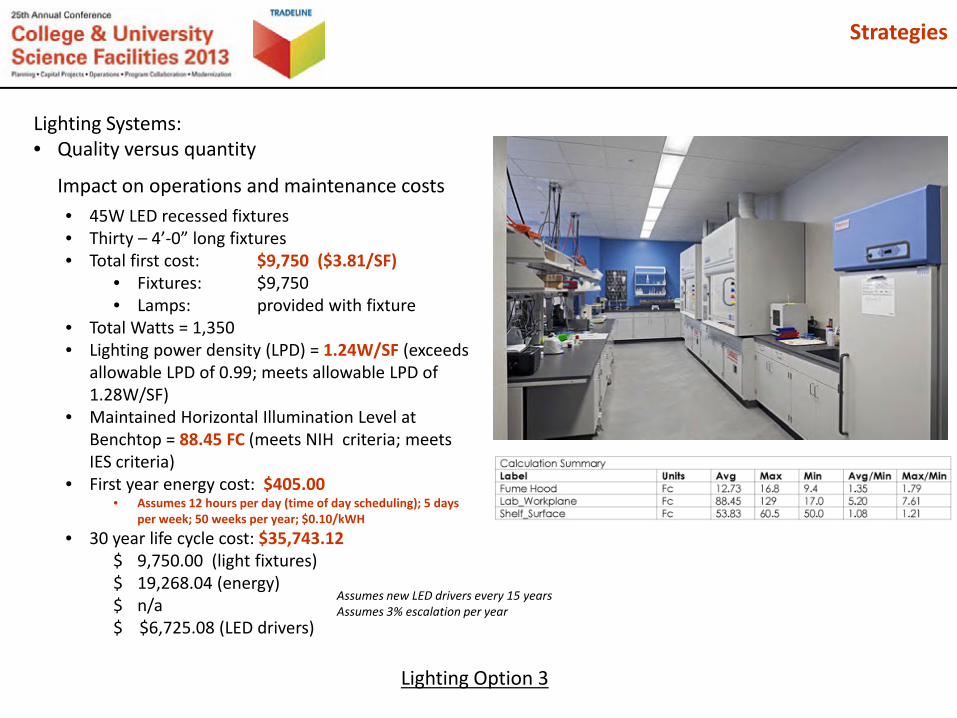
• 45W LED recessed fixtures• Thirty – 4’‐0” long fixtures• Total first cost: $9,750 ($3.81/SF)
• Fixtures: $9,750• Lamps: provided with fixture
• Total Watts = 1,350• Lighting power density (LPD) = 1.24W/SF (exceeds
allowable LPD of 0.99; meets allowable LPD of 1.28W/SF)
• Maintained Horizontal Illumination Level at Benchtop = 88.45 FC (meets NIH criteria; meets IES criteria)
• First year energy cost: $405.00• Assumes 12 hours per day (time of day scheduling); 5 days
per week; 50 weeks per year; $0.10/kWH
• 30 year life cycle cost: $35,743.12$ 9,750.00 (light fixtures) $ 19,268.04 (energy)$ n/a$ $6,725.08 (LED drivers)
Lighting Option 3
Lighting Systems:• Quality versus quantity
Impact on operations and maintenance costs
Assumes new LED drivers every 15 yearsAssumes 3% escalation per year
Strategies
Typical 3‐Module LaboratoryArea per Module: 363 sq. ft. (11’ x 33’)
Total Laboratory Area: 1,089 sq. ft. (3 modules)
Lighting Systems:• Quality versus quantity
Impact on operations and maintenance costs
Lighting Option 42 lamp cross section pendant mounted direct/indirect
fixtures with T8 lamps and electronic ballasts
Strategies
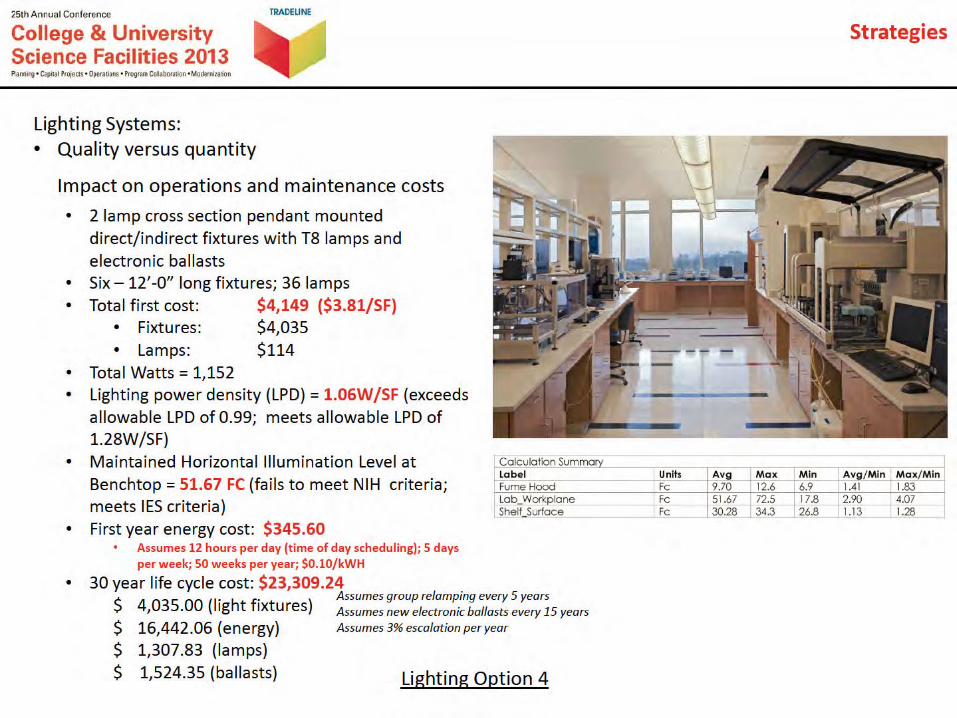
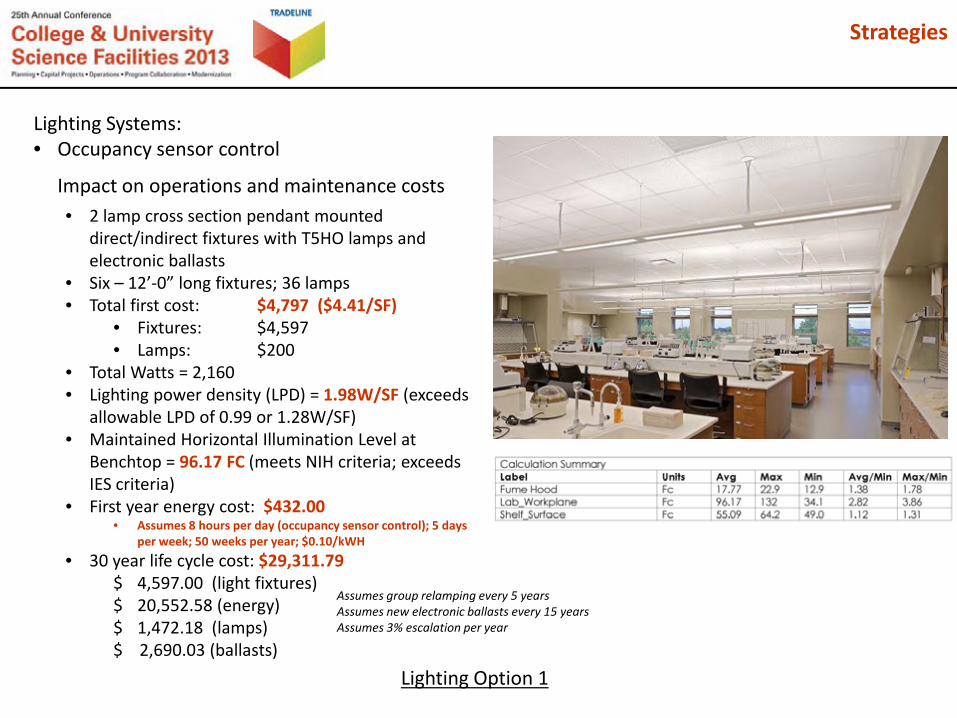
• 2 lamp cross section pendant mounted direct/indirect fixtures with T5HO lamps and electronic ballasts
• Six – 12’‐0” long fixtures; 36 lamps• Total first cost: $4,797 ($4.41/SF)
• Fixtures: $4,597• Lamps: $200
• Total Watts = 2,160• Lighting power density (LPD) = 1.98W/SF (exceeds
allowable LPD of 0.99 or 1.28W/SF)• Maintained Horizontal Illumination Level at
Benchtop = 96.17 FC (meets NIH criteria; exceeds IES criteria)
• First year energy cost: $432.00• Assumes 8 hours per day (occupancy sensor control); 5 days
per week; 50 weeks per year; $0.10/kWH
• 30 year life cycle cost: $29,311.79$ 4,597.00 (light fixtures) $ 20,552.58 (energy)$ 1,472.18 (lamps)$ 2,690.03 (ballasts)
Lighting Option 1
Lighting Systems:• Occupancy sensor control
Impact on operations and maintenance costs
Assumes group relamping every 5 yearsAssumes new electronic ballasts every 15 yearsAssumes 3% escalation per year
Strategies
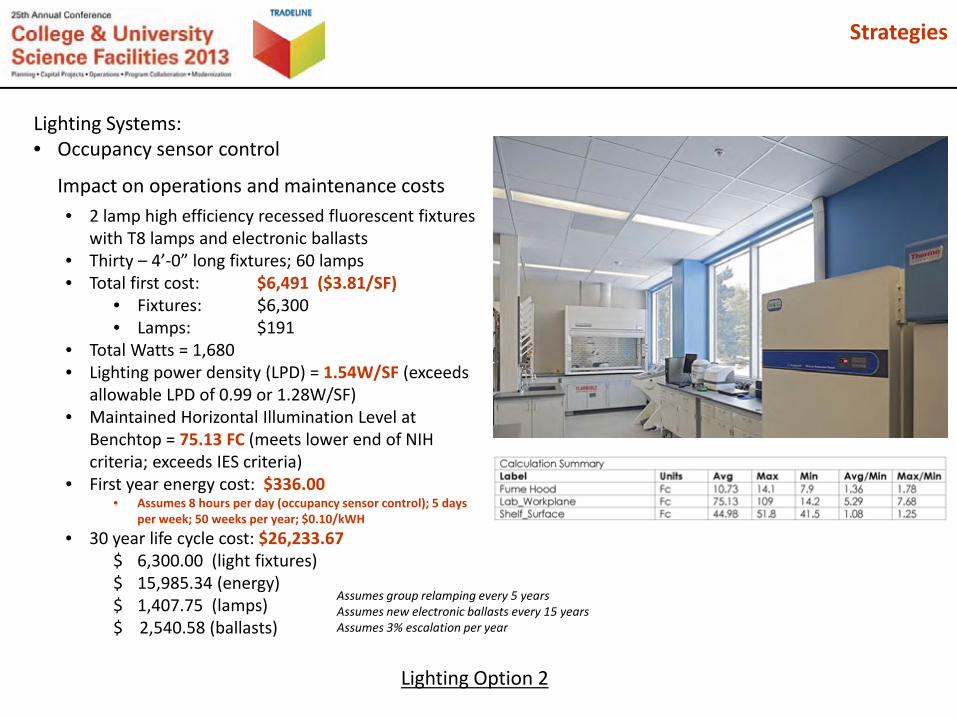
• 2 lamp high efficiency recessed fluorescent fixtures with T8 lamps and electronic ballasts
• Thirty – 4’‐0” long fixtures; 60 lamps• Total first cost: $6,491 ($3.81/SF)
• Fixtures: $6,300• Lamps: $191
• Total Watts = 1,680• Lighting power density (LPD) = 1.54W/SF (exceeds
allowable LPD of 0.99 or 1.28W/SF)• Maintained Horizontal Illumination Level at
Benchtop = 75.13 FC (meets lower end of NIH criteria; exceeds IES criteria)
• First year energy cost: $336.00• Assumes 8 hours per day (occupancy sensor control); 5 days
per week; 50 weeks per year; $0.10/kWH
• 30 year life cycle cost: $26,233.67$ 6,300.00 (light fixtures) $ 15,985.34 (energy)$ 1,407.75 (lamps)$ 2,540.58 (ballasts)
Lighting Option 2
Impact on operations and maintenance costs
Assumes group relamping every 5 yearsAssumes new electronic ballasts every 15 yearsAssumes 3% escalation per year
Lighting Systems:• Occupancy sensor control
Strategies
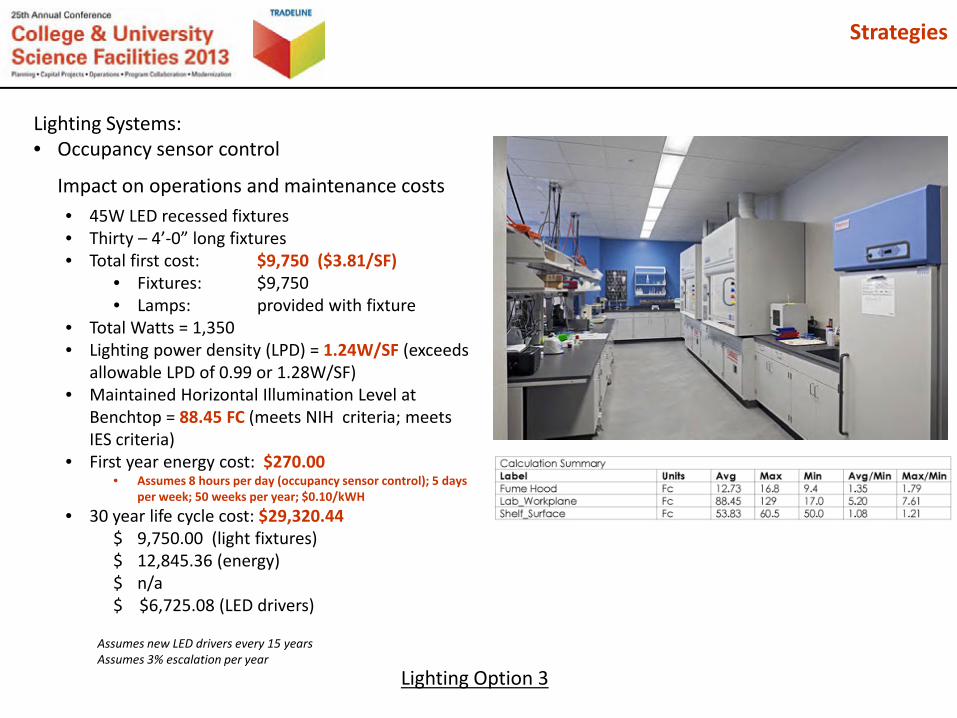
• 45W LED recessed fixtures• Thirty – 4’‐0” long fixtures• Total first cost: $9,750 ($3.81/SF)
• Fixtures: $9,750• Lamps: provided with fixture
• Total Watts = 1,350• Lighting power density (LPD) = 1.24W/SF (exceeds
allowable LPD of 0.99 or 1.28W/SF)• Maintained Horizontal Illumination Level at
Benchtop = 88.45 FC (meets NIH criteria; meets IES criteria)
• First year energy cost: $270.00• Assumes 8 hours per day (occupancy sensor control); 5 days
per week; 50 weeks per year; $0.10/kWH
• 30 year life cycle cost: $29,320.44$ 9,750.00 (light fixtures) $ 12,845.36 (energy)$ n/a$ $6,725.08 (LED drivers)
Lighting Option 3
Impact on operations and maintenance costs
Assumes new LED drivers every 15 yearsAssumes 3% escalation per year
Lighting Systems:• Occupancy sensor control
Strategies

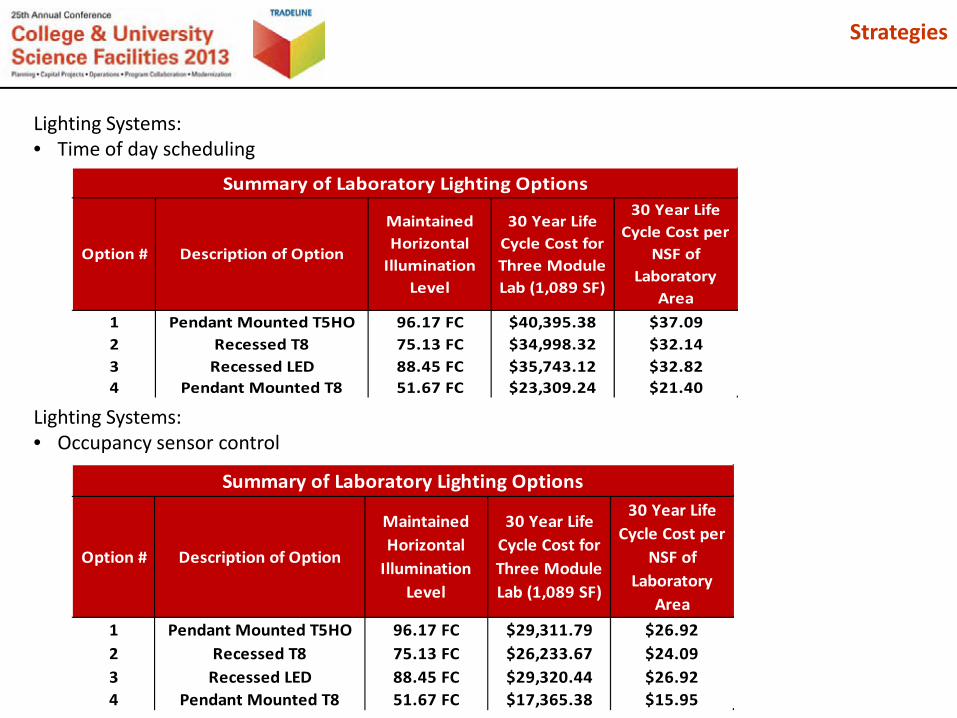
Lighting Systems:• Time of day scheduling
Lighting Systems:• Occupancy sensor control
1 Pendant Mounted T5HO 96.17 FC $29,311.79 $26.922 Recessed T8 75.13 FC $26,233.67 $24.093 Recessed LED 88.45 FC $29,320.44 $26.924 Pendant Mounted T8 51.67 FC $17,365.38 $15.95
Summary of Laboratory Lighting Options
Option # Description of Option
Maintained Horizontal Illumination
Level
30 Year Life Cycle Cost for Three Module Lab (1,089 SF)
30 Year Life Cycle Cost per
NSF of Laboratory
Area
Strategies
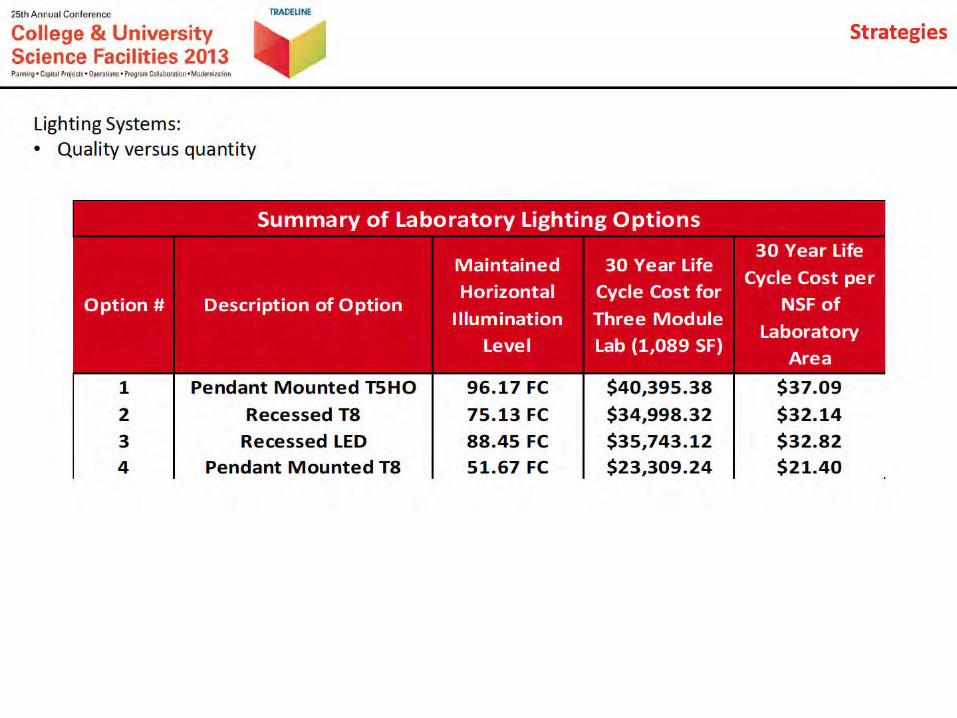
1 Pendant Mounted T5HO 96.17 FC $40,395.38 $37.092 Recessed T8 75.13 FC $34,998.32 $32.143 Recessed LED 88.45 FC $35,743.12 $32.824 Pendant Mounted T8 51.67 FC $23,309.24 $21.40
Summary of Laboratory Lighting Options
Option # Description of Option
Maintained Horizontal Illumination
Level
30 Year Life Cycle Cost for Three Module Lab (1,089 SF)
30 Year Life Cycle Cost per
NSF of Laboratory
Area
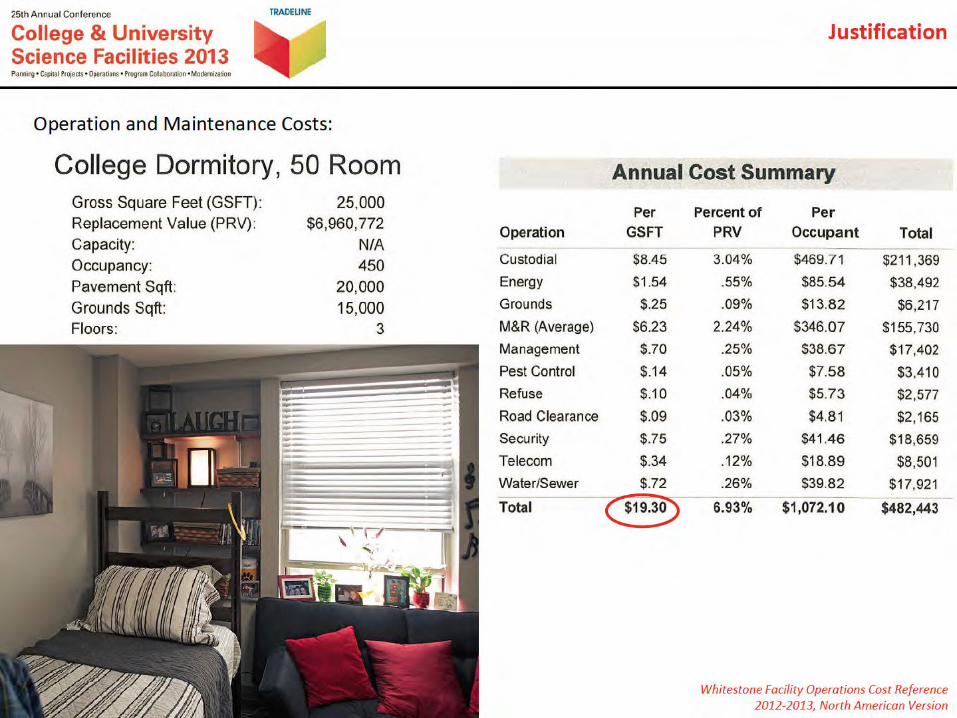
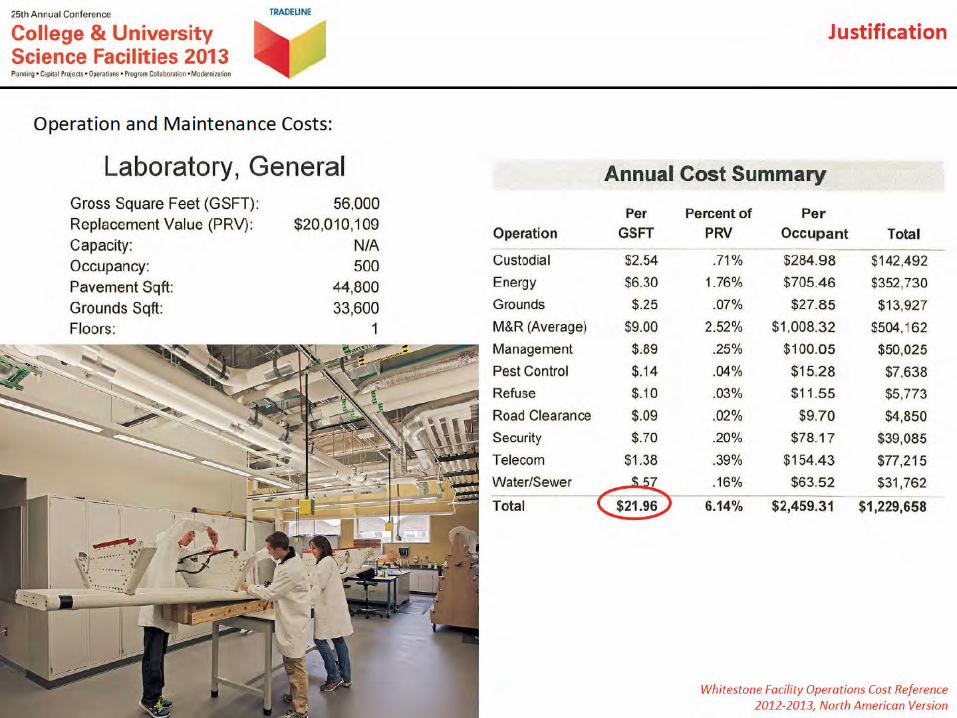
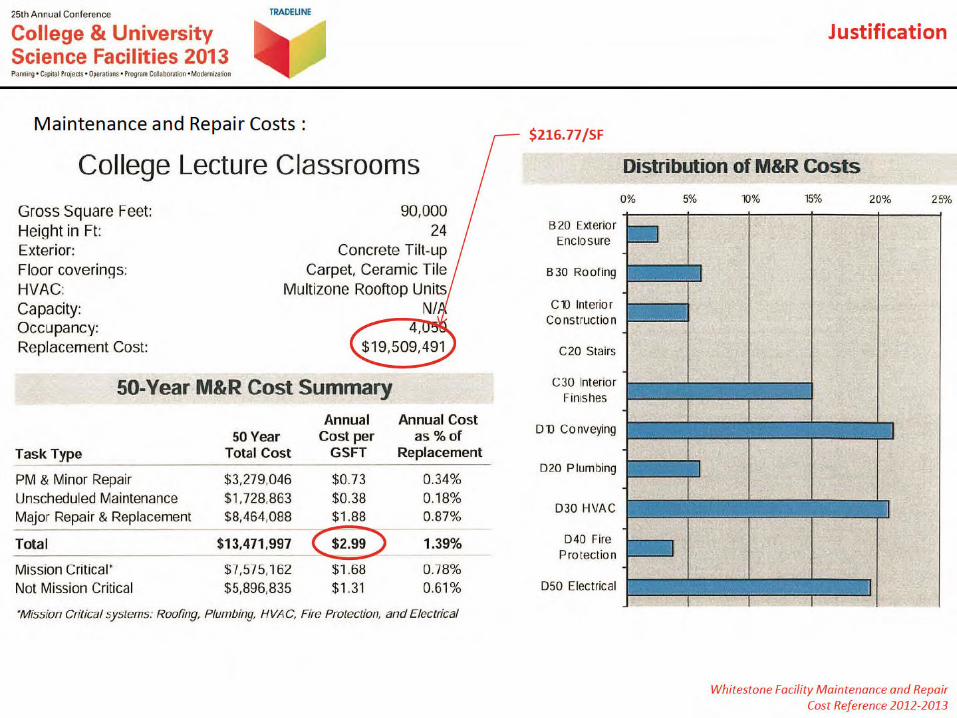
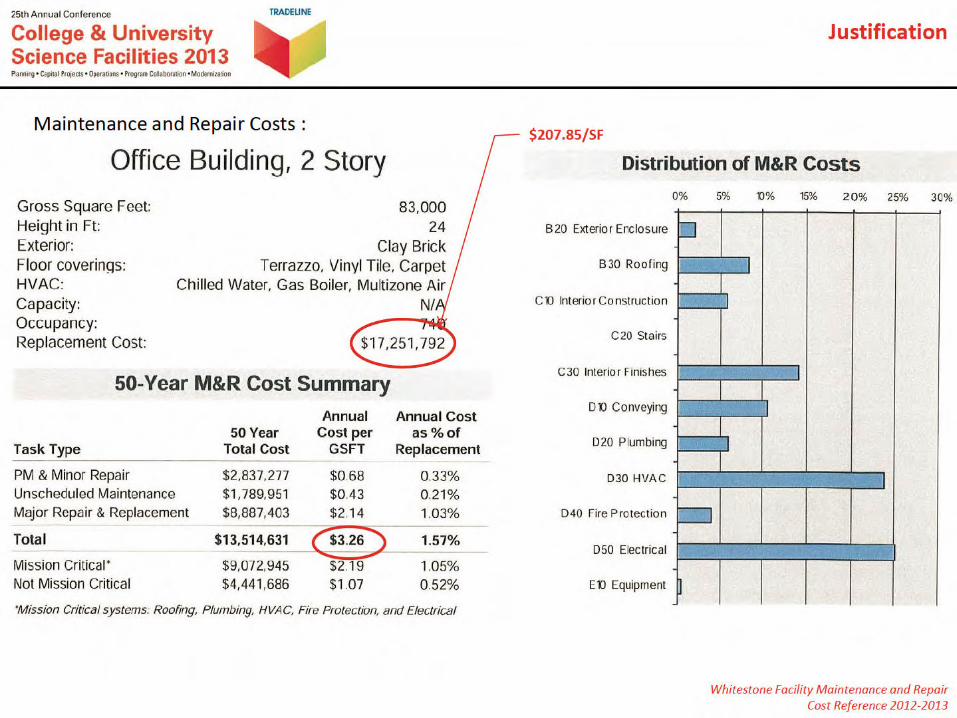
The “Tradeline Three”1. Understand how much you are spending on facility
operations and maintenance and target reasonable reductions
2. Implement the strategies that work best for you, not simply the strategies that your consultants
want to use3. Make sure that maintenance personnel understand the systems and equipment they are
maintaining
Forum M: Top 10 Cost Reduction Strategies for Science Facility Operations and Maintenance