lockheed martin corporation november, 2012 lockheed martin corporation sector aerospace and...
TRANSCRIPT
11 November, 2012
Lockheed Martin Corporation
Sector Aerospace and Defense(A&D)
NYSE LMT
Current Market Price(CMP) $93.37
Target Price $156.24
52-week High/Low $95.92 / $72.37
Market Capitalization $28,380,000,000
Book Value $7.53
P/E 9.63
Equity Shares 2,442,000,000
Recommendation BUY
THE AEROSPACE AND DEFENSE SECTOR:
The aerospace and defense industry directly employs more than 1 million workers and supports another 2.53 million
jobs, as of December 31, 2011.
Aerospace and defense sales totalled nearly $324 billion, which does indicate growth despite the economic
downturn faced by the world. Sales of aerospace equipment alone reached $218 billion in 2011 –the eighth
consecutive year of growth.
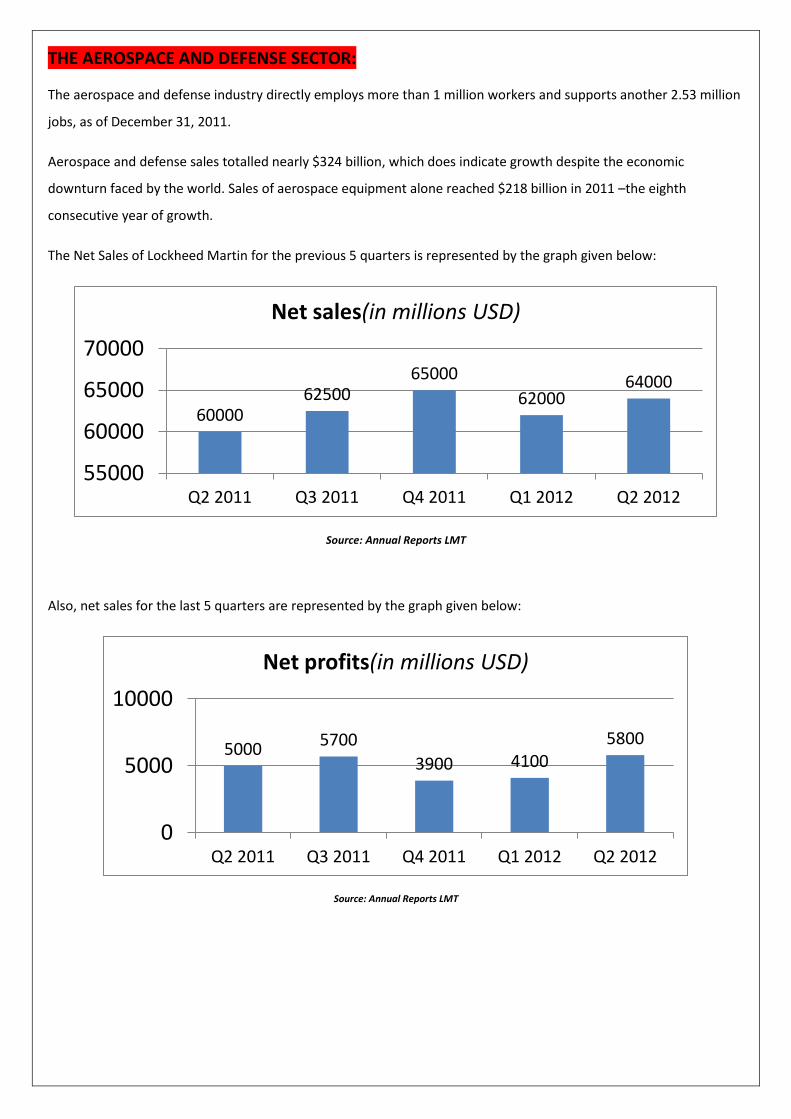
The Net Sales of Lockheed Martin for the previous 5 quarters is represented by the graph given below:
Source: Annual Reports LMT
Also, net sales for the last 5 quarters are represented by the graph given below:
Source: Annual Reports LMT
60000 62500
65000
62000 64000
55000
60000
65000
70000
Q2 2011 Q3 2011 Q4 2011 Q1 2012 Q2 2012
Net sales(in millions USD)
5000 5700
3900 4100 5800
0
5000
10000
Q2 2011 Q3 2011 Q4 2011 Q1 2012 Q2 2012
Net profits(in millions USD)
Aerospace and defense exports of $89.6 billion provide the U.S. economy with a $42.2 billion foreign trade surplus –
the largest of any sector. The imports and exports figures, for some industries of the economy of the U.S. are given
in the following table:
Industry Exports Imports Net balance Chemicals $171,526 $187,754 -$16,228
Computers and Electronic products $120,950 $324,481 -$203,532
Aerospace and Defense $89,636 $47,484 $42,153
Petroleum and coal products $60,793 $102,049 -$41,256
Agricultural products $58,015 $24,026 $33,989
Food and kindred products $50,901 $41,025 $9,876 Source: Deloitte report on A & D industry
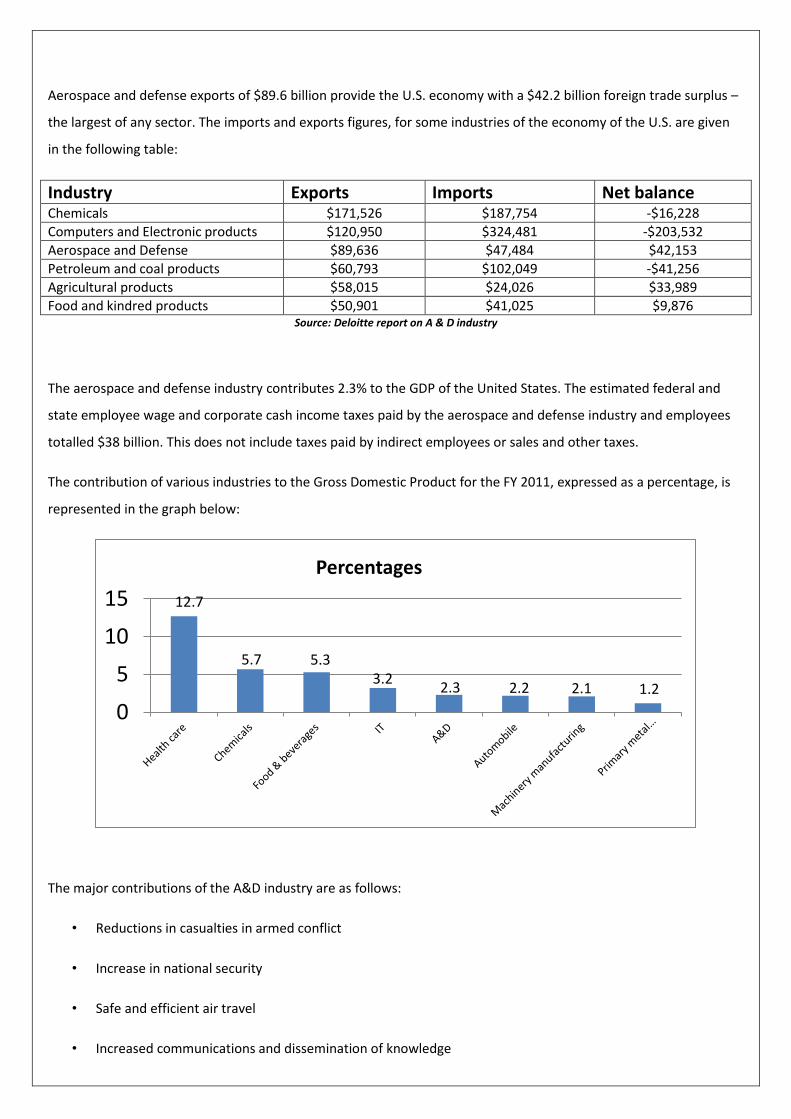
The aerospace and defense industry contributes 2.3% to the GDP of the United States. The estimated federal and
state employee wage and corporate cash income taxes paid by the aerospace and defense industry and employees
totalled $38 billion. This does not include taxes paid by indirect employees or sales and other taxes.
The contribution of various industries to the Gross Domestic Product for the FY 2011, expressed as a percentage, is
represented in the graph below:
The major contributions of the A&D industry are as follows:
• Reductions in casualties in armed conflict
• Increase in national security
• Safe and efficient air travel
• Increased communications and dissemination of knowledge
12.7
5.7 5.3 3.2
2.3 2.2 2.1 1.2
0
5
10
15
Percentages
• Globalization of supply chain and consumerism
• Scientific research and applied technology advancements
LOCKHEED MARTIN – An Overview:
• Lockheed Martin is a USA-based global security and aerospace company engaged in the research, design,
development, manufacture, integration, and sustainment of advanced technology systems and products. It
was formed by the merger of Lockheed Corporation and Martin Marietta in March 1995.
• It has its headquarters in Betheseda, Maryland, United States of America, in the Washington Metropolitan
Area.
• Lockheed Martin currently employs around 123,000 people across the globe.
• Its current Chairman and CEO is Mr. Robert J.Stevens.
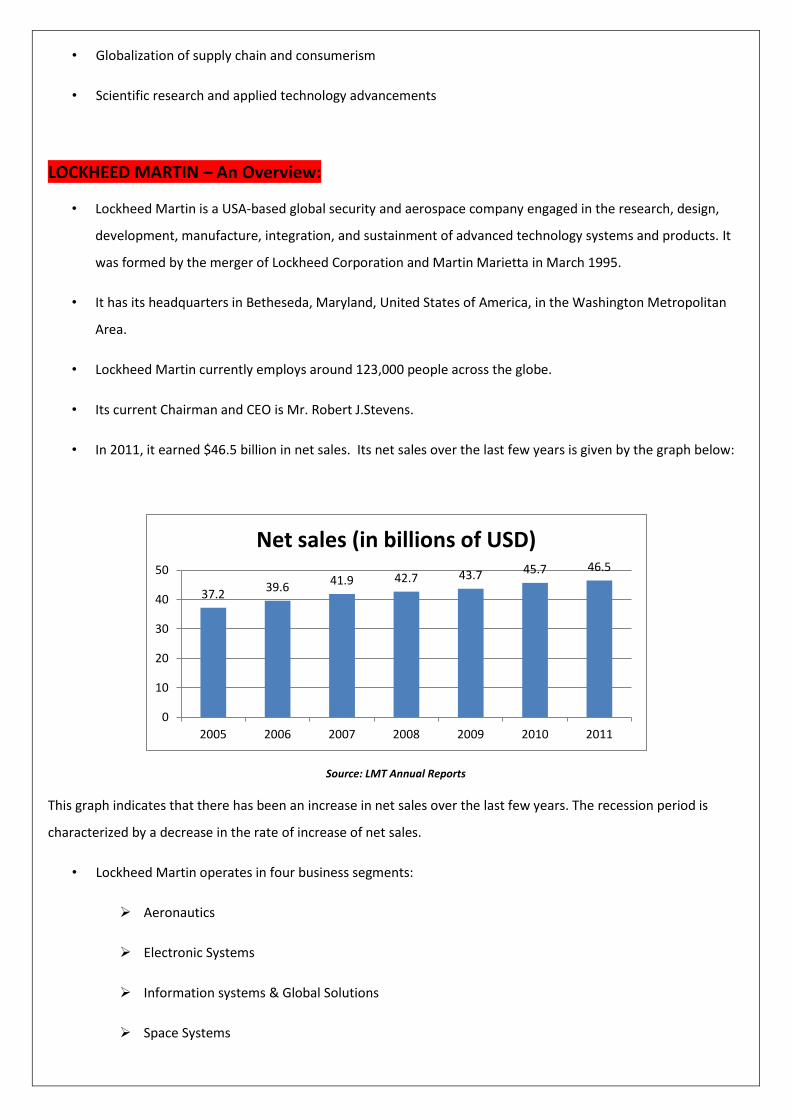
• In 2011, it earned $46.5 billion in net sales. Its net sales over the last few years is given by the graph below:
Source: LMT Annual Reports
This graph indicates that there has been an increase in net sales over the last few years. The recession period is
characterized by a decrease in the rate of increase of net sales.
• Lockheed Martin operates in four business segments:
Aeronautics
Electronic Systems
Information systems & Global Solutions
Space Systems
37.2 39.6
41.9 42.7 43.7 45.7 46.5
0
10
20
30
40
50
2005 2006 2007 2008 2009 2010 2011
Net sales (in billions of USD)
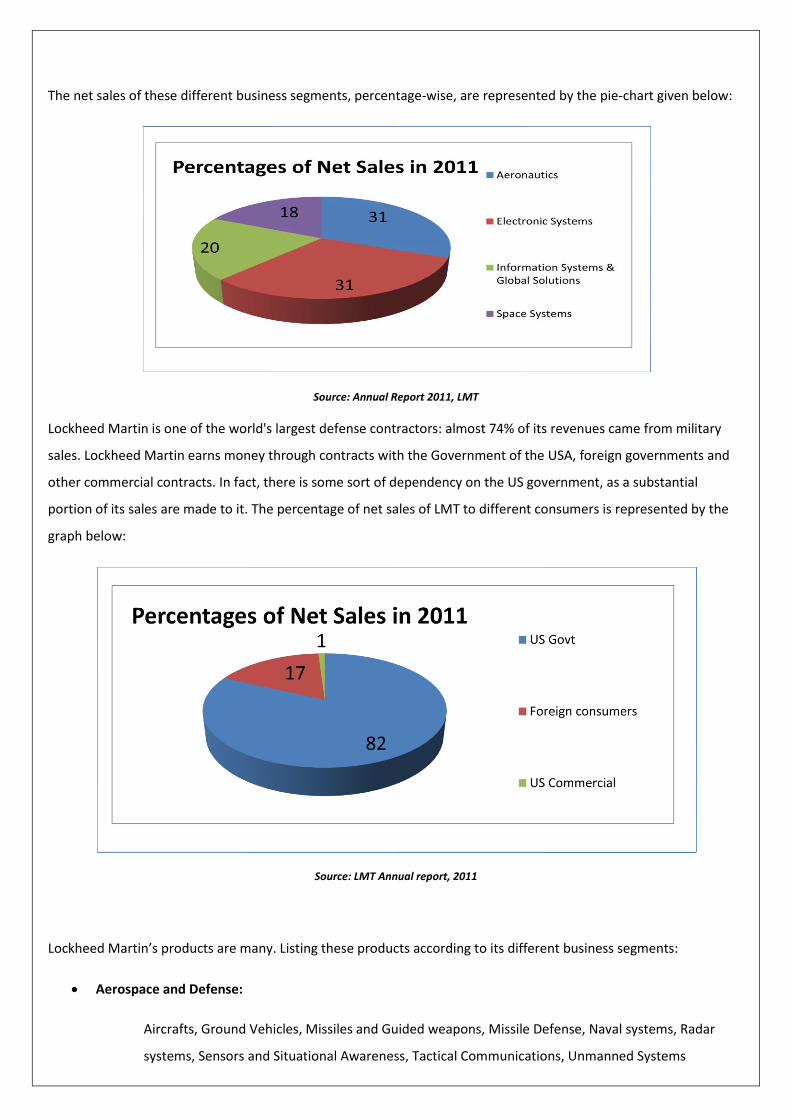
The net sales of these different business segments, percentage-wise, are represented by the pie-chart given below:
Source: Annual Report 2011, LMT
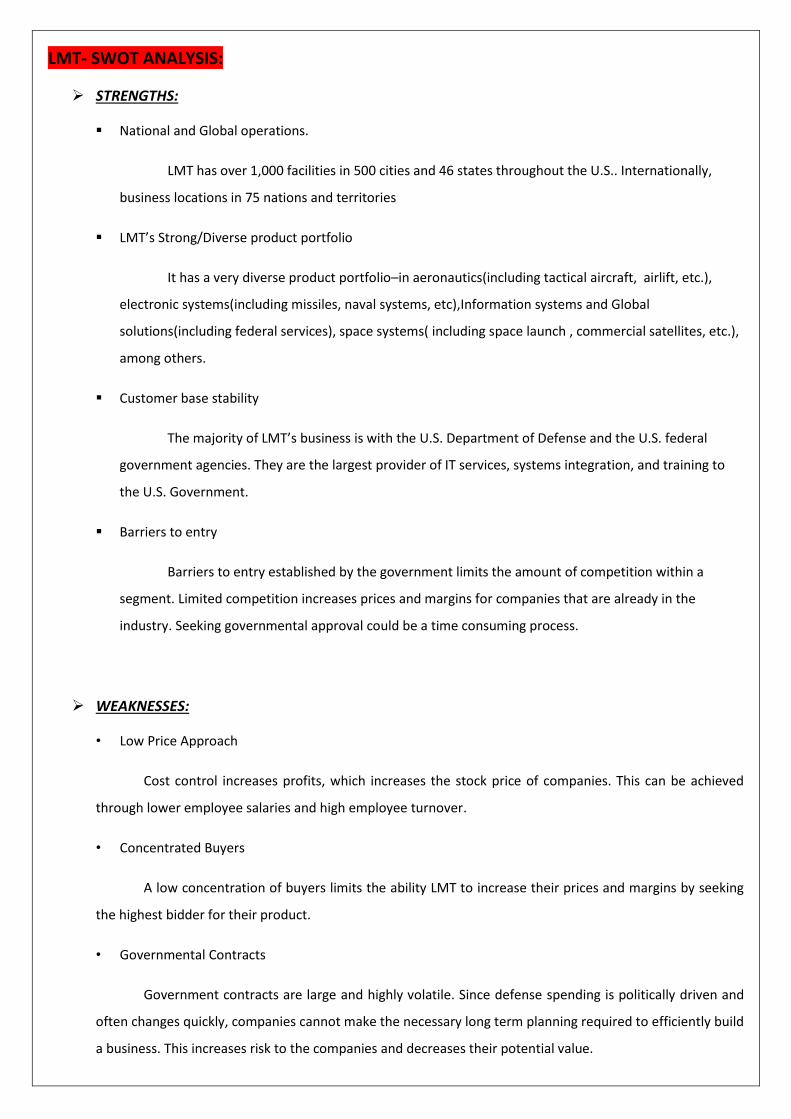
Lockheed Martin is one of the world's largest defense contractors: almost 74% of its revenues came from military
sales. Lockheed Martin earns money through contracts with the Government of the USA, foreign governments and
other commercial contracts. In fact, there is some sort of dependency on the US government, as a substantial
portion of its sales are made to it. The percentage of net sales of LMT to different consumers is represented by the
graph below:
Source: LMT Annual report, 2011
Lockheed Martin’s products are many. Listing these products according to its different business segments:
Aerospace and Defense:
Aircrafts, Ground Vehicles, Missiles and Guided weapons, Missile Defense, Naval systems, Radar
systems, Sensors and Situational Awareness, Tactical Communications, Unmanned Systems

Information systems & Global Solutions
Lockheed Martin is a leading partner of the Federal Government of the United States Government,
providing 21st century technology solutions. It is presently one of the US government’s leading Information
Technology providers. Biometrics, Cloud Computing, Cyber Security, Information Management
Space
Climate Monitoring, Satellites, Space Exploration
Electronic Systems
Alternative and Renewable Energy, Energy Management and Storage
LMT- COMPETITORS:
• The principal factors of competition include: value of products and services to the customer; technical and
management capability; the ability to develop and implement complex, integrated system architectures;
release of technology; ability to execute and perform against contract requirements; and ability to provide
timely solutions.
• Its major competitors include: The Boeing Company (BA) , Northrop Grumman Corporation(NOC), Raytheon
Co(RTN), and L-3 Communication Holdings(LLL).
• Some areas of comparison have been depicted in the following table:
Source: yahoo finance
NOTE: All figures in the above table are for the financial year 2011.
LMT- SWOT ANALYSIS:
STRENGTHS:
National and Global operations.
LMT has over 1,000 facilities in 500 cities and 46 states throughout the U.S.. Internationally,
business locations in 75 nations and territories
LMT’s Strong/Diverse product portfolio
It has a very diverse product portfolio–in aeronautics(including tactical aircraft, airlift, etc.),
electronic systems(including missiles, naval systems, etc),Information systems and Global
solutions(including federal services), space systems( including space launch , commercial satellites, etc.),
among others.
Customer base stability
The majority of LMT’s business is with the U.S. Department of Defense and the U.S. federal
government agencies. They are the largest provider of IT services, systems integration, and training to
the U.S. Government.
Barriers to entry
Barriers to entry established by the government limits the amount of competition within a
segment. Limited competition increases prices and margins for companies that are already in the
industry. Seeking governmental approval could be a time consuming process.
WEAKNESSES:
• Low Price Approach
Cost control increases profits, which increases the stock price of companies. This can be achieved
through lower employee salaries and high employee turnover.
• Concentrated Buyers
A low concentration of buyers limits the ability LMT to increase their prices and margins by seeking
the highest bidder for their product.
• Governmental Contracts
Government contracts are large and highly volatile. Since defense spending is politically driven and
often changes quickly, companies cannot make the necessary long term planning required to efficiently build
a business. This increases risk to the companies and decreases their potential value.
OPPORTUNITIES:
• Terrorism Risk
Continued terrorism risk will bring additional benefits to aerospace and defense stocks. Security-
related stocks will also benefit as the private sector invests in security.
• Accelerating US military and space market
• Lockheed Martin’s diversification into cyber-security and Healthcare Information Technology
• Acquisition, Merger and Strategic Alliance
• Globalization
As the expansion of western economies slows in relation to the rest of the world, opportunities for
growth will exist outside the borders of the home countries.
THREATS:
• Isolationalist mentality due to prolonged wars.
• After-effects of the global recession
• Austerity drive:
The big spenders are gradually lowering their defense budgets and concentrating on other avenues
to fix their ailing economies. Another cause for concern is that Barack Obama has just won the Presidential
Election, and has been re-elected as President for the duration 2012-2017. One of his pre-poll promises was
a cut in the defense budget. This is a huge threat for the Aerospace and Defense Sector as a whole, and
Lockheed Martin, in particular.
• Volatile commodity prices.
• Long-Term and Specific Program Cuts:
The amount allocated for US wars abroad would also witness a sharp fall mainly owing to troop withdrawal
from Iraq and a drawdown in Afghanistan.
• Intense Competition
• Government Regulation
LMT- PORTER’S FIVE FORCES:
Competition from substitutes: LOW
Generally, contracts take long periods of time to complete. Due to this, it is hard for the government to switch
suppliers over a short period of time, providing some protection for Lockheed Martin from substitutes. Lockheed
Martin’s products are patent protected which prevents the government from switching suppliers and expecting
the same product. There are few competitors in the industry leaving few quality substitutes.
Rivalry between established competitors: HIGH
LMT only has a few competitors, all of which are of similar size. Unfortunately, the industry itself is close to
maturing and expansive growth is hard to achieve. This implies that there is very strong competition as these
companies will grow only by taking market share away from its competitors, rather than targeting new
consumers. Rivalry also intensifies while competitors are involved in bidding on or are competing for a new
project.
Threat of Entry: LOW
Fixed costs are high, but since the United States government is really the only customer, it is
incredibly difficult to establish a new company and take business away from others that exhibit a
proven track record.
While many novel ideas are still generated in small, research-oriented aerospace/defense firms, the
actual production and testing of products and services can only be conducted with companies whose
budgets support such actions.
Bargaining power of buyers: HIGH
The United States Government accounts for almost 85% of Lockheed Martin’s revenue, posing a massive risk
if budget cuts materialize. The US government can decide what products need to be built, when they need
to be completed, and how many need to be produced. It also decides where the products can be sold, when
they can be released, and how many can be sold internationally.
Bargaining power of sellers: LOW
Many contracts are assigned a cost plus structure. The reason for this contract type is the government’s
hesitance to use low quality inputs for high quality products. This structure helps counteract the effect of
pass-through costs from suppliers for raw materials.
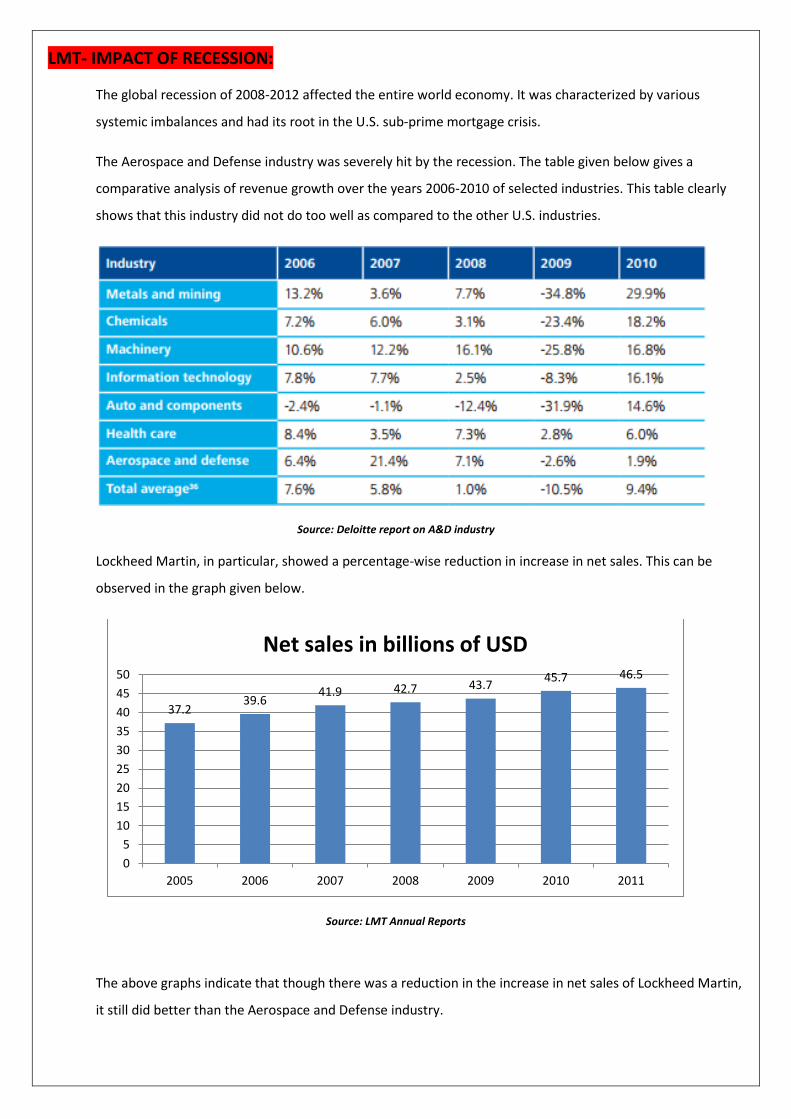
LMT- IMPACT OF RECESSION:
The global recession of 2008-2012 affected the entire world economy. It was characterized by various
systemic imbalances and had its root in the U.S. sub-prime mortgage crisis.
The Aerospace and Defense industry was severely hit by the recession. The table given below gives a
comparative analysis of revenue growth over the years 2006-2010 of selected industries. This table clearly
shows that this industry did not do too well as compared to the other U.S. industries.
Source: Deloitte report on A&D industry
Lockheed Martin, in particular, showed a percentage-wise reduction in increase in net sales. This can be
observed in the graph given below.
Source: LMT Annual Reports
The above graphs indicate that though there was a reduction in the increase in net sales of Lockheed Martin,
it still did better than the Aerospace and Defense industry.
37.2 39.6
41.9 42.7 43.7 45.7 46.5
0
5
10
15
20
25
30
35
40
45
50
2005 2006 2007 2008 2009 2010 2011
Net sales in billions of USD
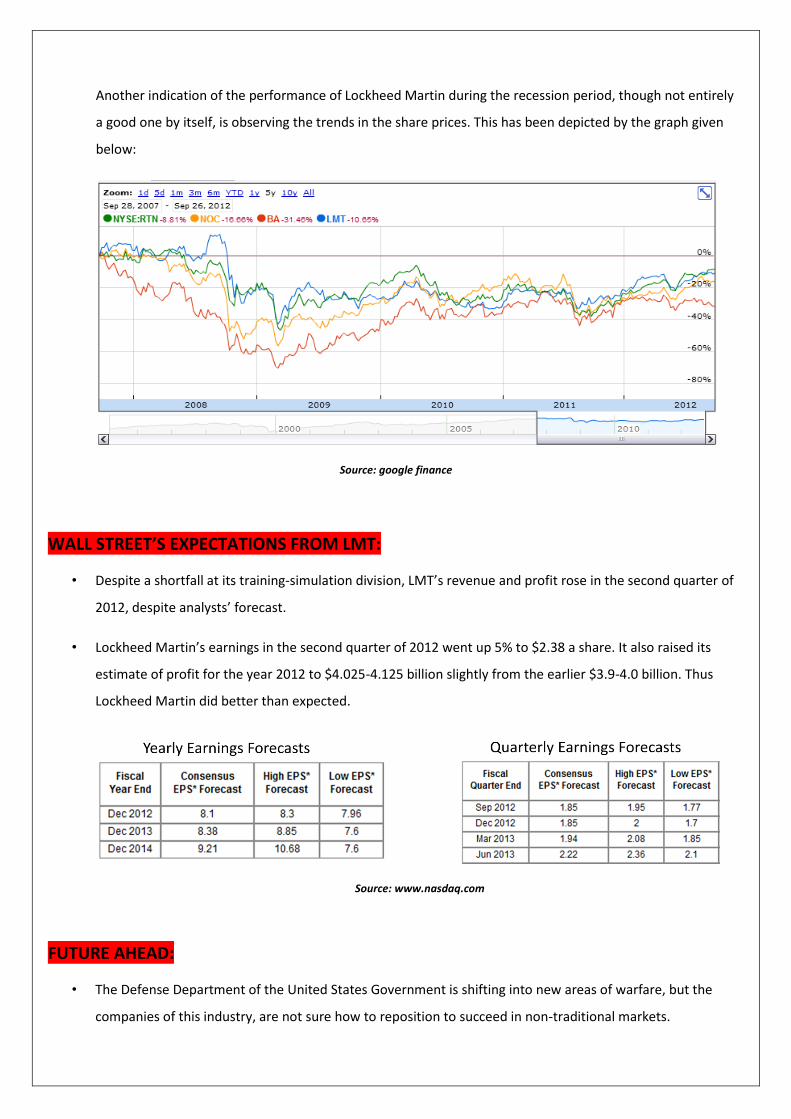
Another indication of the performance of Lockheed Martin during the recession period, though not entirely
a good one by itself, is observing the trends in the share prices. This has been depicted by the graph given
below:
Source: google finance
WALL STREET’S EXPECTATIONS FROM LMT:
• Despite a shortfall at its training-simulation division, LMT’s revenue and profit rose in the second quarter of
2012, despite analysts’ forecast.
• Lockheed Martin’s earnings in the second quarter of 2012 went up 5% to $2.38 a share. It also raised its
estimate of profit for the year 2012 to $4.025-4.125 billion slightly from the earlier $3.9-4.0 billion. Thus
Lockheed Martin did better than expected.
Source: www.nasdaq.com
FUTURE AHEAD:
• The Defense Department of the United States Government is shifting into new areas of warfare, but the
companies of this industry, are not sure how to reposition to succeed in non-traditional markets.
• There is a growing opinion among nations that prevention of conflict, inter-agency work, stabilization and
policing are much more important than actually participating in wars. The companies that will thrive are
those with the non-kinetic technology and skills that can help the military succeed in the outer edges.
• The Aerospace and Defense industry will be largely affected by the outcome of the Presidential Elections of
USA, 2012. A point of contention between the 2 candidates was the Defense budget. The future
performance of LMT depends on whether President Barack Obama, on being re-elected will renegade on his
promise or whether he will implement his proposed defense cuts.
• Those that wish to compete in today’s climate must focus on improving affordability and maintaining cost
fitness while establishing long-range plans grounded in the grim realities of the next five to 10 years of
reduced demand.
• Defense companies may need to shift from a central operating model to a portfolio management model that
allows individual business units to adapt to the unique requirements of their markets.
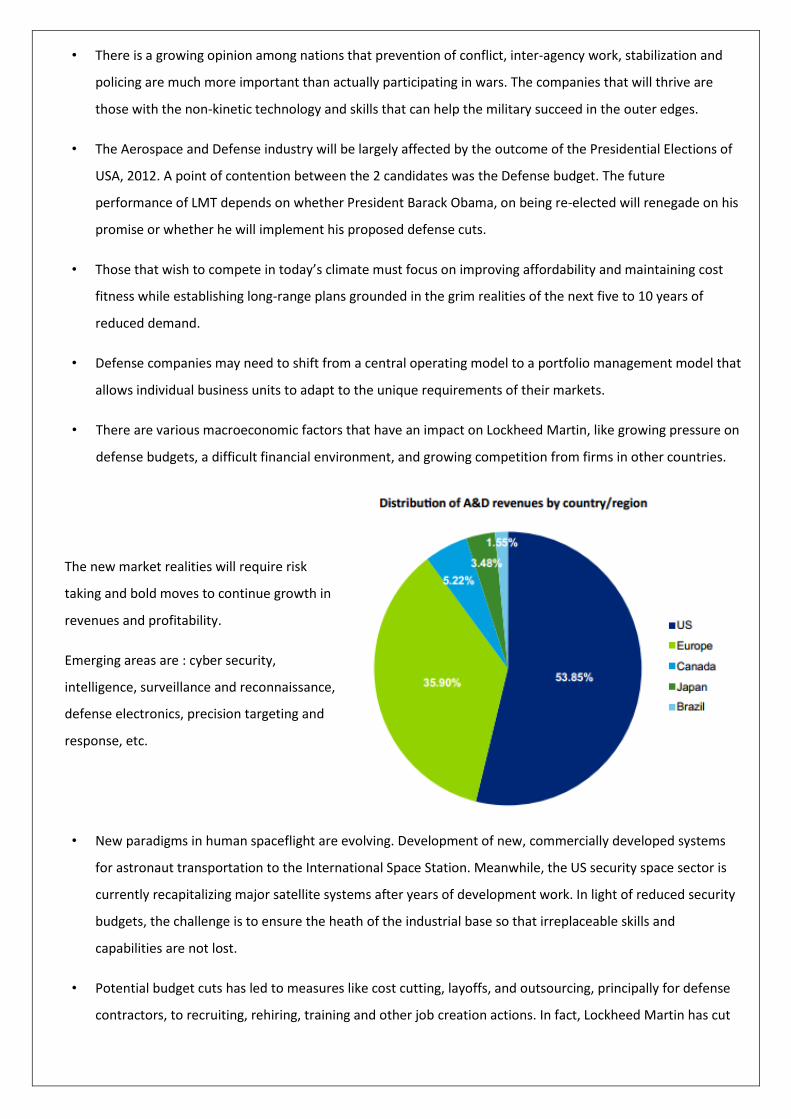
• There are various macroeconomic factors that have an impact on Lockheed Martin, like growing pressure on
defense budgets, a difficult financial environment, and growing competition from firms in other countries.
• New paradigms in human spaceflight are evolving. Development of new, commercially developed systems
for astronaut transportation to the International Space Station. Meanwhile, the US security space sector is
currently recapitalizing major satellite systems after years of development work. In light of reduced security
budgets, the challenge is to ensure the heath of the industrial base so that irreplaceable skills and
capabilities are not lost.
• Potential budget cuts has led to measures like cost cutting, layoffs, and outsourcing, principally for defense
contractors, to recruiting, rehiring, training and other job creation actions. In fact, Lockheed Martin has cut
The new market realities will require risk
taking and bold moves to continue growth in
revenues and profitability.
Emerging areas are : cyber security,
intelligence, surveillance and reconnaissance,
defense electronics, precision targeting and
response, etc.

around 8100 jobs in the years 2010 and 2011. However, these job cuts were offset by selected hiring in the
industry as well.
COMPARATIVE FINANCIAL RATIO ANALYSIS for FY-2011:
.
8.56% 10.66%
14.46% 13.52%
0.00%
5.00%
10.00%
15.00%
20.00%
LMT BA NOC RTN
EBITDA Margin
5.74% 6.04%
16.44%
20.71%
0.00%
5.00%
10.00%
15.00%
20.00%
25.00%
LMT BA NOC RTN
NOPAT Margin
266%
78%
20% 23%
0%
50%
100%
150%
200%
250%
300%
LMT BA NOC RTN
Return on Equity
EBITDA margin is defined as EBITDA/Net Sales.
Smaller the COGS value, higher the EBITDA margin.
So higher the EBITDA margin, better the position of
the company. The value of EBITDA margin of LMT is
lesser than the industry average
NOPAT is Net Operating Profit after Profit.
So, NOPAT margin is EBIT*(1-Tx)/Net sales.
The graph is an indication that LMT is
doing very badly compared to peers.
ROE is Net Profit/Shareholder’s equity.
The very high value of ROE for Lockheed
Martin is an indication of excessive
leverage taken on by Lockheed Martin.
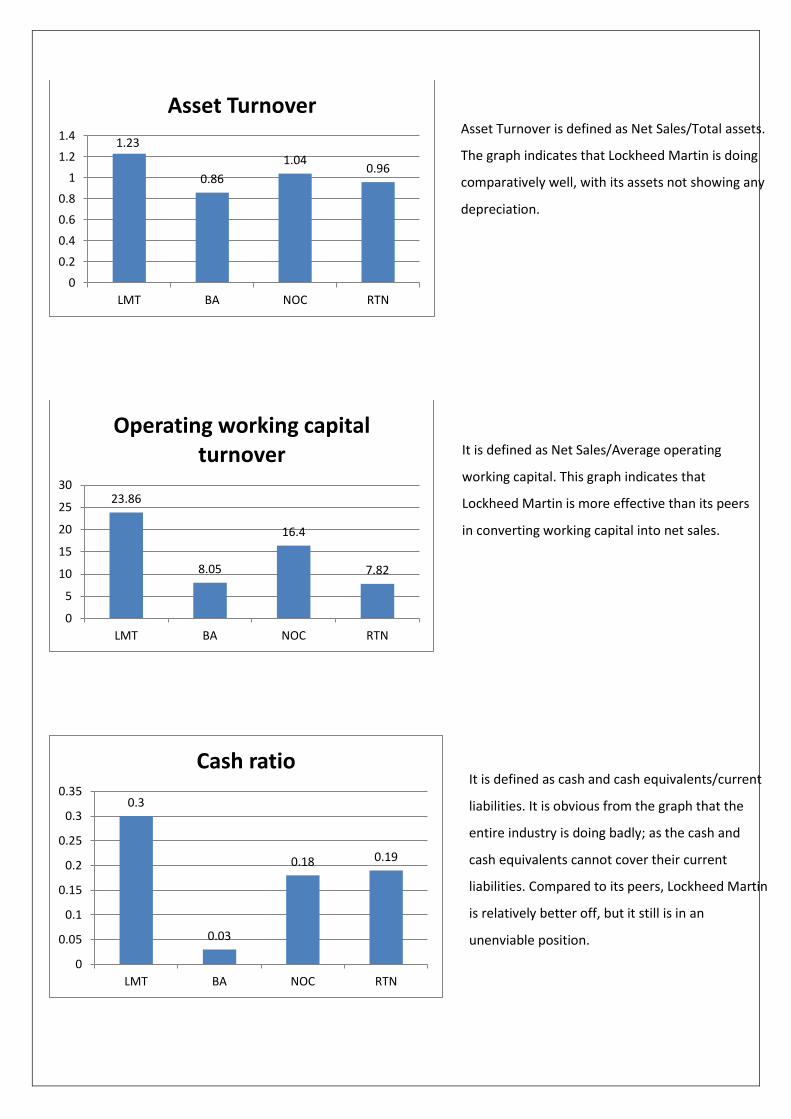
1.23
0.86
1.04 0.96
0
0.2
0.4
0.6
0.8
1
1.2
1.4
LMT BA NOC RTN
Asset Turnover
23.86
8.05
16.4
7.82
0
5
10
15
20
25
30
LMT BA NOC RTN
Operating working capital turnover
0.3
0.03
0.18 0.19
0
0.05
0.1
0.15
0.2
0.25
0.3
0.35
LMT BA NOC RTN
Cash ratio
Asset Turnover is defined as Net Sales/Total assets.
The graph indicates that Lockheed Martin is doing
comparatively well, with its assets not showing any
depreciation.
It is defined as Net Sales/Average operating
working capital. This graph indicates that
Lockheed Martin is more effective than its peers
in converting working capital into net sales.
It is defined as cash and cash equivalents/current
liabilities. It is obvious from the graph that the
entire industry is doing badly; as the cash and
cash equivalents cannot cover their current
liabilities. Compared to its peers, Lockheed Martin
is relatively better off, but it still is in an
unenviable position.
NOTE: In the section on Comparative Financial Ratio Analysis, the following acronyms are used judiciously:
LMT : Lockheed Martin
BA : The Boeing Company
NOC : Northrop Grumman Corporation
RTN : Raytheon Corporation
VALUATION OF THE STOCK:
The stock of Lockheed Martin can be correctly valued using a Free Cash Flow from the Firm(FCFF) model and a Free
Cash Flow to Equity(FCFE) model. On applying these models, the intrinsic value of the stock of Lockheed Martin is
$156.24 per share. Also, there is huge difference between the value of the firm using FCFF and FCFE models. This
quantitative difference represents the present value of total debt of LMT. This is further indication of the fact that
LMT is heavily in debt: analysing along with the facts that weight of debt has been calculated as 0.8.
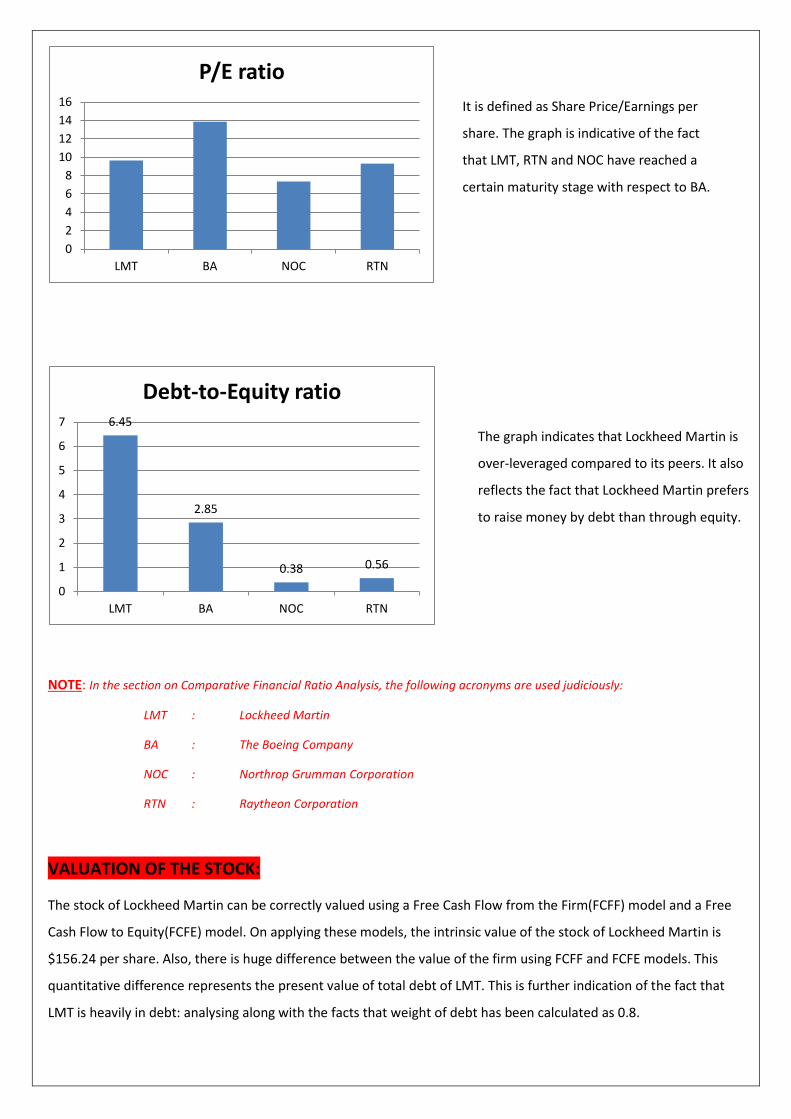
0
2
4
6
8
10
12
14
16
LMT BA NOC RTN
P/E ratio
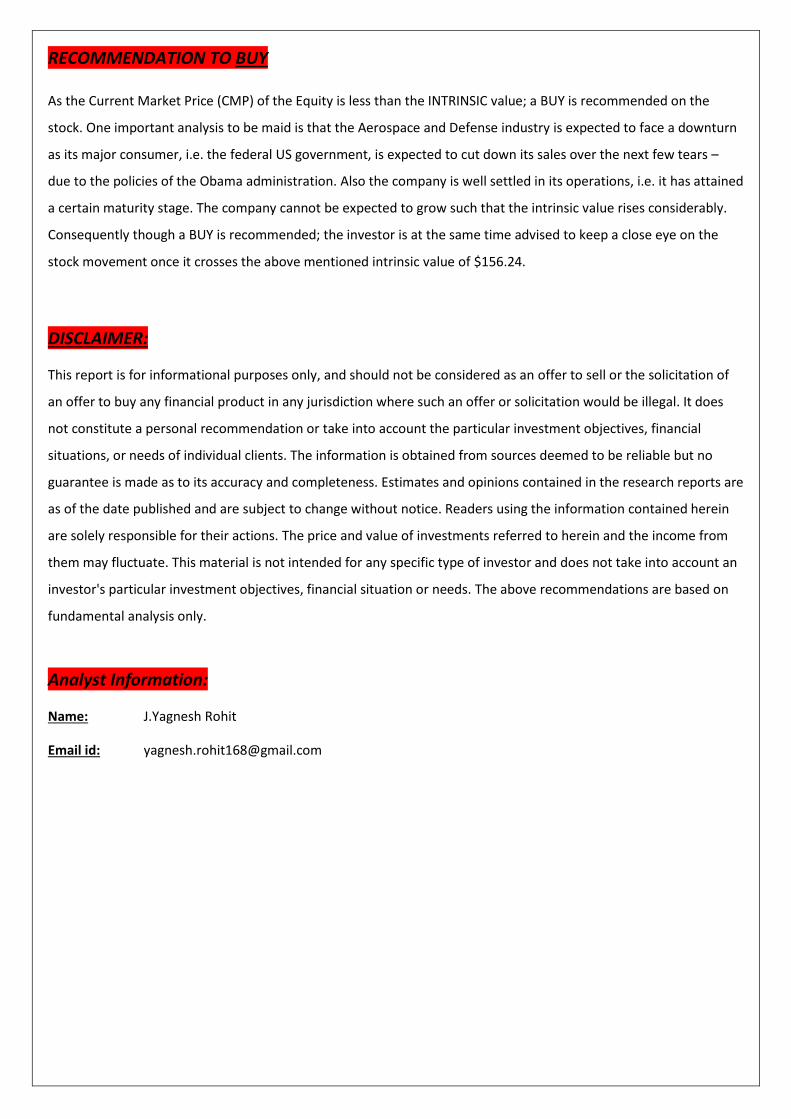
6.45
2.85
0.38 0.56
0
1
2
3
4
5
6
7
LMT BA NOC RTN
Debt-to-Equity ratio
It is defined as Share Price/Earnings per
share. The graph is indicative of the fact
that LMT, RTN and NOC have reached a
certain maturity stage with respect to BA.
The graph indicates that Lockheed Martin is
over-leveraged compared to its peers. It also
reflects the fact that Lockheed Martin prefers
to raise money by debt than through equity.
RECOMMENDATION TO BUY As the Current Market Price (CMP) of the Equity is less than the INTRINSIC value; a BUY is recommended on the
stock. One important analysis to be maid is that the Aerospace and Defense industry is expected to face a downturn
as its major consumer, i.e. the federal US government, is expected to cut down its sales over the next few tears –
due to the policies of the Obama administration. Also the company is well settled in its operations, i.e. it has attained
a certain maturity stage. The company cannot be expected to grow such that the intrinsic value rises considerably.
Consequently though a BUY is recommended; the investor is at the same time advised to keep a close eye on the
stock movement once it crosses the above mentioned intrinsic value of $156.24.
DISCLAIMER:
This report is for informational purposes only, and should not be considered as an offer to sell or the solicitation of
an offer to buy any financial product in any jurisdiction where such an offer or solicitation would be illegal. It does
not constitute a personal recommendation or take into account the particular investment objectives, financial
situations, or needs of individual clients. The information is obtained from sources deemed to be reliable but no
guarantee is made as to its accuracy and completeness. Estimates and opinions contained in the research reports are
as of the date published and are subject to change without notice. Readers using the information contained herein
are solely responsible for their actions. The price and value of investments referred to herein and the income from
them may fluctuate. This material is not intended for any specific type of investor and does not take into account an
investor's particular investment objectives, financial situation or needs. The above recommendations are based on
fundamental analysis only.
Analyst Information:
Name: J.Yagnesh Rohit
Email id: [email protected]