lockheed martin corporation | lockheed martin - …bur204_bmnt2_gwmr-q2-q3_2016_letter to dtsc...
TRANSCRIPT

Prepared for: Prepared by:
TETRA TECH301 E. Vanderbilt, Suite 450San Bernardino, California 92408TC# 34819/B2GWOM.04 / December 2016
Semiannual Groundwater Monitoring Report Second Quarter 2016 and Third Quarter 2016
Laborde Canyon (Lockheed Martin Beaumont Site 2) Beaumont, California

BUR204_BMNT2_GWMR-Q2-Q3_2016_Letter to DTSC
Lockheed Martin Corporation Enterprise Business Services-EESH 2550 North Hollywood Way, Suite 406 Burbank, CA 91505 Telephone 301-548-2184 Facsimile 818-847-0256
December 29, 2016
Mr. Daniel K. Zogaib California Environmental Protection Agency Department of Toxic Substances Control 5796 Corporate Avenue Cypress, California 90630
Subject: Submittal of the Semiannual Groundwater Monitoring Report, Second Quarter 2016 and Third Quarter 2016, Lockheed Martin Corporation, Laborde Canyon (Lockheed Martin Beaumont Site 2), Beaumont California
Dear Mr. Zogaib:
Please find enclosed one hardcopy of the body of the report and two compact discs with the report body and appendices of the Semiannual Groundwater Monitoring Report, Second Quarter 2016 and Third Quarter 2016, Lockheed Martin Corporation, Laborde Canyon (Lockheed Martin Beaumont Site 2), Beaumont California for your review and approval or comment. If you have any questions regarding this submittal, please contact me at 443-280-7176 or [email protected] . Sincerely,
Jeffrey Thomas Beaumont 2 Project Lead Lockheed Martin Corporation Enclosure: Semiannual Groundwater Monitoring Report, Second Quarter 2016 and Third Quarter 2016, Lockheed Martin Corporation, Laborde Canyon (Lockheed Martin Beaumont Site 2), Beaumont California cc: Mr. Brian Thorne, Lockheed Martin Corporation (electronic copy) Ms. Barbara Melcher, CDM Smith (electronic copy)

Tetra Tech Laborde Canyon Semiannual Groundwater Monitoring Report Page iiSecond Quarter 2016 and Third Quarter 2016
TABLE OF CONTENTS
Section Page
Section 1 Introduction ....................................................................................................................1-1
1.1 Site Background ...........................................................................................................1-1
Section 2 Summary of Monitoring Activities ................................................................................2-1
2.1 Groundwater Level Measurements...............................................................................2-1
2.2 Surface Water Sampling...............................................................................................2-1
2.3 Groundwater Sampling.................................................................................................2-2
2.3.1 Proposed and Actual Well Locations Sampled ......................................................2-4
2.3.2 Groundwater Sampling Procedures ........................................................................2-4
2.4 Analytical Data Quality Assurance/Quality Control ....................................................2-5
2.5 Habitat Conservation ....................................................................................................2-5
Section 3 Groundwater Monitoring Results ...................................................................................3-1
3.1 Groundwater Elevation and Flow.................................................................................3-1
3.2 Groundwater Gradients ................................................................................................3-2
3.3 Surface Water Flow......................................................................................................3-2
3.4 Analytical Data Summary ............................................................................................3-3
3.4.1 Data Quality Review ..............................................................................................3-3
3.5 Chemicals of Potential Concern ...................................................................................3-4
3.5.1 Organic Analytes ....................................................................................................3-5
3.5.2 Inorganic Analytes..................................................................................................3-6
3.5.3 Chemicals of Potential Concern .............................................................................3-7
3.6 Surface Water Sampling Results ..................................................................................3-7
3.7 Temporal Trends in Groundwater Chemical Concentrations.......................................3-7
3.8 Groundwater Monitoring Program and the Groundwater Quality MonitoringNetwork ......................................................................................................................3-10
3.8.1 Groundwater Sampling Frequency.......................................................................3-10

Tetra Tech Laborde Canyon Semiannual Groundwater Monitoring Report Page iiiSecond Quarter 2016 and Third Quarter 2016
3.8.2 Increasing Trend Wells.........................................................................................3-11
3.9 Habitat Conservation ..................................................................................................3-12
Section 4 Summary and Conclusions .............................................................................................4-1
4.1 Groundwater Elevation and Gradient ...........................................................................4-1
4.2 Surface Water Flow Results .........................................................................................4-2
4.3 Surface Water and Storm Water Sampling Results......................................................4-2
4.4 Groundwater Sampling Results....................................................................................4-2
4.4.1 Groundwater Sampling Results..............................................................................4-2
Section 5 References ......................................................................................................................5-1

Tetra Tech Laborde Canyon Semiannual Groundwater Monitoring Report Page ivSecond Quarter 2016 and Third Quarter 2016
LIST OF FIGURES
Figure 1 Regional Location of Laborde Canyon
Figure 2 Historical Operational Areas and Site Features
Figure 3 Surface and Storm-Water Sampling Locations
Figure 4 Second Quarter 2016 Sampling Locations
Figure 5 Groundwater Contours for First Groundwater - Second Quarter 2016
Figure 6 Groundwater Contours for First Groundwater - Third Quarter 2016
Figure 7 Changes in Groundwater Elevation - Second Quarter 2016
Figure 8 Changes in Groundwater Elevation - Third Quarter 2016
Figure 9 1,4-Dioxane Isoconcentration Map (µg/L) – Second Quarter 2016
Figure 10 Trichloroethene (TCE) Isoconcentration Map (µg/L) – Second Quarter 2016
Figure 11 Perchlorate Isoconcentration Map (µg/L) – Second Quarter 2016
Figure 12 Perchlorate Statistical Analysis Summary Results
Figure 13 TCE Statistical Analysis Summary Results
Figure 14 1,4-Dioxane Statistical Analysis Summary Results
Figure 15 RDX Statistical Analysis Summary Results

Tetra Tech Laborde Canyon Semiannual Groundwater Monitoring Report Page vSecond Quarter 2016 and Third Quarter 2016
LIST OF TABLES
Table 1 Groundwater Elevation Data - Second Quarter 2016 and Third Quarter 2016
Table 2 Sampling Schedule and Analysis Method - Second Quarter 2016
Table 3 2016 Water Quality Monitoring Locations and Sampling Frequency
Table 4 Groundwater Elevation Change - Second Quarter 2016 and Third Quarter 2016
Table 5 Summary of Horizontal and Vertical Groundwater Gradients - Second Quarter2016 and Third Quarter 2016
Table 6 Summary of Validated Detected Organic and Inorganic Analytes - Second Quarter2016
Table 7 Summary Statistics for Validated Detected Organic and Inorganic Analytes -Second Quarter 2016
Table 8 Groundwater Chemicals of Potential Concern
Table 9 Mann-Kendall Concentration Trend Matrix
Table 10 Summary of Mann-Kendall Trend Analysis of Chemicals of Potential Concernfor 2016 Sampled Monitoring Wells
Table 11 Summary of Mann-Kendall Trend Analysis of Chemicals of Potential Concernfor 2016 Sampled Surface Water Locations
Table 12 Magnitude of Trends Detected for Chemicals of Potential Concern for 2016Sampled Monitoring Wells
Table 13 Historical Trichloroethene Trend Summary in Monitoring Wells
Table 14 Historical Perchlorate Trend Summary in Monitoring Wells
Table 15 Historical 1,4-Dioxane Trend Summary in Monitoring Wells
Table 16 Summary of Increasing Trends for Chemicals of Potential Concern – SecondQuarter 2016
Table 17 Current Sampling Frequencies by Well Classification
Table 18 2017 Water Quality Monitoring Locations and Sampling Frequency
Tetra Tech Laborde Canyon Semiannual Groundwater Monitoring Report Page viSecond Quarter 2016 and Third Quarter 2016
APPENDICES
Appendix A Field Data Sheets
Appendix B Well Construction Summary Table
Appendix C DTSC Q2-Q3 2015 GWMR Approval Letter
Appendix D Water Level Hydrographs
Appendix E Chemicals of Potential Concern Time-Series Graphs
Appendix F Summary of Calculated Horizontal and Vertical Groundwater
Gradients
Appendix G Validated Analytical Results by Method
Appendix H Laboratory Data Packages
Appendix I Consolidated Data Summary Table
Appendix J Summary of the Mann-Kendall and Linear Regression Analyses

Tetra Tech Laborde Canyon Semiannual Groundwater Monitoring Report Page viiSecond Quarter 2016 and Third Quarter 2016
ACRONYMS AND ABBREVIATIONS
%/yr percent change per year with respect to the sample mean
bgs below ground surface
BTOC below top of well casing
cis-1,2-DCE cis-1,2-dichloroethene
COV coefficient of variation
1,2-DCA 1,2-dichloroethane
1,1 -DCE 1,1-dichloroethene
DO dissolved oxygen
DWNL State Water Resources Control Board Division of Drinking Water drinking waternotification level
EC electrical conductivity
ft/ft feet per foot
GMP Groundwater Monitoring Program
HCP Habitat Conservation Plan
J This data validation qualifier means the analyte was positively identified, but theconcentration is an estimated value.
LC lower canyon
MAROS Monitoring and Remediation Optimization System
MW monitoring well
MCL State Water Resources Control Board Division of Drinking Water maximumcontaminant level
MEF Mt. Eden formation
mg/L milligrams per liter
MS matrix spike
MSD matrix spike duplicate
msl mean sea level
µg/L micrograms per liter
µg/L/yr micrograms per liter per year
NA not applicable/not available/not analyzed

Tetra Tech Laborde Canyon Semiannual Groundwater Monitoring Report Page viiiSecond Quarter 2016 and Third Quarter 2016
ND non-detect
NTUs nephelometric turbidity units
NWS National Weather Service
ORP oxidation-reduction potential
PQL practical quantitation limit
q This data validation qualifier means the analyte detected was below the PQL.
QAL Quaternary alluvium
QA/QC quality assurance/quality control
RCA Western Riverside County Regional Conservation Authority
RDX hexahydro-1,3,5-trinitro-1,3,5-triazine
RPD relative percent difference
RWQCB Regional Water Quality Control Board, Santa Ana Region
S Mann-Kendall statistic
STF San Timoteo formation
TCE trichloroethene
TOC top of well casing
USEPA United States Environmental Protection Agency
USFWS United States Fish and Wildlife Service
VOC volatile organic compound
WDA waste discharge area
wMEF weathered Mt. Eden formation
wSTF weathered San Timoteo formation
Tetra Tech Laborde Canyon Semiannual Groundwater Monitoring Report Page 1-1Second Quarter 2016 and Third Quarter 2016
Section 1
Introduction
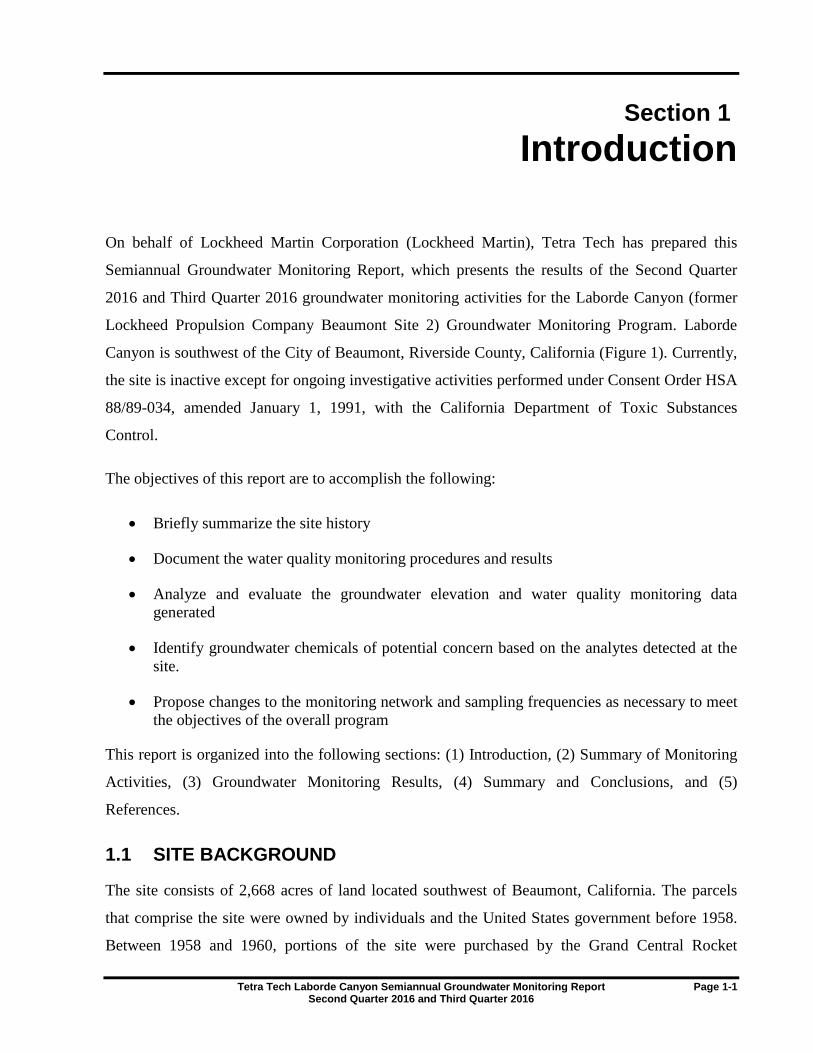
On behalf of Lockheed Martin Corporation (Lockheed Martin), Tetra Tech has prepared this
Semiannual Groundwater Monitoring Report, which presents the results of the Second Quarter
2016 and Third Quarter 2016 groundwater monitoring activities for the Laborde Canyon (former
Lockheed Propulsion Company Beaumont Site 2) Groundwater Monitoring Program. Laborde
Canyon is southwest of the City of Beaumont, Riverside County, California (Figure 1). Currently,
the site is inactive except for ongoing investigative activities performed under Consent Order HSA
88/89-034, amended January 1, 1991, with the California Department of Toxic Substances
Control.
The objectives of this report are to accomplish the following:
• Briefly summarize the site history
• Document the water quality monitoring procedures and results
• Analyze and evaluate the groundwater elevation and water quality monitoring datagenerated
• Identify groundwater chemicals of potential concern based on the analytes detected at thesite.
• Propose changes to the monitoring network and sampling frequencies as necessary to meetthe objectives of the overall program
This report is organized into the following sections: (1) Introduction, (2) Summary of Monitoring
Activities, (3) Groundwater Monitoring Results, (4) Summary and Conclusions, and (5)
References.
1.1 SITE BACKGROUND
The site consists of 2,668 acres of land located southwest of Beaumont, California. The parcels
that comprise the site were owned by individuals and the United States government before 1958.
Between 1958 and 1960, portions of the site were purchased by the Grand Central Rocket

Tetra Tech Laborde Canyon Semiannual Groundwater Monitoring Report Page 1-2Second Quarter 2016 and Third Quarter 2016
Company and used as a remote test facility for early space and defense program efforts. In 1960,
the Lockheed Aircraft Corporation purchased one-half interest in the Grand Central Rocket
Company. The Grand Central Rocket Company became a wholly-owned subsidiary of the
Lockheed Aircraft Corporation in 1961. The remaining parcels of land that comprise the site were
purchased from the United States government between 1961 and 1964. In 1963, the Lockheed
Propulsion Company became an operating division of the Lockheed Aircraft Corporation which
was responsible for the operation of the site until its closure in 1974. The site was used by the
Grand Central Rocket Company and the Lockheed Propulsion Company from 1958 to 1974 for
small rocket motor assembly, testing operations, propellant incineration, and minor disposal
activities. Ogden Labs is known to have leased portions of the site during the 1970s (Radian
Corporation, 1986). In 2007 the property was sold to the County of Riverside, California, which
remains the current owner.
In 1989, the California Department of Health Services issued a Consent Order requiring Lockheed
Martin to clean up contamination at the site related to past testing activities (California
Department of Health Services, 1989). After reviewing reports on investigative and cleanup
activities performed at the site, the California Department of Toxic Substances Control, as a
successor agency, issued a no further remedial action letter to Lockheed Martin in 1993.
Because of regulatory interest in perchlorate and 1,4-dioxane, a groundwater sample was collected
from an inactive groundwater production well (identified as W2-3) at the site in January 2003. The
sample was analyzed for volatile organic compounds, perchlorate, and 1,4-dioxane to determine
the potential presence and concentration of those chemicals in groundwater. The analytical results
indicated that volatile organic compounds and 1,4-dioxane were not present at or above their
respective method detection limits. However, perchlorate was reported at a concentration of 4,080
micrograms per liter, which exceeded the then-current California Department of Public Health
drinking water notification level of 4 micrograms per liter. (In October 2007, the drinking water
notification level was replaced by the California Department of Public Health maximum
contaminant level of 6 micrograms per liter.) Based on the detection of perchlorate in the
groundwater sample collected, the California Department of Toxic Substances Control reopened
the site for further assessment in August 2004.
Tetra Tech Laborde Canyon Semiannual Groundwater Monitoring Report Page 1-3Second Quarter 2016 and Third Quarter 2016
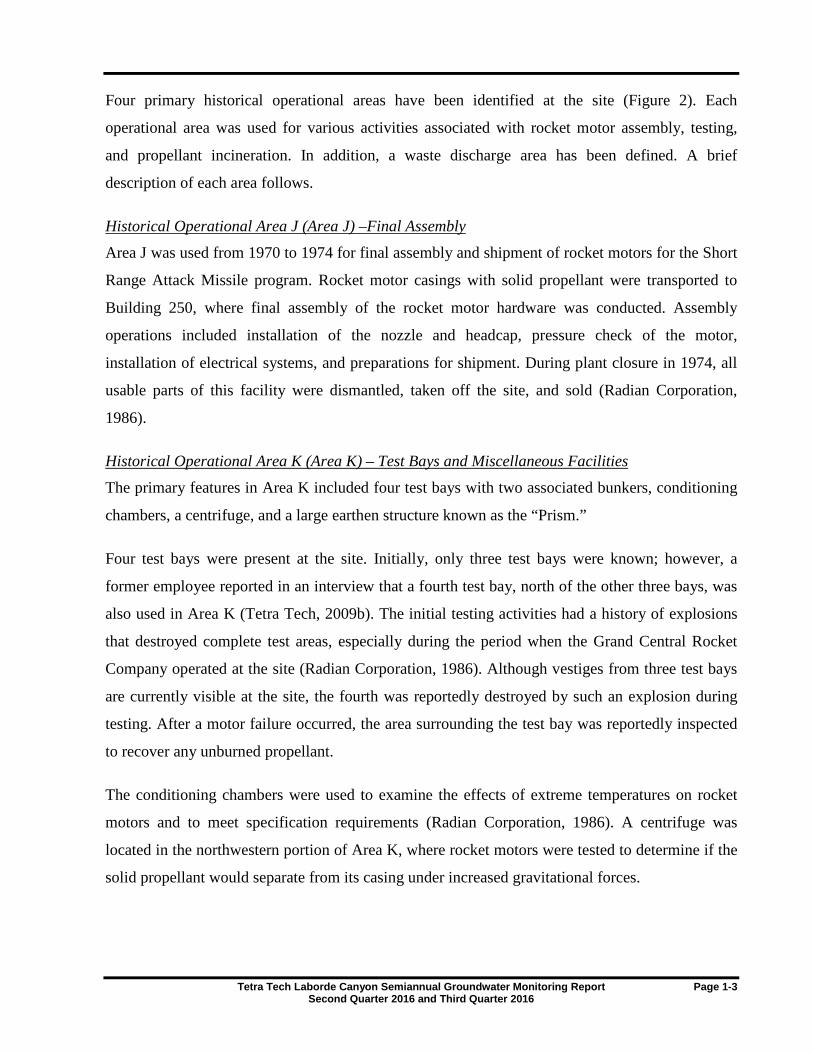
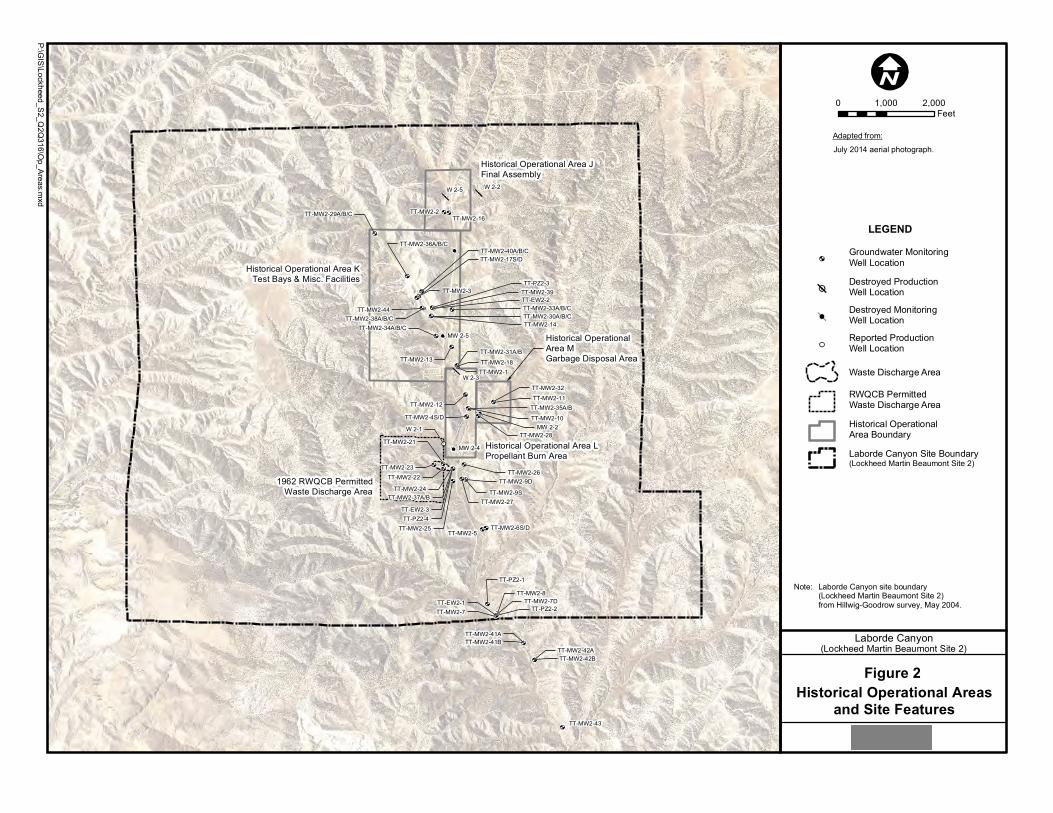
Four primary historical operational areas have been identified at the site (Figure 2). Each
operational area was used for various activities associated with rocket motor assembly, testing,
and propellant incineration. In addition, a waste discharge area has been defined. A brief
description of each area follows.
Historical Operational Area J (Area J) –Final Assembly
Area J was used from 1970 to 1974 for final assembly and shipment of rocket motors for the Short
Range Attack Missile program. Rocket motor casings with solid propellant were transported to
Building 250, where final assembly of the rocket motor hardware was conducted. Assembly
operations included installation of the nozzle and headcap, pressure check of the motor,
installation of electrical systems, and preparations for shipment. During plant closure in 1974, all
usable parts of this facility were dismantled, taken off the site, and sold (Radian Corporation,
1986).
Historical Operational Area K (Area K) – Test Bays and Miscellaneous Facilities
The primary features in Area K included four test bays with two associated bunkers, conditioning
chambers, a centrifuge, and a large earthen structure known as the “Prism.”
Four test bays were present at the site. Initially, only three test bays were known; however, a
former employee reported in an interview that a fourth test bay, north of the other three bays, was
also used in Area K (Tetra Tech, 2009b). The initial testing activities had a history of explosions
that destroyed complete test areas, especially during the period when the Grand Central Rocket
Company operated at the site (Radian Corporation, 1986). Although vestiges from three test bays
are currently visible at the site, the fourth was reportedly destroyed by such an explosion during
testing. After a motor failure occurred, the area surrounding the test bay was reportedly inspected
to recover any unburned propellant.
The conditioning chambers were used to examine the effects of extreme temperatures on rocket
motors and to meet specification requirements (Radian Corporation, 1986). A centrifuge was
located in the northwestern portion of Area K, where rocket motors were tested to determine if the
solid propellant would separate from its casing under increased gravitational forces.
Tetra Tech Laborde Canyon Semiannual Groundwater Monitoring Report Page 1-4Second Quarter 2016 and Third Quarter 2016
The Prism was reportedly built between 1984 and 1990, and was used by General Dynamics to
test radar (Tetra Tech, 2007b). Details concerning construction of the Prism are not available, but
it appears to have been constructed with soils from near the test bays.
Historical Operational Area L (Area L) – Propellant Burn Area
Solid propellant was reportedly transported to a burn area in Area L and set directly on the ground
surface for burning (Radian Corporation, 1986). No pits or trenches were dug as part of the
burning process according to the Radian report. No evidence or physical features identify the
precise location of burning activities, and previous site investigations (Tetra Tech, 2005 and
2010a) found no evidence of significant contamination in Area L, suggesting that propellant
incineration may not have been conducted in this area of the site.
Historical Operational Area M (Area M) – Garbage Disposal Area
The Area M garbage disposal area was located adjacent to a small creek at the site (Radian
Corporation, 1986). Scrap metal, paper, wood, and concrete materials were discarded at the
disposal site by the Lockheed Propulsion Company. Hazardous materials, including explosives
and propellants, were not disposed of at the disposal site by the Lockheed Propulsion Company,
according to employee interviews. However, Ogden Labs, a company that tested valves and
explosive items, reportedly used this site for disposal of hazardous waste. In 1972, a Lockheed
Safety Technician was exposed to toxic vapors of unsymmetrical dimethyl hydrazine from a
pressurized gas container located in the disposal site. To avoid possible exposure risks to
occupants, the Lockheed Propulsion Company safety group required Ogden Labs to remove any
potentially hazardous materials at the disposal site. Shortly thereafter, Ogden Labs contracted for a
disposal company to clean up the disposal site (Radian Corporation, 1986).
In March 1993, an excavation was performed to remove the debris from the Area M garbage
disposal area. A total of 816 tons of debris was removed and disposed of off-site, and the
excavation was backfilled to surrounding grade. Excavation activities were performed under the
supervision of the Department of Toxic Substances Control (Radian Corporation, 1993).
Waste Discharge Area
In 2007, Lockheed Martin discovered the existence of Santa Ana River Basin Regional Water
Pollution Control Board Resolution 62-24, dated September 14, 1962. Resolution 62-24 described
requirements for the “discharge of industrial wastes (rocket fuel residuum) to excavated pits.” The

Tetra Tech Laborde Canyon Semiannual Groundwater Monitoring Report Page 1-5Second Quarter 2016 and Third Quarter 2016
discharge area was described as two shallow basins protected by two-foot berms, located in a
small canyon on the western side of Laborde Canyon, in the SW quarter of the NW quarter of
Section 19, Township 3 South, Range 1 West, San Bernardino Baseline and Meridian. Resolution
62-24 further described the wastes to be discharged as “residue remaining after the manufacturing
refuse is burned,” and indicated that the amount of material to be discharged was “approximately
5,000 gallons per year.”
The exact nature of the waste proposed for discharge is not clear from Resolution 62-24. The
description of the waste material suggests that the area may have been used for burning propellant;
but the description of the quantity of material to be discharged suggests that the waste may have
been liquid rather than solid. A 1961 aerial photograph shows the waste discharge area as a large
cleared area with roads leading to two circular structures, suggesting that the waste discharge area
was in use by 1961 (Tetra Tech, 2009b). Investigation of this area found evidence for perchlorate
impacts in both soil and groundwater (Tetra Tech, 2007b and 2008).
Features remaining at the waste discharge area include two roughly circular depressions
surrounded by earthen berms, at the location of the circular structures identified in the 1961 aerial
photograph.

Tetra Tech Laborde Canyon Semiannual Groundwater Monitoring Report Page 2-1Second Quarter 2016 and Third Quarter 2016
Section 2
Summary of Monitoring Activities
Section 2 summarizes the Second Quarter 2016 and Third Quarter 2016 groundwater monitoring
activities conducted at the site. The results of these monitoring events are discussed in Section 3.
2.1 GROUNDWATER LEVEL MEASUREMENTS
Groundwater level measurements are collected at the site on a quarterly basis from all available
wells. Water level measurements were proposed for 71 wells and four piezometers for Second
Quarter 2016 and Third Quarter 2016. During Second Quarter 2016, groundwater level
measurements were collected from 69 monitoring wells and four piezometers on 10 May and 11
May 2016. Two monitoring wells, TT-MW2-29A and TT-MW2-43, were found to be dry. During
Third Quarter 2016, groundwater level measurements were collected from 69 monitoring wells
and four piezometers on 22 August 2016. The same two monitoring wells were found to be dry.
The groundwater level data are summarized in Table 1. Copies of the field data sheets from the
water quality monitoring events are presented in Appendix A. A summary of well construction
details is presented in Appendix B.
Precipitation data are collected from the local weather station in Beaumont to correlate observed
changes in groundwater levels with local precipitation. During Second Quarter 2016, the
Beaumont National Weather Service (NWS) station reported approximately 1.89 inches of
precipitation. During Third Quarter 2016, the Beaumont NWS station reported approximately 0.16
inches of precipitation.
2.2 SURFACE WATER SAMPLING
Surface water samples are collected at the site during the second and fourth quarter groundwater
monitoring events. Surface water sampling locations WS-1, WS-2, and WS-3 are located at a
spring approximately 3,700 feet south of the southern site boundary on the Western Riverside
County Regional Conservation Authority (RCA) property. Surface water is generally present at

Tetra Tech Laborde Canyon Semiannual Groundwater Monitoring Report Page 2-2Second Quarter 2016 and Third Quarter 2016
one or more of these sampling locations throughout the year. Figure 3 shows the surface water
sampling locations.
Storm water samples are collected at the site on an annual basis, usually during the first quarter.
Storm-water sampling locations SW-01 through SW-07 are in ephemeral stream beds within
Laborde Canyon and major side canyons. Storm water runoff drains to the stream beds during
periods of heavy precipitation and flows south through the site and the RCA property, eventually
crossing beneath Gilman Hot Springs Road. Water is present in the stream beds only during
periods of heavy, prolonged precipitation. Surface water flow measurements are collected at
locations SF1 and SF2 when surface water is present in the stream bed. Figure 3 shows the storm-
water sampling and stream-flow measurement locations.
During the Second Quarter 2016 monitoring event, three surface water sampling locations (WS-1
through WS-3) were proposed for water quality monitoring but were found to be dry and were not
sampled. Table 2 lists the locations monitored for the Second Quarter 2016 monitoring event;
Figure 4 illustrates the sampling locations. During the Third Quarter 2016 monitoring event, no
surface water samples were scheduled to be collected.
2.3 GROUNDWATER SAMPLING
The Groundwater Monitoring Program (GMP) has a quarterly, semiannual, annual, and biennial
frequency. Both groundwater and surface water are sampled as part of the GMP. The annual event
is the major monitoring event, and the quarterly and semiannual events are smaller, minor events.
All new wells are sampled quarterly for one year, after which a frequency for future sampling is
proposed based on the well classification (i.e., the purpose of the well). The well classifications
from the approved Groundwater Sampling and Analysis Plan (Tetra Tech, 2007a) include the
following:
• Horizontal Extent Wells: Horizontal extent wells are utilized to assess the lateral extent ofaffected groundwater and the shape of the plume. Horizontal extent wells can be utilized totrack plume migration and plume reduction rates as a result of remedial actions.
• Vertical Distribution Wells: Vertical distribution wells are utilized to assess the verticalextent of affected groundwater. Vertical distribution wells can also be utilized to trackplume migration and plume reduction rates as a result of remedial actions.

Tetra Tech Laborde Canyon Semiannual Groundwater Monitoring Report Page 2-3Second Quarter 2016 and Third Quarter 2016
• Increasing Contaminant Trend Wells: Increasing contaminant trend wells are wells thatdemonstrate statistically increasing contaminant trends. Increasing contaminant trend wellsare utilized to assist in identifying new contaminant sources or areas where the remedialactions are not effective.
• Guard Wells: Guard wells would be utilized to provide an early warning to detectcontaminants for the protection of private and municipal wells. Guard wells may alsoinclude wells used to monitor off-site contaminant migration.
• Background Wells: Background (or upgradient) wells are utilized to assess the quality ofthe groundwater that is entering the site.
• Remedial Monitoring Wells: Remedial monitoring wells are utilized to evaluate theeffectiveness of remedial activities at the site. Remedial monitoring wells can be used tomeasure mass removal rates and assess remediation schedules for site cleanup.
• New Wells: New wells are wells that are new to the network or which have been out of thesampling program for an extended period of time.
• Redundant Wells: Redundant wells are wells that provide information that duplicates thedata from other functional well classifications. Redundant wells are generally located inthe same vicinity as one of the other well classifications. These wells provide no additionaltechnical information and would not be monitored.
The annual monitoring event is performed during the second quarter of each year, and includes
sampling of horizontal extent wells, vertical distribution wells, increasing contaminant trend wells,
and guard wells. Background wells are also sampled during the annual monitoring event in even-
numbered years. The semiannual event is performed during the fourth quarter of each year, and
includes sampling of increasing contaminant trend and guard wells only. Quarterly events
currently consist of water level measurements only. A complete list of the surface water and
monitoring well locations in the monitoring program can be found in Table 3. The table shows the
well classification and the current approved sampling frequency for each well.
The groundwater monitoring schedule is reviewed and modified as necessary annually following
the second quarter groundwater monitoring event. Modifications to the sampling schedule are
made in accordance with the approved Groundwater Sampling and Analysis Plan (Tetra Tech,
2007a). The Second and Third Quarter 2016 sampling events followed the monitoring schedule
proposed in the Second and Third Quarter 2015 monitoring report (Tetra Tech, 2015), which was
submitted to the California Department of Toxic Substances Control in December 2015, and was
approved with no comments to the proposed schedule in March 2016 (Appendix C).

Tetra Tech Laborde Canyon Semiannual Groundwater Monitoring Report Page 2-4Second Quarter 2016 and Third Quarter 2016
2.3.1 Proposed and Actual Well Locations Sampled
During the Second Quarter 2016 monitoring event, 51 groundwater monitoring wells were
proposed for water quality monitoring. Two monitoring wells, TT-MW2-5 and TT-MW2-29A,
were either dry or had insufficient water for sampling and could not be sampled. Therefore, water
quality data were collected from 49 monitoring wells. Table 2 lists the locations monitored for the
Second Quarter 2016 monitoring event, analytical methods, sampling dates, and QA/QC samples
collected. Figure 4 illustrates the sampling locations for the Second Quarter 2016 monitoring
event. During the Third Quarter 2016 monitoring event, no groundwater monitoring wells or off-
site private production wells or springs were scheduled to be sampled.
2.3.2 Groundwater Sampling Procedures
Groundwater sampling was performed by low-flow purging and sampling methods, using either
dedicated double-valve sampling pumps or a non-dedicated bladder pump, as indicated in Table 2.
Water quality field parameters (water level, temperature, pH, electrical conductivity [EC],
turbidity, oxidation-reduction potential [ORP], and dissolved oxygen [DO]) were measured during
well purging and recorded on field data sheets (Appendix A). Collection of water quality
parameters started when at least one discharge hose/pump volume had been removed, and purging
was considered complete when the above parameters had stabilized, or the well was purged dry.
Stabilization of water quality parameters was used as an indication that representative formation
water had entered the well and was being purged. The criteria for stabilization of these parameters
were as follows: water level ± 0.1 foot, pH ± 0.1, EC ± three percent, turbidity < 10 nephelometric
turbidity units (NTUs) (if > 10 NTUs ± 10%), DO ± 0.3 milligrams per liter (mg/L), and ORP ±
10 millivolts. Sampling instruments and equipment were maintained, calibrated, and operated in
accordance with the manufacturers’ specifications, guidelines, and recommendations. If a well was
purged dry but recharge occurred, the well was sampled with a disposable bailer after sufficient
recharge had taken place to allow sample collection.
Groundwater samples were collected in order of decreasing volatilization potential and placed in
appropriate containers. A sample identification label was affixed to each container, and sample
custody was maintained by chain-of-custody record. To maintain proper temperatures and sample
integrity, samples collected were chilled and transported via courier to American Environmental
Testing Laboratories, Inc. or EMAX Laboratories, Inc., state-accredited analytical laboratories.
Trip blanks were collected for the monitoring events to assess potential cross-contamination of

Tetra Tech Laborde Canyon Semiannual Groundwater Monitoring Report Page 2-5Second Quarter 2016 and Third Quarter 2016
water samples while in transit to the laboratory in accordance with the Revised Programmatic
Sampling and Analysis Plan (Tetra Tech, 2016). Equipment blanks were collected when sampling
with non-dedicated equipment to assess potential cross-contamination of water samples via
sampling equipment.
2.4 ANALYTICAL DATA QUALITY ASSURANCE/QUALITY CONTROL
The samples were tested using approved United States Environmental Protection Agency
(USEPA) methods. Since the analytical data were obtained by following USEPA-approved
method criteria, the data were evaluated by using the USEPA-approved validation methods
described in the National Functional Guidelines (USEPA, 2014a and 2014b). These guidelines
contain instructions on method-required quality control parameters and on how to interpret these
parameters to confer validation to environmental data results.
Quality control parameters used in validating data results include holding times, field blanks,
laboratory control samples, method blanks, duplicate environmental samples, spiked samples, and
surrogate and spike recovery data.
2.5 HABITAT CONSERVATION
All monitoring activities were performed in accordance with the United States Fish and Wildlife
Service (USFWS) approved Habitat Conservation Plan (HCP) (USFWS, 2005) and subsequent
clarifications (Lockheed Martin, 2006a and 2006b) to the HCP. Groundwater sampling activities
were conducted with light duty vehicles and were supervised by a USFWS-approved biologist, as
specified in the Low Effect HCP.

Tetra Tech Laborde Canyon Semiannual Groundwater Monitoring Report Page 3-1Second Quarter 2016 and Third Quarter 2016
Section 3
Groundwater Monitoring Results
The results of Second Quarter 2016 and Third Quarter 2016 groundwater monitoring events are
presented in the following subsections. These subsections describe tabulated summaries of the
groundwater elevation and water quality data, groundwater elevation maps, and figures showing
analytical results.
3.1 GROUNDWATER ELEVATION AND FLOW
Seventy-one monitoring wells and four piezometers were identified for groundwater level
measurements during the Second Quarter 2016 and Third Quarter 2016 monitoring events. During
these events, two wells were dry (TT-MW2-29A, and TT-MW2-43) during both Second Quarter
2016 and Third Quarter 2016 events. A tabulated summary of groundwater depths and elevations
is presented in Table 1.
On-site groundwater elevations during the Second Quarter 2016 and Third Quarter 2016
monitoring events ranged from approximately 2,072 feet above mean sea level (msl) at TT-MW2-
16, located in the northern portion of the site, to about 1,815 feet above msl at TT-MW2-8, located
in the southern portion of the site. Depth to first groundwater ranged from about 121 feet below
ground surface (bgs) at TT-MW2-29B to about 21 feet bgs at TT-MW2-8. Groundwater elevation
contour maps for wells screened in first groundwater for the Second Quarter 2016 and Third
Quarter 2016 are presented in Figures 5 and 6, respectively. Hydrographs for individual wells are
provided in Appendix D.
During Second Quarter 2016, the Beaumont National Weather Service (NWS) reported
approximately 1.89 inches of precipitation, and the average site-wide groundwater elevation
increased approximately 0.13 feet. During Third Quarter 2016, the Beaumont NWS reported
approximately 0.16 inches of precipitation, and the average site-wide groundwater elevation
decreased approximately 0.12 feet. Table 4 presents the range and average change in groundwater
elevation by area. Figures 7 and 8, respectively, present elevation differences between the First

Tetra Tech Laborde Canyon Semiannual Groundwater Monitoring Report Page 3-2Second Quarter 2016 and Third Quarter 2016
Quarter 2016 and Second Quarter 2016, and between the Second Quarter 2016 and Third Quarter
2016 groundwater monitoring events.
3.2 GROUNDWATER GRADIENTS
Horizontal groundwater gradients are calculated using a segmented path from well to well that
approximates the overall site flowline. The horizontal gradient is a measure of the change in the
hydraulic head divided by the distance between wells (i.e., the slope of the water table). The
average horizontal groundwater gradient calculated between TT-MW2-16 and TT-MW2-6S for
the Second Quarter 2016 and Third Quarter 2016 groundwater monitoring events for the shallow
wells screened in the weathered San Timoteo formation (wSTF) was 0.030 feet per foot (ft/ft). The
horizontal groundwater gradient calculated between TT-MW2-2 and TT-MW2-6D for deeper
wells screened in the San Timoteo formation (STF) was 0.029 ft/ft during the Second Quarter
2016 and Third Quarter 2016 groundwater monitoring events.
Vertical groundwater gradients are calculated from individual clusters of wells. Well clusters
measure the differences in static water level at different depths in the aquifer. The vertical gradient
is a comparison of static water levels between wells at different depths in the aquifer, and is an
indication of the vertical head difference (downward—negative gradient, upward—positive
gradient) of groundwater. Vertical groundwater gradients at the site are generally downward.
During the Second Quarter 2016 and Third Quarter 2016 groundwater monitoring events, the
vertical gradients ranged from -0.32 ft/ft at well cluster TT-MW2-4S and -4D located in Area L,
to +0.17 ft/ft at well cluster TT-MW2-19S and -19D, located on the Western Riverside County
Regional Conservation Authority (RCA) property to the south of the site respectively. A summary
of calculated horizontal and vertical groundwater gradients is presented in Table 5. A complete
listing of historical horizontal and vertical groundwater gradients and associated calculations is
presented in Appendix F.
3.3 SURFACE WATER FLOW
During the Second Quarter 2016 and Third Quarter 2016, Tetra Tech field personnel walked the
Laborde Canyon drainage channel to determine the presence, nature, and quantity of surface water
within the creek bed. Surface water was not present within the creek bed during either the Second
Quarter 2016 or Third Quarter 2016 monitoring events, so stream flow measurements were not
taken.

Tetra Tech Laborde Canyon Semiannual Groundwater Monitoring Report Page 3-3Second Quarter 2016 and Third Quarter 2016
3.4 ANALYTICAL DATA SUMMARY
All groundwater samples collected during the Second Quarter 2016 monitoring event were
analyzed for perchlorate. Select wells were also sampled for volatile organic compounds (VOCs),
1,4-dioxane, and hexahydro-1,3,5-trinitro-1,3,5-triazine (RDX), as indicated in Table 6.
Groundwater and surface water samples were not scheduled to be collected during the Third
Quarter 2016 monitoring event.
A summary of validated laboratory analytical results for analytes detected above their respective
method detection limits during the Second Quarter 2016 monitoring event is presented in Table 6.
Analytes with sample results above the published State Water Resources Control Board Division
of Drinking Water maximum contaminant level (MCL) or the State Water Resources Control
Board Division of Drinking Water drinking water notification level (DWNL) are indicated by bold
type in Table 6. Table 7 presents summary statistics for validated organic and inorganic analytes
detected during the monitoring event. A complete list of the analytes tested, along with validated
sample results by analytical method, is provided in Appendix G. Laboratory analytical data
packages, which include all environmental, field quality control (QC), and laboratory QC results,
are provided in Appendix H. A consolidated laboratory data summary table is presented in
Appendix I.
3.4.1 Data Quality Review
The quality control samples were reviewed as described in the Revised Programmatic Sampling
and Analysis Plan, Beaumont Sites 1 and 2 (Tetra Tech, 2016). The data for the groundwater
sampling activities were contained in analytical data packages generated by American
Environmental Testing Laboratories, Inc. and EMAX Laboratories, Inc. These data packages were
reviewed using the latest versions of the United States Environmental Protection Agency National
Functional Guidelines for organic and inorganic superfund data review (USEPA, 2014a and
2014b).
Preservation criteria, holding times, field blanks, laboratory control samples, method blanks,
duplicate environmental samples, spiked samples, and surrogate and spike recovery data were
reviewed. Within each environmental sample, the sample-specific quality control spike recoveries
were examined. These data examinations included comparing statistically calculated control limits
to percent recoveries of all spiked analytes and duplicate spiked analytes. Relative percent

Tetra Tech Laborde Canyon Semiannual Groundwater Monitoring Report Page 3-4Second Quarter 2016 and Third Quarter 2016
difference (RPD) control limits were compared to actual spiked (matrix spike/matrix spike
duplicate [MS/MSD]) RPD results. Surrogate recoveries were examined for all organic compound
analyses and compared to their control limits.
Environmental samples were analyzed by the following methods: Method SW6850 for
perchlorate, Method SW8270C SIM for 1,4-dioxane, Method SW8330A for RDX, and Method
SW8260B for VOCs. All data results met required criteria, are of known precision and accuracy,
did not require qualification, and may be used as reported.
3.5 CHEMICALS OF POTENTIAL CONCERN
The identification of chemicals of potential concern is an ongoing process that takes place
annually as part of the second quarter sampling event, and is reported in each year’s Second
Quarter and Third Quarter Semiannual Groundwater Monitoring Report. The purpose of
identifying chemicals of potential concern is twofold: to establish a list of analytes that best
represents the extent and magnitude of affected groundwater, and to focus more detailed analysis
on those analytes. The analytes were organized and evaluated in two groups, organic and
inorganic, and divided into primary and secondary chemicals of potential concern. Table 6
presents a summary of the validated organic and inorganic analytes detected during the Second
Quarter 2016 monitoring event.
The identification process for chemicals of potential concern does not eliminate analytes from
testing, but does reduce the number of analytes that are evaluated and discussed during reporting.
All of the secondary chemicals of potential concern will continue to be tested during future
monitoring events because of their association with other analytes that are listed as primary
chemicals of potential concern. However, they are not discussed further because they are detected
on a more limited or inconsistent basis, and/or are detected at concentrations below a regulatory
threshold. The standard list of analytes for each method will continue to be tested and screened
annually to ensure that the appropriate chemicals of potential concern are being identified and
evaluated. Table 8 presents a summary of the Laborde Canyon chemicals of potential concern.
Time-series graphs of perchlorate, trichloroethene (TCE), and 1,4-dioxane concentrations are
provided in Appendix E.
Tetra Tech Laborde Canyon Semiannual Groundwater Monitoring Report Page 3-5Second Quarter 2016 and Third Quarter 2016
3.5.1 Organic Analytes
Seven organic analytes (RDX, 1,4-dioxane, carbon tetrachloride, 1,2-dichloroethane [1,2-DCA],
1,1-dichloroethene [1,1-DCE], cis-1,2-dichloroethene [cis-1,2-DCE], and TCE) were detected
above their respective MCL or DWNL during the Second Quarter 2016 monitoring event.
RDX was detected above the DWNL of 0.3 micrograms per liter (µg/L) in the groundwater
sample collected from monitoring well TT-MW2-13 during the Second Quarter 2016 monitoring
event, at a concentration of 0.38 µg/L. Monitoring well TT-MW2-13 is located in Area K.
1,4-Dioxane was reported in groundwater samples below the DWNL of 1.0 µg/L in three wells
(TT-MW2-06S, TT-MW2-27, and TT-MW2-37B) and above the DWNL in four wells (TT-MW2-
09S, TT-MW2-22, TT-MW2-24, and TT-MW2-37A) during the Second Quarter 2016 monitoring
event, at concentrations ranging from 19.5 to 105 µg/L. All wells with 1,4-dioxane detections are
located within or downgradient from the former waste discharge area (WDA). Time-series graphs
of 1,4-dioxane are provided in Appendix E.
1,2-DCA was reported above the MCL of 0.5 µg/L two groundwater samples collected from
monitoring wells TT-MW2-22 and TT-MW2-24 during the Second Quarter 2016 monitoring
event, at concentrations of 1.35 and 1.18 µg/L, respectively. Monitoring well TT-MW2-22 is
located in the former WDA, and monitoring well TT-MW2-24 is located immediately
downgradient from the former WDA.
1,1-DCE was reported above the MCL in the groundwater sample collected from monitoring well
TT-MW2-22 during the Second Quarter 2016 monitoring event, at a concentration of 15 µg/L.
Monitoring well TT-MW2-22 is located in the former WDA.
The compound cis-1,2-DCE was reported above the MCL of 6 µg/L in the groundwater sample
collected from monitoring well TT-MW2-22 (in the former WDA) during the Second Quarter
2016 monitoring event, at a concentration of 15.6 µg/L. Carbon tetrachloride was reported above
the MCL of 0.5 µg/L in the groundwater sample collected from monitoring well TT-MW2-24
(immediately downgradient from the former WDA) during the Second Quarter 2016 monitoring
event, at a concentration of 1.12 µg/L. TCE was reported below the MCL of 5 µg/L in
groundwater samples collected from two monitoring wells (TT-MW2-9S and TT-MW2-21)
located in, or just downgradient from, the former WDA during the Second Quarter 2016

Tetra Tech Laborde Canyon Semiannual Groundwater Monitoring Report Page 3-6Second Quarter 2016 and Third Quarter 2016
monitoring event at concentrations ranging from 0.870 to 4.76 µg/L. TCE was above the MCL in
groundwater samples collected from three groundwater monitoring wells (TT-MW2-22, TT-
MW2-24, and TT-MW2-37A) located in, or just downgradient from, the former WDA during the
Second Quarter 2016 monitoring event at concentrations ranging from 5.85 to 424 µg/L. TCE was
also detected below the MCL in monitoring well TT-MW2-11 (Area M) and TT-MW2-17S (Area
K) at concentrations of 2.85 and 0.590 µg/L, respectively. TCE was detected above the MCL in
monitoring well TT-MW2-17D (Area K), at a concentration of 6.92 µg/L during the Second
Quarter 2016 monitoring event. Time-series graphs of TCE are provided in Appendix E.
Four additional organic analytes (bromodichloromethane, bromoform, dibromochloromethane,
and chloroform) were detected above their respective MCLs in monitoring well TT-MW2-24.
Based on historic analytical information for this well, these data are considered anomalous and are
likely caused by contamination from an outside source.
Other organic analytes detected at low levels during the Second Quarter 2016 groundwater
monitoring event were 1,1-dichloroethane, detected in two wells, and chloromethane, detected in
one well. 1,1-Dichloroethane was not detected above its MCL of 5 µg/L and chloromethane does
not have an established MCL or DWNL. Neither of these compounds detected consistently from
event to event.
3.5.2 Inorganic Analytes
One inorganic analyte (perchlorate) was detected in groundwater above a published MCL. Table 6
presents a summary of validated inorganic analyte concentrations reported in groundwater samples
collected during the Second Quarter 2016 groundwater monitoring event.
During the Second Quarter 2016, perchlorate was reported below the MCL of 6 µg/L in
groundwater samples collected from 21 of the 49 monitoring wells sampled; it was reported above
the MCL in groundwater samples collected from 20 of the 49 monitoring wells sampled. The
highest perchlorate concentrations during the Second Quarter 2016 were found at monitoring well
TT-MW2-38A (77,100 µg/L) and TT-MW2-39 (97,900 µg/L), located in Test Bay 3 in Area K;
and in monitoring well TT-MW2-24 (84,300 µg/L), located in the former WDA. Time-series
graphs of perchlorate are provided in Appendix E.

Tetra Tech Laborde Canyon Semiannual Groundwater Monitoring Report Page 3-7Second Quarter 2016 and Third Quarter 2016
3.5.3 Chemicals of Potential Concern
Given the analysis above and the concentrations detected during previous groundwater monitoring
events, perchlorate, TCE, and 1,4-dioxane are identified as primary chemicals of potential
concern, and benzene, 1,2-DCA, 1,1-DCE, cis-1,2-DCE, and RDX are identified as secondary
chemicals of potential concern at the site. The remaining two organic analytes (1,1-dichloroethane
and chloromethane) were detected below their respective MCLs. The distribution and
concentrations in groundwater for all chemicals of potential concern will continue to be monitored
and the results evaluated. Figures 9, 10, and 11 present isoconcentration maps for 1,4-dioxane,
TCE, and perchlorate for groundwater samples collected during the Second Quarter 2016
monitoring event.
3.6 SURFACE WATER SAMPLING RESULTS
Surface water sampling locations were dry during the Second Quarter 2016 sampling event so
samples were not collected. No other surface water or storm water samples were scheduled to be
collected during this reporting period.
3.7 TEMPORAL TRENDS IN GROUNDWATER CHEMICALCONCENTRATIONS
All groundwater and surface water monitoring locations sampled and tested between Fourth
Quarter 2015 and Third Quarter 2016 were included in the trend analyses. Samples were collected
from 49 monitoring wells. Temporal trend analyses were performed for perchlorate, TCE, 1,4-
dioxane, and RDX. The temporal trend analyses used data from the entire period of record
(September 2004 through September 2016) to evaluate long-term trends at the site, and to assess
the variability observed in the data, since sampling results at many locations fluctuate considerably
from quarter to quarter.
Time trend analysis was conducted using the Monitoring and Remediation Optimization System
(MAROS) developed by the Air Force Center for Environmental Excellence (AFCEE, 2006).
MAROS is a statistical database application developed to assist with groundwater quality data
trend analysis and long-term monitoring optimization at contaminated groundwater sites. The
software performs parametric and nonparametric trend analyses to evaluate temporal and spatial
contaminant trends using Mann-Kendall and linear regression methods. Brief descriptions of the
methods follow.
Tetra Tech Laborde Canyon Semiannual Groundwater Monitoring Report Page 3-8Second Quarter 2016 and Third Quarter 2016
• Mann-Kendall Analysis – This statistical procedure was used to evaluate the data fortrends. It is a nonparametric statistical procedure that is well suited for analyzing trends indata over time that do not require assumptions as to the statistical distribution of the dataand can be used with irregular sampling intervals and missing data. The Mann-Kendall testfor trends is suitable for analyzing data that follow a normal or non-normal distributionpattern. The advantage with this approach involves cases where outliers in the data wouldproduce biased estimates of the least squares estimated slope.
• Linear Regression Analysis – This statistical procedure was used to estimate the magnitudeof the trends. A parametric statistical procedure is typically used for analyzing trends indata over time and requires a normal statistical distribution of the data.
The following seven statistical concentration trend types are derived from Mann-Kendall analysis:
(1) decreasing, (2) increasing, (3) no trend (displaying two sets of conditions), (4) probably
decreasing, (5) probably increasing, (6) stable, and (7) non-detect (with all sample results below
the detection limit). If a location has fewer than four quarters of data, then the Mann-Kendall
analysis cannot be run, and not applicable (NA) is applied to the results. The criteria used to
evaluate the statistical concentration trend types are summarized in Table 9.
The Mann-Kendall statistic (S) measures the trend in the data. Positive values indicate an increase
in constituent concentrations over time, whereas negative values indicate a decrease in constituent
concentrations over time. The strength of the trend is proportional to the magnitude of the Mann-
Kendall statistic (i.e., large magnitudes indicate a strong trend).
The coefficient of variation (COV) is a statistical measure of how the individual data points vary
about the mean value. Values less than or near 1.00 indicate that the data form a relatively close
group about the mean value. Values larger than 1.00 indicate that the data show a greater degree of
scatter about the mean.
The confidence in trend is the statistical confidence that the constituent concentration is increasing
(S>0) or decreasing (S<0).
Temporal trends were analyzed for up to four analytes in 49 monitoring wells and one storm water
sampling location. Any single location may have different trends for each of the four analytes
evaluated. The results of the Mann-Kendall trend analysis are provided in Appendix J; summaries
of the Mann-Kendall results are presented in Table 10 (groundwater) and Table 11 (surface water).

Tetra Tech Laborde Canyon Semiannual Groundwater Monitoring Report Page 3-9Second Quarter 2016 and Third Quarter 2016
Twenty-two probably increasing or increasing trends were found at 16 groundwater monitoring
locations. Listed below are the areas of the site where they are located, the location identifications,
the chemical of potential concern that has the increasing or probably increasing trend, the Second
Quarter 2016 analytical results, and the magnitude of the trend in percent per year (%/yr).
Eight wells located in Area K:
• TT-MW2-1: perchlorate (6,850 µg/L, 4.93 %/yr)
• TT-MW2-17S: TCE (0.590 µg/L, 8.94 %/yr)
• TT-MW2-17D: TCE (6.92 µg/L, 13.1 %/yr)
• TT-MW2-29B: perchlorate (1.02 µg/L, 13.0 %/yr)
• TT-MW2-30B: perchlorate (5000 µg/L, 18.3 %/yr)
• TT-MW2-33A: perchlorate (1.33 µg/L, 14.8 %/yr)
• TT-MW2-34A: perchlorate (5.41 µg/L, 27 %/yr)
• TT-MW2-40A: perchlorate (1.24 µg/L, 29 %/yr)
One well located in Area L:
• TT-MW2-4S: perchlorate (0.54 µg/L, 4.93 %/yr)
Four wells located in the former WDA:
• TT-MW2-21: perchlorate (2.52 µg/L, 22 %/yr) and TCE (4.76 µg/L, 15.0 %/yr)
• TT-MW2-22: TCE (424 µg/L, 7.30 %/yr) and 1,4-dioxane (78.6 µg/L, 8.21 %/yr)
• TT-MW2-37A: perchlorate (9,380 µg/L, 27 %/yr), TCE (5.85 µg/L, 20 %/yr), and1,4-dioxane (22.4 µg/L, 9.86 %/yr)
• TT-MW2-37B: perchlorate (0.92 µg/L, 18.3 %/yr)
Three wells located just downgradient and cross gradient, respectively, of the former WDA:
• TT-MW2-9S: perchlorate (7,710 µg/L, 26 %/yr), TCE (0.870 µg/L, 15.7 %/yr), and1,4-dioxane (19.5 µg/L, 8.76 %/yr)
• TT-MW2-27: perchlorate (174 µg/L, 13.3 %/yr)

Tetra Tech Laborde Canyon Semiannual Groundwater Monitoring Report Page 3-10Second Quarter 2016 and Third Quarter 2016
• TT-MW2-42A: perchlorate (0.255 µg/L, 9.86 %/yr)
One storm water location, SW-07, was evaluated for perchlorate trends. The location was found to
have no trend. No other surface water trends or locations were evaluated.
Table 12 summarizes the magnitude of the trend changes in micrograms per liter per year
(µg/L/yr) and the percent change with respect to the mean experienced at the site through the end
of this reporting period (Third Quarter 2016). The trends and trend magnitudes were generated
using the MAROS software. Figures 12 through 15 present a spatial representation of the results
of the trend analysis for monitoring well locations. Tables 13 through 15 summarize historical
trend analysis results by chemical, and Table 16 provides a summary of increasing trends
identified during the Second Quarter 2016 trend analysis by well.
3.8 GROUNDWATER MONITORING PROGRAM AND THEGROUNDWATER QUALITY MONITORING NETWORK
Quarterly groundwater monitoring has been conducted continuously at the site since the
September 2004 well installation activities. Groundwater samples have been routinely analyzed
for VOCs, perchlorate, 1,4-dioxane, and RDX. Selected testing for California Assessment Manual
17 Metals, general minerals, N-nitrosodimethylamine, 1,2,3-trichloropropane, and hexavalent
chromium has also previously been performed. In accordance with the site Groundwater Sampling
and Analysis Plan (Tetra Tech, 2007a), the analytical scheme, the classifications of the wells in
the network, and the corresponding sampling frequency are evaluated annually during the second
quarter of each year. Changes may then be proposed to accommodate expanded site knowledge or
changing site conditions.
3.8.1 Groundwater Sampling Frequency
The primary criterion used in determining the frequency of sampling a monitoring well is the well
classification (i.e., function of each well) (Tetra Tech, 2007a). Classification of groundwater
monitoring wells is based on the evaluation of the temporal trends, spatial distribution analyses,
and other qualitative criteria. During the current reporting period, horizontal extent wells, vertical
distribution wells, increasing contaminant trend wells, and guard wells were sampled. Table 17
presents a summary of the current frequency of groundwater sampling by well classification.

Tetra Tech Laborde Canyon Semiannual Groundwater Monitoring Report Page 3-11Second Quarter 2016 and Third Quarter 2016
3.8.2 Increasing Trend Wells
The sampling frequency for wells with an increasing trend may be increased if the magnitude of
the trend and the location of the well warrant an increased frequency. Regardless of the outcome
of the trend analysis, guard wells will continue to be sampled semiannually. For the Second
Quarter 2016 trend analysis, 11 of the 16 locations with increasing or probably increasing trends
for perchlorate, 1,4-dioxane, or TCE had trend magnitudes of less than 20% per year. The seven
locations with these low magnitude trends are considered to be less critical than the seven
locations with magnitudes greater than 20% per year. The latter group of seven locations are
considered to involve increasing trend wells for well classification purposes.
Taking into account the results of the temporal trend analysis and the magnitude of their trends,
Tetra Tech proposes to continue semiannual sampling for the following five increasing trend
wells:
• Area K wells TT-MW2-34A, and TT-MW2-40A
• Waste discharge area wells TT-MW2-21 and TT-MW2-37A,
• Lower Canyon Area well TT-MW2-9S
We propose that the following monitoring wells remain at their presently approved sampling
frequency, due to the limited magnitude of their trends:
• Area K wells TT-MW2-1, TT-MW2-17S, TT-MW2-17D, TT-MW2-29B, and TT-MW2-33A
• Area L well TT-MW2-4S
• Waste discharge area well TT-MW2-22
• Lower Canyon Area wells TT-MW2-27 and TT-MW1-42A
We propose that the sampling frequency of the following monitoring wells be changed from
semiannual to annual, based on the limited magnitude of their trends:
• Area K well TT-MW2-30B (vertical extent)
• Waste discharge area well TT-MW2-37B (vertical extent)
Tetra Tech Laborde Canyon Semiannual Groundwater Monitoring Report Page 3-12Second Quarter 2016 and Third Quarter 2016
In addition, we propose to add 1,4-dioxane to the sampling program for monitoring well TT-
MW2-6D.
Table 18 summarizes the proposed monitoring well sampling schedule and frequency for the 2017
calendar year.
3.9 HABITAT CONSERVATION
Consistent with the United States Fish and Wildlife Service (USFWS) approved Habitat
Conservation Plan (HCP) (USFWS, 2005) and subsequent clarifications (Lockheed Martin
Corporation, 2006a and 2006b) to the HCP describing activities for environmental remediation at
the site, field activities were performed under the supervision of a USFWS-approved biologist. No
impact to the Stephens’ kangaroo rat occurred during the performance of field activities related to
the Second Quarter 2016 and Third Quarter 2016 monitoring events.

Tetra Tech Laborde Canyon Semiannual Groundwater Monitoring Report Page 4-1Second Quarter 2016 and Third Quarter 2016
Section 4
Summary and Conclusions
This section summarizes the results of the Second Quarter 2016 and Third Quarter 2016
groundwater monitoring events.
4.1 GROUNDWATER ELEVATION AND GRADIENT
Taking into account the measured groundwater elevations, the current conceptual site model, and
the southward sloping topography at the site, groundwater flow is to the south, generally following
the topography of Laborde Canyon. During Second Quarter 2016, groundwater elevation increases
were seen in all areas. During Third Quarter 2016, groundwater elevation decreases were seen in
Area L (former burn area), the lower canyon area, Area M (former garbage disposal area), and the
Western Riverside County Regional Conservation Authority property. Groundwater elevation
increases were seen in all other areas of the site. The overall groundwater elevation at the site has
decreased since Fourth Quarter 2005, with the greatest decrease over time seen in monitoring well
TT-MW2-1 (9.49 feet). Limited seasonal fluctuations can be seen to varying degrees following
periods of precipitation. The overall long-term decreasing trend in groundwater elevation appears
to generally correspond to long-term precipitation patterns.
The horizontal hydraulic gradients calculated between TT-MW2-16 and TT-MW2-6S from the
Second Quarter 2016 and Third Quarter 2016 groundwater monitoring events for the weathered
San Timoteo formation-screened wells averaged 0.030 feet per foot (ft/ft). The horizontal
groundwater gradients calculated between TT-MW2-2 and TT-MW2-6D for the Second Quarter
2016 and Third Quarter 2016 groundwater monitoring events for the deeper San Timoteo
formation-screened wells averaged 0.029 ft/ft. Vertical gradients are generally downward on-site
and upward from the site boundary south. The vertical gradients range from -0.32 ft/ft to +0.17
ft/ft. A summary of calculated horizontal and vertical groundwater gradients is presented in
Table 5 and in Appendix F.

Tetra Tech Laborde Canyon Semiannual Groundwater Monitoring Report Page 4-2Second Quarter 2016 and Third Quarter 2016
4.2 SURFACE WATER FLOW RESULTS
Surface water was not present in the stream beds during the Second Quarter 2016 and Third
Quarter 2016 monitoring events.
4.3 SURFACE WATER AND STORM WATER SAMPLING RESULTS
During the Second Quarter 2016 sampling event, all surface water locations were dry so no
samples were collected. No other surface water or storm water samples were collected during this
reporting period.
4.4 GROUNDWATER SAMPLING RESULTS
4.4.1 Groundwater Sampling Results
Area J – Final Assembly
Area J wells were not scheduled to be sampled during Second Quarter 2016. Site chemicals of
potential concern have not been detected previously above their respective maximum contaminant
level or drinking water notification level in Area J.
Area K – Test Bays and Miscellaneous Facilities
Results for Area K during the Second Quarter 2016 include the following:
• Perchlorate concentrations ranged from below the method detection limit to 97,900micrograms per liter (µg/L) in TT-MW2-39. The maximum contaminant level forperchlorate is 6 µg/L. Area K has been identified as a source of perchlorate ingroundwater.
• Trichloroethene was detected above the maximum contaminant level of 5 µg/L in well TT-MW2-17D (6.92 µg/L). Trichloroethene was not detected in other wells in Area K. Thesource of the trichloroethene is unknown.
• Hexadydro-1,3,5-trinitro-1,3,5-triazine was detected at a concentration of 0.38 µg/L in wellTT-MW2-13. The drinking water notification level for hexadydro-1,3,5-trinitro-1,3,5-triazine is 0.3 µg/L. Previously, hexadydro-1,3,5-trinitro-1,3,5-triazine was also detected inmonitoring well TT-MW2-1, but has not been detected in this well since October 2007.The source of the hexadydro-1,3,5-trinitro-1,3,5-triazine has been investigated but remainsunknown (Tetra Tech, 2010a).
Area L – Propellant Burn Area
Results for Area L for the Second Quarter 2016 include the following:

Tetra Tech Laborde Canyon Semiannual Groundwater Monitoring Report Page 4-3Second Quarter 2016 and Third Quarter 2016
• Perchlorate was detected in monitoring wells TT-MW2-4S, TT-MW2-10, TT-MW2-12,and TT-MW-35A at concentrations of 0.538 µg/L, 0.236 µg/L, 0.132 µg/L, and 0.193µg/L, respectively. There is no indication that a perchlorate source is present in Area L; theperchlorate detected in the northernmost portion of Area L appears to have originatedupgradient in Area K.
Area M - Garbage Disposal Area
Results for Area M for the Second Quarter 2016 include the following:
• Perchlorate was detected above the MCL in monitoring well TT-MW2-11 at aconcentration of 179 µg/L. Perchlorate was also detected below the MCL in monitoringwell TT-MW2-28 at a concentration of 0.108 µg/L. Area M has been identified as a sourceof perchlorate in groundwater.
• Trichloroethene was detected in one well (TT-MW2-11) at a concentration of 2.85 µg/L.Trichloroethene has not been detected in other wells in Area M.
Waste Discharge Area
Results for the former waste discharge area during the Second Quarter 2016 include the following:
• Perchlorate concentrations ranged from below the method detection limit to 84,300 µg/L inwell TT-MW2-24. The former waste discharge area has been identified as a source ofperchlorate in groundwater.
• Trichloroethene concentrations ranged from below the method detection limit to 424 µg/Lin well TT-MW2-22. The former waste discharge area has been identified as a source oftrichloroethene in groundwater. However, trichloroethene has not been detected above themaximum contaminant level of 5 µg/L in downgradient monitoring wells.
• 1,4-Dioxane concentrations ranged from below the method detection limit to 105 µg/L inwell TT-MW2-24. The drinking water notification level for 1,4-dioxane is 1 µg/L. Thisarea has been identified as a source of 1,4-dioxane in groundwater, and this constituent hasbeen detected in monitoring wells downgradient of the former waste discharge area.
• Hexadydro-1,3,5-trinitro-1,3,5-triazine was detected at a concentration of 0.20 µg/L in TT-MW2-24. Hexadydro-1,3,5-trinitro-1,3,5-triazine has not been detected in other wellslocated in, or downgradient of, the former waste discharge area.
Lower Canyon and Riparian Corridor
Results for the lower portion of Laborde Canyon, from the area immediately downgradient of the
former waste discharge area to the riparian area immediately south of the property boundary,
include the following:
• Perchlorate was detected in groundwater during the Second Quarter 2016 at concentrationsranging from 7,710 µg/L in monitoring well TT-MW2-9S in the northern portion of the

Tetra Tech Laborde Canyon Semiannual Groundwater Monitoring Report Page 4-4Second Quarter 2016 and Third Quarter 2016
lower Laborde Canyon to below the method detection limit in the riparian corridor. Nosource of perchlorate has been identified in the lower canyon or at the southern siteboundary. The perchlorate appears to have originated in the former waste discharge area.
• Trichloroethene was detected in groundwater during the Second Quarter 2016 inmonitoring well TT-MW2-9S, located in the northern portion of the lower LabordeCanyon, at a concentration of 0.870 µg/L, which is below the maximum contaminant levelof 5 µg/L. Trichloroethene has not been detected in other wells located in the lower canyonor riparian corridor area. The source of the trichloroethene appears to be the former wastedischarge area.
• 1,4-Dioxane was detected in groundwater during the Second Quarter 2016 monitoringevent at concentrations ranging from 19.50 µg/L in monitoring well TT-MW2-9S in thenorthern portion of the lower Laborde Canyon to below the method detection limit in theriparian corridor. No source of 1,4-dioxane has been identified in the lower canyon or atthe southern site boundary. The 1,4-dioxane appears to have originated in the former wastedischarge area.
Western Riverside County Regional Conservation Authority Property
• Perchlorate was detected below the maximum contaminant level of 6 µg/L in monitoringwell TT-MW2-19S at a concentration of 2.37 µg/L. Perchlorate was not detected inmonitoring well TT-MW2-20S.
Summary
Given the data available at this time, the trichloroethene and hexadydro-1,3,5-trinitro-1,3,5-
triazine plumes in groundwater appear to be small and isolated. These plumes do not extend off-
site. The 1,4-dioxane plume is limited to the former waste discharge area and lower Laborde
Canyon, and does not appear to extend off-site. The perchlorate plume does appear to extend off-
site, but terminates in the riparian corridor south of the southern site boundary. The perchlorate
detected in monitoring well TT-MW2-19S, located on the Regional Conservation Authority
property to the south of the site, suggests an isolated impacted well.
Table 18 summarizes the proposed monitoring well sampling schedule and frequency for the 2017
calendar year. The proposed changes include decreasing the sampling frequency for wells TT-
MW2-30B and TT-MW2-37B based on the limited magnitude of their observed trends.

Tetra Tech Laborde Canyon Semiannual Groundwater Monitoring Report Page 5-1Second Quarter 2016 and Third Quarter 2016
Section 5
References
1. Air Force Center for Environmental Excellence (AFCEE), 2006. Monitoring andRemediation Optimization System (MAROS) Software Version 2.2 User’s Guide, March.
2. California Department of Health Services, 1989. Lockheed Beaumont Consent Order, June16.
3. Hillwig–Goodrow, LLC, 2004. Lockheed Site 2 Boundary Survey, Lockheed MartinCorporation, Beaumont Site 2, Beaumont, California, May.
4. Lockheed Martin Corporation, 2006a. Clarification of Effects on Stephens’ Kangaroo Ratfrom Characterization Activities at Beaumont Site 1 (Potrero Creek) and Site 2 (LabordeCanyon), August 3.
5. Lockheed Martin Corporation, 2006b. Clarification of Mapping Activities Proposed underthe Low-Effect Habitat Conservation Plan for the Federally-Endangered Stephens’Kangaroo Rat at Beaumont Site 1 (Potrero Creek) and Site 2 (Laborde Canyon) RiversideCounty, California (mapping methodology included), December 8.
6. Radian Corporation, 1986. Lockheed Propulsion Company Beaumont Test FacilitiesHistorical Report, September.
7. Radian Corporation, 1993. Disposal Area Removal Action, Lockheed PropulsionCompany, Beaumont No. 2 Site, June.
8. Tetra Tech, 2005. Lockheed Martin Corporation, Soil Investigation Report, Beaumont Site2, Historical Operational Areas J, K, L, and M, Beaumont, California, July
9. Tetra Tech, 2007a. Groundwater Sampling and Analysis Plan, Lockheed MartinCorporation, Beaumont Site 2, Beaumont, California, May.
10. Tetra Tech, 2007b. Site Investigation Report for Soil Investigations at the Earthen PrismShaped Structure and Possible Liquid Waste Discharge Ponds at Lockheed MartinBeaumont Site 2, October.
11. Tetra Tech, 2008. Supplemental Site Characterization Report, Former Waste DischargePonds and Southern Property Boundary, Beaumont Site 2, Beaumont, California, July.
12. Tetra Tech, 2009a. Structural Analysis Laborde Canyon (Lineament Study), Appendix L,Semiannual Groundwater Monitoring Report Second Quarter and Third Quarter 2009,Beaumont Site 2, Beaumont, California, July.
13. Tetra Tech, 2009b. Historical Research Summary Report, Potential Munitions andExplosives of Concern (MEC) Issues, Lockheed Martin Corporation, Beaumont Site 2 andthe Gateway Property, Beaumont, California, January.

Tetra Tech Laborde Canyon Semiannual Groundwater Monitoring Report Page 5-2Second Quarter 2016 and Third Quarter 2016
14. Tetra Tech, 2010a. Dynamic Site Investigation and Summary Remedial InvestigationReport, Beaumont Site 2, Beaumont, California, April.
15. Tetra Tech, 2015. Semiannual Groundwater Monitoring Report Second Quarter 2015 andThird Quarter 2015, Laborde Canyon (Lockheed Martin Beaumont Site 2), Beaumont,California, December.
16. Tetra Tech, 2016. Revised Programmatic Sampling and Analysis Plan, Lockheed MartinCorporation, Beaumont Sites 1 and 2, Beaumont, California. February 2016.
17. United States Fish and Wildlife Service (USFWS), 2005. Endangered Species ActIncidental Take Permit for Potrero Creek and Laborde Canyon Properties HabitatConservation Plan, October 14.
18. United States Environmental Protection Agency (USEPA), 2014a. National FunctionalGuidelines for Superfund Organic Methods Data Review, Office of SuperfundRemediation and Technology Innovation, OSWER 9355.0-132, EPA-540-R-014-002,August 2014.
19. United States Environmental Protection Agency (USEPA), 2014b. National FunctionalGuidelines for Inorganic Superfund Data Review, Office of Superfund Remediation andTechnology Innovation, OSWER 9355.0-131, EPA-540-R-013-001, August 2014.

Tetra Tech Laborde Canyon Semiannual Groundwater Monitoring Report Page 5-3Second Quarter 2016 and Third Quarter 2016
FIGURES

San Jacinto
Moreno Valley
BeaumontBanning
Yucaipa
Calimesa
Redlands
Laborde Canyon(Lockheed MartinBeaumont Site 2)
Redlands
Laborde Canyon(Lockheed Martin Beaumont Site 2)
Figure 1Regional Location of
Laborde Canyon
0 2Miles
Adapted from:U.S. Census Bureau TIGER line data, 2000.
LEGEND
Interstate/Freeway
State Highway
County Boundary
Laborde Canyon Site Boundary(Lockheed Martin Beaumont Site 2)
City/Municipality
P:\GIS\Lockheed_S2_Q2Q316\Region.mxd
Historical Operational Area JFinal Assembly
Historical Operational Area KTest Bays & Misc. Facilities
1962 RWQCB PermittedWaste Discharge Area
Historical Operational Area LPropellant Burn Area
Historical OperationalArea MGarbage Disposal Area
TT-EW2-3TT-PZ2-4
TT-PZ2-3
TT-PZ2-2TT-EW2-1
TT-MW2-1
TT-MW2-2
TT-MW2-5
TT-MW2-8
TT-MW2-7
TT-MW2-43
TT-MW2-25
TT-MW2-27TT-MW2-9S
TT-MW2-42ATT-MW2-41B
TT-MW2-42B
TT-MW2-41A
TT-MW2-6S/D
TT-EW2-2TT-MW2-3
TT-PZ2-1
TT-MW2-44
TT-MW2-39
TT-MW2-32
TT-MW2-28
TT-MW2-26
TT-MW2-21
TT-MW2-23TT-MW2-22
TT-MW2-24
TT-MW2-7D
TT-MW2-13
TT-MW2-9D
TT-MW2-10
TT-MW2-11
TT-MW2-18
TT-MW2-12
TT-MW2-14
TT-MW2-16
TT-MW2-4S/D
TT-MW2-31A/B
TT-MW2-35A/B
TT-MW2-37A/B
TT-MW2-17S/D
TT-MW2-29A/B/C
TT-MW2-36A/B/CTT-MW2-40A/B/C
TT-MW2-38A/B/C TT-MW2-30A/B/CTT-MW2-34A/B/C
TT-MW2-33A/B/C
W 2-1
W 2-3
W 2-2W 2-5
MW 2-2
MW 2-4
MW 2-5
Laborde Canyon
Figure 2Historical Operational Areas
and Site Features
0 1,000 2,000Feet
Adapted from:July 2014 aerial photograph.
Note: Laborde Canyon site boundary(Lockheed Martin Beaumont Site 2)from Hillwig-Goodrow survey, May 2004.
LEGENDGroundwater MonitoringWell LocationDestroyed ProductionWell LocationDestroyed MonitoringWell LocationReported ProductionWell Location
Waste Discharge AreaRWQCB PermittedWaste Discharge AreaHistorical OperationalArea BoundaryLaborde Canyon Site Boundary(Lockheed Martin Beaumont Site 2)
(Lockheed Martin Beaumont Site 2)
P:\GIS\Lockheed_S2_Q2Q316\Op_Areas.mxd

Parking Area
Water Tanks andPump House
Parking Area
Small Bunker
Building 250Rocket Assembly
Building
Prism
4 Test Bays
T-Revetment Conditioning Chambers
Waste Discharge Area
Transformer Pad
Concrete Mount
Centrifuge
Conditioning Chambers
Instrument Building
Reported PropellantBurn Site Disposal Site
Large Bunker
See inset map forsouthern sampling locations
SF-02
Historical OperationalArea JFinal Assembly
Historical Operational Area KTest Bays & Misc. Facilities
Historical Operational Area MGarbage Disposal Area
Historical Operational Area LPropellant Burn Area
1962 RWQCB PermittedWaste Discharge Area
SW-04
SW-06
SW-05
SW-03
SW-02
SW-01
Laborde Canyon
Surface and Storm-WaterSampling Locations
0 500 1,000Feet
Adapted from: July 2014 aerial photographNote:
Figure 3
Laborde Canyon property boundary(Lockheed Martin Beaumont Site 2)from Hillwig-Goodrow survey, May 2004.
LEGENDStorm-Water Sampling Location
Spring Sampling LocationStream Flow Sampling Point
RWQCB Permitted Waste Discharge AreaHistorical Operational Area BoundaryLaborde Canyon Property Boundary(Lockheed Martin Beaumont Site 2)
SF-01SW-07
SF-02
WS-2WS-1
WS-3
SW-06
(Lockheed Martin Beaumont Site 2)
P:\GIS\Lockheed_S2_Q2Q316\Surf_Storm_Water.mxd
0 1,000 2,000Feet

!h
!h
!h
!h
!h
!h!h
!h!h
!h!h
!h
!h!h!h
!h
!h
!h
!h!h!h
!h!h
!h
!h
!h!h!h!h !h
!h!h
!h
!h
!h
!h
!h!h!h!h!h
!h!h
!h
!h!h!h
!h
EEE
!h
!h
!h
Historical OperationalArea JFinal Assembly
Waste Discharge Area
Labo
r deCa
nyonTest Bay
Canyon
Historical Operational Area KTest Bays & Misc. Facilities
Historical OperationalArea MGarbage Disposal Area
Historical Operational Area LPropellant Burn Area
1962 RWQCB PermittedWaste Discharge Area
GILMANSPRINGS RD.
BEAUMONT AVE.
A¹
San Jacinto River
WS-3Dry
WS-2Dry
WS-1Dry
TT-MW2-1
TT-MW2-5
TT-MW2-8TT-MW2-7
TT-MW2-44
TT-MW2-39
TT-MW2-26
TT-MW2-25
TT-MW2-21
TT-MW2-7D
TT-MW2-6STT-MW2-6D
TT-MW2-13
TT-MW2-18
TT-MW2-42ATT-MW2-41A
TT-MW2-40B
TT-MW2-20S
TT-MW2-19DTT-MW2-19S
TT-MW2-32TT-MW2-28
TT-MW2-27
TT-MW2-22
TT-MW2-24
TT-MW2-4S
TT-MW2-9STT-MW2-9D
TT-MW2-10TT-MW2-11
TT-MW2-12
TT-MW2-14
TT-MW2-16TT-MW2-29CTT-MW2-29B
TT-MW2-29ADry
TT-MW2-36ATT-MW2-40A
TT-MW2-38BTT-MW2-38A
TT-MW2-30CTT-MW2-30BTT-MW2-30A
TT-MW2-34A
TT-MW2-33A
TT-MW2-31A
TT-MW2-35A
TT-MW2-37BTT-MW2-37A
TT-MW2-17DTT-MW2-17S
Laborde Canyon
Figure 4Second Quarter 2016Sampling Locations
0 1,000 2,000Feet
IAdapted from:July 2014 aerial photograph.
Note:Beaumont Site 2 property boundary fromHillwig-Goodrow survey, May 2004.
LEGEND!h WellE Spring
1962 RWQCB Permitted Waste Discharge AreaHistorical Operational Area BoundaryLaborde Canyon Site Boundary(Lockheed Martin Beaumont Site 2)
(Lockheed Martin Beaumont Site 2)
P:\GIS\Lockheed_S2_Q2Q316\Samp_Locs Q216.mxd
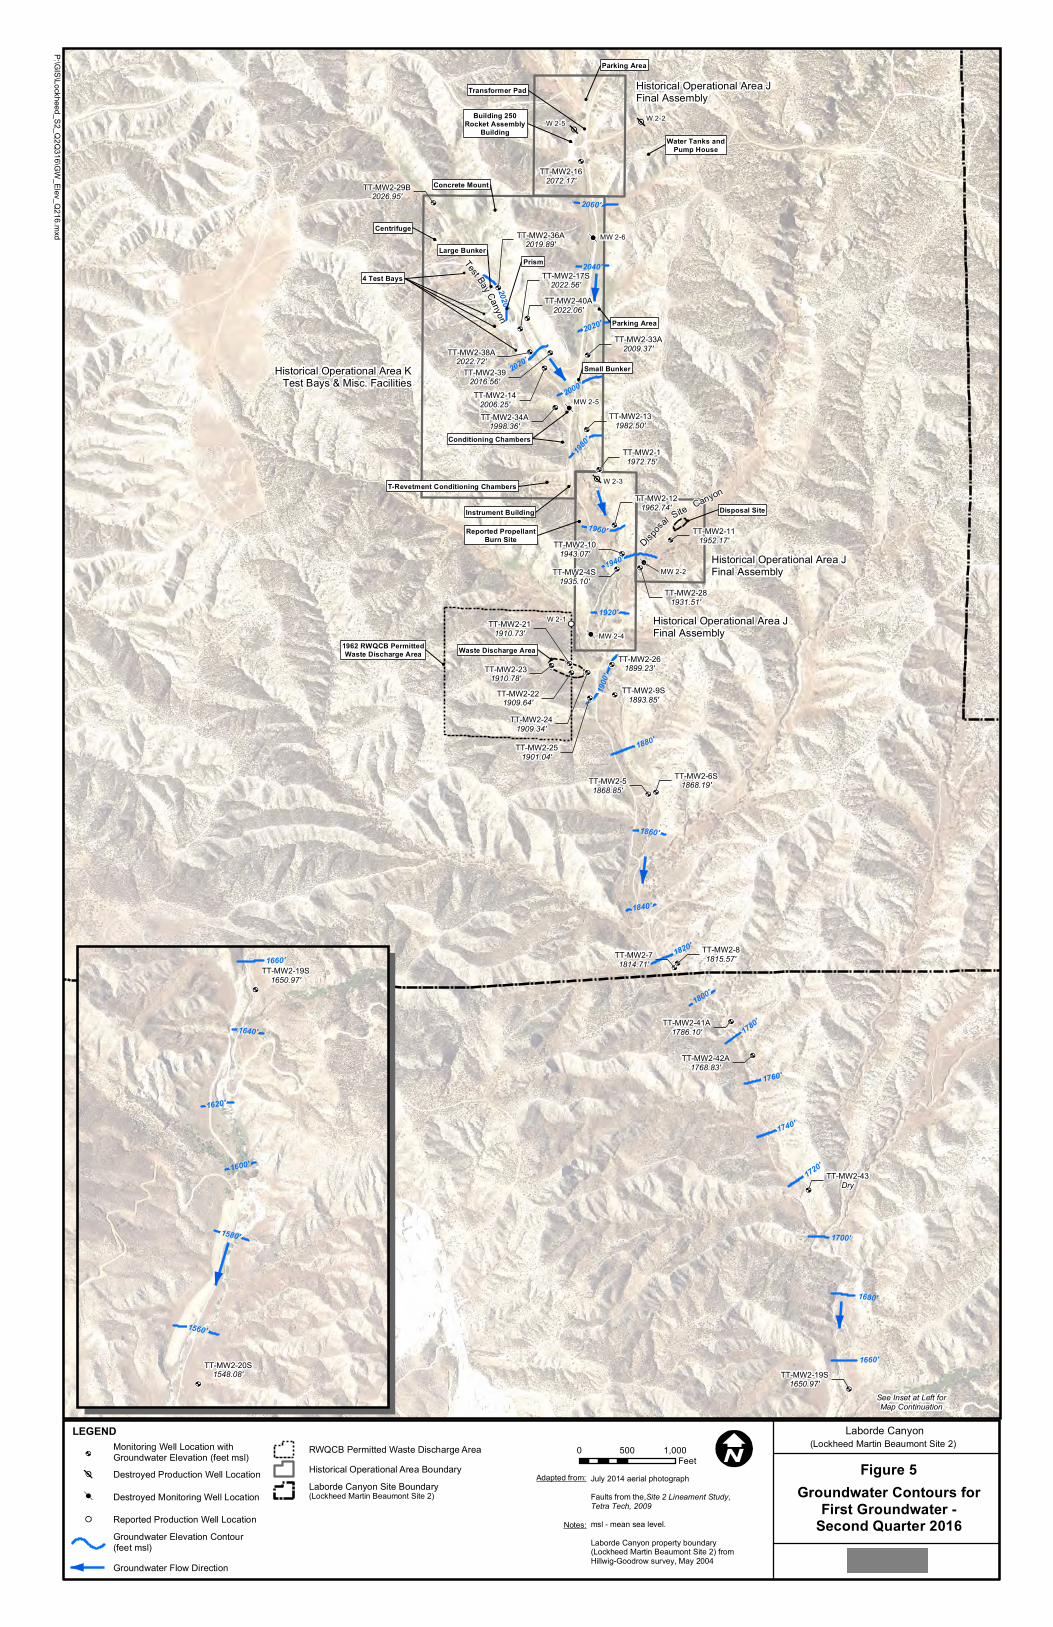
2000'
1960'
2060'
1900
'
1980'
1920'
1860'
1840'
1800'
1660'
1880'
1680'
1740'
1700'
1720'
1760'
1940'2020'
2020'
2020'
2040'
1820'
1780'
1640'
Test Bay CanyonDispos
al Site Canyon
See Inset at Left forMap Continuation
Parking Area
Water Tanks andPump House
Parking Area
Small Bunker
Building 250Rocket Assembly
Building
Prism4 Test Bays
T-Revetment Conditioning Chambers
Waste Discharge Area
Transformer Pad
Concrete Mount
Centrifuge
Conditioning Chambers
Instrument Building
Reported PropellantBurn Site
Disposal Site
Large Bunker
Historical Operational Area JFinal Assembly
Historical Operational Area JFinal Assembly
Historical Operational Area JFinal Assembly
Historical Operational Area KTest Bays & Misc. Facilities
1962 RWQCB PermittedWaste Discharge Area
W 2-1
W 2-3
W 2-2W 2-5
MW 2-2
MW 2-4
MW 2-5
MW 2-6
TT-MW2-43Dry
TT-MW2-11972.75'
TT-MW2-51868.85'
TT-MW2-81815.57'TT-MW2-7
1814.71'
TT-MW2-392016.56'
TT-MW2-261899.23'
TT-MW2-251901.04'
TT-MW2-211910.73'
TT-MW2-4S1935.10'
TT-MW2-6S1868.19'
TT-MW2-9S1893.85'
TT-MW2-142006.25'
TT-MW2-162072.17'
TT-MW2-42A1768.83'
TT-MW2-41A1786.10'
TT-MW2-40A2022.06'
TT-MW2-19S1650.97'
TT-MW2-281931.51'
TT-MW2-231910.78'
TT-MW2-221909.64'
TT-MW2-241909.34'
TT-MW2-131982.50'
TT-MW2-101943.07'
TT-MW2-111952.17'
TT-MW2-121962.74'
TT-MW2-29B2026.95'
TT-MW2-36A2019.89'
TT-MW2-38A2022.72'
TT-MW2-34A1998.36'
TT-MW2-33A2009.37'
TT-MW2-17S2022.56'
Laborde Canyon
Groundwater Contours forFirst Groundwater -
Second Quarter 2016
0 500 1,000Feet
Adapted from: July 2014 aerial photographFaults from the,Site 2 Lineament Study, Tetra Tech, 2009
Notes: msl - mean sea level.Laborde Canyon property boundary(Lockheed Martin Beaumont Site 2) fromHillwig-Goodrow survey, May 2004
Figure 5
1660'
1640'
1620'
1600'
1580'
1560'
TT-MW2-20S1548.08'
TT-MW2-19S1650.97'
Groundwater Flow Direction
(Lockheed Martin Beaumont Site 2)
P:\GIS\Lockheed_S2_Q2Q316\GW_Elev_Q216.mxd
LEGENDMonitoring Well Location withGroundwater Elevation (feet msl)Destroyed Production Well Location
Destroyed Monitoring Well Location
Reported Production Well LocationGroundwater Elevation Contour(feet msl)
RWQCB Permitted Waste Discharge AreaHistorical Operational Area BoundaryLaborde Canyon Site Boundary(Lockheed Martin Beaumont Site 2)

1920'19
00'
1820'
1840'
1980'
2060'
1880'
1860'
2040'
1720'
1800'
1680'
1660'
1740'
1780'
1640'
1700'
1760'
2020'
2020'
2020'
1940'
1960'
2000'
Test Bay Canyon
Dispos
al Site Canyon
See Inset at Left forMap Continuation
Parking Area
Water Tanks andPump House
Parking Area
Small Bunker
Building 250Rocket Assembly
Building
Prism4 Test Bays
T-Revetment Conditioning Chambers
Waste Discharge Area
Transformer Pad
Concrete Mount
Centrifuge
Conditioning Chambers
Instrument Building
Reported PropellantBurn Site
Disposal Site
Large Bunker
Historical Operational Area JFinal Assembly
Historical Operational Area JFinal Assembly
Historical Operational Area JFinal Assembly
Historical Operational Area KTest Bays & Misc. Facilities
1962 RWQCB PermittedWaste Discharge Area
W 2-1
W 2-3
W 2-2W 2-5
MW 2-2
MW 2-4
MW 2-5
MW 2-6
TT-MW2-43Dry
TT-MW2-11972.71'
TT-MW2-51868.72'
TT-MW2-81814.52'
TT-MW2-71812.83'
TT-MW2-392016.50'
TT-MW2-261898.39'
TT-MW2-251901.69'
TT-MW2-211910.61'
TT-MW2-4S1934.60'
TT-MW2-6S1867.68'
TT-MW2-9S1894.27'
TT-MW2-121962.40'
TT-MW2-142006.11'
TT-MW2-162071.95'
TT-MW2-42A1767.25'
TT-MW2-41A1784.97'
TT-MW2-40A2021.98'
TT-MW2-38A2022.62'
TT-MW2-19S1651.04'
TT-MW2-281930.40'
TT-MW2-231910.67'
TT-MW2-221909.54'
TT-MW2-241909.23'
TT-MW2-131982.49'
TT-MW2-101942.90'
TT-MW2-111951.15'
TT-MW2-29B2026.98'
TT-MW2-36A2019.83'
TT-MW2-34A1998.30'
TT-MW2-33A2009.30'
TT-MW2-17S2022.50'
Laborde Canyon
Groundwater Contours forFirst Groundwater -Third Quarter 2016
0 500 1,000Feet
Adapted from: July 2014 aerial photographFaults from the,Site 2 Lineament Study, Tetra Tech, 2009
Notes: msl - mean sea level.Laborde Canyon property boundary(Lockheed Martin Beaumont Site 2) fromHillwig-Goodrow survey, May 2004
Figure 6
1560'
1620'
1600'
1580'
1660'
1640'
TT-MW2-20S1549.33'
TT-MW2-19S1651.04'
Groundwater Flow Direction
(Lockheed Martin Beaumont Site 2)
P:\GIS\Lockheed_S2_Q2Q316\GW_Elev_Q316.mxd
LEGENDMonitoring Well Location withGroundwater Elevation (feet msl)Destroyed Production Well Location
Destroyed Monitoring Well Location
Reported Production Well LocationGroundwater Elevation Contour(feet msl)
RWQCB Permitted Waste Discharge AreaHistorical Operational Area BoundaryLaborde Canyon Site Boundary(Lockheed Martin Beaumont Site 2)

Te stBayCanyon
Dispos
al Site Canyon
See Inset at Left forMap Continuation
Parking Area
Water Tanks andPump House
Parking Area
Small Bunker
Building 250Rocket Assembly
Building
Prism4 Test Bays
T-Revetment Conditioning Chambers
Waste Discharge Area
Transformer Pad
Concrete Mount
Centrifuge
Conditioning Chambers
Instrument Building
Reported PropellantBurn Site
Disposal Site
Large Bunker
Historic al Ope rational Are a JFinal Asse m bly
Historic al Ope rational Are a LPrope llant Burn Are a
Historic al Ope rational Are a MGarbage Disposal Are a
Historic al Ope rational Are a KTe st Bays & Misc . Fac ilitie s
1962 RWQCB Pe rm itte dWaste Disc harge Are a
TT-MW2-1
TT-MW2-5
TT-MW2-8TT-MW2-7
TT-MW2-43
TT-MW2-39
TT-MW2-28
TT-MW2-26
TT-MW2-25
TT-MW2-21
TT-MW2-23
TT-MW2-22
TT-MW2-4S
TT-MW2-6S
TT-MW2-9S
TT-MW2-10
TT-MW2-12
TT-MW2-14
TT-MW2-16
TT-MW2-42A
TT-MW2-41A
TT-MW2-40A
TT-MW2-38A
TT-MW2-34A
TT-MW2-19S
TT-MW2-17S
TT-MW2-24
TT-MW2-13
TT-MW2-11
TT-MW2-29B
TT-MW2-36A
TT-MW2-33A
Labord e Canyon
Changes inGroundwater Elevation -
Second Quarter 2016
0 500 1,000Fe e t
Ad apte d from :July 2014 ae rial photograph
N ote s:Labord e Canyon prope rty bound ary(Loc khe e d Martin Be aum ont Site 2) fromHillwig-Good row surve y, May 2004
Figure 7
TT-MW2-20S
TT-MW2-19S
LEGENDMonitoring We ll Loc ationRWQCB Pe rm itte d Waste Disc harge Are aHistoric al Ope rational Are a Bound aryLabord e Canyon Site Bound ary(Loc khe e d Martin Be aum ont Site 2)
(Loc khe e d Martin Be aum ont Site 2)
P:\GIS\Lockheed_S2_Q2Q316\GW_Chg_Q216.mxd
Ground wate r Ele vation Change in Fe e t(from pre vious quarte r)
1.01 — 2.000 — 1.00-0.99 — 0
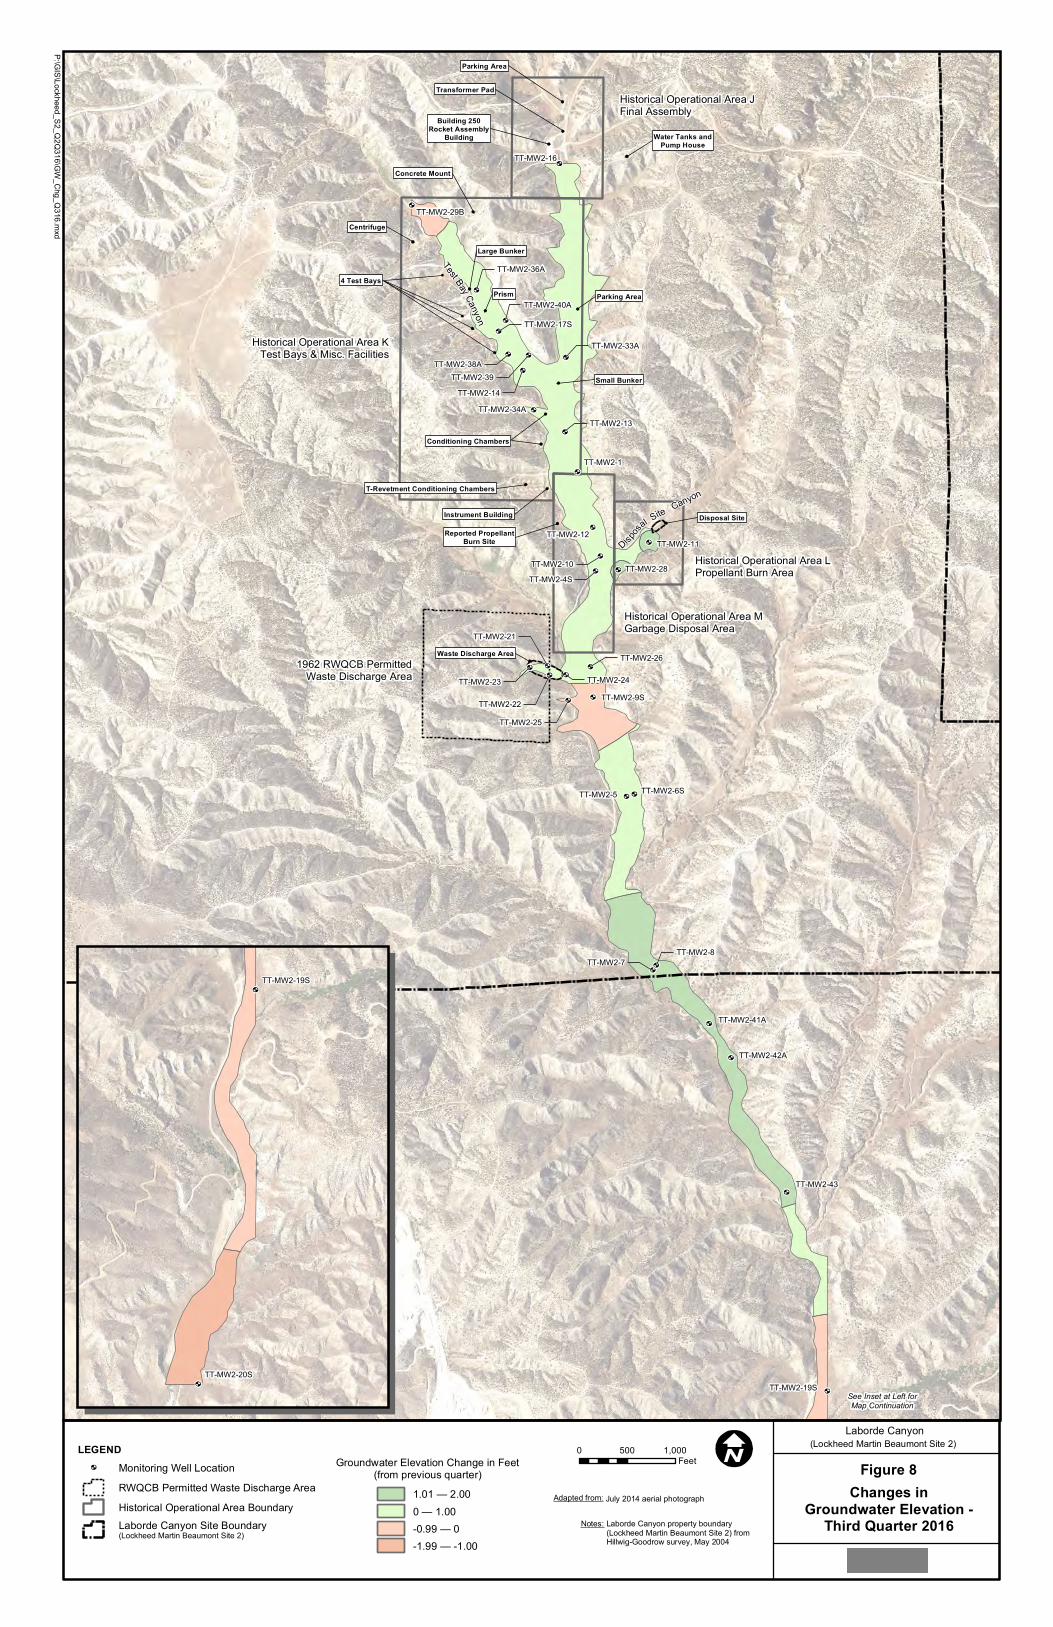
Te stBayCanyon
Dispos
al Site Canyon
See Inset at Left forMap Continuation
Parking Area
Water Tanks andPump House
Parking Area
Small Bunker
Building 250Rocket Assembly
Building
Prism4 Test Bays
T-Revetment Conditioning Chambers
Waste Discharge Area
Transformer Pad
Concrete Mount
Centrifuge
Conditioning Chambers
Instrument Building
Reported PropellantBurn Site
Disposal Site
Large Bunker
Historic al Ope rational Are a JFinal Asse m bly
Historic al Ope rational Are a LPrope llant Burn Are a
Historic al Ope rational Are a MGarbage Disposal Are a
Historic al Ope rational Are a KTe st Bays & Misc . Fac ilitie s
1962 RWQCB Pe rm itte dWaste Disc harge Are a
TT-MW2-1
TT-MW2-5
TT-MW2-8TT-MW2-7
TT-MW2-43
TT-MW2-39
TT-MW2-28
TT-MW2-26
TT-MW2-25
TT-MW2-21
TT-MW2-23
TT-MW2-22
TT-MW2-4S
TT-MW2-6S
TT-MW2-9S
TT-MW2-10
TT-MW2-12
TT-MW2-14
TT-MW2-16
TT-MW2-42A
TT-MW2-41A
TT-MW2-40A
TT-MW2-38A
TT-MW2-34A
TT-MW2-19S
TT-MW2-17S
TT-MW2-24
TT-MW2-13
TT-MW2-11
TT-MW2-29B
TT-MW2-36A
TT-MW2-33A
Labord e Canyon
Changes inGroundwater Elevation -
Third Quarter 2016
0 500 1,000Fe e t
Ad apte d from :July 2014 ae rial photograph
N ote s:Labord e Canyon prope rty bound ary(Loc khe e d Martin Be aum ont Site 2) fromHillwig-Good row surve y, May 2004
Figure 8
TT-MW2-20S
TT-MW2-19S
LEGENDMonitoring We ll Loc ationRWQCB Pe rm itte d Waste Disc harge Are aHistoric al Ope rational Are a Bound aryLabord e Canyon Site Bound ary(Loc khe e d Martin Be aum ont Site 2)
(Loc khe e d Martin Be aum ont Site 2)
P:\GIS\Lockheed_S2_Q2Q316\GW_Chg_Q316.mxd
Ground wate r Ele vation Change in Fe e t(from pre vious quarte r)
1.01 — 2.000 — 1.00-0.99 — 0-1.99 — -1.00
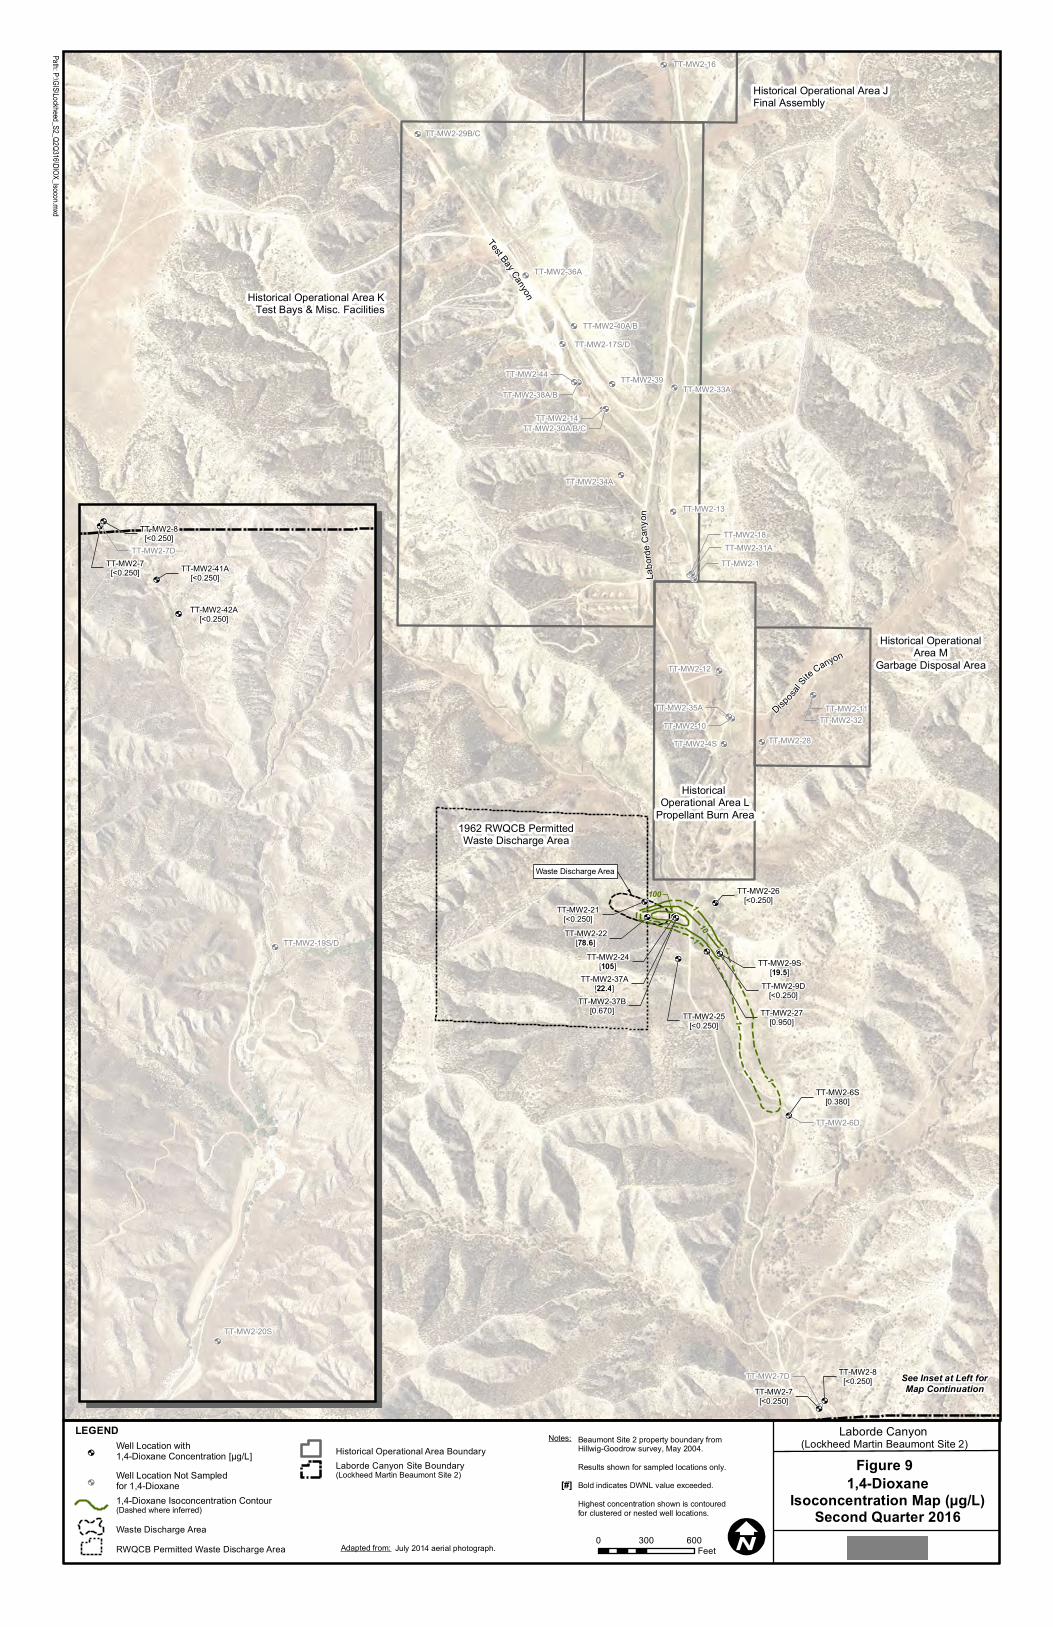
1
10
100
1
1
1
Labo
rdeCa
nyon
Waste Discharge Area
Test Bay Canyon
DisposalSite
Canyon
See Inset at Left forMap Continuation
Historical Operational Area JFinal Assembly
Historical OperationalArea M
Garbage Disposal Area
Historical Operational Area L
Propellant Burn Area
Historical Operational Area KTest Bays & Misc. Facilities
1962 RWQCB PermittedWaste Discharge Area
TT-MW2-27[0.950]
TT-MW2-6S[0.380]
TT-MW2-8[<0.250]
TT-MW2-7[<0.250]
TT-MW2-26[<0.250]
TT-MW2-37B[0.670] TT-MW2-25
[<0.250]
TT-MW2-21[<0.250]
TT-MW2-9D[<0.250]
TT-MW2-24[105]
TT-MW2-22[78.6]
TT-MW2-9S[19.5]TT-MW2-37A
[22.4]
TT-MW2-1
TT-MW2-44 TT-MW2-39
TT-MW2-32
TT-MW2-28
TT-MW2-7D
TT-MW2-4S
TT-MW2-6D
TT-MW2-13
TT-MW2-10
TT-MW2-12
TT-MW2-14
TT-MW2-16
TT-MW2-29B/C
TT-MW2-36A
TT-MW2-40A/B
TT-MW2-34A
TT-MW2-17S/D
TT-MW2-11
TT-MW2-18
TT-MW2-38A/B
TT-MW2-30A/B/C
TT-MW2-33A
TT-MW2-31A
TT-MW2-35A
Laborde Canyon
1,4-DioxaneIsoconcentration Map (µg/L)
Second Quarter 20160 300 600
Feet
Notes: Beaumont Site 2 property boundary fromHillwig-Goodrow survey, May 2004.Results shown for sampled locations only.Bold indicates DWNL value exceeded.Highest concentration shown is contouredfor clustered or nested well locations.
Figure 9
LEGENDWell Location with1,4-Dioxane Concentration [µg/L]Well Location Not Sampledfor 1,4-Dioxane1,4-Dioxane Isoconcentration Contour(Dashed where inferred)
Waste Discharge AreaRWQCB Permitted Waste Discharge Area
Historical Operational Area BoundaryLaborde Canyon Site Boundary(Lockheed Martin Beaumont Site 2)
Path: P:\GIS\Lockheed_S2_Q2Q316\DIOX_Isocon.mxd
(Lockheed Martin Beaumont Site 2)
TT-MW2-8[<0.250]
TT-MW2-42A[<0.250]
TT-MW2-41A[<0.250]
TT-MW2-7[<0.250]
TT-MW2-20S
TT-MW2-19S/D
TT-MW2-7D
[#]
Adapted from: July 2014 aerial photograph.

5
5
100
Labo
rdeCa
nyon
Waste Discharge Area
Test Bay Canyon
DisposalSite Canyon
Historical Operational Area JFinal Assembly
Historical OperationalArea MGarbage Disposal Area
Historical Operational Area LPropellant Burn Area
Historical Operational Area KTest Bays & Misc. Facilities
1962 RWQCB PermittedWaste Discharge Area
TT-MW2-21[4.76]
TT-MW2-11[2.85]
TT-MW2-9S[0.870]
TT-MW2-26[<0.500]
TT-MW2-25[<0.500]
TT-MW2-27[<0.500]
TT-MW2-6S[<0.500]
TT-MW2-14[<0.500]
TT-MW2-17S[0.590]
TT-MW2-30A[<0.500]
TT-MW2-37B[<0.500]
TT-MW2-17D[6.92]
TT-MW2-32[<0.500]
TT-MW2-40B[<0.500]
TT-MW2-40A[<0.500]
TT-MW2-22[424]
TT-MW2-24[16.1]
TT-MW2-37A[5.85]
TT-MW2-1
TT-MW2-8TT-MW2-7
TT-MW2-44
TT-MW2-28
TT-MW2-7D
TT-MW2-4S
TT-MW2-6D
TT-MW2-13
TT-MW2-10
TT-MW2-12
TT-MW2-16
TT-MW2-29CTT-MW2-29B
TT-MW2-36A
TT-MW2-38B
TT-MW2-30CTT-MW2-30B
TT-MW2-34A
TT-MW2-39
TT-MW2-9D
TT-MW2-18
TT-MW2-38A
TT-MW2-33A
TT-MW2-31A
TT-MW2-35A
Laborde Canyon
Trichloroethene (TCE)Isoconcentration Map (µg/L)
Second Quarter 20160 300 600
FeetAdapted from: July 2014 aerial photograph.
Notes: Beaumont Site 2 property boundary fromHillwig-Goodrow survey, May 2004.Results shown for sampled locations only.Bold indicates MCL value exceeded.Highest concentration shown is contouredfor clustered or nested well locations.
Figure 10
LEGENDWell Location with TrichloroetheneConcentration [µg/L]Well Location Not Sampledfor TrichloroetheneTrichloroethene Isoconcentration Contour(Dashed where inferred)Historical Operational Area BoundaryLaborde Canyon Site Boundary(Lockheed Martin Beaumont Site 2)
Path: P:\GIS\Lockheed_S2_Q2Q316\TCE_Isocon.mxd
(Lockheed Martin Beaumont Site 2)
TT-MW2-8
TT-MW2-7
TT-MW2-42A
TT-MW2-41A
TT-MW2-20S
TT-MW2-19DTT-MW2-19S
TT-MW2-7D
[#]

100
1,000
10,000
10,000
1,000
100
100
10010,000
100
1,000
Labo
rdeCa
nyon
Waste Discharge Area
Test Bay Canyon
DisposalSite Canyon
See Inset at Left forMap Continuation
Historical Operational Area JFinal Assembly
Historical OperationalArea MGarbage Disposal Area
Historical Operational Area LPropellant Burn Area
Historical Operational Area KTest Bays & Misc. Facilities
1962 RWQCB PermittedWaste Discharge Area
TT-MW2-26[3.16]
TT-MW2-21[2.52]
TT-MW2-10[2.36]
TT-MW2-16[1.83]
TT-MW2-29B[1.02]
TT-MW2-40A[1.24]
TT-MW2-34A[5.41]
TT-MW2-33A[1.33]
TT-MW2-28[0.108]
TT-MW2-37B[0.92]
TT-MW2-22[0.345]
TT-MW2-4S[0.538]
TT-MW2-9D[0.120]
TT-MW2-12[0.132]
TT-MW2-36A[0.115]
TT-MW2-40B[0.403]
TT-MW2-30C[0.162]
TT-MW2-32[<0.100]
TT-MW2-25[<0.100]
TT-MW2-7D[<0.100]
TT-MW2-6D[<0.100]
TT-MW2-6S[700]
TT-MW2-8[56.5]
TT-MW2-7[57.2]
TT-MW2-38B[296]
TT-MW2-1[6,850]
TT-MW2-17S[676]
TT-MW2-30A[74.4]
TT-MW2-13[4,450]
TT-MW2-44[21,200]
TT-MW2-30B[5,000]
TT-MW2-38A[77,100]
TT-MW2-17D[26,100]
TT-MW2-29C[0.585]
TT-MW2-35A[0.193]
TT-MW2-31A[<0.100]
TT-MW2-27[174]
TT-MW2-11[179]
TT-MW2-9S[7,710]
TT-MW2-18[4,500]
TT-MW2-39[97,900]
TT-MW2-37A[9,380]
TT-MW2-24[84,300]
TT-MW2-14[20,100]
Laborde Canyon
PerchlorateIsoconcentration Map (µg/L)
Second Quarter 20160 300 600
FeetAdapted from: July 2014 aerial photograph.
Notes: Beaumont Site 2 property boundary fromHillwig-Goodrow survey, May 2004.Results shown for sampled locations only.Bold indicates MCL value exceeded.Highest concentration shown is contouredfor clustered or nested well locations.
Figure 11
TT-MW2-19S[2.37]
TT-MW2-42A[0.255]
TT-MW2-7D[<0.100]
TT-MW2-41A[<0.100]
TT-MW2-20S[<0.100]
TT-MW2-19D[<0.100]
TT-MW2-8[56.5]
TT-MW2-7[57.2]
LEGENDWell Location with PerchlorateConcentration [µg/L]Perchlorate Isoconcentration Contour(Dashed where inferred)Waste Discharge AreaRWQCB Permitted Waste Discharge Area
Historical Operational Area BoundaryLaborde Canyon Site Boundary(Lockheed Martin Beaumont Site 2)
0 500 1,000Feet
P:\GIS\Lockheed_S2_Q2Q316\Perc_Isocon.mxd
(Lockheed Martin Beaumont Site 2)
[#]

See Inset at Left forMap Continuation
Waste Discharge Area
Disposal SiteReported PropellantBurn Site
-0.04
Historical Operational Area JFinal Assembly
Historical Operational Area MGarbage Disposal Area
Historical Operational Area LPropellant Burn Area
Historical Operational Area KTest Bays & Misc. Facilities
1962 RWQCB PermittedWaste Discharge Area
TT-MW2-19S
W 2-1
W 2-3
W 2-2W 2-5
MW 2-2
MW 2-4
MW 2-5
MW 2-6
TT-MW2-39
TT-MW2-26
TT-MW2-6S
TT-MW2-38A
TT-MW2-17DTT-MW2-44
TT-MW2-32
TT-MW2-25
TT-MW2-22
TT-MW2-13
TT-MW2-12
TT-MW2-41A
TT-MW2-29C
TT-MW2-36A
TT-MW2-30C
TT-MW2-31A
TT-MW2-35A
TT-MW2-19D
TT-MW2-1
TT-MW2-27
TT-MW2-21
TT-MW2-4S
TT-MW2-9S
TT-MW2-42A
TT-MW2-29B
TT-MW2-40A
TT-MW2-30BTT-MW2-34A
TT-MW2-37B
TT-MW2-37A
TT-MW2-33A
TT-MW2-8TT-MW2-7
TT-MW2-28
TT-MW2-24
TT-MW2-7D
TT-MW2-6D
TT-MW2-18
TT-MW2-14
TT-MW2-16
TT-MW2-40B
TT-MW2-38B
TT-MW2-30A
TT-MW2-17S
TT-MW2-9D
TT-MW2-10TT-MW2-11
Laborde Canyon
Perchlorate Statistical AnalysisSummary Results
0 500 1,000Feet
Adapted from:July 2014 aerial photograph.
Note: Figure 12
TT-MW2-19D
TT-MW2-19S
TT-MW2-20S
Beaumont Site 2 property boundary fromHillwig-Goodrow survey, May 2004.
LEGENDDestroyed Production Well Location
Destroyed Monitoring Well Location
Reported Production Well Location
RWQCB Permitted Waste Discharge AreaHistorical Operational Area BoundaryLaborde Canyon Site Boundary
Path: P:\GIS\Lockheed_S2_Q2Q316\Trend_Perc.mxd
(Lockheed Martin Beaumont Site 2)
Increasing or Probably Increasing
Decreasing or Probably Decreasing
Stable
No Trend
Analyte Trend Results
Change in µg/L/yr
>10,000
1,000100101
Increasing Decreasing

Waste Discharge Area
Disposal Site
Reported PropellantBurn Site
Historical Operational Area JFinal Assembly
Historical Operational Area MGarbage Disposal Area
Historical Operational Area LPropellant Burn Area
Historical Operational Area KTest Bays & Misc. Facilities
1962 RWQCB PermittedWaste Discharge Area
W 2-1
W 2-3
W 2-2W 2-5
MW 2-2
MW 2-4
MW 2-5
MW 2-6
TT-MW2-21TT-MW2-22 TT-MW2-9S
TT-MW2-37A
TT-MW2-17D
TT-MW2-17S
TT-MW2-24
TT-MW2-32TT-MW2-11
TT-MW2-25
TT-MW2-6S
TT-MW2-14TT-MW2-30A
TT-MW2-26
TT-MW2-27
TT-MW2-40BTT-MW2-40A
TT-MW2-37B
Laborde Canyon
TCE Statistical AnalysisSummary Results
0 400 800Feet
Adapted from:July 2014 aerial photograph.
Note: Figure 13Beaumont Site 2 property boundary fromHillwig-Goodrow survey, May 2004.
LEGENDDestroyed Production Well Location
Destroyed Monitoring Well Location
Reported Production Well Location
RWQCB Permitted Waste Discharge AreaHistorical Operational Area BoundaryLaborde Canyon Property Boundary
Path: P:\GIS\Lockheed_S2_Q2Q316\Trend_TCE.mxd
(Lockheed Martin Beaumont Site 2)
Analyte Trend Results
Increasing or Probably Increasing
Decreasing or Probably Decreasing
No TrendAll Sample Results BelowDetection Limit
Change in µg/L/yr
>10,000
1,000100101
Increasing Decreasing

Waste Discharge Area
Disposal Site
Reported PropellantBurn Site
Historical Operational Area JFinal Assembly
Historical Operational Area MGarbage Disposal AreaHistorical Operational Area L
Propellant Burn Area
Historical Operational Area KTest Bays & Misc. Facilities
1962 RWQCB PermittedWaste Discharge Area
W 2-1
W 2-3
W 2-2W 2-5
MW 2-2
MW 2-4
MW 2-5
MW 2-6
TT-MW2-22TT-MW2-9S
TT-MW2-37A
TT-MW2-8
TT-MW2-24
TT-MW2-7
TT-MW2-26
TT-MW2-27
TT-MW2-6S
TT-MW2-37BTT-MW2-25
TT-MW2-21
TT-MW2-42A
TT-MW2-41A
TT-MW2-9D
Laborde Canyon
1,4-Dioxane StatisticalAnalysis Summary Results
0 400 800Feet
Adapted from:July 2014 aerial photograph.
Note: Figure 14Beaumont Site 2 property boundary fromHillwig-Goodrow survey, May 2004.
LEGENDDestroyed Production Well Location
Destroyed Monitoring Well Location
Reported Production Well Location
RWQCB Permitted Waste Discharge AreaHistorical Operational Area BoundaryLaborde Canyon Site Boundary
Path: P:\GIS\Lockheed_S2_Q2Q316\Trend_Diox.mxd
(Lockheed Martin Beaumont Site 2)
Analyte Trend Results
Increasing or Probably Increasing
Decreasing or Probably Decreasing
No TrendAll Sample Results BelowDetection Limit
Change in µg/L/yr
>10,000
1,000100101
Increasing Decreasing

Historical Operational Area JFinal Assembly
Waste Discharge Area
Disposal SiteReported PropellantBurn Site
Historical Operational Area KTest Bays & Misc. Facilities
Historical Operational Area MGarbage Disposal Area
Historical Operational Area LPropellant Burn Area
1962 RWQCB PermittedWaste Discharge Area
W 2-1
W 2-3
W 2-2
W 2-5
MW 2-2
MW 2-4
MW 2-5
MW 2-6
TT-MW2-24
TT-MW2-13
Laborde Canyon
RDX StatisticalAnalysis Summary Results
0 500 1,000Feet
Adapted from:
Note:
Figure 15
Beaumont Site 2 property boundary fromHillwig-Goodrow survey, May 2004.
LEGENDDestroyed Production Well Location
Destroyed Monitoring Well Location
Reported Production Well LocationRWQCB Permitted Waste Discharge Area
Historical Operational Area BoundaryBeaumont Site 2 Site Boundary
P:\GIS\Lockheed_S2_Q2Q316\Trend_RDX.mxd
(Lockheed Martin Beaumont Site 2)
Analyte Trend Results
Decreasing or Probably Decreasing
Change in µg/L/yr
>10,0001,000100101
Increasing Decreasing
July 2014 aerial photograph.

Tetra Tech Laborde Canyon Semiannual Groundwater Monitoring ReportSecond Quarter 2016 and Third Quarter 2016
TABLES

Table 1
Groundwater Elevation Data - Second Quarter 2016 and Third Quarter 2016
Date MeasuredDepth to Water
(feet BTOC)
Groundwater
Elevation
(feet msl)
Elevation
Change1
(feet)
Date MeasuredDepth to Water
(feet BTOC)
Groundwater
Elevation
(feet msl)
Elevation
Change1
(feet)TT-EW2-1 1840.24 05/10/16 24.04 1816.20 -0.10 08/22/16 26.07 1814.17 2.03
TT-EW2-2 2079.12 05/11/16 62.18 2016.94 0.21 08/22/16 62.22 2016.90 0.04
TT-EW2-3 1962.82 05/10/16 53.90 1908.92 0.01 08/22/16 54.02 1908.80 0.12
TT-MW2-1 2035.21 05/11/16 62.46 1972.75 0.01 08/22/16 62.50 1972.71 0.04
TT-MW2-2 2137.75 05/11/16 72.18 2065.57 0.13 08/22/16 72.25 2065.50 0.07
TT-MW2-3 2094.66 05/11/16 72.02 2022.64 0.22 08/22/16 72.10 2022.56 0.08
TT-MW2-4S 1986.94 05/10/16 51.84 1935.10 -0.07 08/22/16 52.34 1934.60 0.50
TT-MW2-4D 1987.17 05/10/16 60.22 1926.95 -0.01 08/22/16 60.69 1926.48 0.47
TT-MW2-5 1911.31 05/10/16 42.46 1868.85 0.24 08/22/16 42.59 1868.72 0.13
TT-MW2-6S 1908.00 05/10/16 39.81 1868.19 0.76 08/22/16 40.32 1867.68 0.51
TT-MW2-6D 1908.07 05/10/16 40.64 1867.43 0.82 08/22/16 39.57 1868.50 -1.07
TT-MW2-7 1839.25 05/10/16 24.54 1814.71 0.72 08/22/16 26.42 1812.83 1.88
TT-MW2-7D 1838.96 05/10/16 21.17 1817.79 -0.04 08/22/16 23.13 1815.83 1.96
TT-MW2-8 1836.32 05/10/16 20.75 1815.57 0.73 08/22/16 21.80 1814.52 1.05
TT-MW2-9S 1938.38 05/10/16 44.53 1893.85 0.53 08/22/16 44.11 1894.27 -0.42
TT-MW2-9D 1938.78 05/10/16 48.01 1890.77 0.84 08/22/16 47.56 1891.22 -0.45
TT-MW2-10 2001.57 05/10/16 58.50 1943.07 -0.05 08/22/16 58.67 1942.90 0.17
TT-MW2-11 2004.51 05/11/16 52.34 1952.17 0.11 08/22/16 53.36 1951.15 1.02
TT-MW2-12 2016.26 05/11/16 53.52 1962.74 0.10 08/22/16 53.86 1962.40 0.34
TT-MW2-13 2049.39 05/11/16 66.89 1982.50 -0.22 08/22/16 66.90 1982.49 0.01
TT-MW2-14 2074.78 05/11/16 68.53 2006.25 0.11 08/22/16 68.67 2006.11 0.14
TT-MW2-16 2137.20 05/11/16 65.03 2072.17 0.06 08/22/16 65.25 2071.95 0.22
TT-MW2-17S 2095.55 05/11/16 72.99 2022.56 0.57 08/22/16 73.05 2022.50 0.06
TT-MW2-17D 2095.33 05/11/16 72.64 2022.69 -0.16 08/22/16 72.68 2022.65 0.04
TT-MW2-18 2035.32 05/11/16 62.25 1973.07 0.05 08/22/16 62.32 1973.00 0.07
TT-MW2-19S 1698.18 05/10/16 47.21 1650.97 0.84 08/22/16 47.14 1651.04 -0.07
TT-MW2-19D 1698.15 05/10/16 28.80 1669.35 0.78 08/22/16 28.46 1669.69 -0.34
TT-MW2-20S 1587.10 05/10/16 39.02 1548.08 0.60 08/22/16 37.77 1549.33 -1.25
TT-MW2-20D 1587.62 05/10/16 38.25 1549.37 0.59 08/22/16 38.51 1549.11 0.26
TT-MW2-21 1978.45 05/10/16 67.72 1910.73 0.11 08/22/16 67.84 1910.61 0.12
TT-MW2-22 1975.86 05/10/16 66.22 1909.64 0.06 08/22/16 66.32 1909.54 0.10
TT-MW2-23 1995.17 05/10/16 84.39 1910.78 0.12 08/22/16 84.50 1910.67 0.11
TT-MW2-24 1964.26 05/10/16 54.92 1909.34 0.03 08/22/16 55.03 1909.23 0.11
TT-MW2-25 1966.96 05/10/16 65.92 1901.04 0.81 08/22/16 65.27 1901.69 -0.65
TT-MW2-26 1944.43 05/10/16 45.20 1899.23 -0.02 08/22/16 46.04 1898.39 0.84
TT-MW2-27 1948.27 05/10/16 56.50 1891.77 0.25 08/22/16 56.81 1891.46 0.31
TT-MW2-28 1995.65 05/11/16 64.14 1931.51 -0.50 08/22/16 65.25 1930.40 1.11
TT-MW2-29A 2147.77 05/11/16 Dry Dry Dry 08/22/16 Dry Dry Dry
TT-MW2-29B 2147.90 05/11/16 120.95 2026.95 -0.08 08/22/16 120.92 2026.98 -0.03
TT-MW2-29C 2147.83 05/11/16 127.82 2020.01 -0.12 08/22/16 127.89 2019.94 0.07
TT-MW2-30A 2074.37 05/11/16 73.61 2000.76 -0.01 08/22/16 73.70 2000.67 0.09
TT-MW2-30B 2074.41 05/11/16 75.82 1998.59 -0.11 08/22/16 75.93 1998.48 0.11
TT-MW2-30C 2074.35 05/11/16 78.02 1996.33 -0.19 08/22/16 78.14 1996.21 0.12
TT-MW2-31A 2036.11 05/11/16 63.30 1972.81 0.08 08/22/16 63.43 1972.68 0.13
TT-MW2-31B 2036.15 05/11/16 69.70 1966.45 0.06 08/22/16 69.98 1966.17 0.28
TT-MW2-32 2004.87 05/11/16 54.59 1950.28 -0.01 08/22/16 55.04 1949.83 0.45
TT-MW2-33A 2070.54 05/11/16 61.17 2009.37 -0.06 08/22/16 61.24 2009.30 0.07
TT-MW2-33B 2070.54 05/11/16 66.10 2004.44 -0.12 08/22/16 66.23 2004.31 0.13
TT-MW2-33C 2070.54 05/11/16 64.54 2006.00 -0.07 08/22/16 64.66 2005.88 0.12
TT-MW2-34A 2066.84 05/11/16 68.48 1998.36 0.15 08/22/16 68.54 1998.30 0.06
TT-MW2-34B 2066.85 05/11/16 74.42 1992.43 0.00 08/22/16 74.53 1992.32 0.11
TT-MW2-34C 2066.84 05/11/16 76.24 1990.60 -0.03 08/22/16 76.35 1990.49 0.11
TT-MW2-35A 2003.20 05/10/16 53.31 1949.89 0.16 08/22/16 53.79 1949.41 0.48
TT-MW2-35B 2003.20 05/10/16 58.37 1944.83 0.05 08/22/16 58.65 1944.55 0.28
TT-MW2-36A 2100.99 05/11/16 81.10 2019.89 0.08 08/22/16 81.16 2019.83 0.06
TT-MW2-36B 2101.04 05/11/16 81.74 2019.30 0.04 08/22/16 81.84 2019.20 0.10
TT-MW2-36C 2100.88 05/11/16 81.85 2019.03 0.00 08/22/16 81.97 2018.91 0.12
TT-MW2-37A 1963.62 05/10/16 66.16 1897.46 0.06 08/22/16 66.38 1897.24 0.22
TT-MW2-37B 1963.67 05/10/16 74.39 1889.28 0.07 08/22/16 74.63 1889.04 0.24
TT-MW2-38A 2084.56 05/10/16 61.84 2022.72 0.14 08/22/16 61.94 2022.62 0.10
TT-MW2-38B 2084.42 05/10/16 82.20 2002.22 0.03 08/22/16 82.24 2002.18 0.04
TT-MW2-39 2079.53 05/11/16 62.97 2016.56 0.21 08/22/16 63.03 2016.50 0.06
TT-MW2-40A 2096.28 05/11/16 74.22 2022.06 0.15 08/22/16 74.30 2021.98 0.08
TT-MW2-40B 2096.24 05/11/16 85.12 2011.12 -0.03 08/22/16 85.26 2010.98 0.14
Well IDTOC Elevation
(feet msl)
Second Quarter 2015 Third Quarter 2015
Page 1 of 21

Table 1
Groundwater Elevation Data - Second Quarter 2016 and Third Quarter 2016
Date MeasuredDepth to Water
(feet BTOC)
Groundwater
Elevation
(feet msl)
Elevation
Change1
(feet)
Date MeasuredDepth to Water
(feet BTOC)
Groundwater
Elevation
(feet msl)
Elevation
Change1
(feet)
Well IDTOC Elevation
(feet msl)
Second Quarter 2015 Third Quarter 2015
TT-MW2-40C 2096.28 05/11/16 89.81 2006.47 -0.08 08/22/16 89.94 2006.34 0.13
Tt-MW2-41A 1812.47 05/10/16 26.37 1786.10 1.04 08/22/16 27.50 1784.97 1.13
Tt-MW2-41B 1812.22 05/10/16 23.48 1788.74 1.36 08/22/16 24.17 1788.05 0.69
Tt-MW2-42A 1799.06 05/10/16 30.23 1768.83 1.62 08/22/16 31.81 1767.25 1.58
Tt-MW2-42B 1799.07 05/10/16 27.92 1771.15 1.28 08/22/16 29.30 1769.77 1.38
Tt-MW2-43 1771.44 05/10/16 Dry Dry Dry 08/22/16 Dry Dry Dry
Tt-MW2-44 2085.22 05/11/16 62.61 2022.61 -0.02 08/22/16 62.75 2022.47 0.14
TT-PZ2-1 1847.06 05/10/16 27.75 1819.31 0.77 08/22/16 27.84 1819.22 0.09
TT-PZ2-2 1840.76 05/10/16 25.06 1815.70 0.80 08/22/16 26.25 1814.51 1.19
TT-PZ2-3 2079.89 05/11/16 60.75 2019.14 0.13 08/22/16 60.84 2019.05 0.09
TT-PZ2-4 1961.49 05/10/16 53.12 1908.37 0.03 08/22/16 53.15 1908.34 0.03
Acronyms and Abreviations
BTOC: below top of well casing
NA - Not applicable
msl - Mean sea level
TOC: top of well casing
Notes
1. Positive values indicate an increase in elevations; negative values indicate a decrease in elevation
Page 2 of 21

Table 2
Sampling Schedule and Analysis Method
Second Quarter 2016
Sampling Location Sample Date VO
Cs
(1)
1,4
-dio
xa
ne
(2)
Per
chlo
rate
(3)
RD
X(4
) Comments and QA/QC Samples
WS-1 NA - - - - Spring Sample, Dry
WS-2 NA - - - - Spring Sample, Dry
WS-3 NA - - - - Spring Sample, Dry
TT-MW2-1 6/10/2016 - - X - Sample with Dedicated Pump
TT-MW2-4S 6/9/2016 - - X - Sample with Dedicated Pump
TT-MW2-5 NA - - - - Sample with Dedicated Pump, Unsufficient water to sample
TT-MW2-6S 7/15/2016 X X X - Sample with Dedicated Pump
TT-MW2-6D 6/9/2016 - - X - Sample with Dedicated Pump
TT-MW2-7 6/9/2016 - X X - Sample with Dedicated Pump, Duplicate TT-MW2-7-FD-16Q2
TT-MW2-7D 6/13/2016 - - X - Sample with Dedicated Pump, MS/MSD sample
TT-MW2-8 6/9/2016 - X X - Sample with Dedicated Pump
TT-MW2-9S 6/10/2016 X X X - Sample with Dedicated Pump
TT-MW2-9D 6/10/2016 - X X - Sample with Dedicated Pump
TT-MW2-10 6/10/2016 - - X - Sample with Dedicated Pump
TT-MW2-11 6/10/2016 X - X - Sample with Dedicated Pump, Duplicate TT-MW2-11-FD-16Q2
TT-MW2-12 6/9/2016 - - X - Sample with Dedicated Pump
TT-MW2-13 6/16/2016 - - X X Sample with Dedicated Pump, RDX Duplicate TT-MW2-13-FD-16Q2
TT-MW2-14 6/8/2016 X - X - Sample with Dedicated Pump,
TT-MW2-16 6/10/2016 - - X - Sample with Dedicated Pump, Duplicate TT-MW2-16-FD-16Q2
TT-MW2-17S 6/9/2016 X - X - Sample with Dedicated Pump
TT-MW2-17D 6/9/2016 X - X - Sample with Dedicated Pump
TT-MW2-18 6/10/2016 - - X - Sample with Dedicated Pump
TT-MW-19S 6/13/2016 - - X - Sample with Dedicated Pump
TT-MW-19D 6/13/2016 - - X - Sample with Dedicated Pump
TT-MW-20S 6/13/2016 - - X - Sample with Dedicated Pump, MS/MSD sample
TT-MW2-21 6/10/2016 X X X - Sample with Dedicated Pump, Duplicate TT-MW2-21-FD-16Q2
TT-MW2-22 6/10/2016 X X X - Sample with Dedicated Pump
TT-MW2-24 6/16/2016 X X X X Sample with Dedicated Pump
TT-MW2-25 6/10/2016 X X X - Sample with Dedicated Pump, MS/MSD sample
TT-MW2-26 6/10/2016 X X X - Sample with Dedicated Pump
TT-MW2-27 6/10/2016 X X X - Sample with Dedicated Pump
TT-MW2-28 6/9/2016 - - X - Sample with Dedicated Pump
TT-MW2-29B 6/9/2016 - - X - Sample with Dedicated Pump
TT-MW2-29C 6/9/2016 - - X - Sample with Dedicated Pump
TT-MW2-30A 6/8/2016 X - X - Sample with Dedicated Pump
TT-MW2-30B 6/8/2016 - - X - Sample with Dedicated Pump
TT-MW2-30C 6/8/2016 - - X - Sample with Dedicated Pump
TT-MW2-31A 6/10/2016 - - X - Sample with Dedicated Pump
TT-MW2-32 6/10/2016 X - X - Sample with Dedicated Pump
TT-MW2-33A 6/9/2016 - - X - Sample with Dedicated Pump
TT-MW2-34A 6/9/2016 - - X - Sample with Dedicated Pump
TT-MW2-35A 6/10/2016 - - X - Sample with Dedicated Pump
TT-MW2-36A 6/9/2016 - - X - Sample with Dedicated Pump
TT-MW2-37A 6/10/2016 X X X - Sample with Dedicated Pump
TT-MW2-37B 6/10/2016 X X X - Sample with Dedicated Pump
TT-MW2-38A 6/9/2016 - - X - Sample with Dedicated Pump
TT-MW2-38B 6/9/2016 - - X - Sample with Dedicated Pump
TT-MW2-39 6/9/2016 - - X - Sample with Dedicated Pump, Duplicate TT-MW2-39-FD-16Q2
TT-MW2-40A 6/9/2016 X - X - Sample with Dedicated Pump
TT-MW2-40B 6/9/2016 X - X - Sample with Dedicated Pump
TT-MW2-41A 6/13/2016 - X X - Sample with Dedicated Pump
TT-MW2-44 6/9/2016 - - X - Sample with Dedicated Pump
TT-MW2-29A NA - - - - Sample with Portable Pump
TT-MW2-42A 6/13/2016 - X X - Sample with Portable Pump
54
49
Notes:
"-"
EPA -
QA/QC -
MS / MSD -
NA -
VOCs -
(1) -
(2) -
(3) - Perchlorate analyzed by EPA Method E331.0, E332.0, or SW6850
(4) - Hexahydro-1,3,5-trinitro-1,3,5-triazine (RDX) EPA Method 8330A
Not analyzed
Total Sampling Locations:
Total Samples Collected:
Well not sampled or surface water sample not collected
1,4 - Dioxane analyzed by EPA Method SW8270C SIM
United States Environmental Protection Agency
Quality assurance / quality control
Matrix Spike / Matrix Spike Duplicate
Not available
Volatile organic compounds
Volatile organic compounds (VOC) analyzed by EPA Methods SW8260B
Page 3 of 21
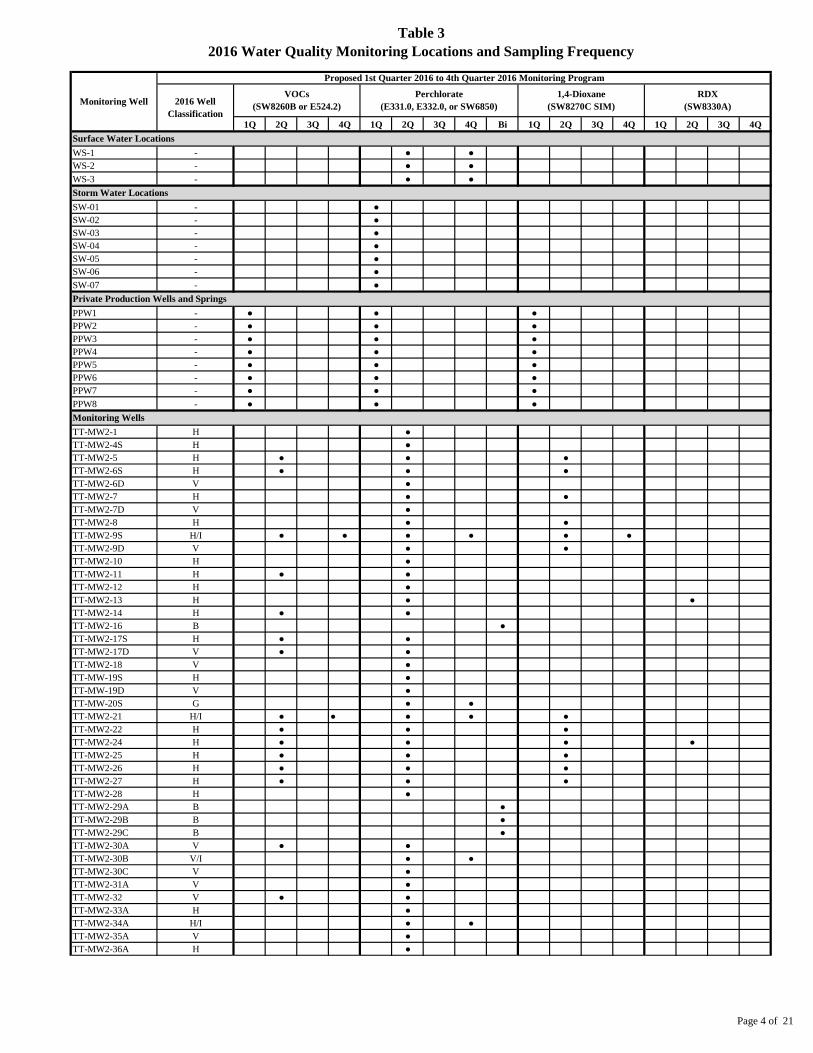
Table 3
2016 Water Quality Monitoring Locations and Sampling Frequency
1Q 2Q 3Q 4Q 1Q 2Q 3Q 4Q Bi 1Q 2Q 3Q 4Q 1Q 2Q 3Q 4Q
WS-1 - ● ●
WS-2 - ● ●
WS-3 - ● ●
SW-01 - ●
SW-02 - ●
SW-03 - ●
SW-04 - ●
SW-05 - ●
SW-06 - ●
SW-07 - ●
PPW1 - ● ● ●
PPW2 - ● ● ●
PPW3 - ● ● ●
PPW4 - ● ● ●
PPW5 - ● ● ●
PPW6 - ● ● ●
PPW7 - ● ● ●
PPW8 - ● ● ●
TT-MW2-1 H ●
TT-MW2-4S H ●
TT-MW2-5 H ● ● ●
TT-MW2-6S H ● ● ●
TT-MW2-6D V ●
TT-MW2-7 H ● ●
TT-MW2-7D V ●
TT-MW2-8 H ● ●
TT-MW2-9S H/I ● ● ● ● ● ●
TT-MW2-9D V ● ●
TT-MW2-10 H ●
TT-MW2-11 H ● ●
TT-MW2-12 H ●
TT-MW2-13 H ● ●
TT-MW2-14 H ● ●
TT-MW2-16 B ●
TT-MW2-17S H ● ●
TT-MW2-17D V ● ●
TT-MW2-18 V ●
TT-MW-19S H ●
TT-MW-19D V ●
TT-MW-20S G ● ●
TT-MW2-21 H/I ● ● ● ● ●
TT-MW2-22 H ● ● ●
TT-MW2-24 H ● ● ● ●
TT-MW2-25 H ● ● ●
TT-MW2-26 H ● ● ●
TT-MW2-27 H ● ● ●
TT-MW2-28 H ●
TT-MW2-29A B ●
TT-MW2-29B B ●
TT-MW2-29C B ●
TT-MW2-30A V ● ●
TT-MW2-30B V/I ● ●
TT-MW2-30C V ●
TT-MW2-31A V ●
TT-MW2-32 V ● ●
TT-MW2-33A H ●
TT-MW2-34A H/I ● ●
TT-MW2-35A V ●
TT-MW2-36A H ●
Surface Water Locations
Storm Water Locations
Private Production Wells and Springs
Monitoring Wells
Monitoring Well
Proposed 1st Quarter 2016 to 4th Quarter 2016 Monitoring Program
2016 Well
Classification
VOCs
(SW8260B or E524.2)
Perchlorate
(E331.0, E332.0, or SW6850)
1,4-Dioxane
(SW8270C SIM)
RDX
(SW8330A)
Page 4 of 21

Table 3
2016 Water Quality Monitoring Locations and Sampling Frequency
1Q 2Q 3Q 4Q 1Q 2Q 3Q 4Q Bi 1Q 2Q 3Q 4Q 1Q 2Q 3Q 4Q
Surface Water Locations
Monitoring Well
Proposed 1st Quarter 2016 to 4th Quarter 2016 Monitoring Program
2016 Well
Classification
VOCs
(SW8260B or E524.2)
Perchlorate
(E331.0, E332.0, or SW6850)
1,4-Dioxane
(SW8270C SIM)
RDX
(SW8330A)
TT-MW2-37A H/I ● ● ● ● ● ●
TT-MW2-37B V/I ● ● ● ●
TT-MW2-38A H ●
TT-MW2-38B V ●
TT-MW2-39 H ●
TT-MW2-40A H/I ● ● ●
TT-MW2-40B V ● ●
TT-MW2-41A H ● ●
TT-MW2-42A G ● ● ●
TT-MW2-44 H ●
TT-MW2-2 R
TT-MW2-3 R
TT-MW2-4D R
TT-MW-20D R
TT-MW2-23 R
TT-MW2-31B R
TT-MW2-33B R
TT-MW2-33C R
TT-MW2-34B R
TT-MW2-34C R
TT-MW2-35B R
TT-MW2-36B R
TT-MW2-36C R
TT-MW2-40C R
TT-MW2-43 R
TT-MW2-41B -
TT-MW2-42B -
TT-PZ2-1 -
TT-PZ2-2 -
TT-PZ2-3 -
TT-PZ2-4 -
TT-EW2-1 -
TT-EW2-2 -
TT-EW2-3 -
TT-EW2-4 -
8 19 0 3 15 50 0 12 4 8 16 0 2 0 2 0 0
Notes
VOCs: Volatile organic compounds
RDX: Hexahydro-1,3,5-trinitro-1,3,5-triazine
Bi: Biennial (sampled in even numbered years)
B: Background well
G: Guard well
H: Horizontal extent well
I: Increasing contaminant trend well
R: Redundant well
V: Vertical distribution well
2Totals -
30 81 26
Monitoring Wells (Not Sampled)
Piezometers (Not Sampled)
Extraction Wells (Not Sampled)
Page 5 of 21
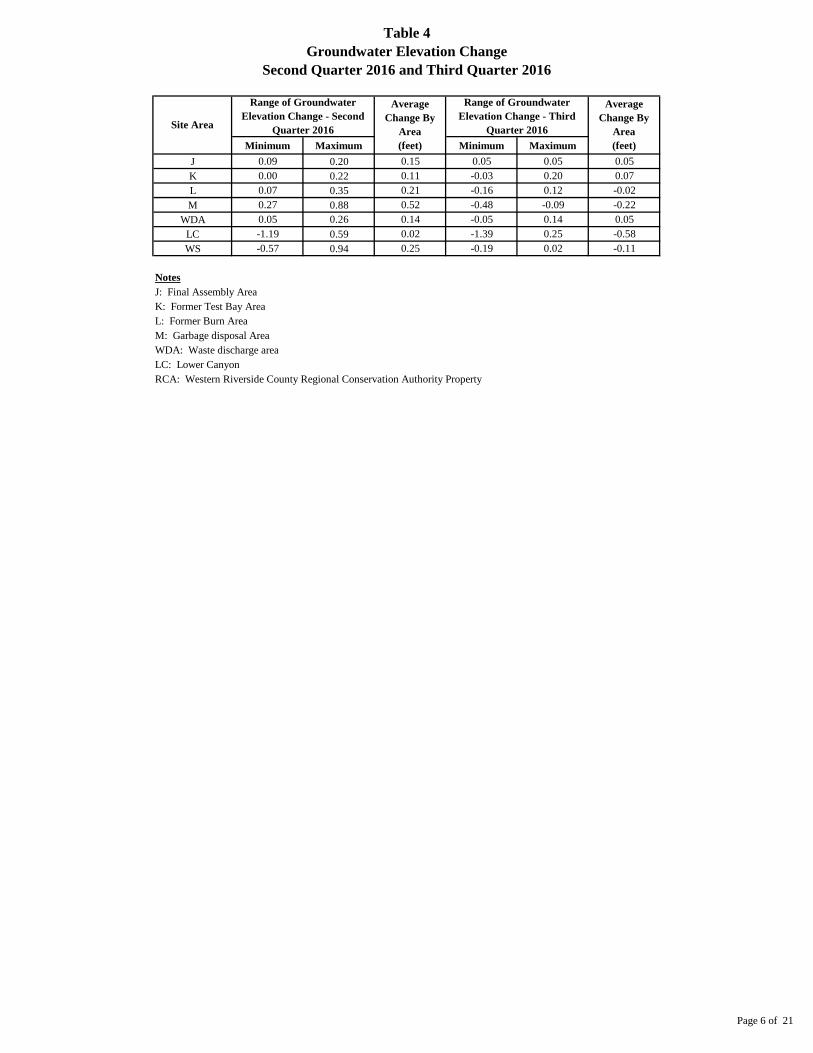
Table 4
Groundwater Elevation Change
Second Quarter 2016 and Third Quarter 2016
Minimum Maximum Minimum Maximum
J 0.09 0.20 0.15 0.05 0.05 0.05
K 0.00 0.22 0.11 -0.03 0.20 0.07
L 0.07 0.35 0.21 -0.16 0.12 -0.02
M 0.27 0.88 0.52 -0.48 -0.09 -0.22
WDA 0.05 0.26 0.14 -0.05 0.14 0.05
LC -1.19 0.59 0.02 -1.39 0.25 -0.58
WS -0.57 0.94 0.25 -0.19 0.02 -0.11
Notes
J: Final Assembly Area
K: Former Test Bay Area
L: Former Burn Area
M: Garbage disposal Area
WDA: Waste discharge area
LC: Lower Canyon
RCA: Western Riverside County Regional Conservation Authority Property
Range of Groundwater
Elevation Change - Second
Quarter 2016
Range of Groundwater
Elevation Change - Third
Quarter 2016
Average
Change By
Area
(feet)
Site Area
Average
Change By
Area
(feet)
Page 6 of 21

Table 5
Summary of Horizontal and Vertical Groundwater Gradients - Second Quarter 2016 and Third Quarter 2016
Overall
QAL/WSTF
TT-MW2-16
to
TT-MW2-6S
First Quarter (February 2016) 0.030
Second Quarter (February 2016) 0.030
Third Quarter (February 2016) 0.030
Area J Area K Area K Area L
deep screen
TT-MW2-2
(STF)
TT-MW2-17D
(wWSTF)
TT-MW2-18
(STF)
TT-MW2-4D
(STF) TT-MW2-9D (STF) TT-MW2-6D (STF) TT-MW2-7D (STF)
TT-MW2-19D
(MEF)
TT-MW2-20D
(MEF)
shallow screen
TT-MW2-16
(wSTF)
TT-MW2-17S
(wSTF)
TT-MW2-1
(wSTF)
TT-MW2-4S
(STF)
TT-MW2-9S
(wWSTF)
TT-MW2-6S
(wWSTF)
TT-MW2-7
(wWSTF)
TT-MW2-19S
(wMEF)
TT-MW2-20S
(wMEF)
First Quarter (February 2016) -0.14 -0.02 0.01 -0.32 -0.12 -0.040 0.06 0.17 0.033
Second Quarter (February 2016) -0.14 0.01 0.01 -0.33 -0.13 -0.044 0.08 0.17 0.033
Third Quarter (February 2016) -0.14 0.01 0.01 -0.32 -0.13 0.049 0.08 0.17 -0.006
Notes
Area J - Final Assembly Area
Area K - Former Test Bay Area
Area L - Former Burn Area
RCA Property - Western Riverside County Regional Conservation Authority Property
QAL - Quaternary Alluvium
STF - San Timoteo formation
MEF - Mt. Eden formation
wSTF - Weathered San Timoteo formation
wMEF - Weathered Mt. Eden formation
TT-MW2-6D
0.029
0.029
0.029
Vertical Groundwater Gradients (feet / foot)
Horizontal Groundwater Gradients (feet / foot), approximating a flowline perpendicular to groundwater contours
Overall
STF
TT-MW2-2
to
Southern portion of
Site 2
Southern portion of
Site 2 RCA Property RCA Property
Southern portion of
Site 2
Page 7 of 21
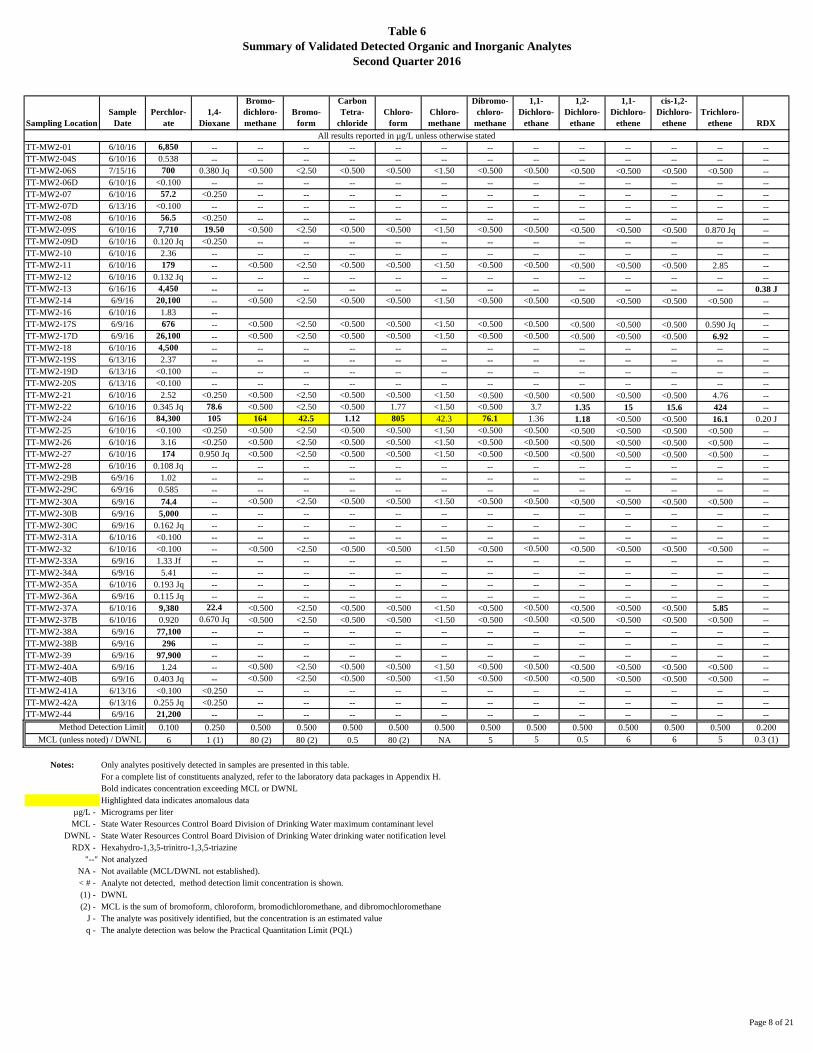
Table 6
Summary of Validated Detected Organic and Inorganic Analytes
Second Quarter 2016
Sampling Location
Sample
Date
Perchlor-
ate
1,4-
Dioxane
Bromo-
dichloro-
methane
Bromo-
form
Carbon
Tetra-
chloride
Chloro-
form
Chloro-
methane
Dibromo-
chloro-
methane
1,1-
Dichloro-
ethane
1,2-
Dichloro-
ethane
1,1-
Dichloro-
ethene
cis-1,2-
Dichloro-
ethene
Trichloro-
ethene RDX
TT-MW2-01 6/10/16 6,850 -- -- -- -- -- -- -- -- -- -- -- -- --
TT-MW2-04S 6/10/16 0.538 -- -- -- -- -- -- -- -- -- -- -- -- --
TT-MW2-06S 7/15/16 700 0.380 Jq <0.500 <2.50 <0.500 <0.500 <1.50 <0.500 <0.500 <0.500 <0.500 <0.500 <0.500 --
TT-MW2-06D 6/10/16 <0.100 -- -- -- -- -- -- -- -- -- -- -- -- --
TT-MW2-07 6/10/16 57.2 <0.250 -- -- -- -- -- -- -- -- -- -- -- --
TT-MW2-07D 6/13/16 <0.100 -- -- -- -- -- -- -- -- -- -- -- -- --
TT-MW2-08 6/10/16 56.5 <0.250 -- -- -- -- -- -- -- -- -- -- -- --
TT-MW2-09S 6/10/16 7,710 19.50 <0.500 <2.50 <0.500 <0.500 <1.50 <0.500 <0.500 <0.500 <0.500 <0.500 0.870 Jq --
TT-MW2-09D 6/10/16 0.120 Jq <0.250 -- -- -- -- -- -- -- -- -- -- -- --
TT-MW2-10 6/10/16 2.36 -- -- -- -- -- -- -- -- -- -- -- -- --
TT-MW2-11 6/10/16 179 -- <0.500 <2.50 <0.500 <0.500 <1.50 <0.500 <0.500 <0.500 <0.500 <0.500 2.85 --
TT-MW2-12 6/10/16 0.132 Jq -- -- -- -- -- -- -- -- -- -- -- -- --
TT-MW2-13 6/16/16 4,450 -- -- -- -- -- -- -- -- -- -- -- -- 0.38 J
TT-MW2-14 6/9/16 20,100 -- <0.500 <2.50 <0.500 <0.500 <1.50 <0.500 <0.500 <0.500 <0.500 <0.500 <0.500 --
TT-MW2-16 6/10/16 1.83 -- --
TT-MW2-17S 6/9/16 676 -- <0.500 <2.50 <0.500 <0.500 <1.50 <0.500 <0.500 <0.500 <0.500 <0.500 0.590 Jq --
TT-MW2-17D 6/9/16 26,100 -- <0.500 <2.50 <0.500 <0.500 <1.50 <0.500 <0.500 <0.500 <0.500 <0.500 6.92 --
TT-MW2-18 6/10/16 4,500 -- -- -- -- -- -- -- -- -- -- -- -- --
TT-MW2-19S 6/13/16 2.37 -- -- -- -- -- -- -- -- -- -- -- -- --
TT-MW2-19D 6/13/16 <0.100 -- -- -- -- -- -- -- -- -- -- -- -- --
TT-MW2-20S 6/13/16 <0.100 -- -- -- -- -- -- -- -- -- -- -- -- --
TT-MW2-21 6/10/16 2.52 <0.250 <0.500 <2.50 <0.500 <0.500 <1.50 <0.500 <0.500 <0.500 <0.500 <0.500 4.76 --
TT-MW2-22 6/10/16 0.345 Jq 78.6 <0.500 <2.50 <0.500 1.77 <1.50 <0.500 3.7 1.35 15 15.6 424 --
TT-MW2-24 6/16/16 84,300 105 164 42.5 1.12 805 42.3 76.1 1.36 1.18 <0.500 <0.500 16.1 0.20 J
TT-MW2-25 6/10/16 <0.100 <0.250 <0.500 <2.50 <0.500 <0.500 <1.50 <0.500 <0.500 <0.500 <0.500 <0.500 <0.500 --
TT-MW2-26 6/10/16 3.16 <0.250 <0.500 <2.50 <0.500 <0.500 <1.50 <0.500 <0.500 <0.500 <0.500 <0.500 <0.500 --
TT-MW2-27 6/10/16 174 0.950 Jq <0.500 <2.50 <0.500 <0.500 <1.50 <0.500 <0.500 <0.500 <0.500 <0.500 <0.500 --
TT-MW2-28 6/10/16 0.108 Jq -- -- -- -- -- -- -- -- -- -- -- -- --
TT-MW2-29B 6/9/16 1.02 -- -- -- -- -- -- -- -- -- -- -- -- --
TT-MW2-29C 6/9/16 0.585 -- -- -- -- -- -- -- -- -- -- -- -- --
TT-MW2-30A 6/9/16 74.4 -- <0.500 <2.50 <0.500 <0.500 <1.50 <0.500 <0.500 <0.500 <0.500 <0.500 <0.500 --
TT-MW2-30B 6/9/16 5,000 -- -- -- -- -- -- -- -- -- -- -- -- --
TT-MW2-30C 6/9/16 0.162 Jq -- -- -- -- -- -- -- -- -- -- -- -- --
TT-MW2-31A 6/10/16 <0.100 -- -- -- -- -- -- -- -- -- -- -- -- --
TT-MW2-32 6/10/16 <0.100 -- <0.500 <2.50 <0.500 <0.500 <1.50 <0.500 <0.500 <0.500 <0.500 <0.500 <0.500 --
TT-MW2-33A 6/9/16 1.33 Jf -- -- -- -- -- -- -- -- -- -- -- -- --
TT-MW2-34A 6/9/16 5.41 -- -- -- -- -- -- -- -- -- -- -- -- --
TT-MW2-35A 6/10/16 0.193 Jq -- -- -- -- -- -- -- -- -- -- -- -- --
TT-MW2-36A 6/9/16 0.115 Jq -- -- -- -- -- -- -- -- -- -- -- -- --
TT-MW2-37A 6/10/16 9,380 22.4 <0.500 <2.50 <0.500 <0.500 <1.50 <0.500 <0.500 <0.500 <0.500 <0.500 5.85 --
TT-MW2-37B 6/10/16 0.920 0.670 Jq <0.500 <2.50 <0.500 <0.500 <1.50 <0.500 <0.500 <0.500 <0.500 <0.500 <0.500 --
TT-MW2-38A 6/9/16 77,100 -- -- -- -- -- -- -- -- -- -- -- -- --
TT-MW2-38B 6/9/16 296 -- -- -- -- -- -- -- -- -- -- -- -- --
TT-MW2-39 6/9/16 97,900 -- -- -- -- -- -- -- -- -- -- -- -- --
TT-MW2-40A 6/9/16 1.24 -- <0.500 <2.50 <0.500 <0.500 <1.50 <0.500 <0.500 <0.500 <0.500 <0.500 <0.500 --
TT-MW2-40B 6/9/16 0.403 Jq -- <0.500 <2.50 <0.500 <0.500 <1.50 <0.500 <0.500 <0.500 <0.500 <0.500 <0.500 --
TT-MW2-41A 6/13/16 <0.100 <0.250 -- -- -- -- -- -- -- -- -- -- -- --
TT-MW2-42A 6/13/16 0.255 Jq <0.250 -- -- -- -- -- -- -- -- -- -- -- --
TT-MW2-44 6/9/16 21,200 -- -- -- -- -- -- -- -- -- -- -- -- --
0.100 0.250 0.500 0.500 0.500 0.500 0.500 0.500 0.500 0.500 0.500 0.500 0.500 0.200
6 1 (1) 80 (2) 80 (2) 0.5 80 (2) NA 5 5 0.5 6 6 5 0.3 (1)
Notes: Only analytes positively detected in samples are presented in this table.
For a complete list of constituents analyzed, refer to the laboratory data packages in Appendix H.
Bold indicates concentration exceeding MCL or DWNL
Highlighted data indicates anomalous data
µg/L - Micrograms per liter
MCL - State Water Resources Control Board Division of Drinking Water maximum contaminant level
DWNL - State Water Resources Control Board Division of Drinking Water drinking water notification level
RDX - Hexahydro-1,3,5-trinitro-1,3,5-triazine
"--" Not analyzed
NA - Not available (MCL/DWNL not established).
< # - Analyte not detected, method detection limit concentration is shown.
(1) - DWNL
(2) - MCL is the sum of bromoform, chloroform, bromodichloromethane, and dibromochloromethane
J - The analyte was positively identified, but the concentration is an estimated value
q - The analyte detection was below the Practical Quantitation Limit (PQL)
All results reported in µg/L unless otherwise stated
Method Detection Limit
MCL (unless noted) / DWNL
Page 8 of 21
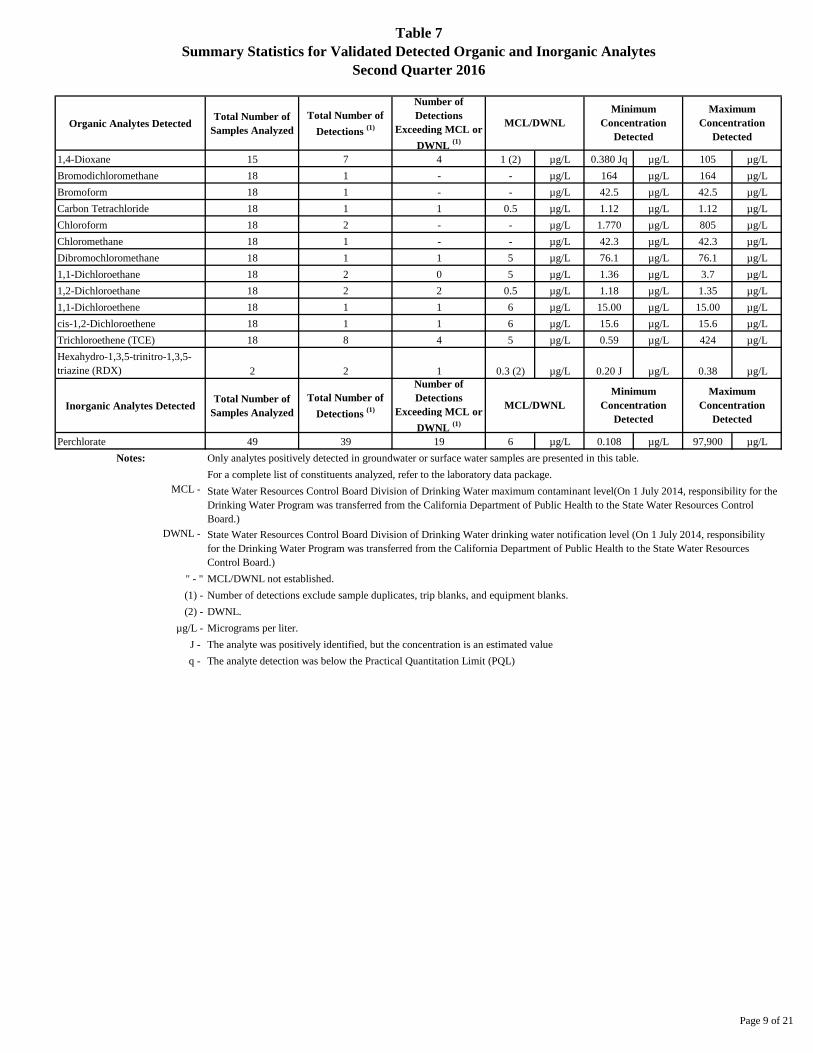
Table 7
Summary Statistics for Validated Detected Organic and Inorganic Analytes
Second Quarter 2016
Organic Analytes DetectedTotal Number of
Samples Analyzed
Total Number of
Detections (1)
Number of
Detections
Exceeding MCL or
DWNL (1)
1,4-Dioxane 15 7 4 1 (2) µg/L 0.380 Jq µg/L 105 µg/L
Bromodichloromethane 18 1 - - µg/L 164 µg/L 164 µg/L
Bromoform 18 1 - - µg/L 42.5 µg/L 42.5 µg/L
Carbon Tetrachloride 18 1 1 0.5 µg/L 1.12 µg/L 1.12 µg/L
Chloroform 18 2 - - µg/L 1.770 µg/L 805 µg/L
Chloromethane 18 1 - - µg/L 42.3 µg/L 42.3 µg/L
Dibromochloromethane 18 1 1 5 µg/L 76.1 µg/L 76.1 µg/L
1,1-Dichloroethane 18 2 0 5 µg/L 1.36 µg/L 3.7 µg/L
1,2-Dichloroethane 18 2 2 0.5 µg/L 1.18 µg/L 1.35 µg/L
1,1-Dichloroethene 18 1 1 6 µg/L 15.00 µg/L 15.00 µg/L
cis-1,2-Dichloroethene 18 1 1 6 µg/L 15.6 µg/L 15.6 µg/L
Trichloroethene (TCE) 18 8 4 5 µg/L 0.59 µg/L 424 µg/L
Hexahydro-1,3,5-trinitro-1,3,5-
triazine (RDX) 2 2 1 0.3 (2) µg/L 0.20 J µg/L 0.38 µg/L
Inorganic Analytes DetectedTotal Number of
Samples Analyzed
Total Number of
Detections (1)
Number of
Detections
Exceeding MCL or
DWNL (1)
Perchlorate 49 39 19 6 µg/L 0.108 µg/L 97,900 µg/L
Notes:
MCL -
DWNL -
" - "
(1) -
(2) -
µg/L -
J -
q -
The analyte was positively identified, but the concentration is an estimated value
The analyte detection was below the Practical Quantitation Limit (PQL)
Micrograms per liter.
MCL/DWNL
Minimum
Concentration
Detected
Maximum
Concentration
Detected
MCL/DWNL
Minimum
Concentration
Detected
Maximum
Concentration
Detected
Only analytes positively detected in groundwater or surface water samples are presented in this table.
For a complete list of constituents analyzed, refer to the laboratory data package.
State Water Resources Control Board Division of Drinking Water maximum contaminant level(On 1 July 2014, responsibility for the
Drinking Water Program was transferred from the California Department of Public Health to the State Water Resources Control
Board.)
State Water Resources Control Board Division of Drinking Water drinking water notification level (On 1 July 2014, responsibility
for the Drinking Water Program was transferred from the California Department of Public Health to the State Water Resources
Control Board.)
MCL/DWNL not established.
Number of detections exclude sample duplicates, trip blanks, and equipment blanks.
DWNL.
Page 9 of 21

Table 8
Groundwater Chemicals of Potential Concern
Analyte ClassificationPerchlorate Primary
Trichloroethene Primary1,4-Dioxane Primary
Benzene Secondary1, 2-Dichloroethane Secondary1, 1-Dichloroethene Secondary
cis-1,2-dichloroethene SecondaryRDX Secondary
Note:RDX - Hexahydro-1,3,5-trinitro-1,3,5-triazine
Page 10 of 21

Table 9
Mann-Kendall Concentration Trend Matrix
Mann-Kendall Statistic (S) Confidence in Trend Concentration Trend
S > 0 > 95% Increasing
S > 0 90 - 95% Probably Increasing
S > 0 < 90% No Trend
S ≤ 0 < 90% and COV ≥1 No Trend
S ≤ 0 < 90% and COV < 1 Stable
S < 0 90 - 95% Probably Decreasing
S < 0 > 95% Decreasing
ND - Non-detect
NA - Not applicable
Notes
> - Greater than
≥ - Greater than or equal to 1
< - Less than
≤ - Less than or equal to
COV - Coefficient of Variation
ND - All results non-detect
NA - Not applicable, less than four quarters of data
Page 11 of 21

Table 10
Summary of Mann-Kendall Trend Analysis of Chemicals of Potential Concern for 2016 Sampled
Monitoring Wells
Analyte
Locations
Tested
Insufficient
Data No Trend Non Detect
Decreasing
Trend
Probably
Decreasing
Trend
Stable
Trend
Probably
Increasing
Trend
Increasing
Trend
Trichloroethene 18 0 2 9 0 1 0 0 6
Perchlorate 49 0 14 0 16 1 5 3 10
1,4-Dioxane 15 0 5 5 2 0 0 0 3
RDX 2 0 0 0 2 0 0 0 0Total Analysis 84 0 21 14 20 2 5 3 19
Notes
RDX - Hexahydro-1,3,5-trinitro-1,3,5-triazine
Page 12 of 21

Table 11
Summary of Mann-Kendall Trend Analysis of Chemicals of Potential Concern for 2016 Sampled Surface
Water Locations
Analyte
Locations
Tested
Insufficient
Data No Trend Non Detect
Decreasing
Trend
Probably
Decreasing
Trend
Stable
Trend
Probably
Increasing
Trend
Increasing
Trend
Trichloroethene 1 0 0 1 0 0 0 0 0
Perchlorate 1 0 1 0 0 0 0 0 1
1,4-Dioxane 1 1 0 0 0 0 0 0 0
RDX 0 0 0 0 0 0 0 0 0
Total Analysis 3 1 1 1 0 0 0 0 1
Notes
RDX - Hexahydro-1,3,5-trinitro-1,3,5-triazine
Page 13 of 21

Table 12
Magnitude of Trends Detected for Chemicals of Potential Concern for 2016 Sampled Monitoring Wells
Magnitude Magnitude
Analyte (µg/L/yr) (µg/L/yr) (µg/L/yr) (%/yr) (µg/L/yr) (%/yr)
Trichloroethene 0 1 -4.19 0 6 TT-MW2-9S 0.16 15.7
TT-MW2-17S 0.03 8.94
TT-MW2-17D 0.38 13.1
TT-MW2-21 0.45 15.0
TT-MW2-22 26 7.30
TT-MW2-37A 0.64 20
Perchlorate 16 -4,271 to -0.01 1 -3.27 3 TT-MW2-29B 0.06 13.0 10 TT-MW2-1 384 4.93
TT-MW2-40A 1.23 29 TT-MW2-4S 0.03 4.93
TT-MW2-42A 0.02 9.86 TT-MW2-9S 1,967 26
TT-MW2-21 2.41 22
TT-MW2-27 41 13.3
TT-MW2-30B 913 18.3
TT-MW2-33A 0.08 14.8
TT-MW2-34A 1.53 27
TT-MW2-37A 2,738 27
TT-MW2-37B 10.6 18.3
1,4-Dioxane 2 -10.1 to -0.16 0 0 3 TT-MW2-9S 1.31 8.76
TT-MW2-22 5.26 8.21
TT-MW2-37A 1.48 9.86
RDX 2 -0.33 to -0.02 0 0 0
Notes
RDX - Hexahydro-1,3,5-trinitro-1,3,5-triazine
µg/L/yr - Micrograms per liter per year
%/yr - Percent change per year
LocationMagnitude
Decreasing Trend
Probably Decreasing
Trend Probably Increasing Trend Increasing Trend
Number Number Number LocationMagnitude
Number
Page 14 of 21

Table 13
Historical Trichloroethene Trend Summary in Monitoring Wells
Trend Category 2006 2007 2008 2009 2010 2011 2012 2013 2014 2015 2016
"N/A"-Insufficient Data 3 0 6 31 0 0 0 0 0 0 0
"ND" - Non Detect (new designation) -- -- -- -- 50 11 11 10 9 9 9
"NT" - No Trend 1 1 2 1 5 2 2 2 1 2 2
"S" - Stable 4 20 16 24 0 1 0 0 0 1 0
"I" - Increasing 0 0 1 1 4 6 6 6 6 6 6
"PI" -Probably Increasing 0 0 0 1 0 0 0 0 1 0 0
"D" - Decreasing 0 0 0 0 0 0 0 1 1 0 0
"PD" -Probably Decreasing 0 0 0 0 0 0 1 0 0 0 1
Total Locations Tested 8 21 25 58 59 20 20 19 18 18 18
Notes
-- ND (non-detect) was not a category designation prior to the 2011 statistics
Locations Tested
Page 15 of 21
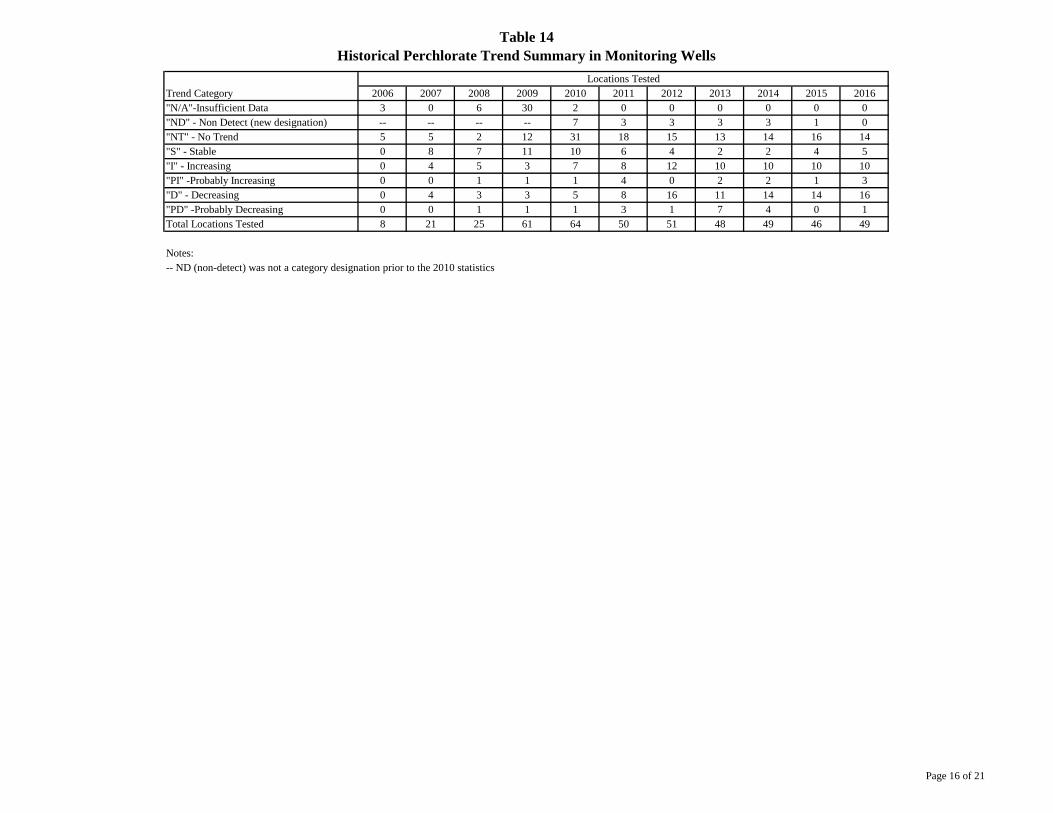
Table 14
Historical Perchlorate Trend Summary in Monitoring Wells
Trend Category 2006 2007 2008 2009 2010 2011 2012 2013 2014 2015 2016
"N/A"-Insufficient Data 3 0 6 30 2 0 0 0 0 0 0
"ND" - Non Detect (new designation) -- -- -- -- 7 3 3 3 3 1 0
"NT" - No Trend 5 5 2 12 31 18 15 13 14 16 14
"S" - Stable 0 8 7 11 10 6 4 2 2 4 5
"I" - Increasing 0 4 5 3 7 8 12 10 10 10 10
"PI" -Probably Increasing 0 0 1 1 1 4 0 2 2 1 3
"D" - Decreasing 0 4 3 3 5 8 16 11 14 14 16
"PD" -Probably Decreasing 0 0 1 1 1 3 1 7 4 0 1
Total Locations Tested 8 21 25 61 64 50 51 48 49 46 49
Notes:
Locations Tested
-- ND (non-detect) was not a category designation prior to the 2010 statistics
Page 16 of 21

Table 15
Historical 1,4-Dioxane Trend Summary in Monitoring Wells
Trend Category 2006 2007 2008 2009 2010 2011 2012 2013 2014 2015 2016
"N/A"-Insufficient Data -- -- -- 22 0 0 0 0 0 1 0
"ND" - Non Detect (new designation) -- -- -- -- 6 4 5 5 5 5 5
"NT" - No Trend -- -- -- 0 6 6 6 6 4 5 5
"S" - Stable -- -- -- 0 1 2 2 1 0 0 0
"I" - Increasing -- -- -- 0 0 2 3 3 3 3 3
"PI" -Probably Increasing -- -- -- 0 0 0 0 0 0 0 0
"D" - Decreasing -- -- -- 0 0 0 0 1 1 1 2
"PD" -Probably Decreasing -- -- -- 0 0 0 0 0 2 1 0
Total Locations Tested 0 0 0 22 13 14 16 16 15 16 15
Notes
-- ND (non-detect) was not a category designation prior to the 2011 statistics
Locations Tested
Page 17 of 21

Table 16
Summary of Increasing Trends for Chemicals of Potential Concern – Second Quarter 2016
Analyte:
Q2 - 2016
Results TrendQ2 - 2016
Results TrendQ2 - 2016
Results TrendQ2 - 2016
Results Trend
Well Location (µg/L) (µg/L/yr) (%/yr) (µg/L) (µg/L/yr) (%/yr) (µg/L) (µg/L/yr) (%/yr) (µg/L)
TT-MW2-1 6,850 Increasing 384 4.93 - Not analyzed - Not analyzed - - - Not analyzed
TT-MW2-17S 676 Decreasing -265 -5.29 0.590 Jq Increasing 0.03 8.94 - Not analyzed - - - Not analyzed
TT-MW2-17D 26,100 Stable 6.92 Increasing 0.38 13.1 - Not analyzed - - - Not analyzed
TT-MW2-29B 1.02 Probably Increasing 0.06 13.0 - Not analyzed - - - Not analyzed - - - Not analyzed
TT-MW2-30B 5,000 Increasing 913 18.3 - Not analyzed - - - Not analyzed - - - Not analyzed
TT-MW2-33A 1.33 Jf Increasing 0.08 14.8 - Not analyzed - - - Not analyzed - - - Not analyzed
TT-MW2-34A 5.41 Increasing 1.53 27 - Not analyzed - - - Not analyzed - - - Not analyzed
TT-MW2-40A 1.24 Probably Increasing 1.23 29 <0.500 Non Detect - Not analyzed - - - Not analyzed
TT-MW2-4S 0.54 Increasing 0.03 4.93 - Not analyzed - - - Not analyzed - - - Not analyzed
Former Waste Discharge Area
TT-MW2-21 2.52 Increasing 2.41 22 4.76 Increasing 0.45 15.0 <0.250 Non Detect - Not analyzed
TT-MW2-22 0.345 Jq No Trend 424 Increasing 26 7.30 78.6 Increasing 5.26 8.21 - Not analyzed
TT-MW2-37A 9,380 Increasing 2,738 27 5.85 Increasing 0.64 20 22.4 Increasing 1.48 9.86 - Not analyzed
TT-MW2-37B 0.92 Increasing 10.6 18.3 <0.500 Non Detect 0.670 Jq No Trend - Not analyzed
TT-MW2-9S 7,710 Increasing 1,967 26 0.870 Jq Increasing 0.16 15.7 19.5 Increasing 1.31 8.76 - Not analyzed
TT-MW2-27 174 Increasing 41 13.3 <0.500 Non Detect 0.950 Jq No Trend - Not analyzed
TT-MW2-42A 0.255 Jq Probably Increasing 0.02 9.86 - Not analyzed - - <0.250 Non Detect - Not analyzed
MCL / DWNL 6.0 5.0 1 (1) 0.3 (1)
Notes
Shading indicates locations where the magnitude of the increasing or probably increasing trend represents greater than a 20 percent change.
%/yr - Percent change per year with respect to the sample mean
µg/L/yr - Micrograms per liter per year
µg/L - Micrograms per liter
MCL - State Water Resources Control Board Division of Drinking Water maximum contaminant level
DWNL - State Water Resources Control Board Division of Drinking Water drinking water notification level
(1) - DWNL
Bold - MDL or DWNL exceeded
"-" - Not analyzed
< # - Method detection limit concentration is shown
RDX - Hexahydro-1,3,5-trinitro-1,3,5-triazine
J -
q -
The analyte was positively identified, but the concentration is an estimated value
The analyte detection was below the Practical Quantitation Limit (PQL)
Lower Canyon (Downgradient and Crossgradient of the Former Waste Discharge Area)
Area K
Perchlorate Trichloroethene 1,4-Dioxane RDX
Magnitude Magnitude Magnitude
Area L
Page 18 of 21

Table 17
Current Sampling Frequencies by Well Classification
Well Classification Approved Sampling FrequencyHorizontal Extent Wells AnnualVertical Distribution Wells AnnualIncreasing Contaminant Trend Wells SemiannualBackground Wells BiennialRemedial Monitoring Wells Vary, based on remedial action proposedGuard Wells SemiannualNew Wells 4 quarters then reclassifyRedundant Wells Suspend (no sampling)
Page 19 of 21

Table 18
2017 Water Quality Monitoring Locations and Sampling Frequency
1Q 2Q 3Q 4Q 1Q 2Q 3Q 4Q Bi 1Q 2Q 3Q 4Q 1Q 2Q 3Q 4Q
WS-1 - - ● ●
WS-2 - - ● ●
WS-3 - - ● ●
SW-01 - - ●
SW-02 - - ●
SW-03 - - ●
SW-04 - - ●
SW-05 - - ●
SW-06 - - ●
SW-07 - - ●
PPW1 - - ● ● ●
PPW2 - - ● ● ●
PPW3 - - ● ● ●
PPW4 - - ● ● ●
PPW5 - - ● ● ●
PPW6 - - ● ● ●
PPW7 - - ● ● ●
PPW8 - - ● ● ●
TT-MW2-1 H H ●
TT-MW2-4S H H ●
TT-MW2-5 H H ● ● ● ●
TT-MW2-6S H H ● ● ● ●
TT-MW2-6D V V ● ●
TT-MW2-7 H H ● ● ●
TT-MW2-7D V V ●
TT-MW2-8 H H ● ● ●
TT-MW2-9S H/I H ● ● ● ● ● ●
TT-MW2-9D V V ● ●
TT-MW2-10 H H ●
TT-MW2-11 H H ● ●
TT-MW2-12 H H ●
TT-MW2-13 H H ● ●
TT-MW2-14 H H ● ●
TT-MW2-16 B B ●
TT-MW2-17S H H ● ●
TT-MW2-17D V V ● ●
TT-MW2-18 V V ●
TT-MW-19S H H ●
TT-MW-19D V V ●
TT-MW-20S G G ● ●
TT-MW2-21 H/I H/I ● ● ● ● ●
TT-MW2-22 H H ● ● ●
TT-MW2-23 R R
TT-MW2-24 H H ● ● ● ● ●
TT-MW2-25 H H ● ● ●
TT-MW2-26 H H ● ● ●
TT-MW2-27 H/I H ● ● ●
TT-MW2-28 H H ●
TT-MW2-29A B B ●
TT-MW2-29B B B ●
TT-MW2-29C B B ●
TT-MW2-30A V V ● ●
TT-MW2-30B V/I V ●
TT-MW2-30C V V ●
TT-MW2-31A V V ●
TT-MW2-32 V V ● ●
TT-MW2-33A H/I H ●
TT-MW2-34A H/I H/I ● ●
TT-MW2-35A V V ●
TT-MW2-36A H H ●
TT-MW2-37A H/I H/I ● ● ● ● ● ●
Monitoring Well 2017 Well
Classification
VOCs
(SW8260B or E524.2)
Perchlorate
(E331.0, E332.0, or SW6850)
1,4-Dioxane
(SW8270C SIM)
RDX
(SW8330A)2016 Well
Classification
Proposed 1st Quarter 2017 to 4th Quarter 2017 Monitoring Program
Surface Water Locations
Storm Water Locations
Private Production Wells and Springs
Monitoring Wells
Page 20 of 21

Table 18
2017 Water Quality Monitoring Locations and Sampling Frequency
1Q 2Q 3Q 4Q 1Q 2Q 3Q 4Q Bi 1Q 2Q 3Q 4Q 1Q 2Q 3Q 4Q
Monitoring Well 2017 Well
Classification
VOCs
(SW8260B or E524.2)
Perchlorate
(E331.0, E332.0, or SW6850)
1,4-Dioxane
(SW8270C SIM)
RDX
(SW8330A)2016 Well
Classification
Proposed 1st Quarter 2017 to 4th Quarter 2017 Monitoring Program
Surface Water LocationsTT-MW2-37B V/I V ● ● ●
TT-MW2-38A H H ●
TT-MW2-38B V V ●
TT-MW2-39 H H ●
TT-MW2-40A H/I H/I ● ● ●
TT-MW2-40B V V ● ●
TT-MW2-41A H H ● ●
TT-MW2-42A G G ● ● ●
TT-MW2-44 H H ●
TT-MW2-2 R R
TT-MW2-3 R R
TT-MW2-4D R R
TT-MW-20D R R
TT-MW2-31B R R
TT-MW2-33B R R
TT-MW2-33C R R
TT-MW2-34B R R
TT-MW2-34C R R
TT-MW2-35B R R
TT-MW2-36B R R
TT-MW2-36C R R
TT-MW2-40C R R
TT-MW2-43 R R
TT-MW2-41B - -
TT-MW2-42B - -
TT-PZ2-1 - -
TT-PZ2-2 - -
TT-PZ2-3 - -
TT-PZ2-4 - -
TT-EW2-1 - -
TT-EW2-2 - -
TT-EW2-3 - -
TT-EW2-4 - -
8 19 0 3 15 50 0 10 4 8 17 0 7 0 2 0 0
Notes
●: Proposed analysis
Highlighting indicates change in sampling frequency
EPA - United States Environmental Protection Agency
VOCs: Volatile organic compounds
RDX: Hexahydro-1,3,5-trinitro-1,3,5-triazine
Bi: Biennial (sampled in even numbered years)
B: Background well
G: Guard well
H: Horizontal extent well
I: Increasing contaminant trend well
R: Redundant well
V: Vertical distribution well
Extraction Wells (Not Sampled)
Totals -30 79 32 2
-
Piezometers (Not Sampled)
Monitoring Wells (Not Sampled)
Page 21 of 21
Tetra Tech Laborde Canyon Semiannual Groundwater Monitoring ReportSecond Quarter 2016 and Third Quarter 2016
APPENDICES(PROVIDED ON CD)