lend lease investor day presentations for personal …2015/10/15 · lend lease investor day 2015 7...
TRANSCRIPT

15 October 2015
Lend Lease Corporation Limited ABN 32 000 226 228 andLend Lease Responsible Entity Limited ABN 72 122 883 185 AFS Licence 308983as responsible entity for Lend Lease Trust ABN 39 944 184 773 ARSN 128 052 595
Level 4, 30 The Bond Telephone +61 2 9236 611130 Hickson Road, Millers Point Facsimile +61 2 9252 2192NSW 2000 Australia lendlease.com
Lend Lease Investor Day presentations
15 October 2015
Attached are the presentations to be given today by Lend Lease senior executives at its Investor Day. Theevent will be webcast live via www.lendlease.com
ENDS
FOR FURTHER INFORMATION, PLEASE CONTACT:
Investors: Media:Suzanne Evans Nadeena WhitbyTel: 02 9236 6464 Tel: 02 9236 6865Mob: 0407 165 254 Mob: 0467 773 032
For
per
sona
l use
onl
y

Lend Lease
2015 Investor Day 15 October 2015 F
or p
erso
nal u
se o
nly

2
Agenda
Illustration: The International Quarter, Stratford, UK
09:00 – 09:45 Steve McCann - Group Chief Executive Officer
and Managing Director
Strategy update
09:45 – 10:45 Dan Labbad - CEO, International Operations
International growth
Q&A
10:45 – 11:15 Morning tea break
11:15 – 12:30 Bob McNamara - Group Chief Risk Officer
Vikas Kaul - Group Head of Research
Tony Lombardo - Group Chief Financial Officer
Risk management and capital allocation
Q&A
12:30 – 12:45 Steve McCann - Group Chief Executive Officer
and Managing Director
Closing
Final Q&A
12:45 – 14:00 Lunch
For
per
sona
l use
onl
y

3
1 Strategy update
2 International growth
3 Risk management and capital
allocation
4 Closing and final Q&A
5 Appendices
Image: International Towers Sydney (ITS) - Tower 2 Lobby
For
per
sona
l use
onl
y

4 LEND LEASE INVESTOR DAY 2015
Lend Lease’s vision for Reconciliation is one in which all our employees
acknowledge and celebrate the proud heritage of Australia’s First Peoples and
promote opportunities for career development, sustainable business growth,
and economic participation of Aboriginal and Torres Strait Islander Australians
within our sector
Indigenous engagement and reconciliation
For
per
sona
l use
onl
y
Section 1
Strategy update
Steve McCann
Group Chief Executive Officer and
Managing Director
Illustration: 888 Collins Street, Victoria
Harbour, Melbourne
For
per
sona
l use
onl
y

6 LEND LEASE INVESTOR DAY 2015
Safety
Sustainability
Diversity &
inclusion
Customer
focus
DNA
Our strategic pathway
Urban
regeneration
Ageing
population
Trends
Sustainability
Funds
growth
Infrastructure
Technology
Integrated
model
Development
Construction
Investment
Management
For
per
sona
l use
onl
y

7 LEND LEASE INVESTOR DAY 2015
$(669)m to $493m Profit after tax
Geographies
Development
Pipeline
Circa 40 countries
$25.6b1
Construction
Backlog $12.3b1
Funds Under
Management (FUM) $9.9b1
$501m to $549m
12 countries
$37.4b2
$16.2b2
$15.0b2
Restore (2009 – 2011)
Key Metrics
LTIFR 3.1 to 2.9 Safety LTIFR 2.7 to 2.3
Restructuring and
cost out Focus
Reshaping and
growing the portfolio
$619m
Major gateway cities
$44.9b3
$17.3b3
$21.3b3
LTIFR 2.2
Leading positions and a
leading safety culture
Build (2012 – 2013)
Lead 2015+
Following successful execution of our 5 year ‘Restore Build Lead’
strategy we have moved to a new framework ‘Focus & Grow’
1 As at 30 June 2009; 2 As at 30 June 2013; 3 As at 30 June 2015
For
per
sona
l use
onl
y

8
Focus
LEND LEASE INVESTOR DAY 2015
Strong platform established to deliver earnings visibility
Development1
$44.9b pipeline
Investment Management1
$21.3b FUM
Construction1
$17.3b backlog
1 As at 30 June 2015
For
per
sona
l use
onl
y

9
Focus - Development
LEND LEASE INVESTOR DAY 2015
2011 2015
Pipeline
Development end value $34.7b $44.9b
Residential pre-sales and
commercial forward sales
Apartments $0.4b $4.7b1
Communities $0.3b $0.5b1
Commercial2 $0.5b ~$4.5b
2011 2016
Delivery completions
Apartments (# settlements) 227 1,000+
Communities (# settlements) 2,299 3,500+
Commercial - ~$2.5b3
Currently in the execution phase and well positioned to complete safely and on time
in order to deliver profit
• Strong growth in development pipeline to
support future revenue growth
• Established pipeline allows selective approach
to future origination
1 Includes 100% of revenue from joint venture projects. Joint venture partner share of
revenue is ~$150 million for Apartments and ~$30 million for Communities
• Residential pre-sales book of $5.2 billion1 to
settle over the next 3-4 years
• Provides strong earnings and cash visibility over
the medium term
• Focus on production in recent years resulting in
increased projects in delivery
• Increased completions from FY16 and beyond
to drive growth in profit and cash
2 Represents total forward sale value of commercial buildings 3 Represents total forward sale value of commercial buildings
expected to complete in FY16
For
per
sona
l use
onl
y

10
FY11 FY13 FY15
Owned & Managed Managed
Focus - Retirement Living
LEND LEASE INVESTOR DAY 2015
Valuation metrics1
Growth in units owned & managed
12,408
14,193 • Growth through acquisition with a focus on building
quality and diversity of the portfolio
• Lend Lease is the largest owner and operator of
retirement villages in Australia
• Opportunity to leverage platform capability offshore
• Consistent valuation approach
• Improving valuation outlook with increased institutional
demand in the sector
• Capital partner opportunities to be explored over the
medium term
14,000+ units owned and managed with ~1,000+ units settled per year
12,417
managed
Capital invested $1.7 billion
Weighted average
discount rate 13.3%
Weighted average
future growth rate 3.7%
Average length of
stay 11 years2
1 As at 30 June 2015 2 Independent Living Units
For
per
sona
l use
onl
y

11
Focus - Construction
LEND LEASE INVESTOR DAY 2015
Preferred bidder on ~$7 billion of new work not recorded in backlog revenue
FY15 backlog realisation
Growth in revenue backlog FY15 backlog by business and client
We continue to drive performance and reduce volatility
$9.0b
$4.3b $4.0b
FY16 FY17 Post FY17
52%
25% 23%
Building, 79%
Engineering, 14%
Services, 7%
$15.3b
$16.2b
$17.3b
FY11 FY13 FY15
Internal, 11%
External, 74%
PPP, 15%
By
business
By
client
For
per
sona
l use
onl
y

12
FY11 FY13 FY15
Focus - Investment Management
LEND LEASE INVESTOR DAY 2015
• Strong growth in FUM supported by global investor
demand for quality assets - $3 billion2 of future embedded
FUM growth
• Investment Management platform supports capital
solutions needs across broader business - match right
type of capital to risk-return profile
• Fee and co-investment income delivers attractive annuity
earnings and return on capital enhancement
Delivering recurring earnings and supporting capital solutions
FUM by geography1
Growth in FUM
$15.0b
$21.3b
$10.9b
CAGR of 18%
17 wholesale funds &
mandates
Leader in responsible
property investment
(GRESB)3
$1.4b Lend Lease
co-investment capital
~$10b4 new equity
raised since 2009
1 As at 30 June 2015
2 Represents expected future FUM increase from funds with development projects in delivery
Asia, 25%
Europe, 10%
Australia, 65%
3 Global Real Estate Sustainability Benchmark survey 2015 4 Includes equity raised under dividend reinvestment plans
For
per
sona
l use
onl
y

13
The environment and what it means for Lend Lease
LEND LEASE INVESTOR DAY 2015
Lend Lease competitive advantage Trend Issue
Economic growth led by gateway cities
• Key support for urban regeneration strategy
• Points to structural shift in residential demand towards apartments
• Clear link to infrastructure outlook - underpinning need for major projects
• Gateway cities are now the epicentre for economic growth with density increasing
• Trend in Australia plus other key markets
Pick-up in local public
infrastructure spending
• Strong existing pipeline of projects across the east coast in Australia
• Series of large complex projects to drive growth outlook in construction
• Infrastructure pick-up to replace any potential slowing in other parts of the
economy
• A growing pipeline of road and likely rail projects
• Projects driven by population and productivity
Impetus in Australian residential
market easing
• Record residential pre-sales of $5.2 billion1 underpinning cash flow over the
next few years - ~45 per cent are due to settle before June 2017
• 20 per cent of the apartment pre-sales represent buyers from mainland
China, of which ~30 per cent are due to settle before June 2017
• Forward sale of over $550 million of residential pre-sales book through
PLLACes2 program
• Urban regeneration sites form the majority of our portfolio and provide
delivery flexibility to match market timing
• Strong balance sheet position and capital management
• Led by macro-prudential policy changes and potential slowing China demand
• As activity slows, leads to questions over next generation of local economic growth drivers
Strong demand for core
property assets
• Strong track record of selling assets at cyclical peaks
• Opportunity to sell existing asset positions at attractive pricing
• Percentage of ownership assets on balance sheet exposed to cyclical
downturn is low relative to peers
• Prime assets continue to attract significant interest globally
• Local and offshore buyers
• Tight cap rates
Relative under-performance of
Australian economy vs
offshore
• Established platform and track record in key global markets
• Gateway cities in key markets, including Australia, to continue to benefit
from safe haven flows
• Highlights benefit of diversification across key global markets
• Resurgence of major global economies following a period of relative under-performance
• Local economy outlook remains robust but more cautious
1 Includes 100% of revenue from joint venture projects. Joint venture partner share of revenue is ~$180 million 2 Pre-sold Lend Lease Apartment Cash flows
For
per
sona
l use
onl
y

14
Leading portfolio of major urbanisation projects across multiple geographies
LEND LEASE INVESTOR DAY 2015
Barangaroo South, Sydney
Darling Harbour Live, Sydney
Victoria Harbour, Melbourne
Melbourne Quarter, Melbourne
Brisbane Showgrounds,
Brisbane
Waterbank, Perth
Tun Razak Exchange, Kuala
Lumpur
Paya Lebar Central, Singapore
Elephant & Castle, London
The Wharves, Deptford,
London
The International Quarter,
London
River South,
Chicago
Our operations are centred
around four regions.
AUSTRALIA
ASIA
AMERICAS
EUROPE
Portfolio of 12 major urban regeneration projects delivering a ~10 year pipeline across resilient gateway cities
For
per
sona
l use
onl
y
15
~45%
Urbanisation
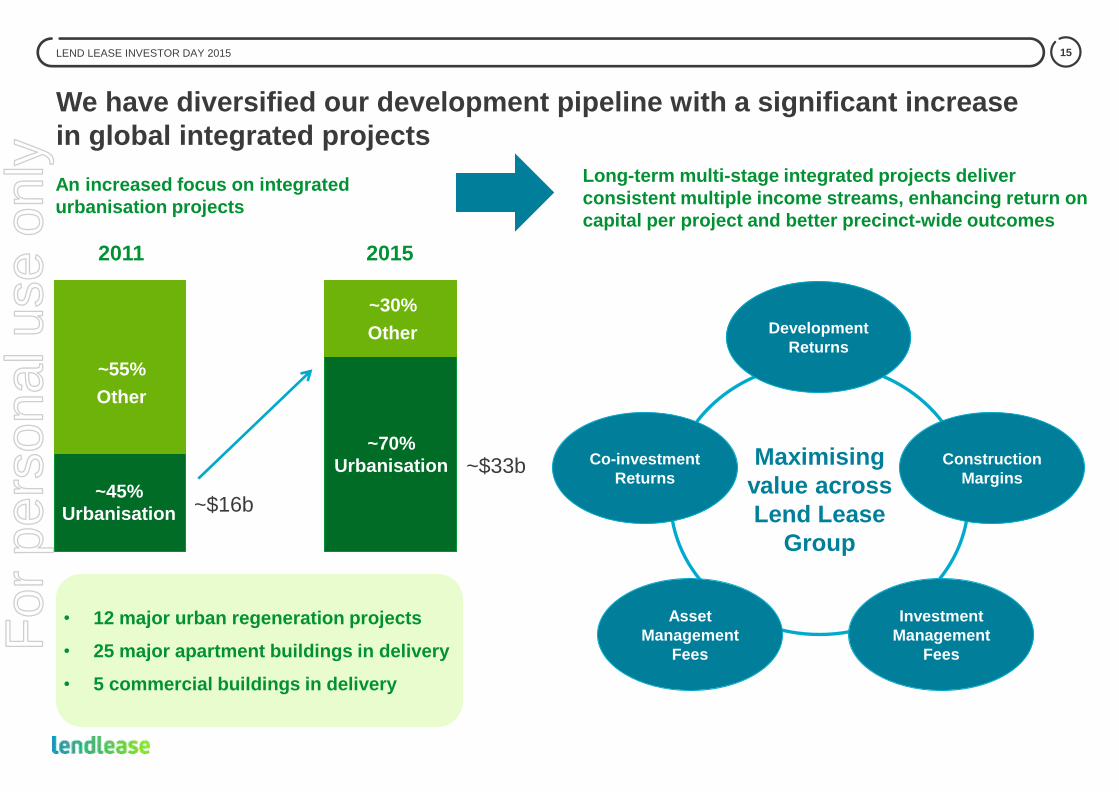
We have diversified our development pipeline with a significant increase
in global integrated projects
LEND LEASE INVESTOR DAY 2015
• 12 major urban regeneration projects
• 25 major apartment buildings in delivery
• 5 commercial buildings in delivery
~55%
Other
~70%
Urbanisation
~30%
Other
2011 2015
An increased focus on integrated
urbanisation projects
Long-term multi-stage integrated projects deliver
consistent multiple income streams, enhancing return on
capital per project and better precinct-wide outcomes
~$16b
~$33b Maximising
value across
Lend Lease
Group
Development
Returns
Construction
Margins
Investment
Management
Fees
Asset
Management
Fees
Co-investment
Returns
For
per
sona
l use
onl
y

16
Sustainability
innovation
The success of our urbanisation strategy is driven by 4 key factors
LEND LEASE INVESTOR DAY 2015
Access to
capital
• Deep and trusted global investor relationships
• Strong demand from global capital seeking quality assets in global
gateway cities in which Lend Lease has a presence
• Increasing prominence of investors with build to core strategies
Lend Lease competitive advantage Factor
Capability
• Established team with global track record of securing and delivering
strong economic outcomes on large scale mixed-use projects
• Strong focus from management on strategic workforce planning and
process systemisation to ensure pipeline matched with required
capability
Customer
focus
• Established track record strongly positions Lend Lease with
governments and related agencies
• Local know-how and ability to leverage global best practice enables
delivery of world class solutions for all stakeholders
• Market leader in sustainability innovation delivering a number of green
and energy infrastructure building firsts
• Green building certification mandated on all projects
Why is it important?
Accelerates speed to
market and profit
realisation
Opportunities are large
scale and complex.
Master-plan capability
is key
Large number of
stakeholder interests
to be managed and
balanced
Sustainability a key
element of success on
urbanisation projects
For
per
sona
l use
onl
y

17 LEND LEASE INVESTOR DAY 2015
Barangaroo
Concrete Apron Created in 1970s to accommodate
bulk offloading for shipping containers
Closed in 2003, renamed Barangaroo in 2006 and
Lend Lease selected as master developer in 2009 Image: Barangaroo pre-development
For
per
sona
l use
onl
y

18 LEND LEASE INVESTOR DAY 2015
490,000 sqm Gross Floor Area
7.7 Hectares
Mixed Use Development
Up to 90 new retail outlets
New headland
park and
recreated
foreshore with
6,600 sandstone blocks
Australia’s first large scale
Carbon Neutral community
Artist’s impression of Barangaroo Mod 8
Barangaroo
For
per
sona
l use
onl
y

19
Beyond urbanisation, we are also progressing broader business growth
opportunities in line with our capabilities and market trends
LEND LEASE INVESTOR DAY 2015
Healthcare
Communities
Offsite
manufacturing
Telecoms
• Significant track record in delivery of public sector healthcare. Opportunity to leverage
experience into growing private sector pipeline
• Australia pursuing integrated opportunities
• Looking to bring Communities into the integrated model, utilising our existing civil works
capabilities - first pilot is currently being rolled out (Springfield Lakes - Queensland,
Australia)
• Opportunity to expand integrated model into telco tower sector
• Potential to leverage strong Japan delivery track record into the US
• Safer, faster, and ultimately cheaper construction methodology
• Innovative manufacturing and assembly plant currently being established in Australia
which can produce wall and floor components as well as full modular rooms
For
per
sona
l use
onl
y

20
Established platform provides strong growth trajectory and earnings visibility
LEND LEASE INVESTOR DAY 2015
Development Investment Management Construction
Forte, Melbourne
• $5.2 billion1 of pre-sold
residential revenue to be
delivered over the next 3-4
years
• $17.3 billion construction
backlog underpinned by
internal workbook with
strong pipeline
• $21.3 billion FUM to deliver
annuity earnings with
significant embedded
growth
• Integrated urbanisation project pipeline to drive multiple earnings streams and enhance
return on capital - record development pipeline of ~$45 billion
• Selectively look to grow urbanisation pipeline with offshore focus and other broader
business opportunities
Setia City Mall, Malaysia Regents Place, London
1 Includes 100% of revenue from joint venture projects. Joint venture partner share of revenue is ~$180 million
For
per
sona
l use
onl
y

Section 2
International growth
Dan Labbad
Chief Executive Officer, International Operations
Illustration: River South, Chicago
For
per
sona
l use
onl
y

22
Europe
Asia
Americas
Singapore
Kuala Lumpur
Shanghai
Tokyo Beijing
London
Milan Boston
New York
Chicago
Nashville
Mexico City
Los Angeles
San Francisco
Our international development pipeline has continued to expand, with
~$8 billion of new major urban regeneration projects in 2015
LEND LEASE INVESTOR DAY 2015
• Leading construction business with
record $5.5 billion backlog
• Secured first development projects
underpinning $2.8 billion pipeline
• Military housing portfolio of ~54,000
units under management delivering
stable annuity earnings stream
• Established development platform
with $9.4 billion pipeline
• Strong focus on execution and
delivery with $1.3 billion pre-sold
residential revenue and 2
commercial towers in delivery
• Recovery in construction position
with $1.5 billion backlog
• Recent origination focus following
completion of Jem, Singapore in
2013 - $5.8 billion development
pipeline secured in 2015
• Construction business focused on
delivery of internal pipeline
• Strong investment management
platform with $5.3 billion of FUM
All figures are as at 30 June 2015 unless otherwise stated
For
per
sona
l use
onl
y

23
Urbanisation to underpin our global growth strategy
LEND LEASE INVESTOR DAY 2015
GROWTH
Urban population in 2014
accounted for
54% of the global population1
UP 34%
SINCE 1960
Since 1990 ten mega-cities
have now grown to
28 globally, housing
453 million people2
MEGA CITIES
ARE EXPECTED
TO GROW TO 41
BY 2030
OPPORTUNITY
Lend Lease is a world
leader with
12 projects under development.
Total pipeline of ~$33 billion
MAJOR URBAN
REGENERATION
Continuing population growth and
urbanisation are projected to add
2.5 people to the world’s urban population by
20501
BILLION
1 World Health Organisation 2014 2 UN Department of Economic and Social Affairs; mega-cities house more than 10 million inhabitants - July 2014
For
per
sona
l use
onl
y

24 LEND LEASE INVESTOR DAY 2015
Increased offshore presence in urban regeneration
Image: Trafalgar Place, Elephant & Castle
Illustration: Transport for London Building, The International Quarter Illustration: River South, Chicago
Illustration: Paya Lebar Central, Singapore
For
per
sona
l use
onl
y

25 LEND LEASE INVESTOR DAY 2015
Elephant & Castle - project overview
• In partnership with the London Borough of
Southwark (LBS), a £2.0 billion
regeneration program on 28 acres of land
across 3 sites (Elephant Park, Trafalgar
Place, and One The Elephant) in the centre
of Elephant & Castle, Central London
• By 2025 we will deliver:
− ~3,000 new homes
− Over 50 new shops and restaurants
− Over £30 million in transport
improvements
− More than 6,000 jobs
− Over 11 acres of public realm, with 10
new routes through the development
to enhance pedestrian and cyclist
safety
Illustration: Aerial Elephant & Castle master-plan
For
per
sona
l use
onl
y
26 LEND LEASE INVESTOR DAY 2015
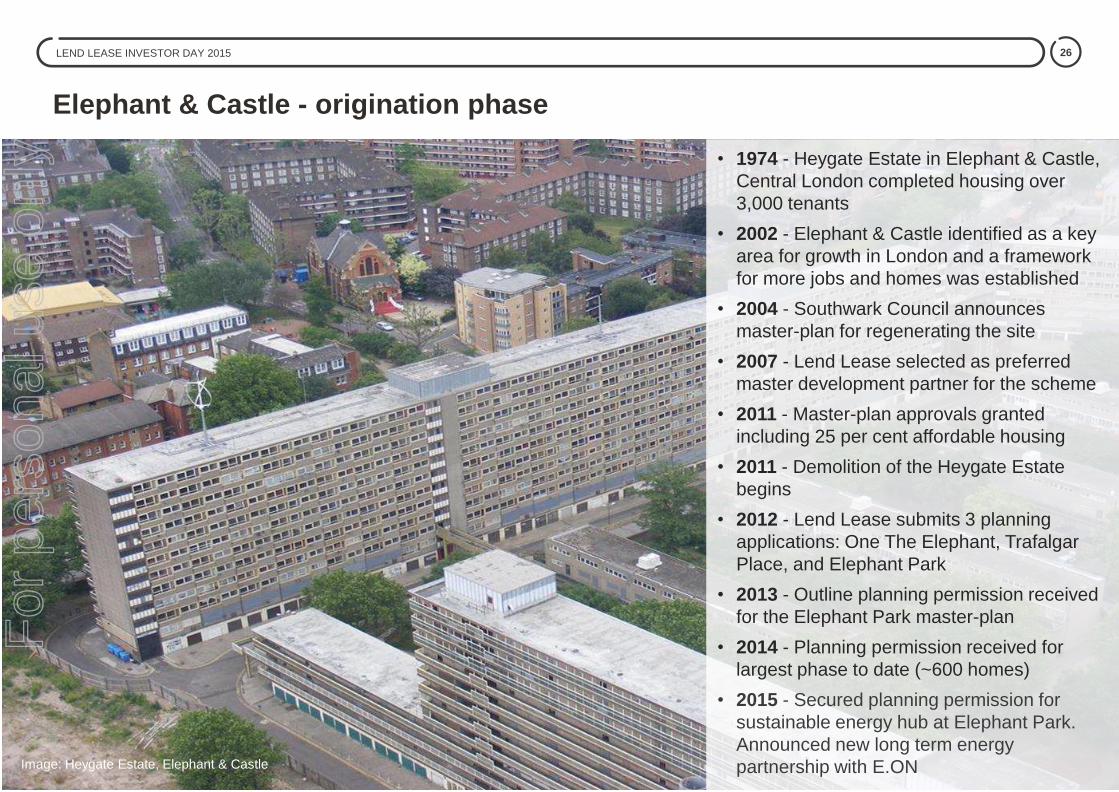
Elephant & Castle - origination phase
• 1974 - Heygate Estate in Elephant & Castle,
Central London completed housing over
3,000 tenants
• 2002 - Elephant & Castle identified as a key
area for growth in London and a framework
for more jobs and homes was established
• 2004 - Southwark Council announces
master-plan for regenerating the site
• 2007 - Lend Lease selected as preferred
master development partner for the scheme
• 2011 - Master-plan approvals granted
including 25 per cent affordable housing
• 2011 - Demolition of the Heygate Estate
begins
• 2012 - Lend Lease submits 3 planning
applications: One The Elephant, Trafalgar
Place, and Elephant Park
• 2013 - Outline planning permission received
for the Elephant Park master-plan
• 2014 - Planning permission received for
largest phase to date (~600 homes)
• 2015 - Secured planning permission for
sustainable energy hub at Elephant Park.
Announced new long term energy
partnership with E.ON
Image: Heygate Estate, Elephant & Castle
For
per
sona
l use
onl
y

27 LEND LEASE INVESTOR DAY 2015
Elephant & Castle - key success factors
Origination
• Complex long-term scheme in a densely
populated part of Central London
• Multiple stakeholders with differing
objectives:
− Stakeholder support and coordination
key
• Successfully worked through planning
process despite numerous challenges and
complexities given the scale of the project:
− Example: The importance of retaining
existing trees across the old Heygate
Estate
• First apartments now delivered at Trafalgar
Place
• L&Q agreement for management of
affordable housing
• New and largest launch to date at West
Grove - comprising nearly 600 apartments
Illustration: West Grove, Elephant Park, Elephant & Castle
For
per
sona
l use
onl
y

28 LEND LEASE INVESTOR DAY 2015
The International Quarter - project overview
• Central pillar in the post Games
regeneration of East London, located at the
gateway to the Queen Elizabeth Olympic
Park in Stratford
• The project comprises 4 million square feet
of Grade A office, providing a new
commercial element to the area’s role as
an important sporting, retail, cultural, and
academic destination
• Outline planning consent for the
development is in place and construction
has begun on the first 780,000 square feet
of commercial space
• Construction of the residential component -
Glasshouse Gardens - is well underway
• Over 1,200 jobs will be created on site by
2016
Illustration: Master-plan view of The International Quarter
For
per
sona
l use
onl
y

29 LEND LEASE INVESTOR DAY 2015
The International Quarter - origination phase
• Strong relationship formed with the
Olympic Delivery Authority and London
and Continental Railways during the
successful delivery of the Athletes Village
• Established a joint venture with London
and Continental Railways in 2011 to deliver
the project
• Following the 2012 Olympic and
Paralympic Games, the site was handed
over to the joint venture partners (March
2013)
• A program of interim use of the site was
introduced during the planning phase to
activate the local area and encourage local
people back to the site
• We also formed a range of high profile
partnerships which attracted over 100,000
people to the project
Illustration: The International Quarter
For
per
sona
l use
onl
y
30 LEND LEASE INVESTOR DAY 2015
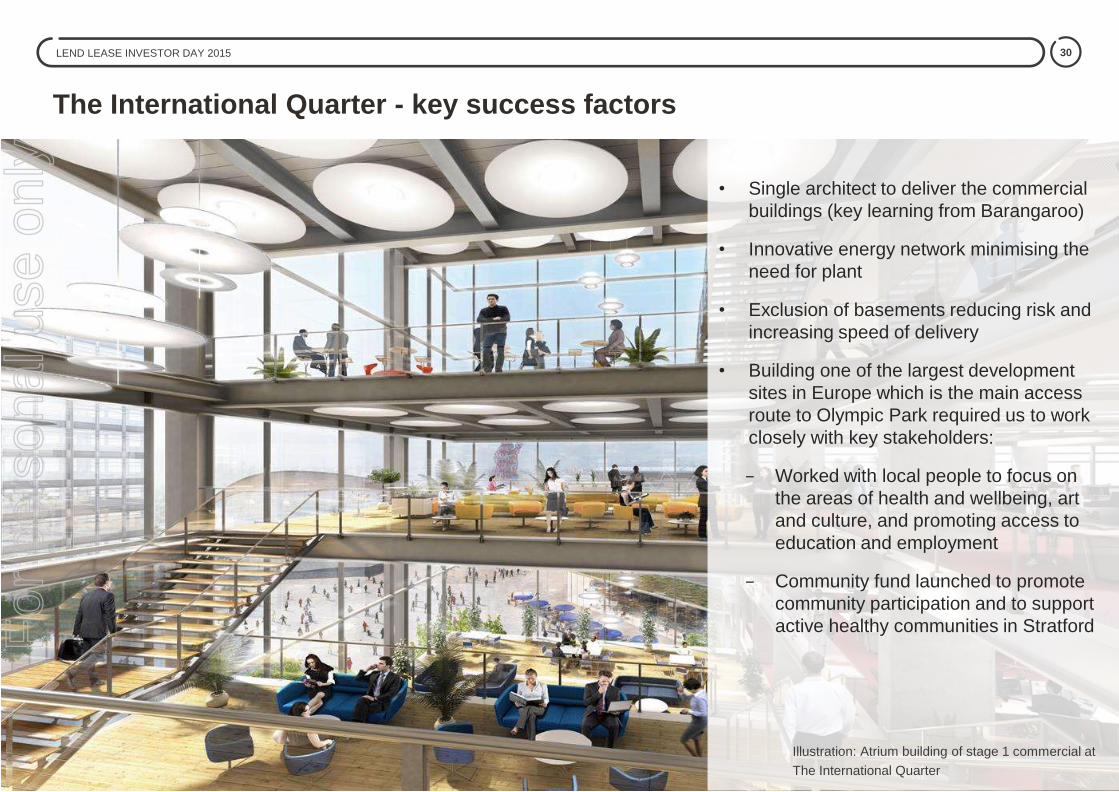
The International Quarter - key success factors
• Single architect to deliver the commercial
buildings (key learning from Barangaroo)
• Innovative energy network minimising the
need for plant
• Exclusion of basements reducing risk and
increasing speed of delivery
• Building one of the largest development
sites in Europe which is the main access
route to Olympic Park required us to work
closely with key stakeholders:
− Worked with local people to focus on
the areas of health and wellbeing, art
and culture, and promoting access to
education and employment
− Community fund launched to promote
community participation and to support
active healthy communities in Stratford
Illustration: Atrium building of stage 1 commercial at
The International Quarter
For
per
sona
l use
onl
y

31
-0.65
-0.45
-0.25
-0.05
0.15
0.35
0.55
0.75
0.95
Lo
ndo
n
Ne
w Y
ork
Beiji
ng
Shan
gha
i
Tokyo
Paris
Ho
ng K
on
g
Sin
gapo
re LA
San F
ran
cis
co
Ho
usto
n
Toro
nto
Me
lbourn
e
Syd
ney
Seou
l
Bosto
n
Rio
de J
ane
iro
Vancou
ve
r
Kuala
Lum
pur
Brisban
e
Ch
icago
Ista
nbul
Berlin
Sto
ckh
olm
Fra
nkfu
rt a
m M
ain
Pert
h
Mu
nic
h
Ro
me
Ma
ncheste
r
Me
xic
o C
ity
Am
ste
rda
m
Ha
mbu
rg
São P
au
lo
Mila
n
Wars
aw
Osaka-K
obe
Lyon
Santiag
o
Metr
ic Z
-Sco
res
Demographic Factors Underlying demand drivers Unique FactorsProperty Factors Authority / Government Factors Final City Z-Score
LEND LEASE INVESTOR DAY 2015
Urban regeneration origination process
Each of these cities represent significant growth opportunities
Countries screened on:
• Scale of economy
• Political risk
• Civil liberties
• Scale of cities
Countries ranked on:
• Economic indicators
• Urban regeneration
indicators
• Operating environment
• Investor confidence
City shortlist created on:
• City population
• Lend Lease footprint
and capabilities
Cities ranked on:
• Demographic factors
• Demand drivers
• Unique factors
• Property factors
• Government factors
Cities then tiered for
in-depth market
review
City research outcomes Contribution to Final Z-scores by categories of metrics
Key: Potential target cities
Tier 1 Tier 2 Tier 3
Higher ranked cities
generally score more
positively in all
evaluation metric
classifications
Lower ranked cities
generally score
negatively in all
evaluation metric
classifications
Demand Drivers
For
per
sona
l use
onl
y

32 LEND LEASE INVESTOR DAY 2015
International origination
• Strong progress on expansion of US development
operations
• Delivering on commitment to invest ~$200 million -
$300 million of capital on new projects
• New development opportunities secured in the
Americas in targeted gateway cities including:
− River South, Chicago
− 281 Fifth Avenue, New York
− Clippership, Boston
• Combined projects - $2.8 billion maximum end
development value
• Two new urban regeneration opportunities secured in
Asia
• 60% JV stake in the TRX Lifestyle Quarter, Kuala
Lumpur ($2.8 billion end development value)
comprising a retail centre of ~1.35 million square
feet, 1,800 residential units across 6 residential
towers and a hotel of approximately 250 rooms
• 30% JV stake in Paya Lebar Central, Singapore
($3.0 billion end development value) comprising 3
office blocks (~870,000 square feet), a retail mall
(~320,000 square feet) and 3 residential towers
(up to 440 units) Illustration: TRX Lifestyle Quarter, Kuala Lumpur
Illustration: River South, Chicago All figures are as at 30 June 2015 unless otherwise stated
For
per
sona
l use
onl
y

33 LEND LEASE INVESTOR DAY 2015
Paya Lebar Central - project overview
• Government land sale site in Paya Lebar
Central released for tender in October
2014
• Lend Lease, in partnership with Abu
Dhabi Investment Authority (ADIA),
submitted the winning bid in March 2015
• Site earmarked by Singapore
Government to be developed as a key
commercial centre outside the city:
− Well connected to major roads and
public transport
− Commercial space comprising office,
retail, and residential, complemented
by public spaces
Illustration: Paya Lebar Central
For
per
sona
l use
onl
y

34 LEND LEASE INVESTOR DAY 2015
Paya Lebar Central - origination phase
• Significant capital requirements to bid
• Tight tender timeline
• Mixed development project comprising
165,000 square metres of GFA across
office, retail, and residential
• Complex site attributes and tender
conditions including canal widening,
MRT access, and limited access points
among other things
Illustration: Paya Lebar Central
For
per
sona
l use
onl
y

35 LEND LEASE INVESTOR DAY 2015
Paya Lebar Central - key success factors
• Experience in delivery of complex
developments
• Integrated model and in-house
construction capabilities meant design and
planning work could be undertaken pre bid
• Ability to provide capital solution
• Early engagement with key stakeholders
including potential capital partners, bid
consultants, and potential tenants
Illustration: Paya Lebar Central residential
For
per
sona
l use
onl
y

36
Growing and geographically diversified portfolio of urban regeneration projects
LEND LEASE INVESTOR DAY 2015
Australia, 45%
International, 55%
Australia, 77% International, 23%
$15.7b $32.8b
2011 2015
Proven track record Access to capital
Speed to market Diversified skillset
Urbanisation developments by region
Key principles
• Deep understanding of the markets we are operating in 1
• Core customer focus 2
• Safety remains our first priority 3
• Resources - right people in the right roles 4
• Systemised approach to ensure consistency 5
For
per
sona
l use
onl
y

37
Q&A International growth
For
per
sona
l use
onl
y

Section 3
Risk management and capital
allocation
Illustration: Paya Lebar Central, Singapore
Bob McNamara Group Chief Risk Officer
Tony Lombardo Group Chief Financial Officer
Vikas Kaul Group Head of Research F
or p
erso
nal u
se o
nly

39
Enterprise risk management framework
LEND LEASE INVESTOR DAY 2015
Identification
Growth
Returns
Focus Assessment
and
quantification
Response
and mitigation
Continued
learning and
improvement
Governance
committees
Key
objectives
• The Lend Lease Enterprise Risk Management
Framework identifies, evaluates, addresses,
monitors, quantifies, and reports material risks
to Lend Lease Management and the Risk
Management and Audit Committees
• 2014 - creation of a new Group Chief Risk
Officer role reporting directly to the Group
Chief Executive Officer incorporating Health &
Safety, Risk & Insurance, and the Centres of
Excellence
Target outcomes:
• Improved safety performance
• Material decrease in risk embedded in
operations
• Reduction in earnings volatility
• Preventative and pre-emptive management of
risk
For
per
sona
l use
onl
y

40
Core components of risk management
LEND LEASE INVESTOR DAY 2015
Development Construction Investment Management
• Disciplined approach to underwriting new work
• ‘Black flag’ process on unacceptable risk items - minimal process risk
• Early procurement to de-risk exposure to cost inflation
• Diversified mix of fee and risk based work
• Robust ‘Projects in Delivery’ governance framework
• Strong focus on maintaining best-in-class governance structure
• Independent representation across fund boards
• Related party transactions approved by investors
• Regular engagement and partnership approach with investors
• Diversified investor base
• Robust investment committee process
• Portfolio diversification and return hurdles
• Research led decision making
• Match right capital to risk-return profile
• Focus on disciplined execution F
or p
erso
nal u
se o
nly

41
Business specific risks and how we are addressing them
LEND LEASE INVESTOR DAY 2015
Apartment
settlement
risk
• Strong diversification across product location and buyer profile
• Projects predominately in gateway cities that offer higher levels of
resilience in downturns when compared to secondary locations
• Minimum deposit of 10 per cent across all product (up to 20 per cent)
• Low historical default profile of ~3 per cent on projects delivered over the
last 8 years
• Existing buyers benefiting from embedded price growth and favourable
foreign exchange movements for foreigners
• PLLACes1 program has de-risked over $550 million of pre-sales revenue
Lend Lease response Risk
Apartment
cost inflation
• Supply chain engagement prior to apartment sales and also leading up to
contract commitment before construction
• Internal construction capability providing greater insight to cost inflation
Delivery
execution
• Signification reduction in under-performing projects in delivery
• Consistent governance frameworks in place across all delivery
operations
Australian
engineering
performance
• Integration across Australian platform complete - focus now on growing
engineering backlog to match strong building position
• Success with Gateway Upgrade North project secured in Queensland and
well positioned in securing major projects in Melbourne and Adelaide
What we mean
$4.7 billion of pre-
sales to settle over
the next 3-4 years
Potential margin
impact from cost
inflation
Impact of under-
performing
projects
Weakness in
performance of
business unit
1 Pre-sold Lend Lease Apartment Cash flows
For
per
sona
l use
onl
y

42 LEND LEASE INVESTOR DAY 2015
History
Group Research: History and mandate
• Group Research function was established in April 2011 with a small team of 6 team members
• It was created to form forward looking views to enable informed decision-making
• It now covers every market and sector that Lend Lease operates in or intends to operate in
Mandate
Objective Independent Unbiased Rigorous
House views
For
per
sona
l use
onl
y

43 LEND LEASE INVESTOR DAY 2015
Research coverage
Australia
New Zealand
USA
Singapore
Malaysia
China
Japan
UK
Economics
Capital flows
Building construction
Infrastructure
Residential
Retail
Office
Industrial
Retirement
Healthcare
Level of coverage
Country level
Market / city level
Sub-market level
Consumer research
Catchment analysis
Asset specific
research
Optimum
outcome
Top down research
Bottom up research
New markets New sectors
Macro views across Lend Lease footprint markets and sectors
Markets Sectors
AU
S
AM
R
AS
IA
EU
R
EC
ON
C
ON
ST
P
RO
PE
RT
Y
MA
CR
O V
IEW
S
MIC
RO
VIE
WS
For
per
sona
l use
onl
y

44 LEND LEASE INVESTOR DAY 2015
Diverse team of 11 research professionals
Economics
Residential
Retail
Office
Industrial
Retirement
Healthcare
Infrastructure
Construction
Capital
Team profile by specialisation
0-5 Years
6-10 Years
11-15 Years
16-20 Years
Team profile by years of research experience
CFA Charter
CharteredAccountantCommerce
Economics
Engineering
Mathematics
MBA
Property Economics
Risk Management
Team profile by professional qualifications
Americas
Asia
Australia
Europe
Team profile by resident regional experience
With a cumulative 100 man-years of property and infrastructure research experience
For
per
sona
l use
onl
y
45
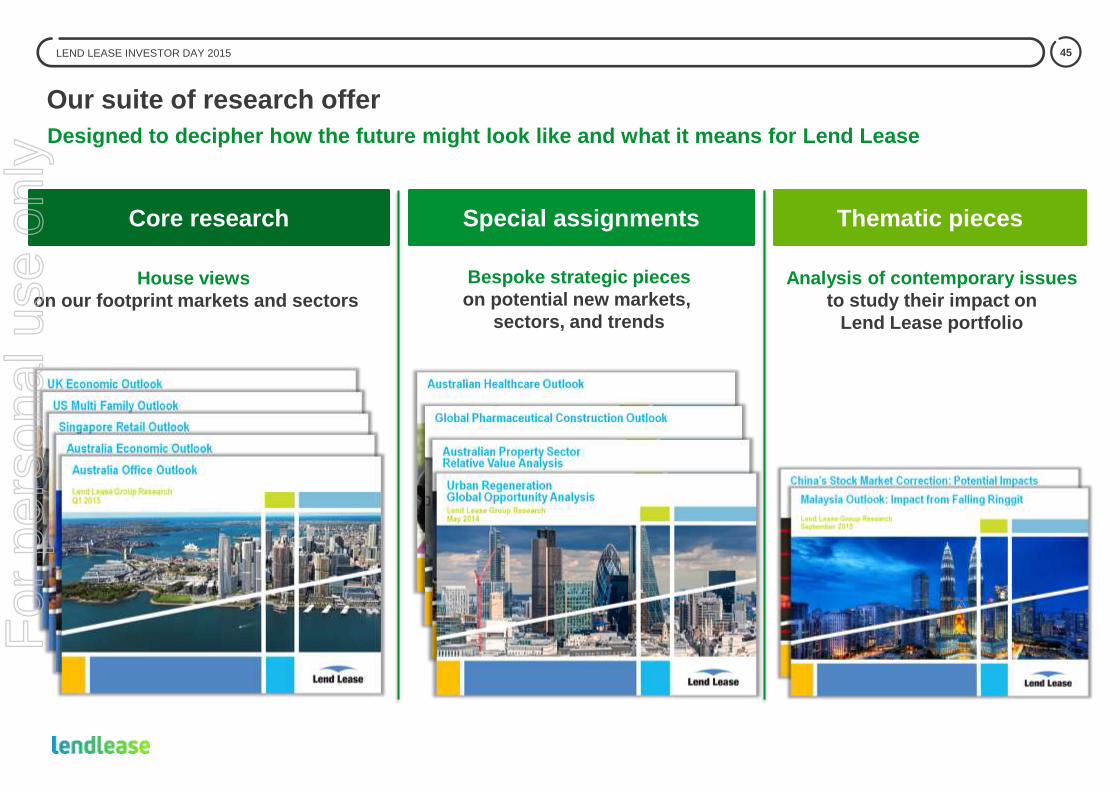
Our suite of research offer
LEND LEASE INVESTOR DAY 2015
Designed to decipher how the future might look like and what it means for Lend Lease
Core research Special assignments Thematic pieces
House views
on our footprint markets and sectors
Bespoke strategic pieces
on potential new markets,
sectors, and trends
Analysis of contemporary issues
to study their impact on
Lend Lease portfolio
For
per
sona
l use
onl
y
46 LEND LEASE INVESTOR DAY 2015
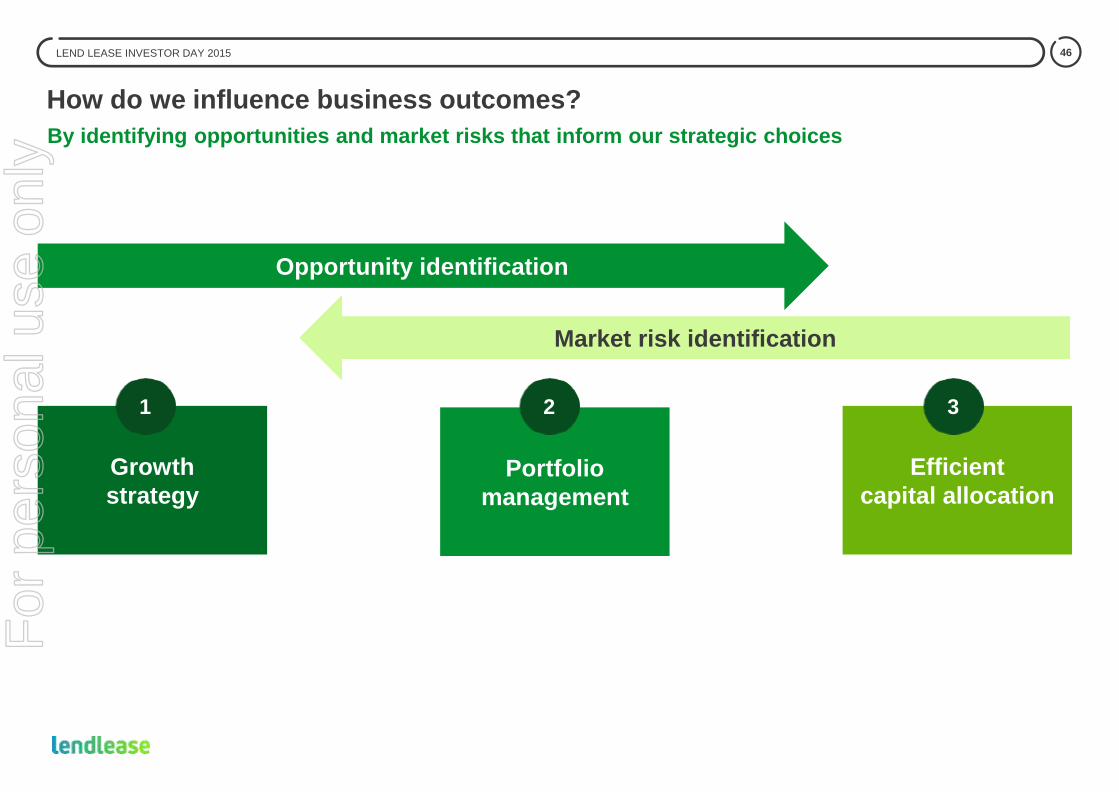
How do we influence business outcomes?
By identifying opportunities and market risks that inform our strategic choices
Growth
strategy Portfolio
management
Efficient
capital allocation
Opportunity identification
Market risk identification
1 2 3
For
per
sona
l use
onl
y

Australia Leading indicators - Economic growth
Co
ns
um
pti
on
Consumer sentiment Consumer confidence (neutral = 100) 102.4 100.2 94.9 99.4 95.7
Housing affordability Mortgage affordability ratio 29.3% 26.6% 27.0% 28.2% 28.0%
Labour market health Change in job ads less change in unemployment rate 2.0% -10.5% -8.8/% 17.6% -3.7%
Total HH income growth Real wages growth plus employment growth 2.6% 1.6% 0.4% 1.6% 1.9%
Govt financing trends Change in fiscal deficit - percentage impact on GDP 0.3% -0.1% -1.3% - -0.8%
Business sentiment Business confidence (% diff in good / bad expectations) 3.5 3.8 7.3 2.6 6.3
Investment intentions Dividend payout ratio 69.8% 82.5% 78.3% 80.2% 79.2%
Construction orders New construction orders index (neutral = 50) 43.3 44.5 49.8 44.7 45.9
Private sector credit growth Total private sector credit growth 7.3% 4.5% 5.0% 6.3% 4.7%
New housing trends Dwelling approvals (annualised level) 168k 192k 195k 236k 225k
Industry trends Average PMI score (mfting & services, neutral = 50) 48.1 46.7 48.3 48.3 47.7
Growth of trading partners Trade weighted growth expectations of key trading
partners 4.0% 3.8% 3.7% - 3.5%
Exchange rate trends Trade weighted index 69.1 71.0 71.7 64.2 63.0
Real interest rates Official interest rate less inflation 1.5% 0.3% -0.3% 0.0% -0.2%
Risk appetite Sovereign CDS spread 5Y (basis points) 54.2 39.3 34.5 31.5 38.0
GDP growth Real GDP growth y / y % ch (LT avg: 3.3%) 2.8% 2.6% 2.9% 2.4% 2.3%
Inve
stm
en
t T
rad
e
Fin
G
Strengthening Neutral Weakening LEGEND: Momentum compared to last 1Y | Outlook compared to 10Y avg
Indicator 10yr avg 3yr avg Year ago Prev qtr Latest qtr Momentum Outlook Measure
Outlook Momentum
We
igh
ted
avg
.
Source: Lend Lease Group Research
For
per
sona
l use
onl
y

Consumer sentiment Consumer confidence (neutral = 100) 75.2 77.6 78.4 91.4 97.8
Housing affordability Mortgage affordability ratio 16.9% 14.0% 14.4% 15.3% 14.5%
Labour market health Change in job openings less change in unemployment
rate 20.8% 24.5% 21.1% 39.8% 41.6%
Total HH income growth Real wages growth plus employment growth 0.5% 1.6% 1.3% 2.1% 3.3%
Govt financing trends Change in fiscal deficit - percentage impact on GDP -0.1% -1.9% -3.7% - 2.5%
Business sentiment Business confidence (% diff in good / bad expectations) 29.6% 38.2% 37.8% 52.7% 37.5%
Investment intentions Dividend payout ratio 35.8% 36.4% 34.1% 39.0% 42.6%
Construction orders Architecture firms billings index, non-residential
(increased activity = above 50) 49.5 51.5 49.4 52.7 50.4
Private sector credit growth Total private sector credit growth 5.1% 3.6% 1.9% 5.3% 5.8%
New housing trends Private housing units authorised / approved (seasonally-
adjusted, annualised) 1.1m 0.9m 1.0m 1.1m 1.1m
Industry trends Average PMI score (mfting & services, neutral = 50) 52.9 54.5 53.7 57.6 55.3
Growth of trading partners Trade weighted growth expectations of key trading
partners 3.6% 3.3% 3.3% - 3.4%
Exchange rate trends Trade weighted index 103.4 102.9 102.9 108.1 114.4
Real interest rates Official fed funds rate less inflation -0.6% -1.3% -1.2% -1.3% 0.1%
Risk appetite Sovereign CDS spread 5Y (basis points) 34.6 28.3 25.5 17.5 17.0
GDP growth Real GDP growth y / y % ch (LT avg: 2.5%) 1.6% 2.3% 3.1% 2.7% 2.4%
Source: Lend Lease Group Research
Momentum compared to last 1Y | Outlook compared to 10Y avg
Outlook Momentum
We
igh
ted
avg
.
Indicator 10yr avg 3yr avg Year ago Prev qtr Latest qtr Momentum Outlook Measure
United States of America Leading indicators - Economic growth
Co
ns
um
pti
on
In
ve
stm
en
t T
rad
e
Fin
G
Strengthening Neutral Weakening LEGEND:
For
per
sona
l use
onl
y

49 LEND LEASE INVESTOR DAY 2015
Case study: Chinese development opportunity
Advising Global and Regional Investment Committees on new acquisitions
• Our Asian business was looking at a retail development opportunity in Shanghai, China in early 2014
• The bid team had a very compelling proposition including a strong retail and tenant mix
• The micro research was indicating strong catchment fundamentals which was supported by data on
comparable shopping centres in the area
• However, our forward looking macro scans were revealing a supernormal supply coming online in all sub-
markets across Shanghai
• Our models were indicating flat retail productivity growth over the next few years
• While we were comfortable with most of the commercial assumptions of the bid, we were concerned about
the assumptions made on rent growth during the development period and occupancy costs at opening
• As part of Group Research sign-off process on new investments, we flagged these issues to the Asian and
Global Investment Committees
• This input, alongside many other risk-opportunity dimensions that Investment Committees consider,
eventually led to Lend Lease deciding not to pursue this opportunity
For
per
sona
l use
onl
y

50
Australia, 58%
Asia, 37%
Europe, 5% WA, 9% Qld, 17%
SA, 2%
NSW & ACT, 28%
Vic, 31%
NZ, 13%
Communities, 22%
Urban regen Australia, 54%
Urban regen offshore, 24%
Retirement
Where our capital sits today and our approach
LEND LEASE INVESTOR DAY 2015
Development Infrastructure
Development
$3.2b
development
inventory
$411m
invested and
committed
equity
$1.4b
Group
investments
$1.7b
Group
investments
Investment Management
• Seek to secure land on
staged payment basis
• Production capital
committed as projects
de-risked
• Introduce partners to
match right capital with
risk-return profile
through project life cycle
• JV partners on all
Australian PPP projects
• 5 Australian PPP projects
- 4 currently in delivery
and due to commence
operations over the next
18 months
• Opportunity to seed new
infrastructure fund as
projects stabilise
• Retirement portfolio
underpinned by Primelife
acquisition in 2009
• Bolt on acquisitions to
leverage scale and drive
operational efficiency
• Potential to explore capital
partner opportunities over
the medium term
• Deliver broader group capital
solutions while maintaining
ongoing co-investment
position
• Examples: Barangaroo
(LLITST1; LLOITST2) and
Paya Lebar Central joint
venture
• Opportunity to drive return on
capital equation across the
Group and deliver stable
annuity earnings 1 Lend Lease International Towers Sydney Trust 2 Lend Lease One International Towers Sydney Trust
Americas, 28%
Europe, 6%
Australia, 66%
All figures are as at 30 June 2015 unless otherwise stated
For
per
sona
l use
onl
y

51
Development capital
LEND LEASE INVESTOR DAY 2015
• Significant increase in production capital
since FY12 - delivering strong growth in the
number of apartment projects and
commercial towers at major urban
regeneration sites to be completed over the
medium term
• ~$2.2 billion of capital employed in
production at 30 June 2015 up 46% in the
last 12 months
• Peak production capital expected in FY17
1 Indicative view based on development property inventories as at 30 June 2015
Total development inventories $b1
0%
20%
40%
60%
80%
100%
FY11 FY12 FY13 FY14 FY15
Capital employed in land and infrastructure
Capital employed in production
Unsold Inventory (inc Bluewater up to FY13)
$2.3b $1.9b $2.3b $2.4b $3.2b
For
per
sona
l use
onl
y

52
Indicative net cash flow from major projects In-delivery / conversion at 30 June 2015
LEND LEASE INVESTOR DAY 2015
Overview FY15 FY16 FY17 FY18
Communities Net cash proceeds Assuming >2,000 annual lot settlements
Cash
Positive
Cash
Positive
Cash
Positive
Cash
Positive
Apartments Net cash proceeds 25 major apartment buildings currently in
delivery or conversion
Investing Investing Cash
Positive
Cash
Positive
Commercial
Net cash proceeds Barangaroo office towers – development and
investment; commercial tower at Brisbane
Showgrounds; commercial towers at TIQ
Investing Cash
Positive
Cash
Positive
Cash
Positive
Infrastructure
Development Net cash invested Secured Australian PPP projects
Investing Cash
Positive
Cash
Positive
Cash
Positive
Total Investing Cash
Positive
Cash
Positive
Cash
Positive
All cash flow based on current portfolio / investments
We are nearing the period where our production and investment capital generates
positive cash returns
For
per
sona
l use
onl
y

53
Further progress made at Victoria Harbour and Elephant & Castle on
new project launches
LEND LEASE INVESTOR DAY 2015
Pre-sold and in delivery / conversion Pre-sold
%1
Pre-sold
revenue $m1 FY15 FY16 FY17 FY18 FY19
Barangaroo South • 2 apartment buildings: Anadara and Alexander
• 159 units
100%
~$300m
Darling Square
• 6 apartment buildings:
• 538 units (x3 buildings)
• 577 units (x3 buildings)
100%
100%
~$580m
~$810m
Victoria Harbour
• 3 apartment buildings (ex 883 Collins):
• 251 units (Concavo)
• 578 units (888 Collins)
• 536 units (889 Collins)
• 528 units (883 Collins)2
97%
97%
93%
83%
~$255m
~$345m
~$335m
~$301m
Brisbane Showgrounds
• 7 apartment buildings:
• 356 units (The Green x5 buildings)
• 401 units (The Yards x2 buildings)
96%
97%
~$170m
~$210m
Toorak Park Armadale
• 1 apartment building:
• 466 units
75%
~$315m
Wandsworth • 1 apartment building: Cobalt Place
• 104 units: 39 units yet to settle
97%
~$35m
Elephant & Castle
• 3 apartment buildings (ex West Grove):
• 284 units (One The Elephant)
• 235 units (Trafalgar Place): 7 units yet to settle
• 360 units (South Gardens)
• 593 units (West Grove)2
99%
99%
85%
59%
~$295m
~$2m
~$260m
~$339m
The International Quarter
• 2 apartment buildings:
• 333 units (Glasshouse Gardens)
91%
~$265m
Indicates profit earned in financial year
1 As at 30 June 2015 2 Apartment projects highlighted in bold represent figures for the project as at 30 September 2015. These projects are not in delivery / conversion
as at 30 June 2015
For
per
sona
l use
onl
y

54
Apartment settlement outlook - low default risk
LEND LEASE INVESTOR DAY 2015
Pre-sales (by value, as at 30 June 2015)1
By location By customer location China buyer run-off profile
• By location:
− 4 cities in Australia / UK
− 25 buildings in delivery
• By buyer type / price point:
− Owner occupier
− Investor
− Offshore
• ~9-23 per cent embedded price growth
across all markets over the last 12-24
months2 respectively
• ~18 per cent AUD:USD depreciation
over the last 12 months2
• Minimum 10 per cent buyer deposit (up
to 20 per cent)
• PLLACes3 has reduced exposure
• Mainland Chinese buyers
represent 20 per cent of pre-
sales exposure
• Low historical default across
total portfolio
• No historic relationship between
default rates and buyer domicile
1. Diversification of pre-sales 2. Supportive market and mitigants 3. Chinese risk overstated
1 Adjusted for impact of PLLACes transactions
2 To 30 June 2015
London, 32%
Melbourne, 28%
Sydney, 31%
Brisbane, 9%
Local, 55%
Mainland China, 20%
Other offshore,
25%
FY16, 14%
FY17, 17%
FY18, 43%
FY19, 26%
3 Pre-sold Lend Lease Apartment Cash flows
For
per
sona
l use
onl
y
55 LEND LEASE INVESTOR DAY 2015
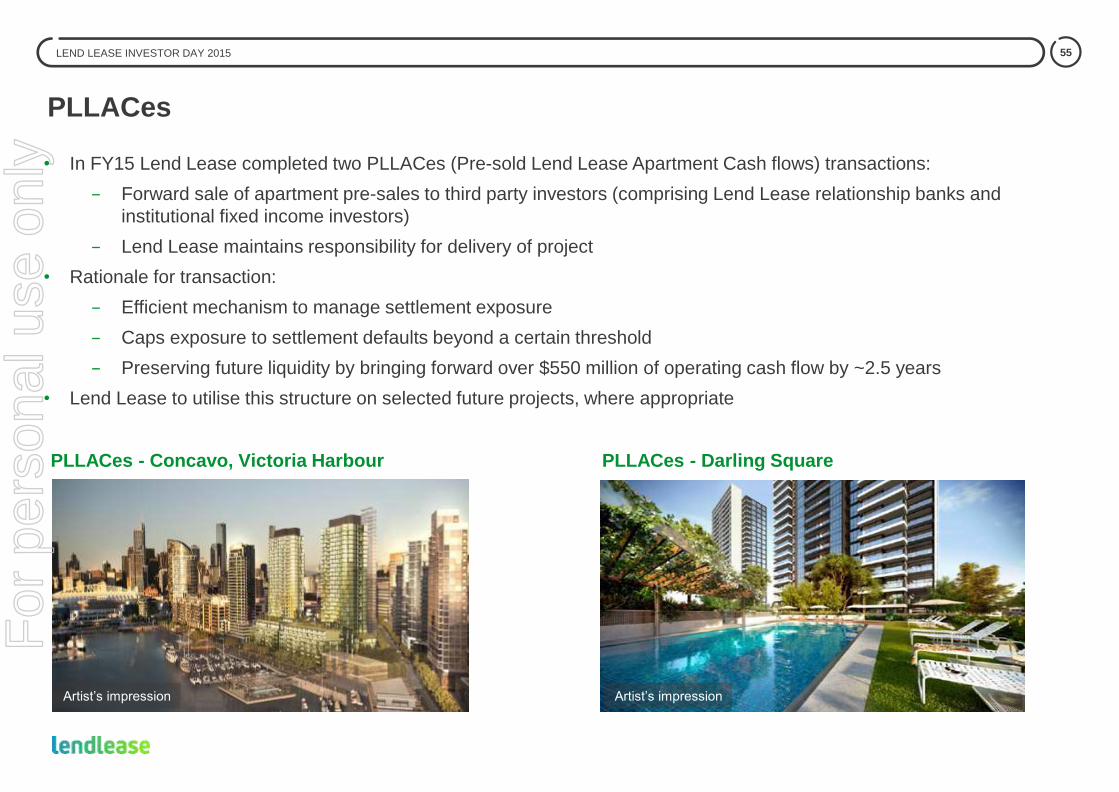
PLLACes
• In FY15 Lend Lease completed two PLLACes (Pre-sold Lend Lease Apartment Cash flows) transactions:
− Forward sale of apartment pre-sales to third party investors (comprising Lend Lease relationship banks and
institutional fixed income investors)
− Lend Lease maintains responsibility for delivery of project
• Rationale for transaction:
− Efficient mechanism to manage settlement exposure
− Caps exposure to settlement defaults beyond a certain threshold
− Preserving future liquidity by bringing forward over $550 million of operating cash flow by ~2.5 years
• Lend Lease to utilise this structure on selected future projects, where appropriate
PLLACes - Concavo, Victoria Harbour PLLACes - Darling Square
Artist’s impression Artist’s impression
For
per
sona
l use
onl
y

56
Our residential and commercial pre-sales book provides strong visibility on
profit and cash
LEND LEASE INVESTOR DAY 2015
$5.2 billion1 pre-sold residential revenue
- indicative cash receipt profile
1 Includes 100% of revenue from joint venture projects. Joint venture partner share of revenue is
~$180 million 2 Pre-sold Lend Lease Apartment Cash flows
~$3.0 billion Barangaroo contracted
commercial development revenue -
indicative cash receipt profile
Other major cash opportunities
Excludes impact of PLLACes2
transactions (over $550 million of cash
brought forward to 2015 reducing
future period receipts to ~$4.6 billion)
Excludes funding requirements for related co-
investments (~$850 million based on current
Lend Lease interests, reducing future period net
receipts of ~$2.2 billion)
• Potential sell down of co-
investment positions in LLITST3 /
LLOITST4
• Potential capital solution on The
International Quarter commercial
stage 1
• Potential capital partners for
retirement business
• Potential new infrastructure fund
seeded by PPP equity
investments
3 Lend Lease International Towers Sydney Trust 4 Lend Lease One International Towers Sydney Trust
2016, 67%
2017, 33% 2016, 28%
2017, 18% 2018, 31%
2019, 23%
For
per
sona
l use
onl
y

57
Q&A Risk management
and capital allocation
For
per
sona
l use
onl
y

Section 4
Closing and final Q&A
Steve McCann
Group Chief Executive Officer and
Managing Director
Illustration: One The Elephant, Elephant
& Castle, London
For
per
sona
l use
onl
y

59
Outlook
LEND LEASE INVESTOR DAY 2015
• Lend Lease has a consistent and proven strategy with embedded growth in our pipeline
• Business model is both resilient and diversified, with significant barriers to entry
• Unrivalled access to third party capital to support our urbanisation strategy
• Strong risk management framework to manage property cycles
• Despite recent market volatility we are confident about our business outlook
• Significant investment in prior years now delivering greater earnings visibility and growth profile
For
per
sona
l use
onl
y

60
Q&A
For
per
sona
l use
onl
y

Image: Artrworks,
Elephant & Castle, London
Section 5
Appendices
For
per
sona
l use
onl
y

62
Australia, 65%
Europe, 10%
Asia, 25%
Development
Construction Investment Management
Property Infrastructure
FY15 FY14 FY15 FY14 FY15 FY14 FY15 FY14
Revenue 1,927.0 2,384.5 204.2 259.2 10,936.9 11,016.0 212.2 294.6
EBITDA 502.1 862.5 131.0 22.6 279.0 271.5 230.8 247.8
PAT 389.7 681.9 103.0 16.2 159.0 144.4 193.1 203.0
EBITDA% 26.0% 36.2% 64.2% 8.7% 2.5% 2.5% 108.8% 84.1%
Highlights1 • $5.2b residential pre-sales
• Residential land - 54,940 units
• Residential built form - 25,960
units (17,806 apartments)
• $3.2b development inventory
• Retirement village - 14,193 units
• ~$1.7b retirement investment
• Five Australian PPP projects
• Three major PPP projects
reaching financial close in FY15
in Australia
• US privatized military housing /
lodging - 54,205 units managed
(secured and preferred)
• $11.8b new work secured
revenue in FY15
• Backlog realisation: FY16
52%, FY17 25%, post FY17+
23%
• Target 3-4% EBITDA margin
(4-5% Australia)
• 17 funds
• 22 retails centres
• 150 institutional investors
• Group investments (market
value) $1.4b
LEND LEASE INVESTOR DAY 2015
1 All figures are as at 30 June 2015 unless otherwise stated
Group overview by segment
$44.9b
development
pipeline end
value
$411m
invested and
committed
equity
$17.3b
backlog
revenue
$21.3b
FUM
Americas, 28%
Europe, 6%
Australia, 66%
Australia, 60%
Asia, 13%
Europe, 21%
Americas, 6% Australia, 57%
Asia, 2%
Europe, 9%
Americas, 32%
For
per
sona
l use
onl
y

63 LEND LEASE INVESTOR DAY 2015
Depth of management experience
Steve McCann
Group Chief Executive Officer and Managing Director
• Joined Lend Lease in 2005 as CEO Investment Management.
Appointed Group CFO in February 2007, Group CEO December in
2008, and Managing Director in March 2009
• Over 25 years of experience in real estate development and
investment management, finance, investment banking, and mergers
and acquisitions law
Tony Lombardo
Group Chief Financial Officer
• Joined Lend Lease in 2007 as Group Head of Strategy and
Mergers and Acquisitions. Appointed as Group CFO in 2011
• Almost ten years at GE, with responsibilities across
numerous functional disciplines including Strategy, Mergers
& Acquisitions and Finance, for both GE Capital and GE
Corporate
Vivienne Bower
Group Head of Corporate Affairs
• Joined Lend Lease in 2012
• More than 20 years experience in Corporate Affairs and
Investor Relations, in-house and consulting, including roles
at Westpac, Multiplex Group, and Aristocrat Leisure
Karen Pedersen
Group General Counsel
• Joined Lend Lease in 2013
• More than 20 years experience in the property industry
including complex highly structured transactions, funds
management, new products, and corporate transactions
Rod Leaver
Chief Executive Officer, Asia
• Joined Lend Lease in 2008
• Over 30 years experience in the property industry and has
worked extensively throughout Australia and Asia
Denis Hickey
Chief Executive Officer, Americas
• Joined Lend Lease in 2012 as Managing Director of
Australian development and appointed CEO Americas in
2014
• Over 20 years experience across all aspects of real estate
development and investment management
Tarun Gupta
Chief Executive Officer, Property, Australia
• Joined Lend Lease in 1994
• Has held a number of senior executive positions within Lend
Lease’s investment management business. Prior to his
current role he was appointed Group Head of Investment
Management
Bob McNamara
Group Chief Risk Officer
• Joined Lend Lease in 2010 as CEO Americas and appointed
Group Chief Risk Officer in 2014
• Over 35 years of experience managing global businesses in
the development, design, and delivery of projects
Michael Vavakis
Group Head of Human Resources
• Joined Lend Lease in 2010
• Over 20 years experience in Global HR and HR strategy in
senior executive positions in Australia, Singapore, Hong
Kong, and USA
Dan Labbad
Chief Executive Officer, International Operations
• Joined Lend Lease in 1997. From July 2012 until August
2014 he was Group Chief Operating Officer. He has
extensive leadership experience across the Lend Lease
platform both in Australia and internationally
• Appointed Chief Executive Officer, International Operations
in 2014, overseeing Europe, Americas, and Asia regions
For
per
sona
l use
onl
y

64 LEND LEASE INVESTOR DAY 2015
Important notice
This presentation has been prepared in good faith, but no representation or warranty, express or implied, is made as to
the accuracy, adequacy or reliability of any statements, estimates, opinions or other information contained in the
presentation (any of which may change without notice). To the maximum extent permitted by law, Lend Lease Corporation
Limited, its controlled entities including Lend Lease Trust (together referred to as the ‘Group’) and their respective
directors, officers, employees and agents disclaim all liability and responsibility (including without limitation any liability
arising from fault or negligence) for any direct or indirect loss or damage which may be suffered through use or reliance on
anything contained in or omitted from this presentation.
Each recipient should consult with, and rely solely upon, their own legal, tax, business and / or financial advisors in
connection with any decision made in relation to the information contained in this presentation.
Prospective financial information has been based on current expectations about future events and is, however, subject to
risks, uncertainties and assumptions that could cause actual results to differ materially from the expectations described in
such prospective financial information.
All figures are in AUD unless otherwise stated.
For
per
sona
l use
onl
y