leaching environmental assessment framework to evaluate ... · leaching environmental assessment...
TRANSCRIPT

Leaching Environmental Assessment Framework to Evaluate Beneficial Use and Disposal Decisions
Susan Thorneloe
U.S. EPA Office of Research and Development National Risk Management Research Laboratory
Research Triangle Park, North Carolina
International Workshop on Environment, Health and Occupational Hygiene Issues in Coal Ash Utilization - 2012
Tel Aviv, Israel December 11 – 13, 2012

The principals collaborating to develop the LEAF test methods & data
management tools are:
D.S. Kosson1, A.C. Garrabrants1, R. DeLapp1,
H.A. van der Sloot2, Ole Hjelmar3, Paul Seignette4,
Greg Helms5, Mark Baldwin5,
Susan Thorneloe6, Peter Kariher7
1 Vanderbilt University, Nashville, TN 2 Van der Sloot Consultancy, Langedijk, The Netherlands 3 DHI, Hørsolm, Denmark 4 Energy Research Center of the Netherlands, Petten, The Netherlands 5 U.S. EPA Office of Resource Conservation & Recovery, Washington DC 6 U.S. EPA Office of Research and Development; RTP, NC 7 ARCADIS-US, Inc.; RTP, NC
Acknowledgements
2

Overview of the Leaching Environmental Assessment
Framework (LEAF) & data management tools
Use of the Leaching Environmental Assessment
Framework (LEAF) to evaluate beneficial use (BU) and
disposal decisions
Conclusions
Supporting documentation
Presentation Outline
3

1960’s-1990’s
Protection from hazardous wastes; waste minimization/conservation. • Classification of “hazardous” waste (RCRA Subtitle C/D landfills)
• Acceptance criteria for disposal of treated wastes (Universal Treatment Standards)
• Best demonstrated available treatment (BDAT)
1990’s – present
Move toward integrated materials management; balancing overall
environmental performance with materials costs and long-term liability • Global economic policy (resource costs, international trade)
• Changing definition of waste materials (e.g., Dutch Building Materials Decree; U.S.
definition of solid waste)
• Applications for waste delisting and alternative measures of treatment effectiveness
• Re-use of waste materials (mine reclamation, alternative construction materials)
Materials Testing – Historically
4

Total Content Analysis • Assume everything leaches
Regulatory Leaching Tests • Simulate leaching for a pre-defined situation
• Provide a single data point (concentration)
Characterization Leaching Tests • Determine leaching characteristics
• Range of conditions
• Apply characteristics to various field conditions
How to Evaluate Leaching?
5

Total Content Analysis • Assume everything leaches
Regulatory Leaching Tests • Simulate leaching for a pre-defined situation
• Provide a single data point (concentration)
Characterization Leaching Tests • Determine leaching characteristics
• Range of conditions
• Apply characteristics to various field conditions
How to Evaluate Leaching?
6

Total Content • Correlation to leaching?
Regulatory Tests • Comparison to limits
• Does not consider Release Scenario
Time (kinetics)
Mass Transport
Characterization Tests • Range of conditions
• Comparisons between Materials
Treatments
Scenarios
Leaching Tests
7
0.01
0.1
1
10
100
0 2 4 6 8 10 12 14
Ars
en
ic (
mg
/L)
pH
Total Content
0.01
0.1
1
10
100
0 2 4 6 8 10 12 14
Ars
en
ic (
mg
/L)
pH
Total Content
Single Point Test
0.01
0.1
1
10
100
0 2 4 6 8 10 12 14
Ars
en
ic (
mg
/L)
pH
Total Content
Single Point Test
Regulatory Limit
0.01
0.1
1
10
100
0 2 4 6 8 10 12 14
Ars
en
ic (
mg
/L)
pH
Total Content
Single Point Test
Regulatory Limit
0.01
0.1
1
10
100
0 2 4 6 8 10 12 14
Ars
en
ic (
mg
/L)
pH
Total Content
Single Point Test
Characterization Test
0.01
0.1
1
10
100
0 2 4 6 8 10 12 14
Ars
en
ic (
mg
/L)
pH
Total Content
Regulatory Limit
Po
rtla
nd
Cem
ent
Characterization Test
0.01
0.1
1
10
100
0 2 4 6 8 10 12 14
Arse
nic
(m
g/L)
pH
Total Content
Regulatory Limit
Ble
nd
ed
Ce
me
ntCharacterization Test

Total Content
Total Content Does Not Correlate to Leaching
Same total content
with different eluate
concentrations
Same eluate
concentration with
different total contents
8

Many Leaching Scenarios …
coastal protection
construction debris and
run-off
roof runoff
municipal sewer system
drinking water well landfill contaminated
soil
road base
industrially
contaminated soil
factory seepage basin
agriculture
mining
9

Controlling Factors
Physical Factors l Particle size
l Rate of mass transport
Site Conditions l Flow rate of leachant
l Temperature
l Bed porosity
l Fill geometry
l Permeability
l Hydrological conditions
Chemical Factors l Equilibrium/kinetic control
l pH
l Liquid-solid ratio
l Complexation
l Redox
l Sorption
l Biological activity
Trace elements
Soluble salts
TOC (at high pH) DOC
H+
CO2
O2
Erosion
Release
Mechanisms
Wash Off
Dissolution
Diffusion
10

Leaching Method Development
Leaching characterization applied to anticipated release conditions resulting in improved accuracy and more reliable environmental decision making
“An Integrated Framework for Evaluating Leaching in Waste Management and Utilization of Secondary Materials,” D.S. Kosson, H.A. van der Sloot, F. Sanchez, and A.C. Garrabrants, Environ. Engr. Sci., 19(3): 159-204, 2002.
Parallel and coordinated methods development in the EU
Designed to address concerns of EPA Science Advisory Board • Considers the form of the material (e.g., monolithic)
• Primary focus on parameters that affect leaching [(e.g., pH, liquid-solid ratio (L/S), release rate)]
Intended for situations where “TCLP” is not required or best suited • Assessment of materials for beneficial reuse
• Evaluating treatment effectiveness (determination of equivalent treatment)
• Characterizing potential release from high-volume materials
• Corrective action (remediation decisions)
11

Leaching Environmental Assessment Framework
LEAF is a collection of …
• Four leaching methods
• Data management tools
• Leaching assessment approaches
… designed to identify characteristic leaching behaviors in a
wide range of materials.
LEAF facilitates integration of leaching methods which provides a
material-specific “source term” release for support of material
management decisions.
More information at http://www.vanderbilt.edu/leaching
12

LEAF Leaching Methods Method 1313 – Liquid-Solid Partitioning as a Function of Eluate pH using
a Parallel Batch Procedure
Method 1314 – Liquid-Solid Partitioning as a Function of Liquid-Solid
Ratio (L/S) using an Up-flow Percolation Column
Procedure
Method 1315 – Mass Transfer Rates in Monolithic and Compacted
Granular Materials using a Semi-dynamic Tank Leaching
Procedure
Method 1316 – Liquid-Solid Partitioning as a Function of Liquid-Solid
Ratio using a Parallel Batch Procedure
Methods 1313 and 1316 are posted:
http://epa.gov/wastes/hazard/testmethods/sw846/new_meth.htm
13 13

Method 1313 Overview
n chemical analyses
Ln LB LA
n samples
S2 Sn n B A
S1
0.01
0.1
1
10
100
1000
2 4 6 8 10 12 14 Leachate pH
Co
pp
er
[mg
/L]
Titration Curve and Liquid-solid Partitioning (LSP) Curve as Function of Eluate pH
14
Equilibrium Leaching Test
• Parallel batch as function of pH
Test Specifications
• 9 specified target pH values plus natural conditions
• Size-reduced material
• L/S = 10 mL/g-dry
• Dilute HNO3 or NaOH
• Contact time based on particle size 18-72 hours
• Reported Data Equivalents of acid/base added
Eluate pH and conductivity
Eluate constituent concentrations

Equilibrium Leaching Test
• Percolation through loosely-packed material
Test Specifications
• 5-cm diameter x 30-cm high glass column
• Size-reduced material
• DI water or 1 mM CaCl2 (clays, organic materials)
• Upward flow to minimize channeling
• Collect leachate at cumulative L/S 0.2, 0.5, 1, 1.5, 2, 4.5, 5, 9.5, 10 mL/g-dry
• Reported Data Eluate volume collected
Eluate pH and conductivity
Eluate constituent concentrations
Method 1314 Overview
air lock
eluant collection bottle(s) (sized for fraction volume)
Luer shut-off valve
eluant reservoir
end cap
end cap
1-cm sand layers
pump
subject material
Luer shut-off valve
Luer fitting
Luer fitting
N2 or Ar (optional)
Liquid-solid Partitioning (LSP) Curve as Function of L/S; Estimate of Pore Water Concentration
15

Method 1315 Overview Mass-Transfer Test
• Semi-dynamic tank leach test
Test Specifications
• Material forms monolithic (all faces exposed)
compacted granular (1 circular face exposed)
• DI water so that waste dictates pH
• Liquid-surface area ratio (L/A) of 9±1 mL/cm2
• Refresh leaching solution at cumulative times 2, 25, 48 hrs, 7, 14, 28, 42, 49, 63 days
• Reported Data Refresh time
Eluate pH and conductivity
Eluate constituent concentrations
1 Sample
n
analytical
samples
A1
L1
A2 An
L2 Ln
Δt1 Δtn
or
Monolith
Compacted Granular
n Leaching Intervals
Δt2
Flux and Cumulative Release as a Function of Leaching Time
Granular
Monolithic
0.001
0.01
0.1
1
10
100
1000
0.01 0.1 1 10 100
Cr
Rele
ase [
mg
/m2]
Leaching Time [days]
Availability
MDL
ML
16

Method 1316 Overview
Equilibrium Leaching Test
• Parallel batch as function of L/S
Test Specifications
• Five specified L/S values (±0.2 mL/g-dry) 10.0, 5.0, 2.0, 1.0, 0.5 mL/g-dry
• Size-reduced material
• DI water (material dictates pH)
• Contact time based on particle size 18-72 hours
• Reported Data Eluate L/S
Eluate pH and conductivity
Eluate constituent concentrations
n chemical analyses
Ln LB LA
n samples
S2 Sn n B A
S1
Liquid-solid Partitioning (LSP) Curve as a Function of L/S; Estimate of Pore Water Concentration
17
0
20
40
60
80
100
120
0 2 4 6 8 10
Mo
lyb
den
um
[µ
g/L
]
LS Ratio [mL/g-dry]

LEAF and EU Methods
WASCON, Gothenburg, Sweden
18
Parameter LEAF Method EU Method EU Applications
pH-dependence Method 1313 CEN/TS 14429
CEN/TS 14997
ISO/TS 14997
waste, mining waste, construction products
waste, mining waste, construction products
soil, sediments, compost, sludge
Percolation Method 1314 CEN/TS 14405
CEN/TC351/TS-3
ISO/TS 21268-3
waste, mining waste
construction products
soil, sediments, compost, sludge
Mass Transport Method 1315 CEN/TS 15683
CEN/TC351/TS-2
NEN 7347 (Dutch)
NEN7348 (Dutch)
monolithic waste
monolithic construction products
monolithic waste
granular waste and construction products,
L/S dependence Method 1316 EN12457-2 waste

Data Management Tools
Data Templates
• Excel Spreadsheets for Each Method
Perform basic, required calculations (e.g, moisture content)
Record laboratory data
Archive analytical data with laboratory information
• Form the upload file to materials database
LeachXS (Leaching eXpert System) Lite
• Data management, visualization and processing program
• Compare Leaching Test Data
Between materials for a single constituent (e.g., As in two different CCRs)
Between constituents in a single material (e.g., Ba and SO4 in cement)
To default or user-defined “indicator lines” (e.g., QA limits, threshold values)
• Export leaching data to Excel spreadsheets
• Freely available at http://www.vanderbilt.edu/leaching
19 19

Data Templates
20
DRAFT METHOD 1313 (Liquid-Solid Partitioning as a Function of pH) LAB DATA
Code Description (optional) Test conducted by: Extraction Information
Project ABC Example project LS Ratio 10 [mL/g-dry]
Material XYZ Exaple material Solids Information Liquid Volume / Extraction 200 [mL]
Replicate A Maximum Particle Size 0.3 [mm] Recommended Bottle Size * 250 [mL]
Minimum Dry Equivalent Mass * 20.00 [g-dry]
Date Time Solids Content (default = 1) 0.901 [g-dry/g] Nominal Reagent Information
Test Start 1/2/xx 2:00 PM Mass of "As Tested" Material / Extraction 22.20 [g] Acid Type HNO3
Test End 1/3/xx 1:45 PM Acid Normality 2.0 [meq/mL]
Required Contact Time * 23-25 [hr] * Data based on Draft Method 1313 Table 1. Base Type NaOH
Base Normality 1.0 [meq/mL]
Schedule of Acid and Base Addition
Test Position T01 T02 T03 T04 T05 T06 T07 T08 T09 B01 B02 B03 totals
"As Tested" Solid [g] (±0.05g) 22.20 22.20 22.20 22.20 22.20 22.20 22.20 22.20 22.20 no solid no solid no solid 199.8 [g]
Reagent Water [mL] (±5%) 147.80 167.80 185.80 197.80 195.80 193.80 189.80 185.80 178.80 200.00 181.00 150.00 2174.2 [mL]
Acid Volume [mL] (±1%) - - - - 2.00 4.00 8.00 12.00 19.00 - 19.00 - 64.0 [mL]
Base Volume [mL] (±1%) 50.00 30.00 12.00 - - - - - - - - 50.00 142.0 [mL]
Acid Normality [meq/mL] - - - - 2.0 2.0 2.0 2.0 2.0 - 2.0 -
Base Normality [meq/mL] 1.0 1.0 1.0 - - - - - - - - 1.0
Target pH 13.0±0.5 12.0±0.5 10.5±0.5 natural 8.0±0.5 7.0±0.5 5.5±0.5 4.0±0.5 2.0±0.5
Acid Addition [meq/g] -2.5 -1.5 -0.6 0 0.2 0.4 0.8 1.2 1.9 Water Acid Base
Eluate pH 12.80 12.20 10.80 9.20 7.80 5.98 4.79 3.60 2.30
Eluate EC [mS/cm]
Eluate Eh [mV]
Save? (enter "a" or "r" ) a a a a a r r a a
Notes pH out of
range
pH out of
range
1) Enter particle size
and solids content
2) Enter
acid/base
type &
normality
3) Enter target equivalents
from titration curve
4) Follow “set-
up” recipe
5) Record pH,
conductivity,
Eh (optional)
6) Verify that final pH is
in acceptable range
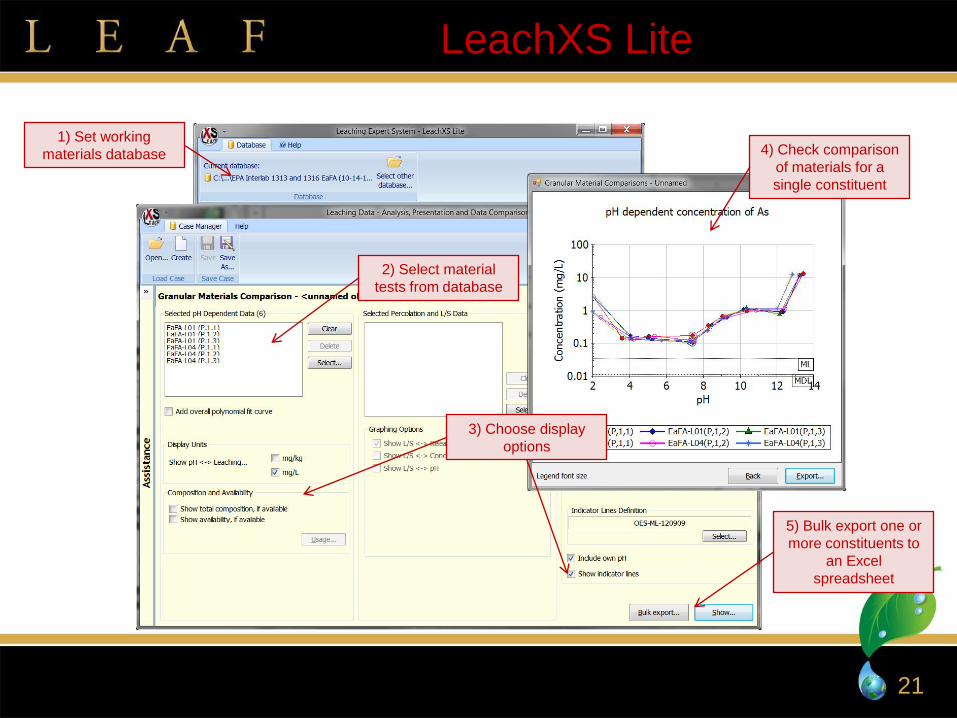
LeachXS Lite
21
1) Set working
materials database
2) Select material
tests from database
3) Choose display
options
4) Check comparison
of materials for a
single constituent
5) Bulk export one or
more constituents to
an Excel
spreadsheet

Study Materials
Coal Combustion Fly Ash
• Collected for EPA study
• Selected for validation of …
Method 1313/1316 Phase I
Method 1314 Phase I
Solidified Waste Analog
• Cement/slag/fly ash spiked
with metal salts
• Selected for validation of …
Method 1313/1316 Phase II
Method 1315 Phase I
Method 1314 Phase II
Contaminated Field Soil
• Smelter soil
• Collection in process
• Selected for validation of…
Method 1313/1316 Phase II
Method 1315 Phase II
Method 1314 Phase II
Foundry Sand
• Collection in process
• Selected for validation of …
Method 1315 Phase II
Method 1314 Phase II
22

Data Processing
Log10-Transform of Test Output • Method 1313 – Eluate Concentration
• Method 1314 – Eluate Concentration,
Cumulative Mass Release
• Method 1315 – Interval Mass Flux,
Cumulative Mass Release
• Method 1316 – Eluate Concentration
Linear Interpolation and Extrapolation • Collected Data Shows Variability
• Brings Data to Specified pH, L/S or Time
• Consistency in Comparisons
Implications for Compliance Standards
23
ML
MDL
0.01
0.1
1
10
0 2 4 6 8 10 12 14
Se
len
ium
(m
g/L)
pH
ML
MDL
0.01
0.1
1
10
0 2 4 6 8 10 12 14
Se
len
ium
(m
g/L)
target pH

Method 1313 Validation Examples
WASCON, Gothenburg, Sweden
24
1
10
100
1000
0 2 4 6 8 10 12 14
As
Re
pro
du
cib
ilit
y (
%)
Target pH
CFS RSD-R
EaFA RSD-R
SWA RSD-R
ICP-OES RSDML
MDL0.01
0.1
1
10
100
0 2 4 6 8 10 12 14
Ars
en
ic (
mg
/L)
Target pH
M1313 EaFA MeanOverall SDBetween Lab SDWithin Lab SD
Coal Combustion Fly Ash Reproducibility
Study Materials • CFS Contaminated Field Soil • EaFA Coal Combustion Fly Ash • SWA Solidified Waste Analog

pH-dependence Tests
WASCON, Gothenburg, Sweden
25
L11-CEN/TS14429-A L11-CEN/TS14429-B L11-CEN/TS14429-C L11-CEN/TS14997-A L12-CEN/TS14997-A L12-CEN/TS14997-B L12-CEN/TS14997-C M1313 Mean M1313 95% RL
ML
MDL0.001
0.01
0.1
1
10
0 2 4 6 8 10 12 14
Mo
lyb
de
nu
m (
mg
/L)
pH
Contaminated Field Soil
ML
MDL0.001
0.01
0.1
1
10
0 2 4 6 8 10 12 14
Mo
lyb
de
nu
m (
mg
/L)
pH
Coal Combustion Fly AshML
MDL0.001
0.01
0.1
1
10
0 2 4 6 8 10 12 14
Mo
lyb
de
nu
m (
mg
/L)
pH
Solidified Waste Analog
ML
MDL
0.0001
0.001
0.01
0.1
1
10
100
0 2 4 6 8 10 12 14
Ch
ro
miu
m (
mg
/L)
pH
Coal Combustion Fly Ash
ML
MDL
0.0001
0.001
0.01
0.1
1
10
100
0 2 4 6 8 10 12 14
Ch
ro
miu
m (
mg
/L)
pH
Solidified Waste Analog

Evaluation Basis – Methods 1314 and 1315
Percolation Column Mass Transfer
WASCON, Gothenburg, Sweden
26
1
10
100
0.1 1 10
Bo
ron
Re
lea
se
RS
DR
(%)
L/S (L/kg)
M1314 CFS RSD-R
M1314 JaFS RSD-R
ICP-OES RSD
Release at End of Test(L/S = 10 mL/g-dry )
Release through 2nd Fraction(L/S = 0.5 mL/g-dry )
1
10
100
0.1 1 10
Alu
min
um
RS
DR
(%)
L/S (L/kg)
M1314 CFS RSD-R
M1314 JaFS RSD-R
ICP-OES RSD
Concentration in 9th Fraction (L/S10)
Concentration in 2nd Fraction (L/S0.5)
1
10
100
0.01 0.1 1 10 100
Alu
min
um
Re
lea
se
RS
DR
(%)
Time (days)
M1315 CFS RSD-R
M1315 SWA RSD-R
ICP-OES RSD Release at End of Test(63-day cumulative time)
Release after 4th Interval(7-day cumulative time)
1
10
100
1000
0.01 0.1 1 10 100
Ba
riu
m F
lux
RS
DR
(%)
Time (days)
M1315 CFS RSD-R
M1315 SWA RSD-R
ICP-OES RSDMean Flux 2nd - 9th Intervals
(excludes washoff)
Flux in 4th Interval(7-day cumulative time)
Mean Flux 2nd - 4th Intervals(excludes washoff)

Percolation (Column) Tests
WASCON, Gothenburg, Sweden
27
L11-CEN/TS14405-A L11-CEN/TS14405-B L11-CEN/TS14405-C M1313 Mean M1313 95% RL
0.0001
0.001
0.01
0.1
1
10
100
1000
0.1 1 10 100
Bo
ro
n R
ele
ase
(m
g/k
g)
L/S (L/kg)
MDL
ML
0.0001
0.001
0.01
0.1
1
10
100
1000
0.1 1 10 100
Ca
lciu
m R
ele
ase
(m
g/k
g)
L/S (L/kg)
MDL
ML
0.0001
0.001
0.01
0.1
1
0.1 1 10 100
Mo
lyb
de
nu
m R
ele
ase
(m
g/k
g)
L/S (L/kg)
MDL
ML
0.0001
0.001
0.01
0.1
1
10
100
0.1 1 10 100
Zin
c R
ele
ase
(m
g/k
g)
L/S (L/kg)
MDL
ML
0.0001
0.001
0.01
0.1
1
10
100
0.1 1 10 100
Co
pp
er R
ele
ase
(m
g/k
g)
L/S (L/kg)
MDL
ML
Contaminated Field Soil
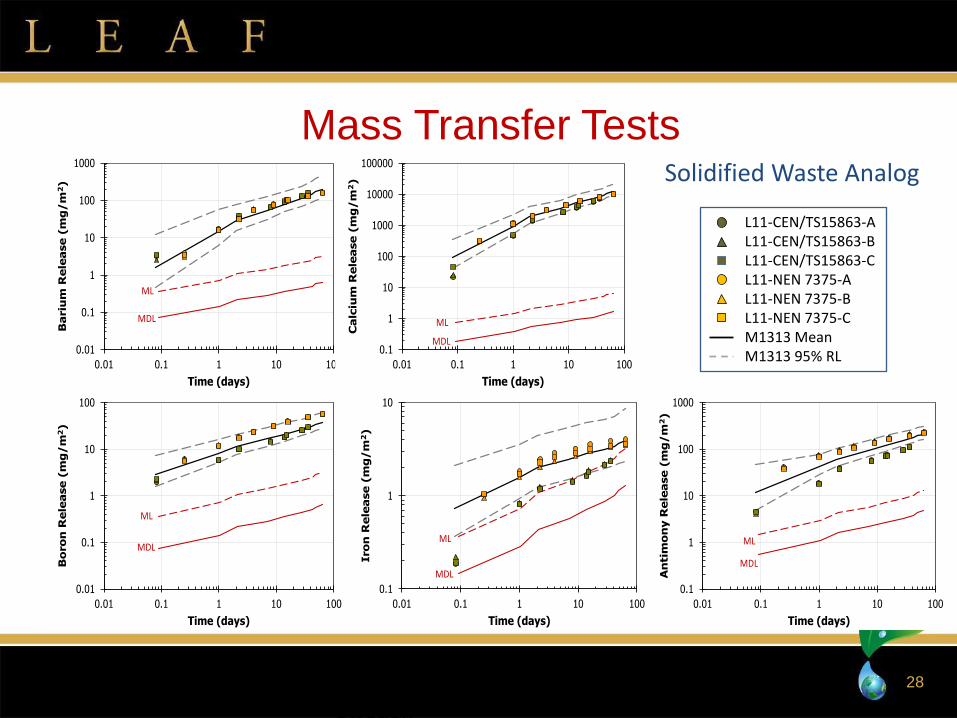
Mass Transfer Tests
WASCON, Gothenburg, Sweden
28
L11-CEN/TS15863-A L11-CEN/TS15863-B L11-CEN/TS15863-C L11-NEN 7375-A L11-NEN 7375-B L11-NEN 7375-C M1313 Mean M1313 95% RL 0.01
0.1
1
10
100
1000
0.01 0.1 1 10 100
Ba
riu
m R
ele
ase
(m
g/m
2)
Time (days)
MDL
ML
0.1
1
10
100
1000
10000
100000
0.01 0.1 1 10 100C
alc
ium
Re
lea
se
(m
g/m
2)
Time (days)
MDL
ML
0.01
0.1
1
10
100
0.01 0.1 1 10 100
Bo
ro
n R
ele
ase
(m
g/m
2)
Time (days)
MDL
ML
0.1
1
10
0.01 0.1 1 10 100
Iro
n R
ele
ase
(m
g/m
2)
Time (days)
MDL
ML
0.1
1
10
100
1000
0.01 0.1 1 10 100
An
tim
on
y R
ele
ase
(m
g/m
2)
Time (days)
MDL
ML
Solidified Waste Analog

LEAF Method Precision
WASCON, Gothenburg, Sweden
29
Method Test Output RSDr
(%)
RSDR
(%)
Method 1313 Eluate Concentration (average over pH range) 10 26
Method 1314 Eluate Concentration (9th fraction at L/S=10)
Mass Release (cumulative to L/S=0.5)
Mass Release (cumulative to L/S=10)
13
7
5
28
18
14
Method 1315 Interval Flux (average excluding wash-off)
Mass Release (cumulative to 7-days)
Mass Release (cumulative to 63-days)
11
9
6
28
19
23
Method 1316 Eluate Concentration (average over L/S range) 7 17

Validation Acknowledgements Participating Labs • Government
Oak Ridge National Lab
Pacific Northwest National Lab
Savannah River National Lab
U.S. EPA- Research Triangle Park, NC
• Academia Ohio State University
University of Wisconsin – Madison
University of Missouri – Rolla
Vanderbilt University
• Commercial ARCADIS-US, Inc.
TestAmerica Laboratories, Inc.
URS Corporation
International Labs • Energy Research Centre of The
Netherlands
• DHI (Denmark)
Support • Electric Power Research Institute
(EPRI)
• Recycled Materials Research Center (RMRC)
• Tennessee Valley Authority (TVA)
LEAF Methods Focus Group
30

Range of observed total content and leaching test results (5.4 ≤
pH ≤ 12.4) for 34 fly ash samples and 20 FGD gypsum samples
31
Indicator Values Fly Ash FGD Gypsum
TC
(µg/L)
MCL
(µg/L)
Total
Content
(mg/kg)
Leaching
Concentration
(µg/L)
Total Content
(mg/kg)
Leaching
Concentration
(µg/L)
Hg 200 2 0.1- 1.5 <0.01-0.50 0.01-3.1 <0.01-0.66
Sb - 6 3-14 <0.3-11,000 0.14-8.2 <0.3-330
As 5,000 10 17-510 0.32-18,000 0.95-10 0.32-1,200
Ba 100,000 2,000 50-7,000 50-670,000 2.4-67 30-560
B - 7,000* NA 210-270,000 NA 12-270,000
Cd 1,000 5 0.3-1.8 <0.1-320 0.11-0.61 <0.2-370
Cr 5,000 100 66-210 <0.3-7,300 1.2-20 <0.3-240
Mo - 200 6.9-77 <0.5-130,000 1.1-12 0.36-1,900
Se 1,000 50 1.1-210 5.7-29,000 2.3-46 3.6-16,000
Tl - 2 0.72-13 <0.3-790 0.24-2.3 <0.3-1,100
* Indicates DWEL value rather than MCL. Bold text indicates where leaching concentrations are greater than indicator values. Indicator values shown for comparison to leaching test concentration as an initial screening only (leaching results do not include dilution/attenuation considered in development of indicator values). From ES&T 2010 publication.
Indicator Values: TC = Toxicity characteristic value; DWEL – drinking H2O equivalent level; MCL – Maximum concentration level

A Possible Approach to Beneficial Use Screening Levels
Step 1: Select use application (includes engineering specifications)
Step 2: Select corresponding pH domain and perform Method 1313
Step 3: (a) Select corresponding fate and transport values (i) CCR fraction in engineered use (fCCR);
(ii) Engineered attenuation factor (EAF) – Use specific; (iii) Constituent-specific dilution attenuation factors (DAFs)-Default or State Specific; (iv) Human or ecological benchmarks (federal and/or state); and
(b) Calculate screening levels
Step 4: Compare maximum LEAF result to screening levels Use is protective of human health and the environment? (i.e., LEAF < screening level?)
Proceed with use
Conduct site-specific modeling with Method
1313 data from Step 2 or Method 1314 or 1315
data (if available)
Can use application and/or engineering specifications be modified? Yes
No
Choose
Pass Fail Inappropriate
for this use
Perform Method(s) 1314/1316 or 1315
Yes
No
32
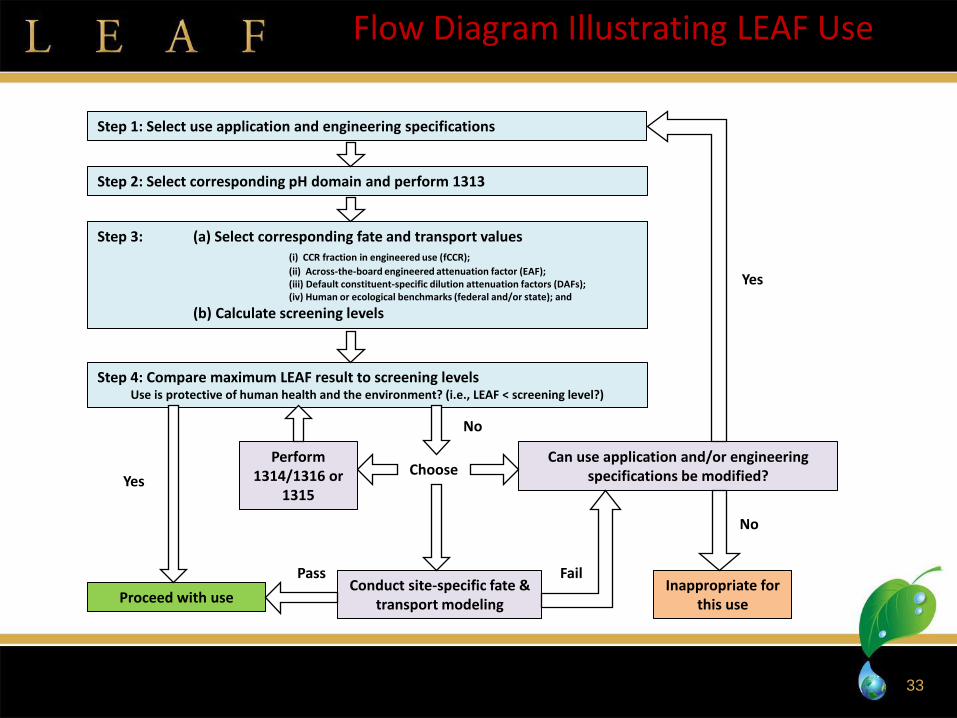
33
Step 1: Select use application and engineering specifications
Step 2: Select corresponding pH domain and perform 1313
Step 3: (a) Select corresponding fate and transport values (i) CCR fraction in engineered use (fCCR);
(ii) Across-the-board engineered attenuation factor (EAF); (iii) Default constituent-specific dilution attenuation factors (DAFs); (iv) Human or ecological benchmarks (federal and/or state); and
(b) Calculate screening levels
Step 4: Compare maximum LEAF result to screening levels Use is protective of human health and the environment? (i.e., LEAF < screening level?)
Proceed with use Conduct site-specific fate &
transport modeling
Can use application and/or engineering specifications be modified? Yes
No
Choose
Pass Fail Inappropriate for
this use
Perform 1314/1316 or
1315
Yes
No
Flow Diagram Illustrating LEAF Use

Overview of Approach
Step 1: Select use application and engineering specifications
Step 2: Select corresponding pH domain and perform LEAF
Step 3(a): Select corresponding fate and transport values
Step 3(b): Calculate screening levels
Step 4: Compare maximum LEAF result to screening levels
OSWER in collaboration with ORD is developing a
guidance document in 2013 for LEAF implementation.
34

Preliminary Cost Estimate Assuming:
• Quarterly Sampling
• Triplicate Method 1313 = $15,000 + administrative costs
• Analysis for 15 Constituents
American Coal Ash Association (ACAA)
• 72,500,000 tons of fly ash produced in 2008
• 274 coal-fired electric utility generating stations
• $20 to $45 per ton for cement quality fly ash in 2003
Costs of LEAF Testing
• Using ACAA data - 265,000 tons per station on average
• $100,000 (est’d) per annum per station
• $0.38 per ton produced
35

Conclusions LEAF test methods are available for use to characterize the leaching potential over a range of conditions (i.e., pH, liquid-to-solid ratio, and waste form)
LEAF characterization tests can be used to evaluate range of materials to identify leaching behavior for range of field conditions for disposal and beneficial use
Supporting software is available for implementation including (1) LEAF method
templates and (2) LeachXS-Lite for data entry, analysis, visualization, and
reporting
Implementation of LEAF methods provide a source term to distinguish between
individual CCRs or other materials based on their leaching characteristics:
CCRs can be screened for specific use and disposal options
Determinations can be made on national, regional, state or site-specific basis
Methodology allows for more detailed evaluation when warranted
Validation of LEAF test methods was completed in Oct 2012
LEAF Methods have been released on EPA’s Web Site:
http://epa.gov/wastes/hazard/testmethods/sw846/new_meth.htm
March 5, 2012
36

Supporting Documentation
Laboratory-to-Field Comparisons for Leaching Evaluation using the Leaching
Environmental Assessment Framework (LEAF), EPA 600/R-12/XXX (completed
peer and QA review, submitted into admin review; anticipate release in Jan
2013).
The Impact of Coal Combustion Fly Ash Used as a Supplemental Cementitious
Material on the Leaching of Constituents from Cements and Concretes, EPA
600/R-12/704, Oct 2012
Interlaboratory Validation of the Leaching Environmental Assessment
Framework (LEAF) Leaching Tests for Inclusion into SW-846: Method 1313 and
Method 1316, EPA 600/R-12/623, Sept 2012
Interlaboratory Validation of the Leaching Environmental Assessment
Framework (LEAF) Leaching Tests for Inclusion into SW-846: Method 1314 and
Method 1315, EPA 600/R-12/624, Sept 2012
Background Information for the Leaching Environmental Assessment
Framework Test Methods, EPA/600/R-10/170, Dec 2010
37

Supporting Documentation (Cont.)
S.A. Thorneloe, D.S. Kosson, F. Sanchez, A.C. Garrabrants, and G. Helms
(2010) “Evaluating the Fate of Metals in Air Pollution Control Residues from
Coal-Fired Power Plants,” Environmental Science & Technology, 44(19), 7351-
7356.
Characterization of Coal Combustion Residues from Electric Utilities -
Leaching and Characterization Data, EPA-600/R-09/151, Dec 2009
Characterization of Coal Combustion Residues from Electric Utilities Using
Wet Scrubbers for Multi-Pollutant Control, EPA-600/R-08/077, July 2008
Characterization of Mercury-Enriched Coal Combustion Residues from
Electric Utilities Using Enhanced Sorbents for Mercury Control, EPA-600/R-
06/008, Feb 2006
D.S. Kosson, H.A. van der Sloot, F. Sanchez, and A.C. Garrabrants (2002) “An
integrated framework for evaluating leaching in waste management and
utilization of secondary materials,” Environmental Engineering Science, 19(3),
159-204.
38