l v r water and s p appraisal report bunda town...
TRANSCRIPT
UUnniitteedd NNaattiioonnss HHuummaann SSeettttlleemmeennttss PPrrooggrraammmmee
UN-HABITAT
LAKE VICTORIA REGION WATER AND SANITATION PROGRAMME
APPRAISAL REPORT BUNDA TOWN
November 2008
UN-HABITAT – LVWATSAN Bunda Appraisal Report
TABLE OF CONTENTS 1 BUNDA TOWN PROFILE............................................................................................................................... 1
1.1 BUNDA DISTRICT ........................................................................................................................................ 1 1.2 BUNDA TOWN COUNCIL.............................................................................................................................. 1 1.3 BUNDA URBAN WATER SUPPLY ................................................................................................................. 1 1.4 POPULATION ............................................................................................................................................... 2 1.5 VULNERABLE GROUPS................................................................................................................................ 2
2 RESULTS OF THE URBAN INEQUITY SURVEY IN BUNDA................................................................. 3 2.1 URBAN INEQUITY SURVEY (UIS)................................................................................................................ 3 2.2 PRESENTATION OF THE UIS SURVEY, AVAILABILITY OF RESULTS FOR BUNDA .......................................... 3 2.3 SOME OF THE UIS RESULTS HIGHLIGHTED ................................................................................................. 3 2.4 WHAT IS ADEQUATE WATER SUPPLY COVERAGE?..................................................................................... 5 2.5 WHAT IS ADEQUATE PROVISION OF SANITATION?...................................................................................... 6
3 WATER SUPPLY ............................................................................................................................................. 7 3.1 INSTITUTIONAL BACKGROUND ................................................................................................................... 7 3.2 TECHNICAL REVIEW OF THE WATER SUPPLY SYSTEM ................................................................................ 7
3.2.1 General Overview ................................................................................................................................. 7 3.2.2 Management of BUWSA........................................................................................................................ 7 3.2.3 Main Components of the existing Bunda Water Supply System ............................................................ 8
3.3 REHABILITATION OF BUNDA WATER SUPPLY INFRASTRUCTURE .............................................................. 11 3.4 TARIFFS AND METERING........................................................................................................................... 11 3.5 OTHER POTENTIAL RAW WATER SOURCES............................................................................................... 11 3.6 PROBLEMS WITH THE WATER SUPPLY FOR BUNDA ................................................................................... 12 3.7 WATER SUPPLY IN LOW INCOME AREAS .................................................................................................. 12
4 SEWERAGE AND SANITATION ................................................................................................................ 13 4.1 AVAILABLE SANITATION .......................................................................................................................... 13 4.2 SANITATION IN LOW-INCOME AREAS ....................................................................................................... 13 4.3 HEALTH HAZARDS OF POOR SANITATION ................................................................................................. 13
5 SOLID WASTE AND DRAINAGE............................................................................................................... 14 5.1 SOLID WASTE ........................................................................................................................................... 14 5.2 URBAN DRAINAGE.................................................................................................................................... 14
6 URBAN PHYSICAL PLANNING ................................................................................................................. 15 6.1 EARLIER ATTEMPTS AT PHYSICAL PLANNING........................................................................................... 15 6.2 NEED FOR PHYSICAL PLANNING ............................................................................................................... 15 6.3 WAY FORWARD ........................................................................................................................................ 15
7 ORPHANS AND OTHER VULNERABLE GROUPS ................................................................................ 16 7.1 THE IMPACT OF THE HIV/AIDS EPIDEMIC IN BUNDA ............................................................................... 16 7.2 CHALLENGES ............................................................................................................................................ 16 7.3 STRATEGIES TO ADDRESS HIV/AIDS....................................................................................................... 16 7.4 HIV/AIDS ORPHANS................................................................................................................................ 17 7.5 THE IMPACT OF HIV/AIDS ON LAND RIGHTS........................................................................................... 17 7.6 EXISTING FACILITIES IN BUNDA FOR ORPHANS ........................................................................................ 17 7.7 RECOMMENDATIONS FOR FOLLOW-UP ACTIONS ........................................................................................ 18
8 TRAINING AND CAPACITY BUILDING.................................................................................................. 19 8.1 GENERAL OBSERVATIONS......................................................................................................................... 19 8.2 FAST-TRACK CAPACITY BUILDING PROGRAMME...................................................................................... 19 8.3 CAPACITY BUILDING FOR THE LOCAL GOVERNMENT AND COMMUNITIES ................................................ 20
9 IMPLEMENTATION STRATEGY .............................................................................................................. 21 9.1 IMPLEMENTATION STRATEGY.................................................................................................................... 21
November 2008
UN-HABITAT – LVWATSAN Bunda Appraisal Report
9.2 MULTI-STAKEHOLDERS FORUM (MSF) OR PEOPLE’S PARLIAMENT .......................................................... 21 9.3 PROJECT IMPLEMENTATION UNIT (PIU) AT THE TOWN LEVEL................................................................... 21 9.4 PROJECT MANAGEMENT UNIT (PMU) AT NATIONAL LEVEL..................................................................... 21 9.5 OVERALL APPROACH TO IMPLEMENTATION .............................................................................................. 22 9.6 MSF ESTABLISHED IN BUNDA................................................................................................................... 23 9.7 ISSUES RAISED DURING THE MSF MEETING ............................................................................................. 24
10 SUMMARY OF FINDINGS AND PROBLEMS TO BE ADDRESSED.................................................... 28 10.1 DEVELOP LONG-TERM DEVELOPMENT PLAN FOR BUNDA TC .................................................................. 28 10.2 WATER SUPPLY......................................................................................................................................... 28 10.3 SANITATION.............................................................................................................................................. 29 10.4 SOLID WASTE MANAGEMENT................................................................................................................... 29 10.5 DRAINAGE ................................................................................................................................................ 29 10.6 URBAN PHYSICAL PLANNING.................................................................................................................... 30 10.7 CAPACITY BUILDING................................................................................................................................. 30 10.8 ADVOCACY AND AWARENESS RAISING .................................................................................................... 30 10.9 URBAN CATCHMENT MANAGEMENT ........................................................................................................ 30 10.10 GENDER MAINSTREAMING AND SUPPORT TO VULNERABLE GROUPS........................................................ 30
11 PROPOSED INTERVENTIONS................................................................................................................... 31 11.1 WATER SUPPLY: ....................................................................................................................................... 31 11.2 SANITATION AND SEWERAGE:................................................................................................................... 31 11.3 SOLID WASTE: ........................................................................................................................................... 32 11.4 DRAINAGE: ............................................................................................................................................... 32 11.5 PHYSICAL PLANNING ................................................................................................................................ 32 11.6 ORPHANS AND OTHER VULNERABLE GROUPS........................................................................................... 32 11.7 ADVOCACY AND AWARENESS RAISING .................................................................................................... 33 11.8 URBAN CATCHMENT MANAGEMENT ........................................................................................................ 33 11.9 CAPACITY BUILDING................................................................................................................................. 33 11.10 GENDER MAINSTREAMING AND SUPPORT TO VULNERABLE GROUPS........................................................ 33 11.11 MONITORING AND EVALUATION............................................................................................................... 34
12 PROPOSED IMMEDIATE AND LONG-TERM INTERVENTIONS IN BUNDA ................................ 35
13 REFERENCES ................................................................................................................................................ 38
ANNEXES ANNEX 1 - FIELD OBSERVATIONS ................................................................................................................. A-1
ANNEX 2 – PROGRAMME MSF WORKSHOP.............................................................................................. A-10
ANNEX 3 – RESULTS UIS SURVEY ................................................................................................................ A-14
ANNEX 4 – ANNUAL REPORT BUWSA ......................................................................................................... A-25
November 2008
UN-HABITAT – LVWATSAN Bunda Appraisal Report
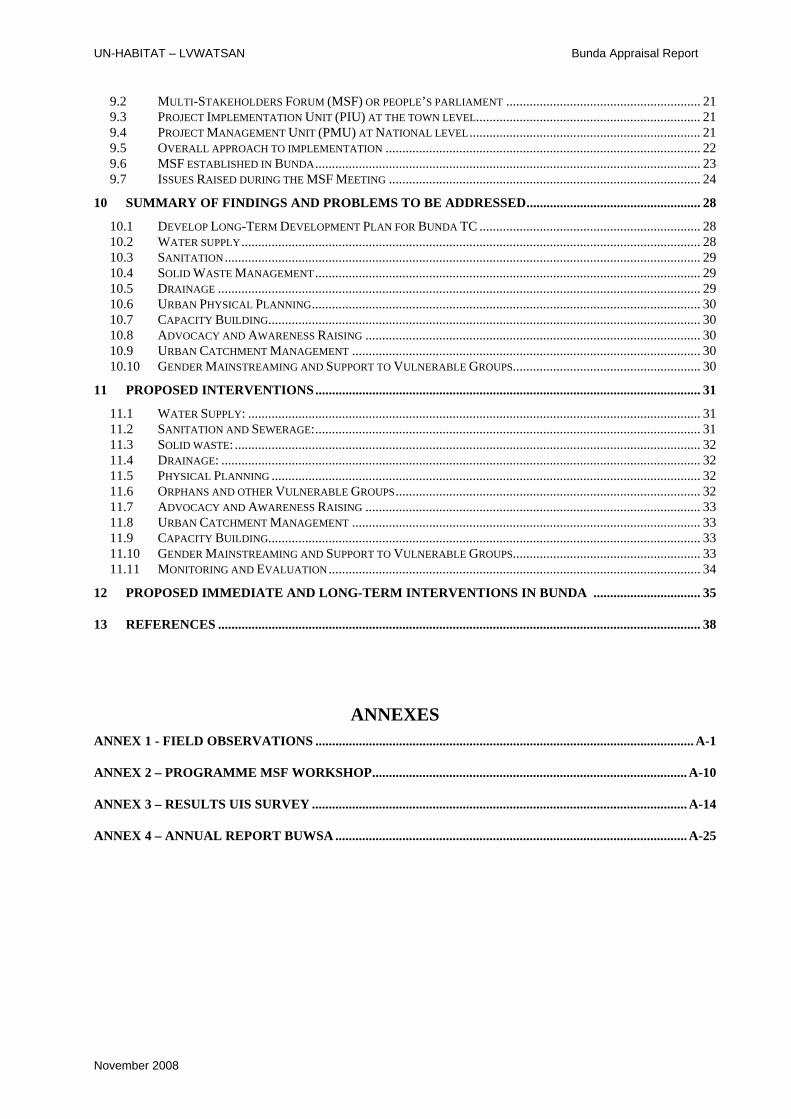
Fig 1 - Location map Bunda
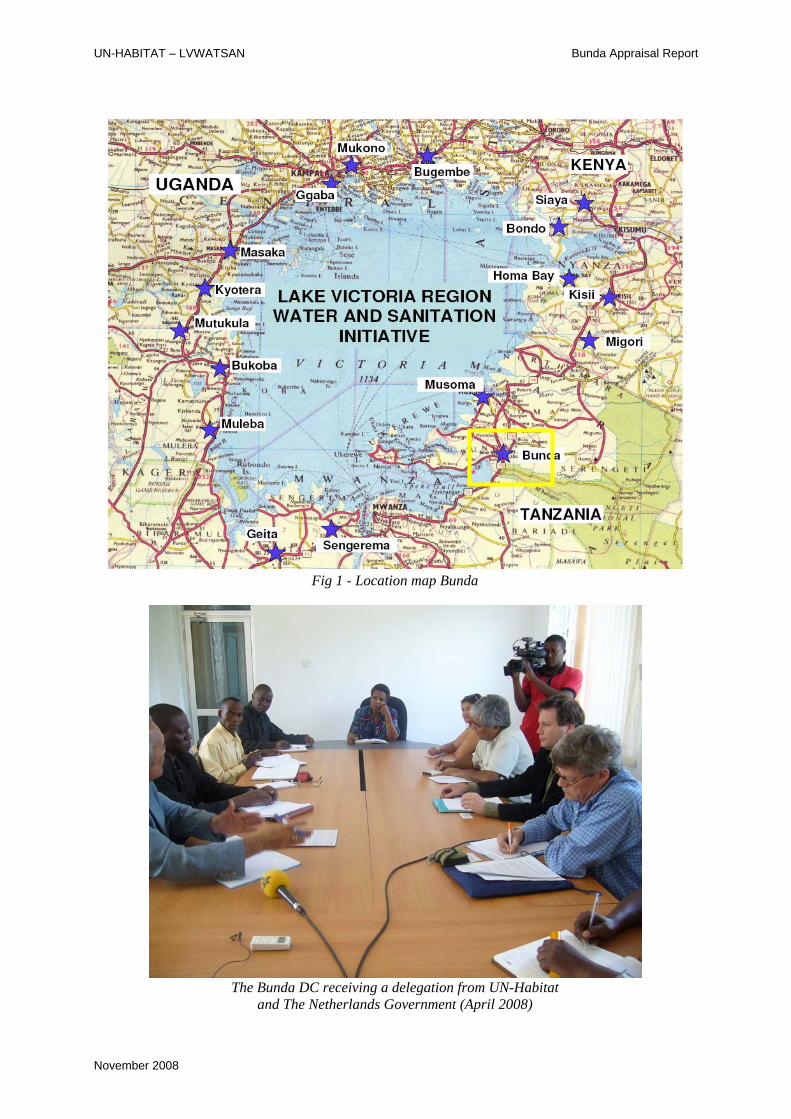
The Bunda DC receiving a delegation from UN-Habitat
and The Netherlands Government (April 2008)
November 2008
UN-HABITAT – LVWATSAN Bunda Appraisal Report
1 BUNDA TOWN PROFILE
1.1 Bunda District
Bunda District in Mara Region is bordered by Musoma (Rural) District in the North, Serengeti District in the East, Magu District in the South and Ukerewe District in the West and has its headquarters located in Bunda town. Annual rainfall in the district ranges between 900- 1300mm and the district covers an area of 3,088 km2 of which 200 km2 is occupied by Lake Victoria and 480 km2 by Serengeti National Park. The remaining part is dry land, which is used for farming and settlements.
Administratively, Bunda District is divided into 4 divisions, 20 wards, 86 villages and 14 sub villages, which makes Bunda Township. There are 470 hamlets. Population in the district was 258,930 people (2002 Census) and main occupations include agriculture, livestock and fishing. The annual population growth rate of the district stands at 1.8% and the average population density is 70 people/km2. Bunda town lies about 60 km from Musoma. There are a total of 42,605 households with an average size of 6.1 people per household in the district as a whole. A tourist attracting feature of the district is the vicinity of Serengeti National Park.
1.2 Bunda Town Council
Located 70 km south of Musoma, Bunda Town is the administrative headquarters of Bunda District. It was declared a township in the Government notice No. 353 of 17th September, 2004. The town is located within Bunda Ward, covering an area of approximately 86km2 consisting of five urban areas namely Bunda Mjini, Nyasura Balili, Nyamakokoto and Majengo, and four rural villages of Bunda Stoo, Balili, Migungani, and Manyamanyama with a total of 14 sub-villages.
Bunda Town Council is one among the five Local Authorities of Mara Region. It lies between latitudes 1°30'’ & 2°45'’ South and between Longitudes 33°39'’ and 34° 05'’ East. It is situated on the main Musoma-Mwanza road and has a population of 45,881 (Population Census 2002). It is the main commercial centre of the district. Social services available include schools, colleges, health centres, dispensaries and a district hospital. Electrical power is available through the national grid. Economic activities include agriculture, livestock, and cotton processing ginnery, trading and banking.
1.3 Bunda Urban Water Supply
Bunda Urban Water Supply Authority (BUWSA) was established on 21st June 2002 under the Water Works Ordinance Cap 281-Supp 62 of 4th November 1949. The water authority supplies the Bunda town ship and Guta, Tairo and Migungani villages located at the intake and along the transmission pipeline respectively. BUWSA is headed by the Board of Directors comprising 10 appointed members. The present Water Board is the second since the establishment of BUWSA. The first board started its functions on the 1st June 2003 and completed its period on 30th May 2006. The current board was appointed on 15th November 2006 and is expected to serve until November 2009. BUWSA top management is led by a Managing Director assisted by two Managers: the Technical Manager and the Commercial Manager who handles finance as well.
November 2008 1
UN-HABITAT – LVWATSAN Bunda Appraisal Report
1.4 Population
Bunda Town Council has now (2008) an estimated total population of about 45,000, based on the provisional census data of 2002 of 35,120 people, assuming a growth percentage of 4.3%.
Table 1: Bunda Population per Ward/Village and Projections
Ward/Village 2002 Rate % 2010 2025 Bunda Mjini 16,952 4.3 23,741 46,563 Nyasura 7,984 4.3 11,161 21,930 Nyamakokoto 8,638 4.3 12,097 23,727 Majengo 687 4.3 962 1,887 Balili 859 4.3 1,203 2,359
Sub-total urban 35,120 49,185 96,467 Migungani 1,726 1.8 1,991 2,648 Manyamanyama 2,092 1.8 2,413 3,210 Balili 1,659 1.8 1,914 2,546 Bunda Stoo 4,588 1.8 5,292 7,040
Sub-total rural 10,085 11,609 15,444 Total 45,185 60,794 111,911
Source: Based on Census results of 2002.
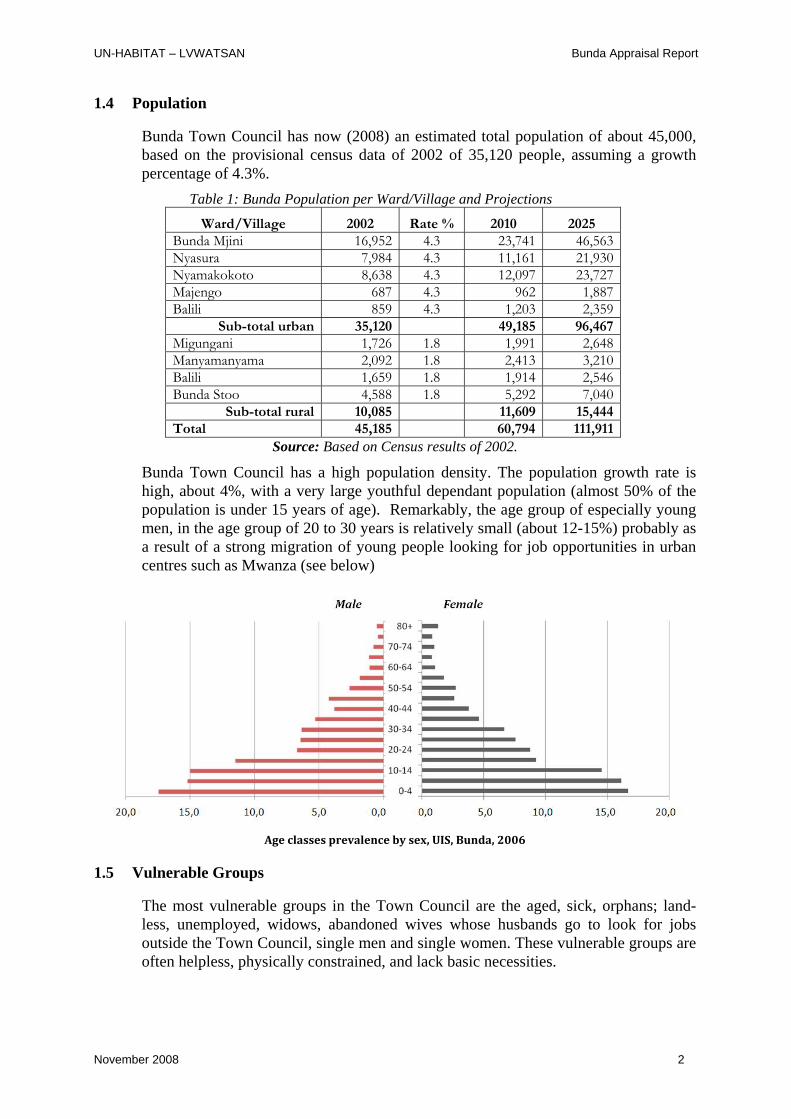
Bunda Town Council has a high population density. The population growth rate is high, about 4%, with a very large youthful dependant population (almost 50% of the population is under 15 years of age). Remarkably, the age group of especially young men, in the age group of 20 to 30 years is relatively small (about 12-15%) probably as a result of a strong migration of young people looking for job opportunities in urban centres such as Mwanza (see below)
Age classes prevalence by sex, UIS, Bunda, 2006
1.5 Vulnerable Groups
The most vulnerable groups in the Town Council are the aged, sick, orphans; land-less, unemployed, widows, abandoned wives whose husbands go to look for jobs outside the Town Council, single men and single women. These vulnerable groups are often helpless, physically constrained, and lack basic necessities.
November 2008 2
UN-HABITAT – LVWATSAN Bunda Appraisal Report
2 RESULTS OF THE URBAN INEQUITY SURVEY IN BUNDA
2.1 Urban Inequity Survey (UIS)
The UN-HABITAT Monitoring Systems Branch and the Water, Sanitation and Infrastructure Branch, in collaboration with the Central Bureaux of Statistics, has completed the implementation of Urban Inequities Survey in 17 secondary urban centres in Kenya (Migori, Kisii, Homa Bay, Siaya, and Bondo), Uganda (Ggaba, Mukono, Bunda, Masaka, Kyotera, and Mutukula), and Tanzania (Mutukula, Bukoba, Muleba, Geita, Sengerema, Bunda, and Musoma) as part of the LVWATSAN Programme. For each urban centre, information is available to monitor Target 10 – water and sanitation, as well as Target 11 – slum upgrading of the Millennium Development Goals (MDG). This information addresses different components of improved sanitation adequate water, such as sufficiency, safety and acceptability, affordability and physical accessibility and integrates comprehensively a gender component. They also address different components of other human settlements issues such as durable housing, overcrowding, security of tenure, sources of energy, social capital, income and expenditure, demographic characteristics, education, migration, employment, environment, livelihoods, child morbidity and mortality, maternal and child health, women empowerment, in short, a comprehensive set of information on a majority of MDG indicators.
Thus, the objective of the Urban Inequity Survey is, to establish a detailed overview of baseline data, expressed as coverage of basic services (water and sanitation), needs in term of access to infrastructure and other related living conditions. This enables the LVWATSAN Programme to closely monitor the impact of the interventions implemented. As a consequence this survey was carried out before any implementation started, and will be repeated at a later date when interventions have been completed.
2.2 Presentation of the UIS Survey, Availability of Results for Bunda
The wealth of information collected has been entered into a database system and is available in table, graphs and reporting formats. A comprehensive report is being prepared by the Monitoring Systems Branch of UN-Habitat. Meanwhile it is the intention that these data will be made available for use at Bunda Town Council level for all interested parties. For that purpose a project office will be opened in Bunda and the required facilities installed. This would be combined with an integrated GIS system, which includes Physical Planning tools for the town.
In this report some of the UIS results are presented in Tables (Annex 3) giving detailed information on the amount of coverage with water supply and sanitation for the residents of Bunda. These are arranged per Ward, giving a detailed insight in the ways people are provided with access to services.
2.3 Some of the UIS Results Highlighted
Water Supply
Supply system: Only 5.9% of the households receive water directly into the compound; for the low-income areas this is 3.9%, for middle and high-income
November 2008 3

UN-HABITAT – LVWATSAN Bunda Appraisal Report
areas this is only 15.3%; about 16.7% have to rely on public standpipes; the majority (44.9%) of the population relies on protected wells, the remainder on various unprotected sources. The term protected wells is rather misleading, as can be easily verified when an inspection is made. Many of these are protected only by some form of cover, and can easily be contaminated from surface water inflow, or also from underground flow of contaminated water. Many pit latrines are located very close to these shallow wells.
Time to collect water: For most people it takes less than 15 minutes to collect water; however, in a few areas, notably Manyamanyama, and Migungani it takes for about 45% of the population more than 60 minutes every day to collect water;
Women: In the majority of the cases it is the adult women who collect water (62%); men do the task in 8.6% of the households; children perform the duty in the remainder of the cases;
Disruption: Not many people receive piped water. However, these happy few are reporting almost daily disruptions in the supply.
Treatment at home: the majority (90.5%) of the households report that they treat water for drinking purposes, in most cases by boiling it;
Payment for piped water: 93% of households that have piped water, pay for it water, only 6.2% don’t pay;
Payment for water from all sources: Surprisingly payment for water from all types of sources seems to be quite accepted practice, as 75% of households pay; of course, water collected from surface water and rain water is not paid for.
Cost of water: most households pay per jerrycan, (TSh 200/-); the cost of water per month is modest,
Disposal of waste water: water used for cooking, bathing, laundry, etc. is disposed of in the street or in the compound in the majority of cases (73.8%); only 16.8% use soak-away pit.
Sanitation
Type of toilet facility; The majority of households in Bunda have a pit latrine with slab (20.4%), or without slab (35.6%) respectively; the figures for improved flush with septic tank, and VIP latrines are 24.3% and 14.2% respectively; in the low-income areas a significant proportion (43.2%) has to use a simple open pit without slab;
Sharing of toilet facility: Toilet facilities are not shared by 50.2% of the households, 11.5% by 2 households, and more households 38%. in low-income areas and 82.1% in the middle and higher income areas.
Payment for sanitation: Nobody seems to pay for usage of toilet facilities; 99.9% of the respondents said they did not pay.
Hygiene status: Frequency of cleaning the toilet: Not less than 63.7% of the toilets are never cleaned; daily cleaning is done in 33.9% of the cases, the remaining are cleaned a few times a week or only once a week (24.5%). Most complaints are about the bad smell of the facility (60.5%).
Drainage of facility: 78.9% of the toilets drain into soak-away pits
November 2008 4
UN-HABITAT – LVWATSAN Bunda Appraisal Report
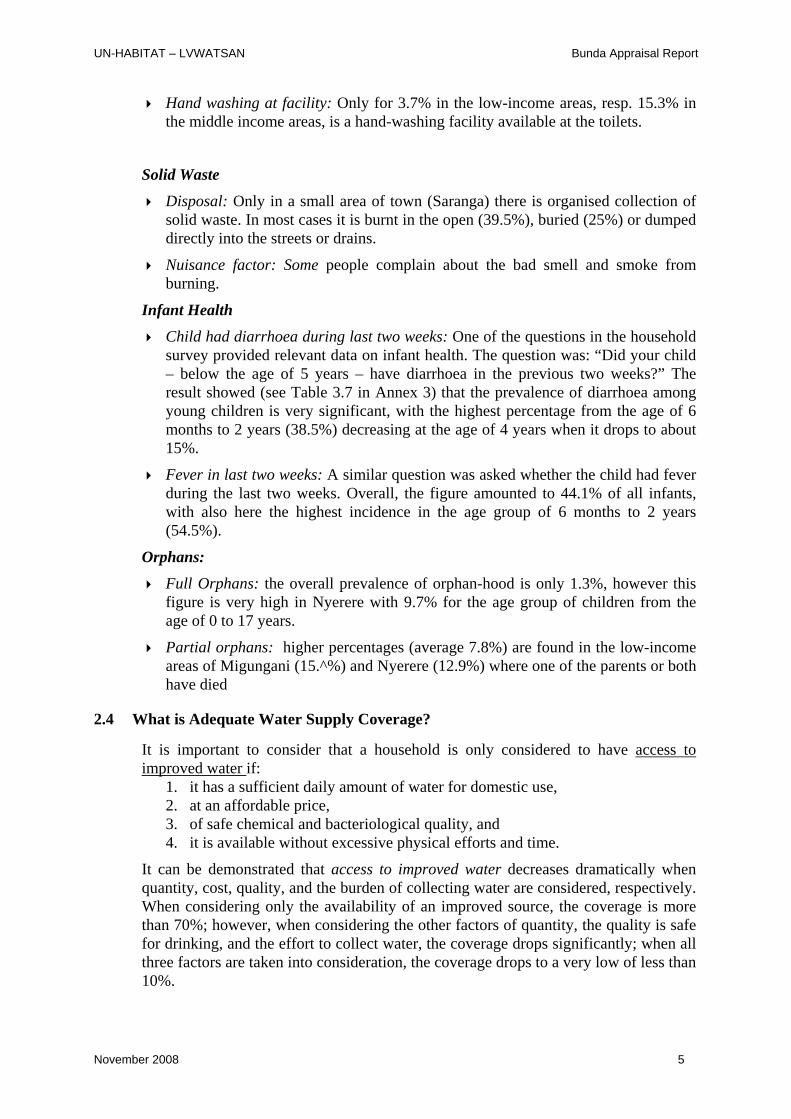
Hand washing at facility: Only for 3.7% in the low-income areas, resp. 15.3% in the middle income areas, is a hand-washing facility available at the toilets.
Solid Waste
Disposal: Only in a small area of town (Saranga) there is organised collection of solid waste. In most cases it is burnt in the open (39.5%), buried (25%) or dumped directly into the streets or drains.
Nuisance factor: Some people complain about the bad smell and smoke from burning.
Infant Health
Child had diarrhoea during last two weeks: One of the questions in the household survey provided relevant data on infant health. The question was: “Did your child – below the age of 5 years – have diarrhoea in the previous two weeks?” The result showed (see Table 3.7 in Annex 3) that the prevalence of diarrhoea among young children is very significant, with the highest percentage from the age of 6 months to 2 years (38.5%) decreasing at the age of 4 years when it drops to about 15%.
Fever in last two weeks: A similar question was asked whether the child had fever during the last two weeks. Overall, the figure amounted to 44.1% of all infants, with also here the highest incidence in the age group of 6 months to 2 years (54.5%).
Orphans:
Full Orphans: the overall prevalence of orphan-hood is only 1.3%, however this figure is very high in Nyerere with 9.7% for the age group of children from the age of 0 to 17 years.
Partial orphans: higher percentages (average 7.8%) are found in the low-income areas of Migungani (15.^%) and Nyerere (12.9%) where one of the parents or both have died
2.4 What is Adequate Water Supply Coverage?
It is important to consider that a household is only considered to have access to improved water if:
1. it has a sufficient daily amount of water for domestic use, 2. at an affordable price, 3. of safe chemical and bacteriological quality, and 4. it is available without excessive physical efforts and time.
It can be demonstrated that access to improved water decreases dramatically when quantity, cost, quality, and the burden of collecting water are considered, respectively. When considering only the availability of an improved source, the coverage is more than 70%; however, when considering the other factors of quantity, the quality is safe for drinking, and the effort to collect water, the coverage drops significantly; when all three factors are taken into consideration, the coverage drops to a very low of less than 10%.
November 2008 5
UN-HABITAT – LVWATSAN Bunda Appraisal Report
2.5 What is Adequate Provision of Sanitation?
A household is considered to have access to improved sanitation if it has: • An excreta disposal system, either a private toilet or a public toilet nearby;
having at least a sanitation slab, and preferably with a VIP system; • Shares such adequate sanitation with a reasonable number of people
(maximum of two households), being available for all household members
The UIS Survey in Bunda clearly shows (see Annex 3) that access to improved sanitation decreases dramatically when the number of households sharing the facility is considered. This is demonstrated in the graph below. For Bunda (2006) about 55% of the population is using pit latrines (20% with concrete slab and 35% without slab). However, not less than 50% is sharing the facility with 2 or more households. It means that more than 50% of the population has no access to improved sanitation. Even this last figure is not reflecting the reality that most of the pit latrines cannot be considered to be ‘improved sanitation’. Other factors such as the type and quality of the slab covering the pit, presence of VIP vent pipe, quality and permanence of the superstructure, cleanliness, access, degree of privacy, and other factors dictated by local cultural customs, all play an important role.
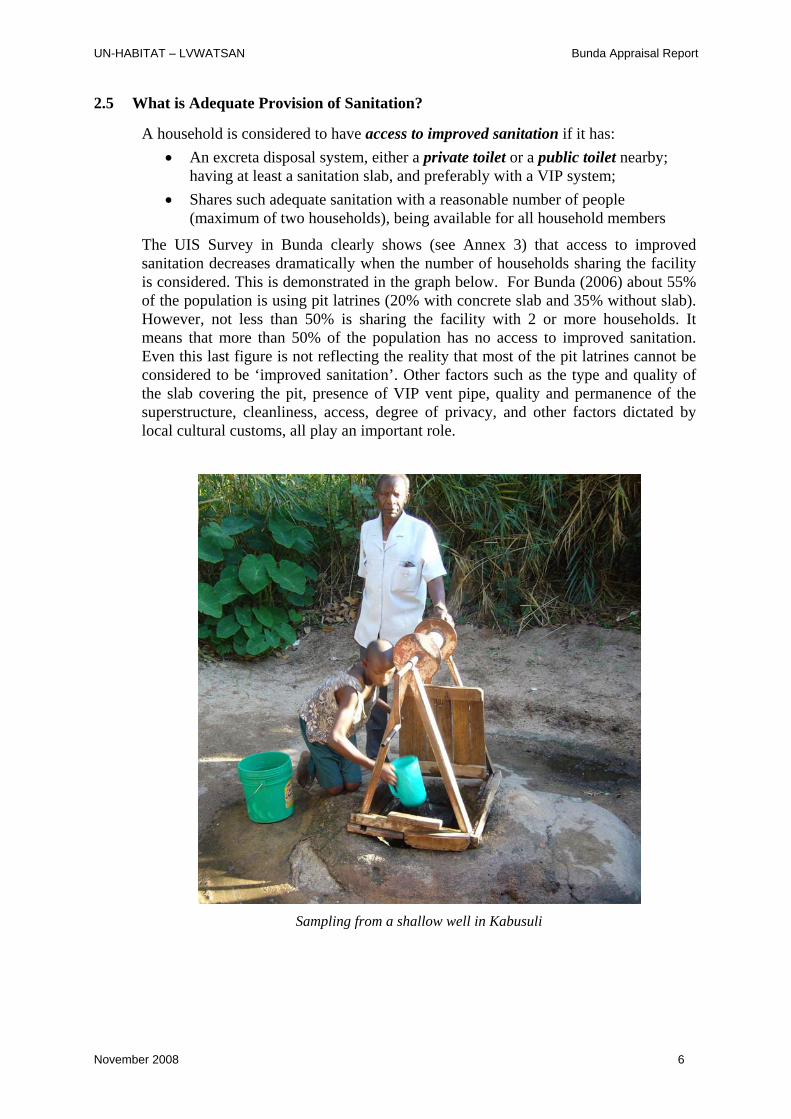
Sampling from a shallow well in Kabusuli
November 2008 6
UN-HABITAT – LVWATSAN Bunda Appraisal Report
3 WATER SUPPLY
3.1 Institutional Background
Bunda Urban Water Supply Authority (BUWSA) was established on 21st June 2002 under the Water Works Ordinance Cap 281-Supp 62 of 4th November 1949. The water authority supplies Bunda Township and Guta, Tairo and Migungani villages located at the intake and along the transmission pipeline, respectively. BUWSA is headed by the Board of Directors comprising 10 appointed members. The present Water Board is the second since the establishment of BUWSA. The first board started its functions on the 1st June 2003 and completed its term on 30th May 2006. The current board was appointed on 15th November 2006 and is expected to serve until November 2009. BUWSA management is led by a Managing Director assisted by two managers: the Technical Manager and the Commercial Manager who handles finance as well.
3.2 Technical Review of the Water Supply System (NB. Some of the relevant sections below have been copied from the report prepared by NWSC-External Services Unit under contract for UN-HABITAT – August 2008)
3.2.1 General Overview
Bunda water supply scheme was constructed in 1971 to serve Bunda town and the surrounding villages of Guta, Tairo, Kung’ombe, Kabasa, Misisi, Ligamba and Kanzugu. In general, the Bunda Urban Water Supply Area has a very old infrastructure and equipment that is run down, dilapidated and in need of urgent repair or replacement. The water supply system is operational but is facing challenges of meeting increased water demand due to rapid population growth and increased socio-economic activities. As such, the amount of water being abstracted is totally inadequate and the transmission main is undersized. The current water production capacity is estimated at 1,000 m3/day against a demand of about 6,500 m3/day. Due to the long distance between the pump station and the distribution network, water is pumped twice before the main reservoir and after that there are two more booster stations for supplying some of the higher elevated areas. Currently the water production levels are inadequate and the town is experiencing high levels of water stress. Most of the population depends on shallow wells and some springs. The Government of Tanzania (GOT) has embarked on infrastructure development and new pumps are being procured. However this will only partially address the problem since there is no adequate transmission main to transmit the water. Most of the distribution network has old pipelines with leakages and a high level of illegal use. Unaccounted-for-Water is very high at 60%. The need for improving the transmission and distribution network cannot be underscored. Currently BUWSA runs a deficit budget mainly due to its high energy pumping costs and low levels of revenue collection..
3.2.2 Management of BUWSA
The managers of BUWSA have a high level of competence, experience and skills but there is still need for building capacity in core areas coupled with targeted performance improvement initiatives in order to advance BUWSA’s operations. There is also need for recruitment and training of competent junior staff. The stakeholders especially the political leadership have a lot of interest in the scheme management and
November 2008 7
UN-HABITAT – LVWATSAN Bunda Appraisal Report
it would be vital if they visited one or two towns elsewhere in the LVWATSAN programme to see for themselves how utility management can be improved.
At present only 18.6% of the population within the BUWSA supply area is served. The total production at the moment is less than 1,000 m3/day. It was not possible to ascertain the design capacity since the pumps had no plates and no operational manuals. The water demand currently stands at about 6,500 m3/day as reported in the Feasibility Study report. The 6’’ transmission main from the Lake severely restricts the amount of water that can be pumped from the Lake. With such a high demand and inadequacy to produce or transmit more, Bunda town can be termed as highly water stressed. In addition to this, the level of non-revenue water (NRW) is extremely high (about 60 %).
3.2.3 Main Components of the existing Bunda Water Supply System
Raw Water Intake & Guta Pumping Station: Raw water is abstracted from Lake Victoria via two GI pipes of DN 150 mm, extending about 100 m into the lake. Like all intakes around the shores of Lake Victoria, the Guta intake was hit by the drop of lake water levels since 2005, and poor water quality. The intake was extended 150 meters into the lake and submersible pumps installed to mitigate against the dropping lake levels. Water is pumped directly to Migungani Booster Station without treatment.
The raw water source is heavily polluted (Faecal coliform counts up to 4800/100 ml) due to the many Hippos within the lake and the cows that graze within the vicinity and drink water from close by. The communities tapping water directly from the pumping mains are at great risk of water borne diseases.
Mechanical condition of the pumping units: these are in fair condition but the electrical units need attention. The energy consumption was observed to be very high with energy efficiency of about 1.7 KWh/m3. This is due to the small diameter of the transmission mains and many bends at pumping house outlets resulting into high head and friction losses. The various booster stations in the distribution network needed to bring water to the higher parts of Bunda also increase energy costs. The total monthly electricity pumping costs is about TSh 8 million, which is far in excess of the monthly water sales revenue of about TSh 2.5 million, raising challenges of system sustainability. According to the area manager, new pumps have been procured and delivered for the newly proposed Nyabehu intakes & treatment works.
Water Treatment: There is no water treatment in Bunda apart from disinfection by chlorine dosing at the Bomani hills main reservoirs. There were no dosing records and the effectiveness of chlorine dosing was doubtful.
Transmission Mains: There is one rising main of size 150 mm uPVC, with a total length of about 22 km. Water is abstracted 14 km away from the town. The total pipeline network has a length of 57.5 kms as follows:- o 6” DN = 25 km o 4” DN = 8 km o 3” DN = 9.2 km o 2” DN = 9.6 km o 11/2” DN = 4.1 km o 1” DN = 1.6 km o 3/4” DN = 10 km (privately owned)
November 2008 8
UN-HABITAT – LVWATSAN Bunda Appraisal Report
Water production is measured by the bulk water meter installed at Guta pumping station. There are also two bulk meters at the Migungani Booster stations along the transmission mains. There were no records for bulk meter calibration raising some doubts on their accuracy. Frequent bursts (also by vandalism) were reported on the transmission mains.
Storage Tanks: There are various small water towers at Guta (45 m3), Tairo (45 m3) Migungani (45 m3), Mugaja (45 m3), Manyamanyama (90 m3), and Misisi (135 m3). The main reservoirs (3 No. each of capacity 225 m3) located at Bomani Hills in Bunda town. The tanks are made of concrete blocks and most are in poor condition with surface cracks leaking. They all lack water levels and frequently experience overflows increasing unnecessary physical water losses. The main storage reservoirs at Bomani hill are suitable to supply areas within pressure zone A (below 1240 m amsl). A new tank has been proposed at Kaswaka Hills (1300 m asl) to serve pressure zone B (between 1240 & 1300 m amsl).
Distribution Network: The distribution network is divided into two pressure zones A and B. Zone A with about 400 connections is comprised of Ikuzu road, Ukerewe road, Kabarimu, Kiabakari road, Balili, Tairo and Guta villages. Zone B has about 600 connections and is comprised of Bunda Stoo, Sabasaba road, Posta road, Nyasura Boma quarters and Boma road. Manyamanyama hospital that is going to be connected soon will also be part of Zone B. Most of the network is old with frequent leaks and bursts. Piped water service coverage is estimated at 18%. Metering efficiency is low at 40% resulting into water wastage and high non-revenue water (NRW) estimated at 60%. For example one public kiosk at Tairo primary school was being charged a flat rate of TSh 8,000 yet it sells about 20,000 jerry cans of water per month at TSh 100 per 20 litre jerrycan. There are no maps indicating the distribution network layout which complicates network operation and management. The field team could not trace pipelines that used to supply places like Manyamanyama water tower. The network mainly comprises of AC, GI, PE and uPVC pipes ranging in diameter from 25 to 100 mm. It is estimated that the total length of the existing main distribution network is approximately 57.5 km. The operations and maintenance team lack sufficient tools to effectively carry out their field tasks. Water supply is intermittent and most areas do not receive water at all.
Water Booster Stations: There are three booster stations (Migungani, Mugaja & Ushashi) within the water supply system. Migungani is the biggest booster station with two pumps (Q = 70 m3/h, H = 90 m) and a storage tank of 45 m3. It pumps water along the transmission line to Bomani Hill reservoirs. However, the pumps are idle most of the time due to inadequate water supply from Guta intake. There is a mismatch between the Guta intake pumps and the Migungani booster station pumping capacity that need urgent attention to reduce water supply shortages. There was apparent evidence of overflows around the booster station.
Mugaja Booster station is newly refurbished with one new vertical pump (Q = 32 m3/h, H = 138 m) and a suction reservoir of 45 m3 (Plate 22). It receives water from the Bomani reservoirs and is meant to supply the Manyamanyama water tower and the surrounding areas. At the time of the visit the pump was not in operation as the old pumping main to Manyamanyama was still being traced. The Ushashi booster has one pump and pumps water to Misisi reservoir (135 m3). Water supply to the station is on and off. The pump house was in a messy state and the pump attendant was found cooking right next to the new pump At all the
November 2008 9
UN-HABITAT – LVWATSAN Bunda Appraisal Report
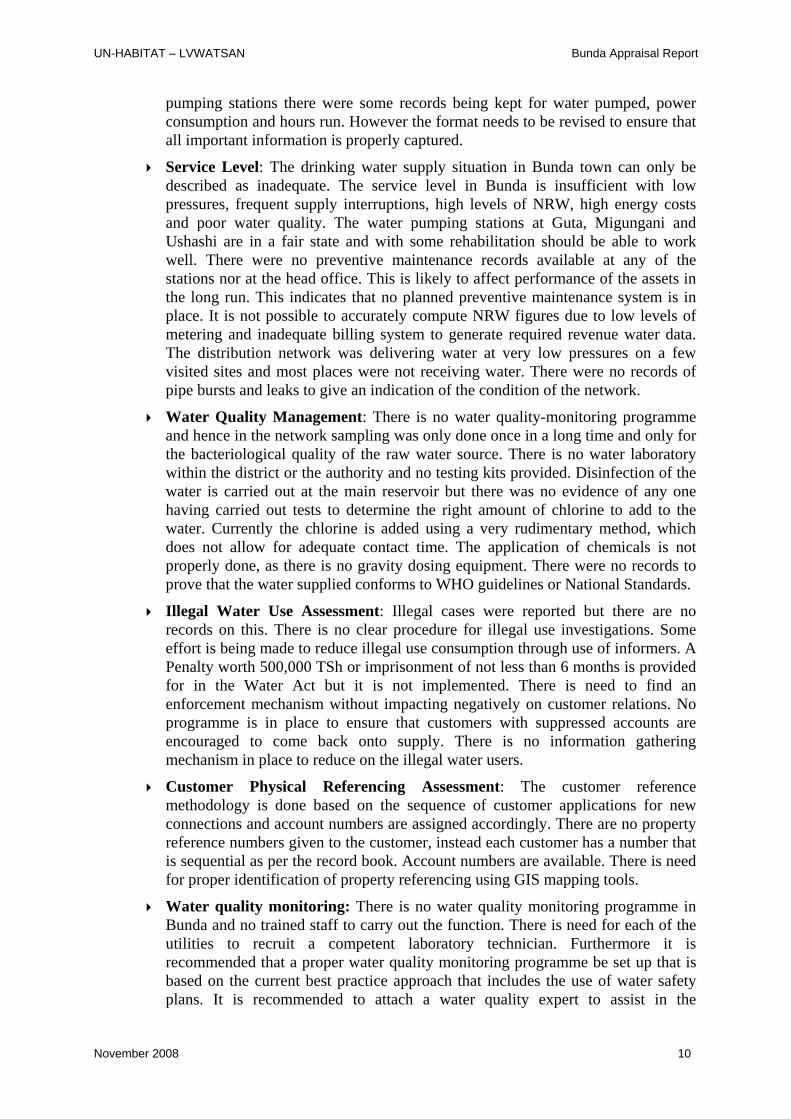
pumping stations there were some records being kept for water pumped, power consumption and hours run. However the format needs to be revised to ensure that all important information is properly captured.
Service Level: The drinking water supply situation in Bunda town can only be described as inadequate. The service level in Bunda is insufficient with low pressures, frequent supply interruptions, high levels of NRW, high energy costs and poor water quality. The water pumping stations at Guta, Migungani and Ushashi are in a fair state and with some rehabilitation should be able to work well. There were no preventive maintenance records available at any of the stations nor at the head office. This is likely to affect performance of the assets in the long run. This indicates that no planned preventive maintenance system is in place. It is not possible to accurately compute NRW figures due to low levels of metering and inadequate billing system to generate required revenue water data. The distribution network was delivering water at very low pressures on a few visited sites and most places were not receiving water. There were no records of pipe bursts and leaks to give an indication of the condition of the network.
Water Quality Management: There is no water quality-monitoring programme and hence in the network sampling was only done once in a long time and only for the bacteriological quality of the raw water source. There is no water laboratory within the district or the authority and no testing kits provided. Disinfection of the water is carried out at the main reservoir but there was no evidence of any one having carried out tests to determine the right amount of chlorine to add to the water. Currently the chlorine is added using a very rudimentary method, which does not allow for adequate contact time. The application of chemicals is not properly done, as there is no gravity dosing equipment. There were no records to prove that the water supplied conforms to WHO guidelines or National Standards.
Illegal Water Use Assessment: Illegal cases were reported but there are no records on this. There is no clear procedure for illegal use investigations. Some effort is being made to reduce illegal use consumption through use of informers. A Penalty worth 500,000 TSh or imprisonment of not less than 6 months is provided for in the Water Act but it is not implemented. There is need to find an enforcement mechanism without impacting negatively on customer relations. No programme is in place to ensure that customers with suppressed accounts are encouraged to come back onto supply. There is no information gathering mechanism in place to reduce on the illegal water users.
Customer Physical Referencing Assessment: The customer reference methodology is done based on the sequence of customer applications for new connections and account numbers are assigned accordingly. There are no property reference numbers given to the customer, instead each customer has a number that is sequential as per the record book. Account numbers are available. There is need for proper identification of property referencing using GIS mapping tools.
Water quality monitoring: There is no water quality monitoring programme in Bunda and no trained staff to carry out the function. There is need for each of the utilities to recruit a competent laboratory technician. Furthermore it is recommended that a proper water quality monitoring programme be set up that is based on the current best practice approach that includes the use of water safety plans. It is recommended to attach a water quality expert to assist in the
November 2008 10

UN-HABITAT – LVWATSAN Bunda Appraisal Report
establishment of systems for proper water quality monitoring. However, prior to this, the necessary water quality testing kits should be procured as a minimum.
Alternative Sources of Water Supply: Alternative sources of supply include gravity flow schemes, boreholes and shallow wells. Bunda teachers training college is currently being supplied by Nyaruga gravity scheme, tapping springs in the Bunda Hills. From the discussions held with the District Leaders and Water Engineers, it seems likely there is potential for supplying the town with gravity water schemes from groundwater. This potential should be exploited to save energy pumping and treatment costs and ensure sustainable water supply to the town.
Sewerage Services: Bunda town has no sewerage system yet it is a rapidly
growing town with good physical urban planning. There is potential for increasing the sanitation coverage and condominium sewage as a pilot can be considered.
3.3 Rehabilitation of Bunda Water Supply Infrastructure
Rehabilitation and expansion of the water supply in Bunda is a matter of high urgency and will require substantial investments. However, new investments will only be effective and achieve their objectives if they are accompanied by organisational improvement measures. These measures should focus on improvement of planning and management, and improvement of operation and maintenance in all its aspects. Assuming organisational improvement can be achieved; additional investments will be effective and shall improve the water supply conditions in Bunda. The aims of the investments are to gradually improve the water supply situation by rehabilitating existing facilities so that additional investments can be made effectively to reach full coverage. In Table 6 the required investments in water production and water distribution are presented.
3.4 Tariffs and Metering
The present and new adopted tariffs for water consumption are as follows:
CATEGORY BLOCK TARIFF
(TSh) PROGRESSIVE TARIFF (TSh)
1 20 l Jerrycan 20 20 2 Domestic 350 500 3 Institutional 350 600 4 Commercial 250 500 5 Industrial - - 6 Domestic flat rate 4,800 5,000
3.5 Other Potential Raw Water Sources
A number of alternative options were reviewed. However, the only possible options is actually to investigate the groundwater potential. It is expected that the area in and around Bunda Hills has good groundwater potential. The rocks outcropping are granitic and of Precambrian age. Some very distinct North-South running lineations can be seen on the satellite image, which represent fracture zones in the granitic rocks. Two areas were visited: A. The valley in the northern part of the image forms the catchment for the water
supply (Nyaruga Scheme) of the Teachers’ Training College. Water is captured by November 2008 11
UN-HABITAT – LVWATSAN Bunda Appraisal Report
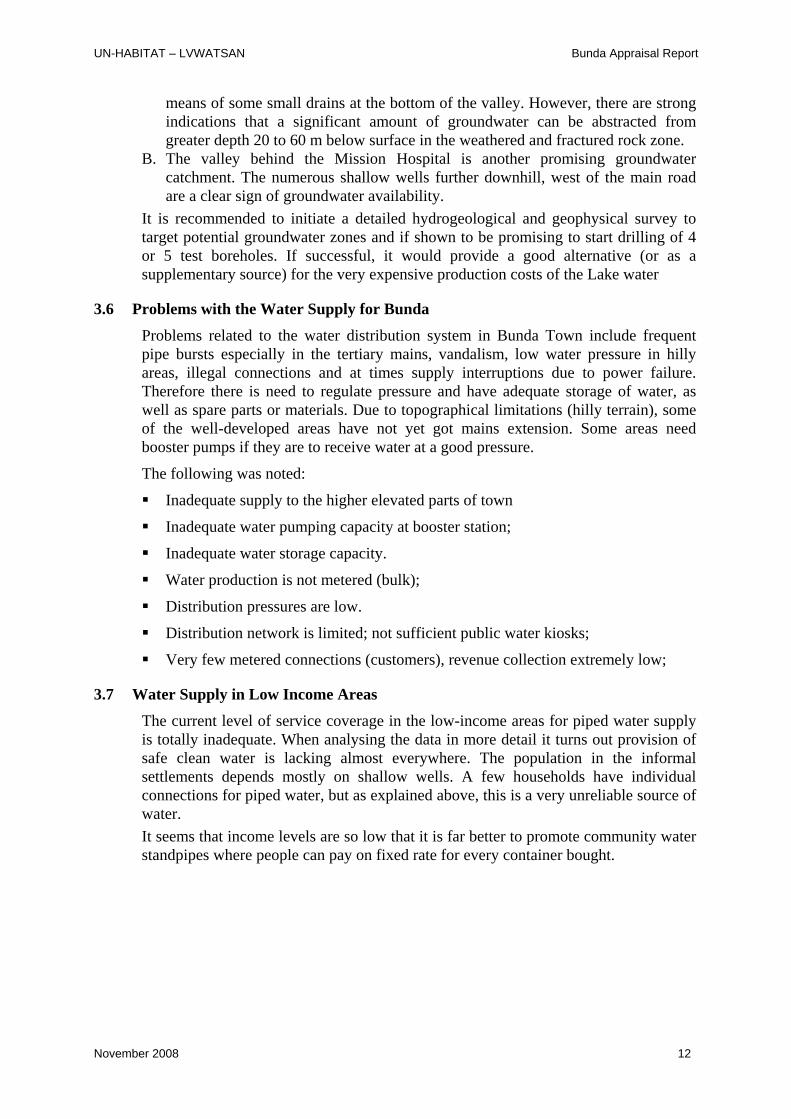
means of some small drains at the bottom of the valley. However, there are strong indications that a significant amount of groundwater can be abstracted from greater depth 20 to 60 m below surface in the weathered and fractured rock zone.
B. The valley behind the Mission Hospital is another promising groundwater catchment. The numerous shallow wells further downhill, west of the main road are a clear sign of groundwater availability.
It is recommended to initiate a detailed hydrogeological and geophysical survey to target potential groundwater zones and if shown to be promising to start drilling of 4 or 5 test boreholes. If successful, it would provide a good alternative (or as a supplementary source) for the very expensive production costs of the Lake water
3.6 Problems with the Water Supply for Bunda
Problems related to the water distribution system in Bunda Town include frequent pipe bursts especially in the tertiary mains, vandalism, low water pressure in hilly areas, illegal connections and at times supply interruptions due to power failure. Therefore there is need to regulate pressure and have adequate storage of water, as well as spare parts or materials. Due to topographical limitations (hilly terrain), some of the well-developed areas have not yet got mains extension. Some areas need booster pumps if they are to receive water at a good pressure.
The following was noted:
Inadequate supply to the higher elevated parts of town
Inadequate water pumping capacity at booster station;
Inadequate water storage capacity.
Water production is not metered (bulk);
Distribution pressures are low.
Distribution network is limited; not sufficient public water kiosks;
Very few metered connections (customers), revenue collection extremely low;
3.7 Water Supply in Low Income Areas
The current level of service coverage in the low-income areas for piped water supply is totally inadequate. When analysing the data in more detail it turns out provision of safe clean water is lacking almost everywhere. The population in the informal settlements depends mostly on shallow wells. A few households have individual connections for piped water, but as explained above, this is a very unreliable source of water. It seems that income levels are so low that it is far better to promote community water standpipes where people can pay on fixed rate for every container bought.
November 2008 12
UN-HABITAT – LVWATSAN Bunda Appraisal Report
4 SEWERAGE AND SANITATION
4.1 Available Sanitation
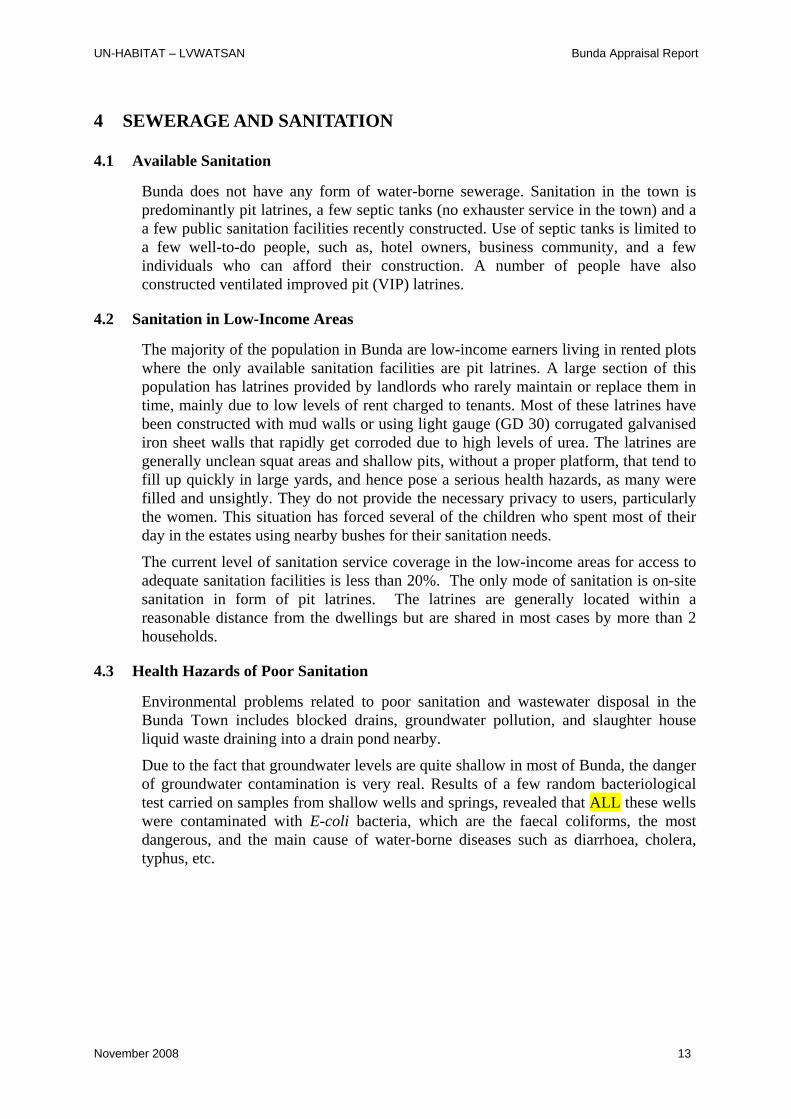
Bunda does not have any form of water-borne sewerage. Sanitation in the town is predominantly pit latrines, a few septic tanks (no exhauster service in the town) and a a few public sanitation facilities recently constructed. Use of septic tanks is limited to a few well-to-do people, such as, hotel owners, business community, and a few individuals who can afford their construction. A number of people have also constructed ventilated improved pit (VIP) latrines.
4.2 Sanitation in Low-Income Areas
The majority of the population in Bunda are low-income earners living in rented plots where the only available sanitation facilities are pit latrines. A large section of this population has latrines provided by landlords who rarely maintain or replace them in time, mainly due to low levels of rent charged to tenants. Most of these latrines have been constructed with mud walls or using light gauge (GD 30) corrugated galvanised iron sheet walls that rapidly get corroded due to high levels of urea. The latrines are generally unclean squat areas and shallow pits, without a proper platform, that tend to fill up quickly in large yards, and hence pose a serious health hazards, as many were filled and unsightly. They do not provide the necessary privacy to users, particularly the women. This situation has forced several of the children who spent most of their day in the estates using nearby bushes for their sanitation needs.
The current level of sanitation service coverage in the low-income areas for access to adequate sanitation facilities is less than 20%. The only mode of sanitation is on-site sanitation in form of pit latrines. The latrines are generally located within a reasonable distance from the dwellings but are shared in most cases by more than 2 households.
4.3 Health Hazards of Poor Sanitation
Environmental problems related to poor sanitation and wastewater disposal in the Bunda Town includes blocked drains, groundwater pollution, and slaughter house liquid waste draining into a drain pond nearby.
Due to the fact that groundwater levels are quite shallow in most of Bunda, the danger of groundwater contamination is very real. Results of a few random bacteriological test carried on samples from shallow wells and springs, revealed that ALL these wells were contaminated with E-coli bacteria, which are the faecal coliforms, the most dangerous, and the main cause of water-borne diseases such as diarrhoea, cholera, typhus, etc.
November 2008 13
UN-HABITAT – LVWATSAN Bunda Appraisal Report
5 SOLID WASTE AND DRAINAGE
5.1 Solid Waste
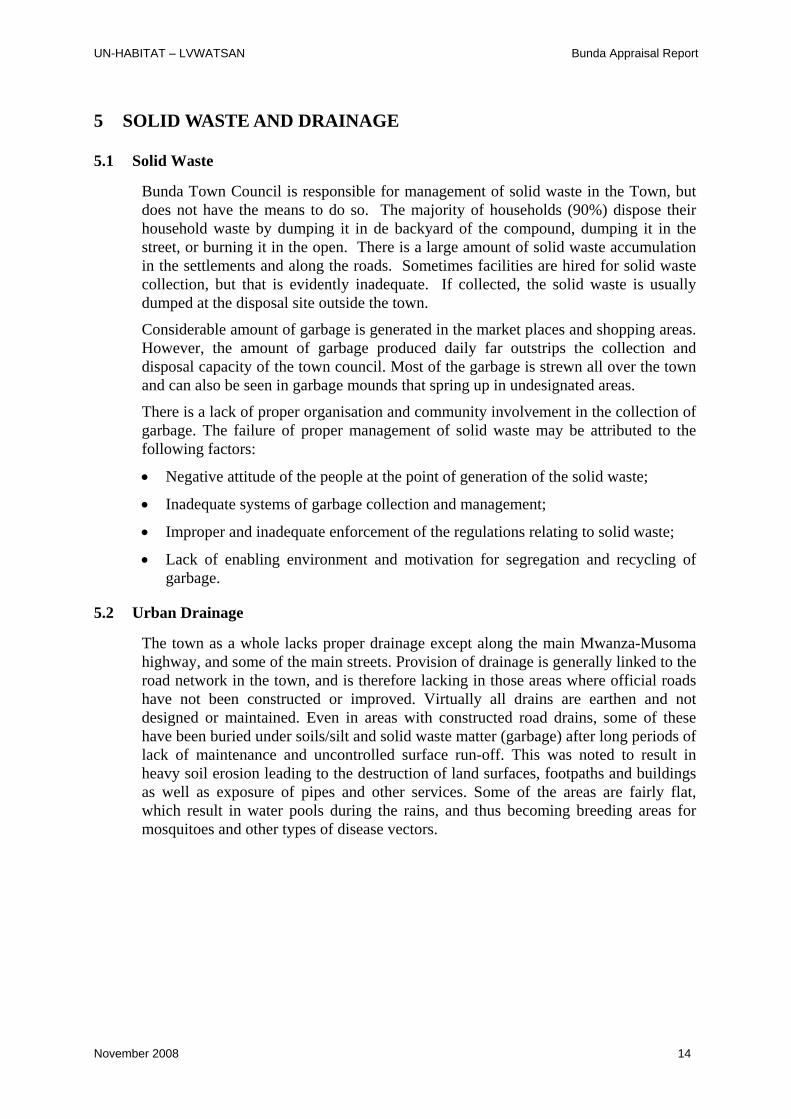
Bunda Town Council is responsible for management of solid waste in the Town, but does not have the means to do so. The majority of households (90%) dispose their household waste by dumping it in de backyard of the compound, dumping it in the street, or burning it in the open. There is a large amount of solid waste accumulation in the settlements and along the roads. Sometimes facilities are hired for solid waste collection, but that is evidently inadequate. If collected, the solid waste is usually dumped at the disposal site outside the town.
Considerable amount of garbage is generated in the market places and shopping areas. However, the amount of garbage produced daily far outstrips the collection and disposal capacity of the town council. Most of the garbage is strewn all over the town and can also be seen in garbage mounds that spring up in undesignated areas.
There is a lack of proper organisation and community involvement in the collection of garbage. The failure of proper management of solid waste may be attributed to the following factors:
• Negative attitude of the people at the point of generation of the solid waste;
• Inadequate systems of garbage collection and management;
• Improper and inadequate enforcement of the regulations relating to solid waste;
• Lack of enabling environment and motivation for segregation and recycling of garbage.
5.2 Urban Drainage
The town as a whole lacks proper drainage except along the main Mwanza-Musoma highway, and some of the main streets. Provision of drainage is generally linked to the road network in the town, and is therefore lacking in those areas where official roads have not been constructed or improved. Virtually all drains are earthen and not designed or maintained. Even in areas with constructed road drains, some of these have been buried under soils/silt and solid waste matter (garbage) after long periods of lack of maintenance and uncontrolled surface run-off. This was noted to result in heavy soil erosion leading to the destruction of land surfaces, footpaths and buildings as well as exposure of pipes and other services. Some of the areas are fairly flat, which result in water pools during the rains, and thus becoming breeding areas for mosquitoes and other types of disease vectors.
November 2008 14
UN-HABITAT – LVWATSAN Bunda Appraisal Report
6 URBAN PHYSICAL PLANNING
6.1 Earlier Attempts at Physical Planning
The first Physical Plan was developed in the 1970s and is of course entirely outdated. A renewed attempt to prepare a Physical Development Plan for Bunda was initiated some years ago, but was not completed due to lack of funds to continue the exercise.
A Physical Plan needs to be based on a well-articulated concept for the growth and development of Bunda town. Secondly, the Plan should not only deal with land use matters, but also incorporate other important factors facing the town such as environmental and socio-economic issues. Thirdly, the plan needs to take into account the issue of land ownership in the town. The demarcation of all lands, especially those, which are privately owned, is a precondition for any successful physical planning exercise.
6.2 Need for Physical Planning
Discussing key development issues facing the town of Bunda, it emerges that the town has been under-privileged in resources allocation by the Government just like many other smaller towns. The land issue can be singled out as the main impediment for proper development and management of the town. Most of the land is privately owned and compulsory acquisition of land for urban expansion and uses is strongly opposed by land-owners. This suggests the need for immediate review of the land policy and land tenure systems in Uganda especially as it pertains to areas under jurisdiction of urban authorities.
6.3 Way Forward
The urban planning exercise should begin with the production of issue and thematic maps, a complete profile of the town covering socio-economic (mainly from the UIS survey), environmental, ecological, and structural characteristics, organisation of a Stakeholder meeting for the town of Bunda to develop a shared future vision for the town, and translation of the shared future vision into a spatial form. This will entail formulation of Conceptual Plans and Final plans for the future of the town. Training and capacity building for all of the above tasks will be provided, as well as operational facilities (computers, other hardware and software) for efficient operation of the Planning Office.
November 2008 15
UN-HABITAT – LVWATSAN Bunda Appraisal Report
7 ORPHANS AND OTHER VULNERABLE GROUPS
7.1 The Impact of the HIV/AIDS epidemic in Bunda
While at National levels there is remarkable success in terms of reduced prevalence of HIV/AIDS, Bunda Town council like in most of the other developing semi-rural towns the problem is still at significant levels (Bunda District Hospital, Bunda Town Council Health Centre). Poverty, rapidly increasing urbanisation associated with rapidly changing lifestyles and few programs targeting high risk and vulnerable populations in urban areas are some of the reasons for the persistently high prevalence in urban setting.
The disease has resulted into adverse health and socio-economic outcomes and challenges. HIV/AIDS has had far reaching impact on our society and economy in the council which include among others: a) Large and ever growing number of orphans that have overwhelmed the traditional
social support systems leading to a big number of street children and school dropouts.
b) Withdrawal of children from school, especially the girl child to care for the sick c) Rise in poverty levels attributed to the death of household heads d) Cost on treatment and funerals exceeds the annual income of the family e) Rise in child-, female- and elderly-headed families.
7.2 Challenges a) Co-ordination is still a problem in spite of having an agreed upon co-ordination
mechanism. b) Lack of data for proper planning. There is need to improve on data management
including collection, storage, analysis and use. This will require equipping the co-ordination office with computers and its accessories.
c) Increasing numbers of Aids orphans d) Resource mobilisation to support HIV programs. Much as enormous resources
have been poured into this country to fight HIV/AIDS, the urban areas where HIV/AIDS prevalence rates are higher have not been adequately supported by the Central Government and donors.
e) Poverty f) Complacency and persistent risky sexual behaviour
7.3 Strategies to Address HIV/AIDS
In view of the above challenges, the strategy in the mid term would be: a) Allocation of funds to available prevention, mitigation and measures and build
capacity of the infected and affected members of the community b) Strengthening and improving co-ordination of HIV/AIDS activities in the council c) Development of an action plan for orphans and other vulnerable children. d) Carrying out a baseline survey and establishing a data bank on HIV/AIDS infected
and affected members of the community and updating the data bank of HIV/AIDS service providers and organisations in the council.
November 2008 16
UN-HABITAT – LVWATSAN Bunda Appraisal Report
7.4 HIV/AIDS Orphans
The AIDS pandemic has been serious in particular in the Lake Victoria basin, and more than in most other parts of East Africa. The high historical prevalence rates in the Lake Victoria region are commonly attributed to a mix of factors, including the fact that the AIDS pandemic peaked there relatively early; also the fact that the major overland transport route from Kenya to Mwanza and Rwanda and beyond, passes right through Bunda; the mobility associated with fishing, etc. In Uganda, although the prevalence rate has gone down in recent years, there are still over 1.5 million people (5.4%) living with HIV/AIDS and more than 800,000 children have been orphaned.
HIV/AIDS orphans are one of the most vulnerable groups in the area. They face numerous hardships resulting from poverty, insufficient food, low nutritional standards, poor housing and lack of access to basic services, such as water and sanitation. To compound these problems, they often live on the periphery of the towns where the institutions which cater to their needs, such as schools and health centres have no access to the town infrastructure and therefore lack basic amenities such as water and toilet facilities.
7.5 The Impact of HIV/AIDS on Land Rights
With respect to widows
There is a pervasive sense of women’s powerlessness in the face of profound gender discrimination. For example women who are barely able to act in their own interests to prevent threats to their land rights. Even very elementary measures, such as consulting local authorities or educating themselves as to how the land office works, seem beyond their capacity. Widows appear isolated and dependent for information from men whom they do not even trust. Due to their place in society as well as lack of social capital, generally widows are unable to address land problems and claim their rightful inheritance.
With respect to orphans
In homes where all adults have died and children are being taken care of by other relatives, everything that belonged to that family will be taken by whoever is now taking care of the children. In most cases the children are left with the grandparents or with uncles. It is clear that to some extent land grabbing from widows and orphans and possibly from AIDS widows and AIDS orphans in particular, has become an accepted practice, even in the absence of specific examples from their own experience or observation.
7.6 Existing Facilities in Bunda for Orphans
There are several poorly equipped public and private institutions in Bunda which are struggling to cater to the needs of orphans in terms of providing services and support such as food, clothing, education and health care. However, lack of access to sanitation and water supply poses severe constraints to these institutions and limits their capacity to provide a habitable and hygienic environment for the orphans and other vulnerable persons, who are so dependent on them for their basic needs. There are several community groups such as women and youth groups
The number of orphans and other vulnerable children has increased in the recent years and it has been established that there are currently over 300 orphans in Bunda. The
November 2008 17
UN-HABITAT – LVWATSAN Bunda Appraisal Report
majority of these are found in the low-income areas; this situation is attributed to the following factors: Increased poverty level among families affected and infected by HIV/Aids Increased dependency i.e. increased number of household members due to influx
of orphans left by relatives into families. Collapse of the traditional support system for orphans and other vulnerable
children, i.e. there is no longer sharing of orphans among relatives Food insecurity among families affected and infected by HIV/Aids due to poor
weather conditions and low soil productivity. Poor health and living conditions due to lack of clean water proper sanitation and
hygiene.
Following discussions with the local leaders in Bunda, and with health centres, the following needs can be identified: 1. Provide technical and financial supports to establish, maintain and manage rain
water harvesting tanks to orphanages, schools and health centres; 2. Provide technical and financial support to establish a micro credit /revolving fund
to women groups supporting orphans to replicate the practice at household level.
The focus of the project will be on the institutions, comprising mainly schools, health care centres and orphanages which are working to cater to the basic needs of the orphans and other vulnerable persons.
7.7 Recommendations for follow-up actions • Mobilise support for and establish linkages with ongoing programme work. • Prepare a project proposal and small-scale agreement of co-operation with a
locally established NGO to support selected orphan institutions in constructing rainwater-harvesting schemes.
November 2008 18
UN-HABITAT – LVWATSAN Bunda Appraisal Report
8 TRAINING AND CAPACITY BUILDING
8.1 General Observations
Training in water and sanitation sector is very important for the sustainability of the infrastructure that is going to be put in place. There is need to build capacity in aspects like planning, feasibility studies, construction, drainage design, inspection and monitoring, repair and refurbishment of water and sanitation facilities. By bringing together knowledge on these areas provides expertise across all phases of a water and sanitation facilities namely - surveys, planning, design, construction and management. In addition to technical issues, other areas like ethical and ecological issues are important. The capacity building requirements are identified as follows:
- Policy makers: Strategic planning, reform advocacy and policy formulation to suite the target groups, environmental issues, institutional issues and water resources management
- Technical staff: The local technical staff of BUWSA is well qualified but need more training as far as operation and maintenance of the water distribution system are concerned.
- Community members: There is need to create awareness and sensitisation on proper use of water and sanitation facilities, health and hygienic aspects. It was noted that there is high level of consumer wastage at some water points and in consumer premises (piped water). It was reported that consumers who are not metered at present have little incentive to reduce wastage on their properties.
On the other hand, in areas where there is no piped water, there is need to train members of the community in the operation and maintenance of the water supply and sanitation facilities.
Promotion of functional literacy for all the people is also central in helping communities achieve sustainable development. This should also help in creating environmentally friendly modes of production in communities. Regarding the training and capacity building component, there has been an extended design process for LVWATSAN throughout the past 12 months, to address the training needs in an effective manner and to ensure that the training and capacity-building interventions are properly anchored in local institutions.
8.2 Fast-track Capacity Building Programme
In the meantime a Fast-track Capacity Building Programme for water utilities has been ongoing in four (4) towns: Kisii and Homa Bay in Kenya and Bukoba and Muleba in Tanzania. In the other towns, including Bunda, training will commence shortly. The overall objective of the fast track capacity building programme for utilities is to support the financial and operational sustainability of the capital investments being provided under the LVWATSAN Initiative. The issue of sustainable revenue generation was identified as a priority in this regard. The fast-track capacity building has also laid the groundwork for a long-term programme of capacity building in utility management and other areas. Over 120 staff of the utility companies has been trained and assistance is being provided to the utility companies in improving their operational systems, including billing and revenue collection, water demand management, customer care and mapping.
November 2008 19
UN-HABITAT – LVWATSAN Bunda Appraisal Report
This same programme will shortly be initiated in Bunda for the local branch of the water supply company.
8.3 Capacity Building for the Local Government and Communities
Training and capacity building is a crosscutting activity and will be applied to all LVWATSAN activities proposed in this report to ensure sustainable operation. • A very comprehensive capacity building programme has been developed which
will be operational in all 10 towns in the three countries. This is implemented in co-operation with 4 international partners, each having a particular expertise.
• The Co-operation Agreements with the 4 partners will be signed very soon; • Under this programme a comprehensive Assessment of Capacity Building Needs in
Bunda will be carried out early next year. • Meanwhile identification of local partners who will participate and actually
implement the training is also taking place. • Other pro-poor initiatives to stimulate Local Economic Development (e.g. through
Micro-Credit schemes) will also be initiated.
November 2008 20
UN-HABITAT – LVWATSAN Bunda Appraisal Report
9 IMPLEMENTATION STRATEGY
9.1 Implementation strategy
The options proposed aim to use low-cost and high impact strategies. The contract holder will be UN-HABITAT. The administration of the contracts would be done jointly by UN-HABITAT, BUWSA and the Bunda Town Council as the key implementing partners. The Programme Implementation Unit would be embedded within the Town Council to ensure sustainability of technical, social and economic interventions.
Three levels of project management will be put in place designed to foster the spirit of joint decision-making: (i) at the National level; (ii) at the Town level; and (iii) at the stakeholder or Community level. In order to ensure sustainability of investments installed, LVWATSAN will also support a comprehensive capacity building programme cutting across all the interventions.
9.2 Multi-Stakeholders Forum (MSF) or people’s parliament
This is the most important project oversight organ in the town. It plays a central role in expressing the needs of the town and guiding the decision making process in terms of the priorities of the town. The MSF will consist of:
• Civil leadership within the town • Business community Chamber of Commerce and Industry • NGOs active in water and environmental sanitation related activities (those
contracted under the programme will not have voting powers in the MSF); • CBOs active in areas likely to impact on water and sanitation • Representatives of organised development groups • Educational and other key institutions
9.3 Project Implementation Unit (PIU) at the town level
A Project Implementation Unit (PIU) will be established ahead of the start of implementation. It will consist of the technical officers of the agencies who will directly be involved in the implementation of the proposed water and environmental sanitation related interventions. The PIU will include at least the following officers: • The Town Clerk (usually the Chair) • The Managing Director of the Water Service Provider (Secretary) • Chairman of the Multi-Stakeholder Forum (MSF) • Municipal or Town Engineer • The LVWATSAN (UN-Habitat) Clerk of Works • GOU District Environment Officer (DEO) • Public Health Officer (PHO) • Physical Planning Officer (PPO) • Environmental Officer (NEMA)
9.4 Project Management Unit (PMU) at National level
The Ministry of Water Development, in Dar es Salaam, is the statutory institution mandated with the development and management of assets related to water and sewerage services. It will therefore be the principle contracting party for all works
November 2008 21

UN-HABITAT – LVWATSAN Bunda Appraisal Report
related to the project. A Project Management Unit (PMU) is already established and fully functional in Dar es Salaam since the earlier phase of the programme for the ongoing development in Bukoba and Muleba towns. This will consist of the following officers among others: • Director Urban Water Development of Ministry of (Chair) • Chief Technical Services Manager (TSM) of NWSC (Secretary) • UN-HABITAT/LVWATSAN, National Chief Technical Adviser (Tanzania) • Water Resources Management Authority, Regional Manager • Town Clerks of the three towns (Bukoba, Muleba, and Bunda) • Managing Directors of the three companies (Bukoba WSP, Muleba WSP, and
Bunda WSP)
9.5 Overall approach to implementation
Project implementation will be divided into immediate and long-term interventions. The immediate interventions will aim to restore existing infrastructure to at least the original design capacity, using existing specifications. At this stage, the project will intervene in areas that do not require designs. On the other hand, the long-term activities will be based on: • feasibility studies and designs to be prepared; • wide consultations with stakeholders; and • preparation of an updated physical plan of the town.
The works will be broken down into small, yet complete packages as follows: • water services infrastructure that only requires facilitation by the government
offices, to be implemented through tenders issued to commercial companies; • sanitation and sewerage infrastructure requiring only government facilitation, to
be implemented through tenders issued to commercial companies; • water and sanitation infrastructure that is linked to community capacity building
and wider local level consultations to be facilitated by the MSF, to be
November 2008 22

UN-HABITAT – LVWATSAN Bunda Appraisal Report
implemented through co-operation agreements with non-governmental organisations;
• solid waste management, micro-credit and other activities to be implemented by CBOs facilitated or contracted through co-operation agreements signed with the Town Council and overseen by the MSF.
9.6 MSF established in Bunda
The MSF for Bunda was constituted on 29 October 2008. The attendance during the elections was very good (40 persons representing various interest groups with a good gender balance). At the end of the meeting the Chairperson and the Vice Chair were selected through voting as follows:
= Mr. Flavian Chacha – Chair = Mr. Joram Mulla – Secretary In addition twenty members were elected as members of the MSF
Three thematic groups within the MSF will also be formed and chairpersons elected. The MSF committee has already started with a lot of enthusiasm and are ready to carry out their roles and responsibilities with regards to the LVWATSAN Programme. Currently they have embarked on working out the priorities for the Co-operation Agreement with UN-Habitat and will be reviewing the proposed interventions as set out in this report.
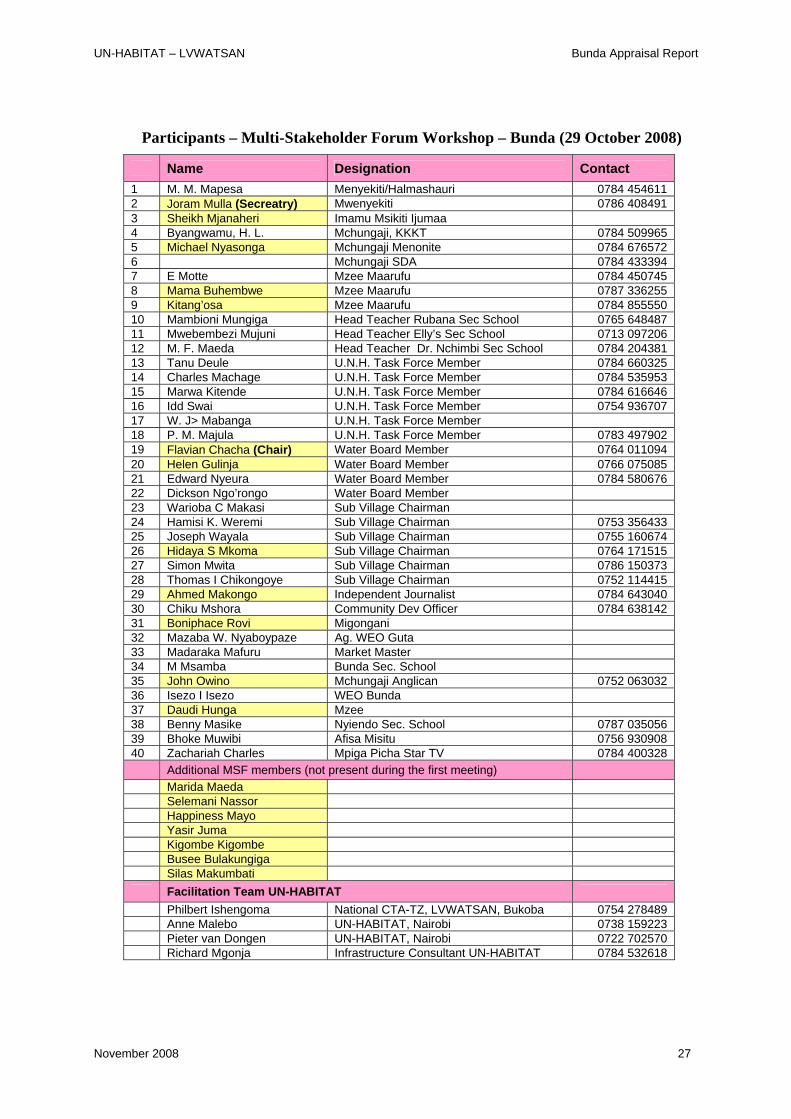
A list with MSF members and participants of the meetings held is given on next page. It shows the participants represent very well the different segments of the Bunda community.
The Multi-Stakeholder Forum workshop in progress on 29th October, 2008
November 2008 23
UN-HABITAT – LVWATSAN Bunda Appraisal Report
9.7 Issues Raised during the MSF Meeting
The following questions were addressed by the MSF meeting during the working group sessions:
(i) What are the problems associated with access to safe drinking water, basic sanitation, solid waste management and drainage in your community/town?
Old infrastructure and equipment that is run down, dilapidated and in need of urgent repair/replacement.
Insufficient water supply system due to increased water demand due to rapid population growth and increased socio-economic activities.
Bunda town has no sewerage system in place consequently the quality of water is very poor due to pollution because when it rains people empty their pit latrines
Water price is unaffordable due to long distance between the pump station and the distribution network, water is abstracted 22 km away from the town, poor people can not access public water distribution networks
Bunda suffers from limited water resources because the only reliable main source of water is Lake Victoria
The water supplied by BUWASA is not treated apart from chlorine dosage at the Bunda Bomani hills main reservoirs the population is at great risk of water borne diseases.
The town water supply is often interrupted due to frequent power failures and imbalance between supply and demand at the Migugani Booster since BUWSA pumps its water station.
Lack of designated dumping site, there is too much solid waste dumping everywhere in town
Many people depend on shallow wells which are usually situated near pit latrines
The few available water sources are not protected
Population in Bunda town often suffer from water borne diseases.
Lack of sanitation /hygiene bylaws as a result very few household have pit latrines
(ii) What actions (both physical infrastructure and capacity building) do you consider to address the above problems?
Enforce existing bylaws and campaign for construction of improved sanitation facilities at house hold levels and public levels in particular in high density areas
The local authority and all stakeholders should agree to provide a dumping site and organize garbage collection
Rehabilitate roads with proper drainage systems
November 2008 24
UN-HABITAT – LVWATSAN Bunda Appraisal Report
BUWSA should provide public stand pipes or water kiosks, and organize water vendors to supply water at an affordable price
BUWSA should provide a treatment plant and booster tanks for water supply
Government should come up with a sanitation and solid waste management strategy (Household and industrial solid and liquid waste management)
The local authority to establish a proper waste management mechanism by providing means e.g. exhauster tankers, trucks etc.
Launch a substantial public hygiene education; awareness on use of dust bins, garbage collection fee, dump sites and proper use of drains/ waste outlets/sewer system
Public awareness on recycling of solid waste, behaviour and mentality change on hygiene and waste
Involve more women, community groups and schools in sanitation initiatives matters
Create opportunities for more income generating activities for poor households
(iii) How best can the Lake Victoria Region Water and Sanitation Initiative (LVWATSAN) serve the needs of women and men from poor neighbourhoods of the town?
Need to empower communities with skills for income generation
Rehabilitate and protect water sources and increase water storage in density populated areas.
Launch a substantial hygiene education; public awareness on acquiring and using improved pit latrines
Enforce bylaws and promote the awareness on the need for good public sanitation eg wells location should be far away from wells.
Mapping marginalised and vulnerable groups and provide them special services
Sensitise, involve vulnerable groups in programme activities and enhance their awareness on water and sanitation issues
Increase public water kiosks for marginalised and vulnerable groups eg orphans and the poorest people in the town
Establish programme committees in wards to ensure marginalised and vulnerable groups have access to water and sanitation services.
Work with youth women and CBOs to build their capacity on entrepreneurship, promote awareness on HIV/AIDS etc.
November 2008 25
UN-HABITAT – LVWATSAN Bunda Appraisal Report
(iv) What can you and/or your group contribute to solving the problems associated with access to safe drinking water, basic sanitation, solid waste management and drainage in your community/town?
a. Safe Drinking Water
Sensitize the community and create awareness about the importance of the LVWATSAN programme
Public hygiene education and advocacy on safe drinking water
Enforce bye-laws on water source protection and respect designated distance for activities from the sources
Initiate rain water harvesting schemes for poorest people who can not afford public water and sanitation networks.
Combat illegal connections and report leakages to BUWSA
BUWSA should promote reasonable water tariff
b. Basic Sanitation
Provide enough human and financial resources such as equipments for waste collection
Sensitize and create awareness on improved sanitation facilities
Create bye-laws for sanitation
Provide sewerage system in the town
Encourage community sanitation activities such as hygiene competition in wards, schools, markets etc.
c. Solid waste
Allocate dumping and recycling sites for industrial and household waste
Advocate for waste recycling: sorting out, burning of inorganic waste
Establish groups to undertake garbage collection
d. Drainage
Provide proper roads drains
Public awareness and promote discipline on dumping and cleanliness
Bye-laws for solid waste
November 2008 26
UN-HABITAT – LVWATSAN Bunda Appraisal Report
Participants – Multi-Stakeholder Forum Workshop – Bunda (29 October 2008)
Name Designation Contact 1 M. M. Mapesa Menyekiti/Halmashauri 0784 454611 2 Joram Mulla (Secreatry) Mwenyekiti 0786 408491 3 Sheikh Mjanaheri Imamu Msikiti Ijumaa 4 Byangwamu, H. L. Mchungaji, KKKT 0784 509965 5 Michael Nyasonga Mchungaji Menonite 0784 676572 6 Mchungaji SDA 0784 433394 7 E Motte Mzee Maarufu 0784 450745 8 Mama Buhembwe Mzee Maarufu 0787 336255 9 Kitang’osa Mzee Maarufu 0784 855550 10 Mambioni Mungiga Head Teacher Rubana Sec School 0765 648487 11 Mwebembezi Mujuni Head Teacher Elly’s Sec School 0713 097206 12 M. F. Maeda Head Teacher Dr. Nchimbi Sec School 0784 204381 13 Tanu Deule U.N.H. Task Force Member 0784 660325 14 Charles Machage U.N.H. Task Force Member 0784 535953 15 Marwa Kitende U.N.H. Task Force Member 0784 616646 16 Idd Swai U.N.H. Task Force Member 0754 936707 17 W. J> Mabanga U.N.H. Task Force Member 18 P. M. Majula U.N.H. Task Force Member 0783 497902 19 Flavian Chacha (Chair) Water Board Member 0764 011094 20 Helen Gulinja Water Board Member 0766 075085 21 Edward Nyeura Water Board Member 0784 580676 22 Dickson Ngo’rongo Water Board Member 23 Warioba C Makasi Sub Village Chairman 24 Hamisi K. Weremi Sub Village Chairman 0753 356433 25 Joseph Wayala Sub Village Chairman 0755 160674 26 Hidaya S Mkoma Sub Village Chairman 0764 171515 27 Simon Mwita Sub Village Chairman 0786 150373 28 Thomas I Chikongoye Sub Village Chairman 0752 114415 29 Ahmed Makongo Independent Journalist 0784 643040 30 Chiku Mshora Community Dev Officer 0784 638142 31 Boniphace Rovi Migongani 32 Mazaba W. Nyaboypaze Ag. WEO Guta 33 Madaraka Mafuru Market Master 34 M Msamba Bunda Sec. School 35 John Owino Mchungaji Anglican 0752 063032 36 Isezo I Isezo WEO Bunda 37 Daudi Hunga Mzee 38 Benny Masike Nyiendo Sec. School 0787 035056 39 Bhoke Muwibi Afisa Misitu 0756 930908 40 Zachariah Charles Mpiga Picha Star TV 0784 400328 Additional MSF members (not present during the first meeting) Marida Maeda Selemani Nassor Happiness Mayo Yasir Juma Kigombe Kigombe Busee Bulakungiga Silas Makumbati Facilitation Team UN-HABITAT Philbert Ishengoma National CTA-TZ, LVWATSAN, Bukoba 0754 278489 Anne Malebo UN-HABITAT, Nairobi 0738 159223 Pieter van Dongen UN-HABITAT, Nairobi 0722 702570 Richard Mgonja Infrastructure Consultant UN-HABITAT 0784 532618
November 2008 27
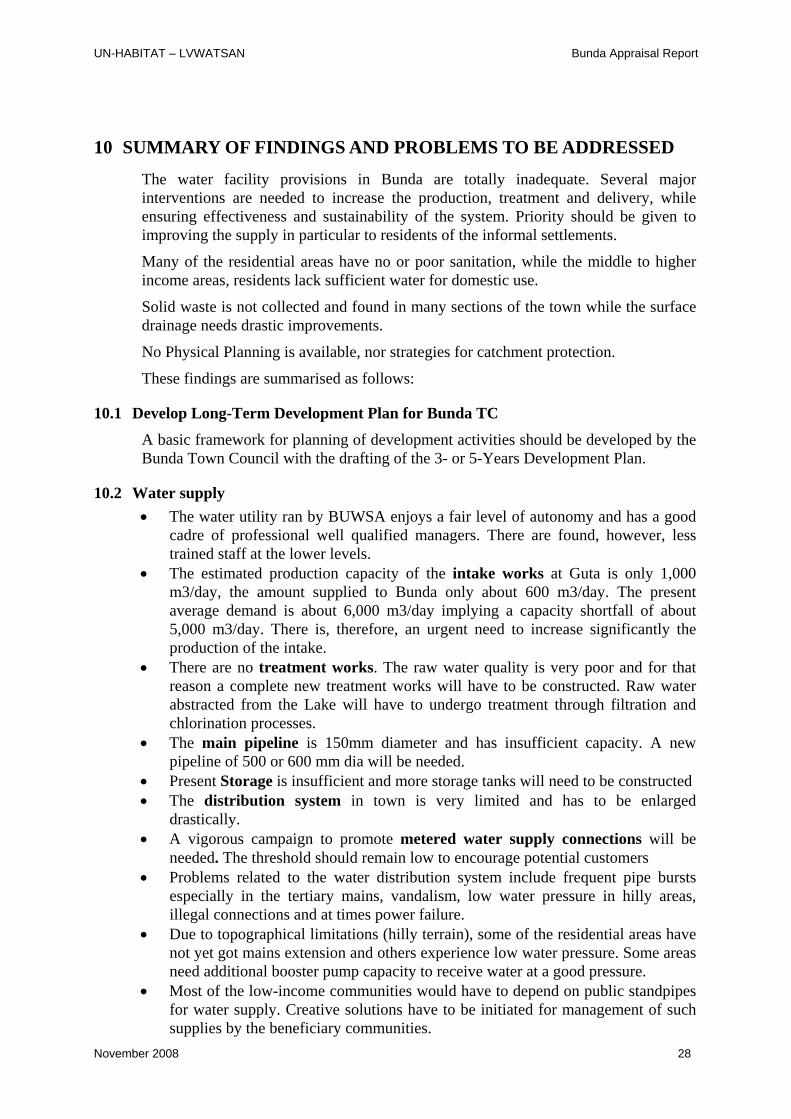
UN-HABITAT – LVWATSAN Bunda Appraisal Report
10 SUMMARY OF FINDINGS AND PROBLEMS TO BE ADDRESSED
The water facility provisions in Bunda are totally inadequate. Several major interventions are needed to increase the production, treatment and delivery, while ensuring effectiveness and sustainability of the system. Priority should be given to improving the supply in particular to residents of the informal settlements.
Many of the residential areas have no or poor sanitation, while the middle to higher income areas, residents lack sufficient water for domestic use.
Solid waste is not collected and found in many sections of the town while the surface drainage needs drastic improvements.
No Physical Planning is available, nor strategies for catchment protection.
These findings are summarised as follows:
10.1 Develop Long-Term Development Plan for Bunda TC
A basic framework for planning of development activities should be developed by the Bunda Town Council with the drafting of the 3- or 5-Years Development Plan.
10.2 Water supply • The water utility ran by BUWSA enjoys a fair level of autonomy and has a good
cadre of professional well qualified managers. There are found, however, less trained staff at the lower levels.
• The estimated production capacity of the intake works at Guta is only 1,000 m3/day, the amount supplied to Bunda only about 600 m3/day. The present average demand is about 6,000 m3/day implying a capacity shortfall of about 5,000 m3/day. There is, therefore, an urgent need to increase significantly the production of the intake.
• There are no treatment works. The raw water quality is very poor and for that reason a complete new treatment works will have to be constructed. Raw water abstracted from the Lake will have to undergo treatment through filtration and chlorination processes.
• The main pipeline is 150mm diameter and has insufficient capacity. A new pipeline of 500 or 600 mm dia will be needed.
• Present Storage is insufficient and more storage tanks will need to be constructed • The distribution system in town is very limited and has to be enlarged
drastically. • A vigorous campaign to promote metered water supply connections will be
needed. The threshold should remain low to encourage potential customers • Problems related to the water distribution system include frequent pipe bursts
especially in the tertiary mains, vandalism, low water pressure in hilly areas, illegal connections and at times power failure.
• Due to topographical limitations (hilly terrain), some of the residential areas have not yet got mains extension and others experience low water pressure. Some areas need additional booster pump capacity to receive water at a good pressure.
• Most of the low-income communities would have to depend on public standpipes for water supply. Creative solutions have to be initiated for management of such supplies by the beneficiary communities.
November 2008 28
UN-HABITAT – LVWATSAN Bunda Appraisal Report
• The governance structure for water and sanitation in the town seems to be well organized with clear lines of responsibility but is handicapped by lack of qualified staff and funds.
10.3 Sanitation • Bunda town has no sewerage system in place; more than 60% of sanitation is
provided by on-site pit latrines. Most of these cannot be considered improved sanitation because many are just open pits without a slab. In the majority of cases these are shared between several households.
• On the long term it is inevitable that a sewerage system be put in place for Bunda..
• In the urban environment pit latrines cannot be an acceptable solution, because pose a health risk, and can easily contaminate groundwater, in particular in Bunda where groundwater table is very shallow.
• In the unplanned settlements, pay-per-use communal facilities may for the time being prove acceptable to residents.
10.4 Solid Waste Management • Bunda Municipal Council is responsible for management of solid waste in the
Town. However, there is no organised regular collection of garbage. • From the UIS survey it becomes clear that the majority of households dispose
their household waste by dumping it in de backyard of their compound, dumping it in the street, or burning it in the open.
• There is a large amount of solid waste accumulation visible in particular in the low-income settlements and along the roads.
• Poor systems of garbage collection and disposal, result into perpetual presence of vermin and pests especially in the densely populated low-income areas. The garbage remains uncollected for a long time by lack of transport and there is no sanitary landfill close to Bunda.
• Burning of the waste provides a solution but also creates a problem as many people complain of bad smoke and smell.
10.5 Drainage • The municipal council is responsible for management and maintenance of the
drains in town. • A recurrent problem with drainage channels is blockage with solid waste and soil. • In the low-income areas the lack of drainage leads to ponding. • In the upper parts of Bunda the topography is quite hilly, leading to severe
erosion of roads and drains; • The network of drains is mainly earthen and tends to overgrow with grass, filled
with garbage and is often blocked. • Most of low-income settlements are located in the lower areas and are poorly
drained. • The market area has no drainage and no pavement. The whole area becomes very
muddy and flooded during rains.
November 2008 29
UN-HABITAT – LVWATSAN Bunda Appraisal Report
10.6 Urban Physical Planning • There is no physical development plan for Bunda, which has led to unplanned
settlements that are difficult to service. The available block map is very old and cannot be used for development of physical plans.
• However, some parts of the town have planned settlements and a plan can be developed without difficulty. The housing has been established on demarcated plots.
• There is need to develop an up-to-date base map to be used in the development of a physical plan for the town before such areas are encroached on by unplanned settlements.
• Lack of a physical development plan for Bunda has led to the development of crowded unplanned settlements, which have made provision of water and sanitation services difficult.
• No facilities are available at the planning office.
10.7 Capacity Building • No overall training and capacity building programme is in place. • The managers and policy makers in the municipality associated with water and
sanitation have limited capacity in the area of strategic planning, operation and maintenance, and management as far as water and sanitation issues are concerned.
• The level of professionalism of managers and senior staff of BUWSA is good. However, there is need to train some of the lower level technical staff in utility mapping and monitoring of the water and sanitation facilities, as well as operation and maintenance scheduling
• Where public sanitation facilities are installed (public standpipes), members of the communities participate in their management through committees or associations. They are assisted by both BUWSA and the municipal authorities in overseeing the private operators who operate and maintain the facilities.
10.8 Advocacy and Awareness Raising • No overall policy for water, sanitation and health issues is in place. • Health and hygiene programme needs to be developed
10.9 Urban Catchment Management • No Urban catchment management strategy is in place to enable protection of the
resources. • No regular sampling and testing of water quality takes place
10.10 Gender Mainstreaming and Support to Vulnerable Groups • Apart from a few initiatives by community groups, women groups, and
individuals, no coherent strategy is (yet) in place in Bunda.
November 2008 30
UN-HABITAT – LVWATSAN Bunda Appraisal Report
11 PROPOSED INTERVENTIONS
11.1 Water Supply:
Recently the Government of Tanzania has allocated a significant amount of money to construct new intake works and treatment works at Nyabehu, and construct a 24 kms 600 mm pipeline to town. This would closely follow the design as prepared in 2006 by the Ministry of Water.
The LVWATSAN programme would therefore in close co-ordination with the BUWSA team look into what supplementary activities can be supported. This would probably include the following
Under the proposed Immediate Interventions aim to: • Expand the existing distribution system, with the installation of 6 kms distribution
mains and 10 kms secondary distribution lines; • Construct 10 additional public standpipes; • Promote large numbers of household metered connections; • Provide schools’ water (and sanitation) services for 10 primary schools and 4
secondary schools • Minimise the levels of unaccounted for water by eliminating flat rate payments
and reducing leakages and improving the management of the water system. • Capacity building of water service provider management staff through training
and provision of tools, equipment, computers and transport facilities to enhance efficiency and sustainability.
Under the Long-term Interventions further detailed designs studies are required to investigate future water development options, in line with the town’s Physical Plan. Further significant expansion of the rising main, storage capacity and distribution network in town should be anticipated and budgeted for.
11.2 Sanitation and Sewerage:
Under the Immediate Interventions it is proposed: • Development of a sanitation strategy for Bunda; • Carry out a feasibility study for sewerage network in town and treatment works; • Upgrading of the existing public toilets in Bunda town; • Construction of new public toilets in town, preferably through privatisation and
suitable lighting and security in the vicinity of the toilets; • Provision of an efficient exhauster service; • Develop and implement School Water and Sanitation Programme, through health
and hygiene education; • Construct water and sanitation facilities at primary and secondary schools; • Promotion and support of community-based groups for the construction of school
latrines and low cost yard and household latrines (sanplat). • Promote local manufacturing of sanplat units by local entrepreneurs or self-help
groups; • Promote sanplat installation at household level on a large scale through services of
a local NGO; (with micro-credit financing)
November 2008 31

UN-HABITAT – LVWATSAN Bunda Appraisal Report
Under the Long-term Interventions• Further develop engineering design of sewerage options for the town. • Identify potential sources of funding and submit requests for loans.
11.3 Solid waste: • Development of a sustainable solid waste management strategy, which
incorporates community participation. • Procurement of solid waste collection equipment (tippers, tractors, etc) • Provide 50 No. tipping bins in congested areas, specially designed refuse transfer
stations, lightweight, truck-mounted self-tipping truck and tools to enhance collection and transportation efficiency.
• Construct solid waste transfer stations • Identify solid waste dump site and assist in landscaping to provide sufficient
storage • Provide an adequate solution for the solid and liquid waste generated at the
slaughterhouse in Bunda. Construction of septic tank at the site.
11.4 Drainage: • Development of an adequate drainage plan, in line with the overall Physical Plan; • Construction of drains along main roads and tracks; • Paving of market area and construction of drains.
11.5 Physical Planning • Production of maps and layout plans of physical infrastructure including water
supply network and drainage. • Formulation /Updating of the Physical Plan and technical co-ordination of all
services within the Municipality i.e. roads, drainage, physical planning, excavations should be worked out.
• Engage a land surveyor who will undertake a demarcation of all lands in the town, and produce a map of all properties and their plot boundaries.
• Provide technical assistance in the overlaying of the above maps and plans for the purpose of producing an up-to-date base map of the town showing the existing situation.
• Based on the above, the urban planning exercise will produce issue- and thematic maps, a complete profile of the town covering socio-economic (mainly from the UIS survey), environmental, ecological, and structural characteristics, develop – together with the stakeholders – a shared future vision for the town. This will entail formulation of Conceptual Plans and Final plans for the future of the town.
• Provide training and capacity building for all of the above tasks; • Provide office facilities (computers, other hardware and software) for efficient
operation of the Planning Office.
11.6 Orphans and other Vulnerable Groups Special attention will be given to meet the needs of these vulnerable groups by: • Mobilising support for and establish linkages with on-going programme work. • Preparing a project proposal and small scale agreement of co-operation with a
locally established NGO to support selected orphan institutions in constructing rain water harvesting schemes at their homes.
November 2008 32
UN-HABITAT – LVWATSAN Bunda Appraisal Report
11.7 Advocacy and Awareness Raising • Formation of community organisations to manage water and sanitation services in
informal settlements • Support to local groups with information and education materials for
dissemination and education of the public on water utility management as well as environmental sanitation.
• Community Development of an Urban Catchment Management Strategy • Mobilisation to sensitise the people on health and hygiene campaigns, in particular
in schools. • Recruitment and training of community trainers in the peri-urban and informal
settlements.
11.8 Urban Catchment Management Adequate facilities need to be put in place to enable management of the urban environment in regards to the safe and healthy livelihood of the population. The following measures have to be undertaken: • Development of an integrated Urban Catchment Management Strategy; • Design of a monitoring network • Enabling legislation at Local Government level (bye-laws) • Awareness campaigns • Office facilities, including database, and software • Training and capacity building
11.9 Capacity Building Training and capacity building is a crosscutting activity and should be applied to all activities proposed above, to ensure sustainable operation. • A very comprehensive capacity building programme has been developed which
will be operational in all 10 towns in the three countries. This is implemented in co-operation with 4 international partners, each having a particular expertise.
• The Co-operation Agreements with the 4 partners have been signed recently; • Under this programme a comprehensive Assessment of Capacity Building Needs in
Bunda will be carried out early next year. • Meanwhile identification of local partners who will participate and actually
implement the training is also taking place. • A Fast-track Programme aiming to improve the performance of the Water Service
Provider, carried out in collaboration with the National Water and Sewerage Corporation of Uganda has already started work in Bunda with the BUWSA Company.
• Other pro-poor initiatives to stimulate Local Economic Development (e.g. through Micro-Credit schemes) will also be initiated.
11.10 Gender Mainstreaming and Support to Vulnerable Groups Also gender mainstreaming is a crosscutting activity which aims at ensuring a well-balanced representation of men and women in the various organisations dealing with implementation of LVWATSAN. A strategy has been developed and implementation will be starting soon.
November 2008 33

UN-HABITAT – LVWATSAN Bunda Appraisal Report
11.11 Monitoring and Evaluation
The Urban Inequity Survey carried out earlier provides a solid base of information. In order to monitor progress, the Monitoring Branch of UN-Habitat will repeat the survey at regular intervals to measure the rate of MDG achievements, with respect to water and sanitation.
November 2008 34
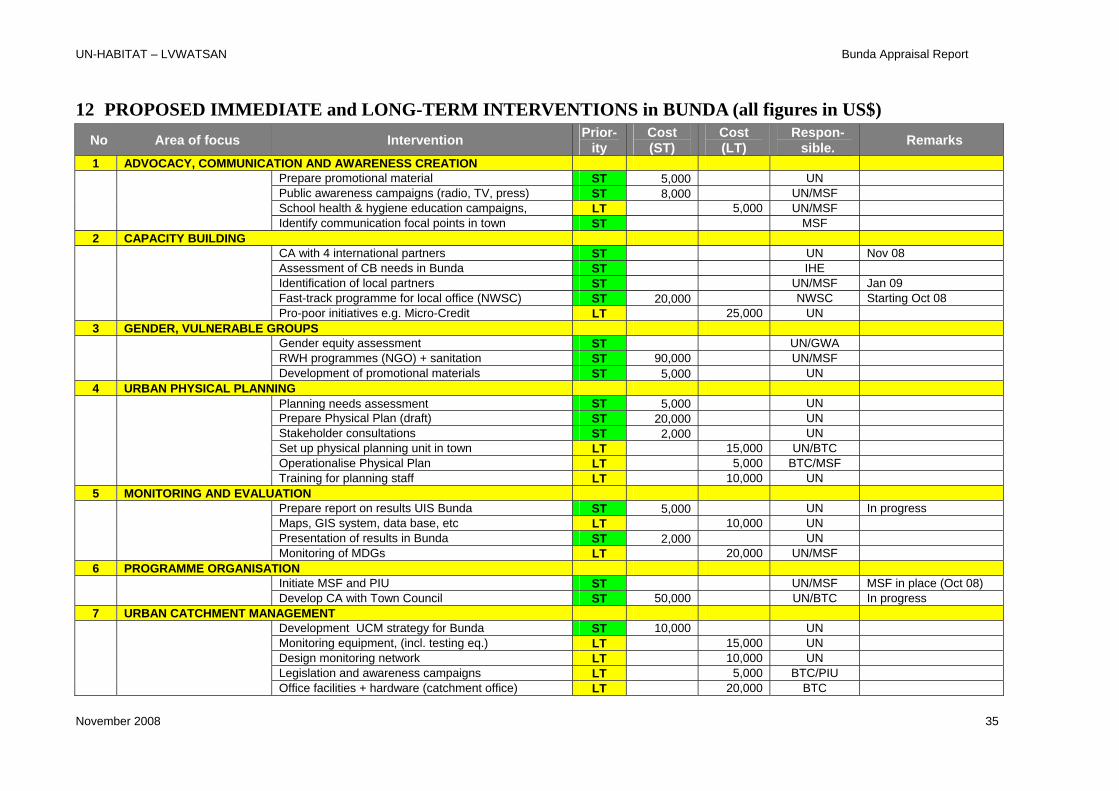
UN-HABITAT – LVWATSAN Bunda Appraisal Report
12 PROPOSED IMMEDIATE and LONG-TERM INTERVENTIONS in BUNDA (all figures in US$) No Area of focus Intervention Prior-
ity Cost (ST)
Cost (LT)
Respon-sible. Remarks
1 ADVOCACY, COMMUNICATION AND AWARENESS CREATION Prepare promotional material ST 5,000 UNPublic awareness campaigns (radio, TV, press) ST 8,000 UN/MSFSchool health & hygiene education campaigns, LT 5,000 UN/MSF
Identify communication focal points in town ST MSF
2 CAPACITY BUILDING CA with 4 international partners ST UN Nov 08Assessment of CB needs in Bunda ST IHE Identification of local partners ST UN/MSF Jan 09Fast-track programme for local office (NWSC) ST 20,000 NWSC Starting Oct 08
Pro-poor initiatives e.g. Micro-Credit LT 25,000 UN
3 GENDER, VULNERABLE GROUPS Gender equity assessment ST UN/GWA RWH programmes (NGO) + sanitation ST 90,000 UN/MSF
Development of promotional materials ST 5,000 UN4 URBAN PHYSICAL PLANNING
Planning needs assessment ST 5,000 UNPrepare Physical Plan (draft) ST 20,000 UNStakeholder consultations ST 2,000 UNSet up physical planning unit in town LT 15,000 UN/BTCOperationalise Physical Plan LT 5,000 BTC/MSF
Training for planning staff LT 10,000 UN 5 MONITORING AND EVALUATION
Prepare report on results UIS Bunda ST 5,000 UN In progressMaps, GIS system, data base, etc LT 10,000 UN Presentation of results in Bunda ST 2,000 UN
Monitoring of MDGs LT 20,000 UN/MSF
6 PROGRAMME ORGANISATION Initiate MSF and PIU ST UN/MSF MSF in place (Oct 08)
Develop CA with Town Council ST 50,000 UN/BTC In progress
7 URBAN CATCHMENT MANAGEMENT Development UCM strategy for Bunda ST 10,000 UNMonitoring equipment, (incl. testing eq.) LT 15,000 UNDesign monitoring network LT 10,000 UNLegislation and awareness campaigns LT 5,000 BTC/PIU
Office facilities + hardware (catchment office) LT 20,000 BTC
November 2008 35
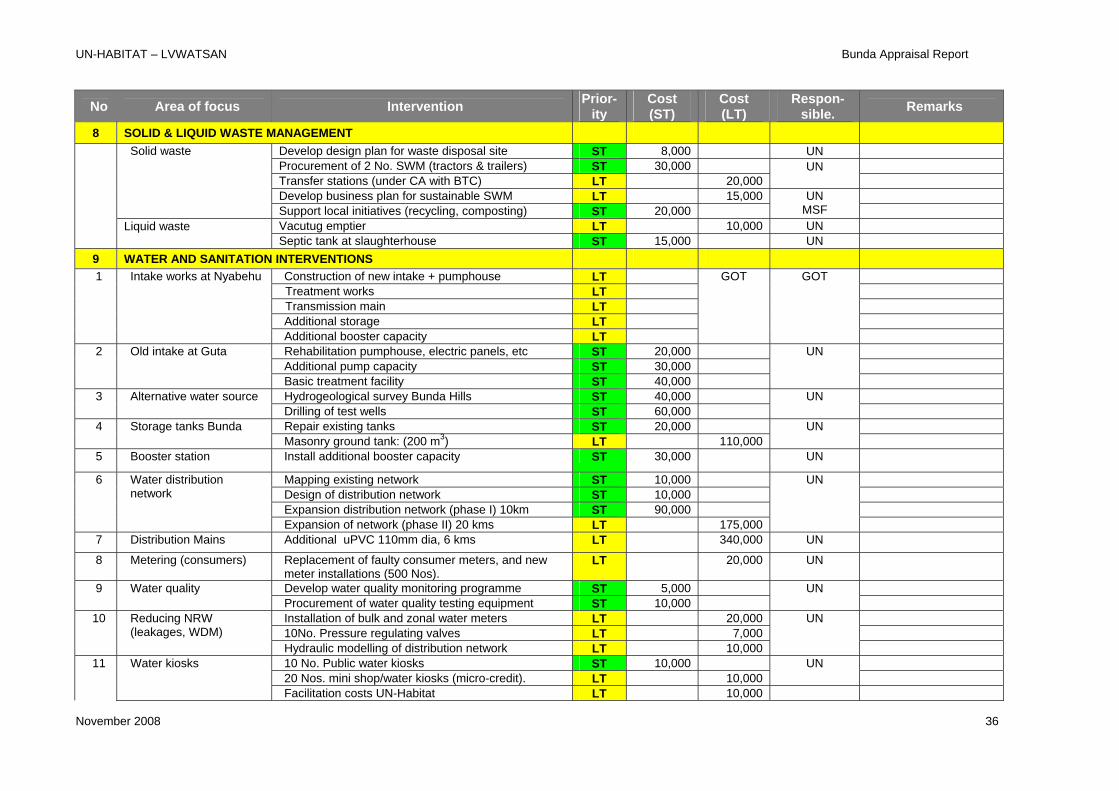
UN-HABITAT – LVWATSAN Bunda Appraisal Report
No Area of focus Intervention Prior-ity
Cost (ST)
Cost (LT)
Respon-sible. Remarks
8 SOLID & LIQUID WASTE MANAGEMENT
Develop design plan for waste disposal site ST 8,000 UN Procurement of 2 No. SWM (tractors & trailers) ST 30,000 Transfer stations (under CA with BTC) LT 20,000
UN
Develop business plan for sustainable SWM LT 15,000
Solid waste
Support local initiatives (recycling, composting) ST 20,000 UN
MSF Vacutug emptier LT 10,000 UN
Liquid waste Septic tank at slaughterhouse ST 15,000 UN
9 WATER AND SANITATION INTERVENTIONS Construction of new intake + pumphouse LT Treatment works LT Transmission main LT Additional storage LT
1 Intake works at Nyabehu
Additional booster capacity LT
GOT GOT
Rehabilitation pumphouse, electric panels, etc ST 20,000 Additional pump capacity ST 30,000
2 Old intake at Guta
Basic treatment facility ST 40,000
UN
Hydrogeological survey Bunda Hills ST 40,000 3 Alternative water source Drilling of test wells ST 60,000
UN
Repair existing tanks ST 20,000 4 Storage tanks Bunda Masonry ground tank: (200 m3) LT 110,000
UN
5 Booster station Install additional booster capacity ST 30,000 UN
Mapping existing network ST 10,000 Design of distribution network ST 10,000 Expansion distribution network (phase I) 10km ST 90,000
6 Water distributionnetwork
Expansion of network (phase II) 20 kms LT 175,000
UN
7 Distribution Mains Additional uPVC 110mm dia, 6 kms LT 340,000 UN
8 Metering (consumers) Replacement of faulty consumer meters, and new meter installations (500 Nos).
LT 20,000 UN
Develop water quality monitoring programme ST 5,000 9 Water qualityProcurement of water quality testing equipment ST 10,000
UN
Installation of bulk and zonal water meters LT 20,00010No. Pressure regulating valves LT 7,000
10 Reducing NRW(leakages, WDM)
Hydraulic modelling of distribution network LT 10,000
UN
10 No. Public water kiosks ST 10,000 20 Nos. mini shop/water kiosks (micro-credit). LT 10,000
UN
11 Water kiosks
Facilitation costs UN-Habitat LT 10,000
November 2008 36
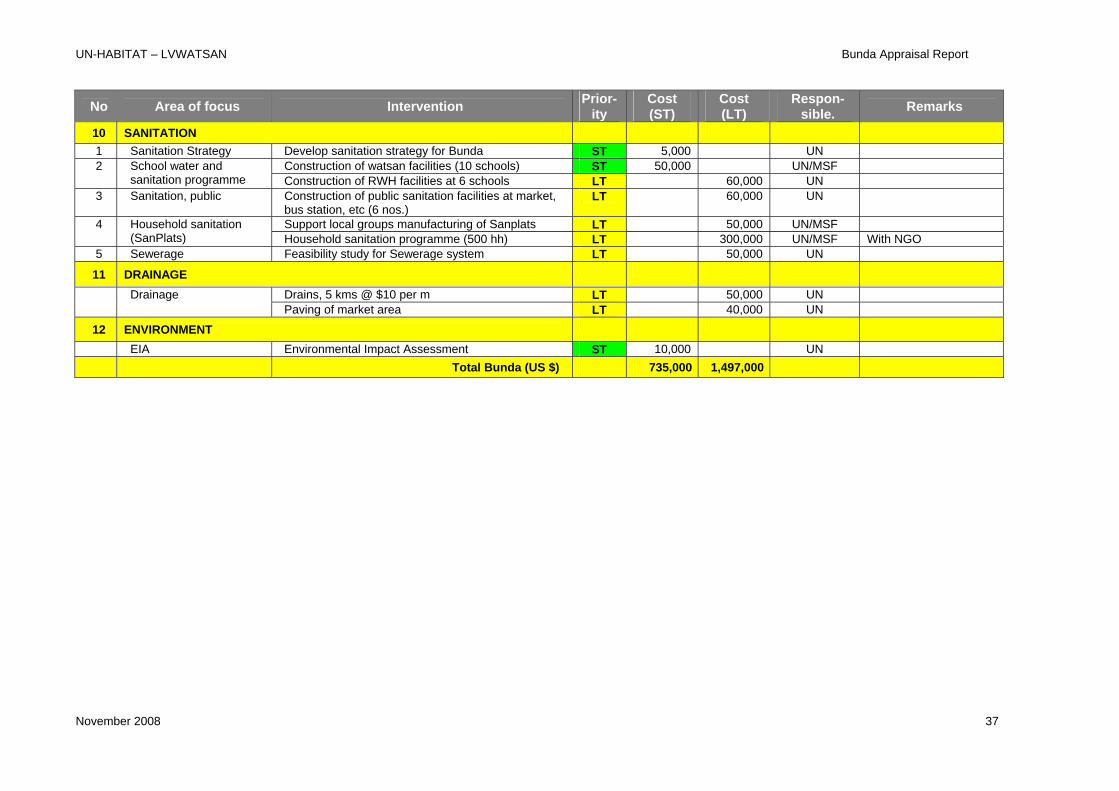
UN-HABITAT – LVWATSAN Bunda Appraisal Report
No Area of focus Intervention Prior-ity
Cost (ST)
Cost (LT)
Respon-sible. Remarks
10 SANITATION
1 Sanitation Strategy Develop sanitation strategy for Bunda ST 5,000 UNConstruction of watsan facilities (10 schools) ST 50,000 UN/MSF2
School water and sanitation programme Construction of RWH facilities at 6 schools LT 60,000 UN
3 Sanitation, public Construction of public sanitation facilities at market, bus station, etc (6 nos.)
LT 60,000 UN
Support local groups manufacturing of Sanplats LT 50,000 UN/MSF4 Household sanitation(SanPlats) Household sanitation programme (500 hh) LT 300,000 UN/MSF With NGO
5 Sewerage Feasibility study for Sewerage system LT 50,000 UN
11 DRAINAGE
Drains, 5 kms @ $10 per m LT 50,000 UN DrainagePaving of market area LT 40,000 UN
12 ENVIRONMENT
EIA Environmental Impact Assessment ST 10,000 UN Total Bunda (US $) 735,000 1,497,000
November 2008 37

UN-HABITAT – LVWATSAN Bunda Appraisal Report
13 REFERENCES
1. UN-HABITAT, 2004. Lake Victoria Region Water and Sanitation Initiative - Rapid appraisal of Water and Sanitation in 30 Selected Urban Centres, Unpublished (Blue Book).
2. UN-HABITAT, 2005. Lake Victoria Region Water and Sanitation Initiative –Consultant reports on immediate and long-term infrastructure interventions in water and sanitation, solid waste management and drainage for selected secondary towns around Lake Victoria, Unpublished.
3. UN-HABITAT, 2006. Lake Victoria Region Water and Sanitation Initiative - Strategic Environmental Assessment for 15 towns in the Lake Victoria Basin in Kenya, Uganda and Tanzania, Unpublished.
4. UN-HABITAT, 2006. Lake Victoria Region Water and Sanitation Initiative – Report of the Capacity Building Workshop, held at the UN-HABITAT Headquarters in Gigiri, Nairobi 16-18 October 2006.
5. UN-HABITAT, 2006: Lake Victoria Region Water and Sanitation Initiative – Analysis of the Financial Viability and Economic Justification of the programme, Unpublished.
6. UN-HABITAT, 2008. Lake Victoria Region Water and Sanitation Initiative –Programme Brochure (update August 2008), UN-HABITAT.
7. UN-HABITAT, 2006. Water and Sanitation in the World’s Cities 2006: Meeting Development Goals in Small Urban Centres, Earthscan Publications Ltd.
8. UN-HABITAT, 2004, Environmental Assessment Requirements: A Guide for UNHABITAT Supported Activities,
9. UN-HABITAT, 2001. UN-HABITAT Policy on Mainstreaming Gender Equality and Women’s Rights, 2001.
10. UN-HABITAT, 2005. A Guidebook for Urban Catchment Management
11. UN-HABITAT, 2008. A Step-by-step Guide for the Establishment of a Multi-Stakeholder Forum.
12. UN-HABITAT, 2005. Cities Development Strategies for Improved Urban Environment and Poverty Reduction in the Lake Victoria Region : Kampala, Kisumu and Musoma.
13. UN-HABITAT, 2008. Promoting Biodiversity in and around the Lake Victoria Basin, (Lake Victoria City Development Strategies’ Project, Urban Environment Section).
14. UNEP (2006) – Lake Victoria Basin Environment Outlook, Environment for Development.
15. Odada, E.O., D.O. Olago and Ochola, W. Eds (2006) – Environment for Development: An Ecosystems Assessment of Lake Victoria Basin, UNEP/PASS.
16. World Bank, 1999. Nile Basin Initiative, World Bank Group.
17. East African Community (2003), Protocol on Sustainable Development of the Lake Victoria Basin.
November 2008 38

UN-HABITAT – LVWATSAN Bunda Appraisal Report
18. EAC (2004); The Vision and Strategy Framework for the Management and Development of the Lake Victoria Basin
19. World Bank 1996. Kenya, Tanzania and Uganda: Lake Victoria Environmental Management Project. GEF Documentation Report No. 15541 – ARF.
20. Ntiba, M.J., Kudoja, W.M. and Mukasa, C.T. 2001. Management issues in the Lake Victoria watershed. Lakes Reservoirs: Res. Mgmt 6, 211-216.
21. Karanja, D.M.S. 2002. Health and diseases: a case study of Lake Victoria basin. In: The Lake Victoria Training Project, Annual Report 2002. Pan-African START Secretariat, Nairobi.
22. Alex Gisagara, 2006. Implications of the dropping Lake Victoria Water Levels on Water Supply Service Provision, Paper presented at a Multi-stakeholder Workshop on the Decline of Lake Victoria Water Levels, 15 August 2006.
23. Raymond Mngodo, 2006. Current Status of Lake Victoria, Paper presented at a Multi-stakeholder Workshop on the Decline of Lake Victoria Water Levels, 15 August 2006.
24. WHO/UNICEF Joint Monitoring Programme – Progress on Drinking Water and Sanitation (July 2008).
25. BUWSA (2007) – Annual Progress Report for the Period 2006/07
26. UN-HABITAT (2008) – Appraisal Report for Bondo Town, July 2008
27. UN-HABITAT (2008) – Appraisal Report for Bugembe Town, August 2008
28. Ministry of Water, Tanzania (2006) – Survey and Design Report for the Construction of a Pipeline from Lake Victoria to Bunda Town, (April 2006)
29. LVWATSAN – Fast-track Capacity Building Programme for Utilities. Rapid Assessment Report for Bunda Town. Prepared by NWSC-ESU, August 2008.
November 2008 39
UN-HABITAT – LVWATSAN Bunda Appraisal Report
ANNEX 1
Field Visits / Observations
November 2008 40
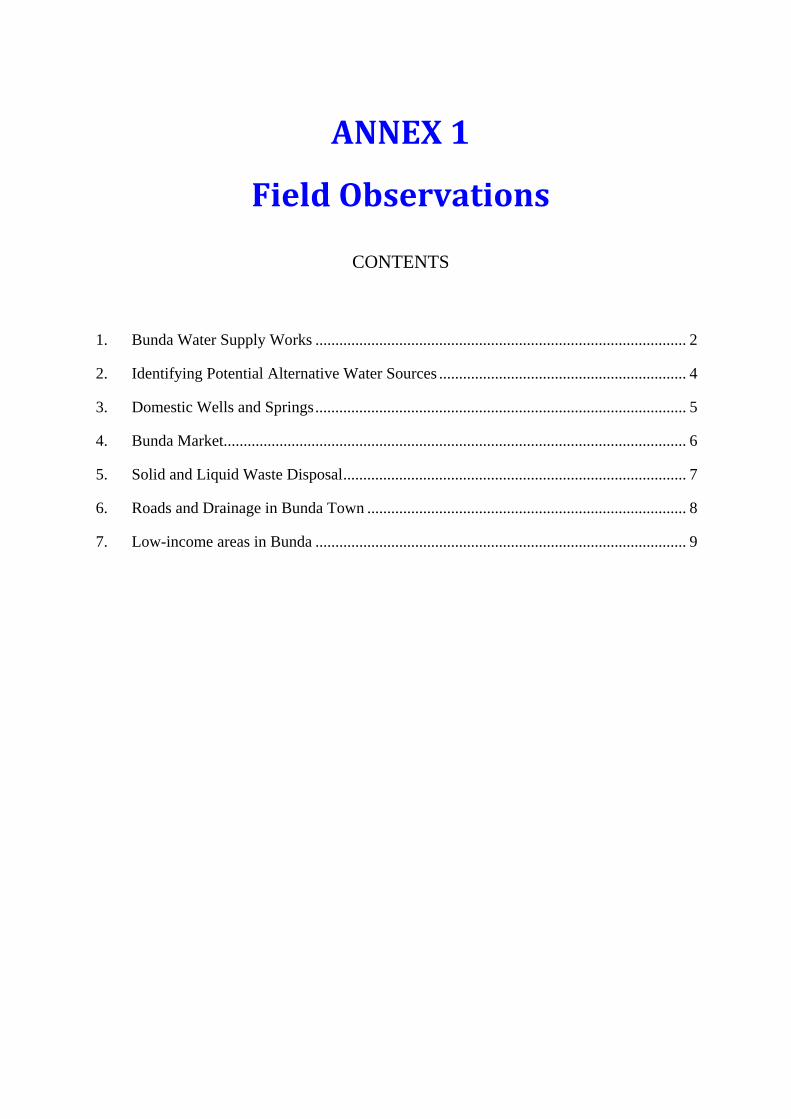
ANNEX 1
Field Observations
CONTENTS 1. Bunda Water Supply Works ............................................................................................. 2 2. Identifying Potential Alternative Water Sources .............................................................. 4 3. Domestic Wells and Springs............................................................................................. 5 4. Bunda Market.................................................................................................................... 6 5. Solid and Liquid Waste Disposal...................................................................................... 7 6. Roads and Drainage in Bunda Town ................................................................................ 8 7. Low-income areas in Bunda ............................................................................................. 9
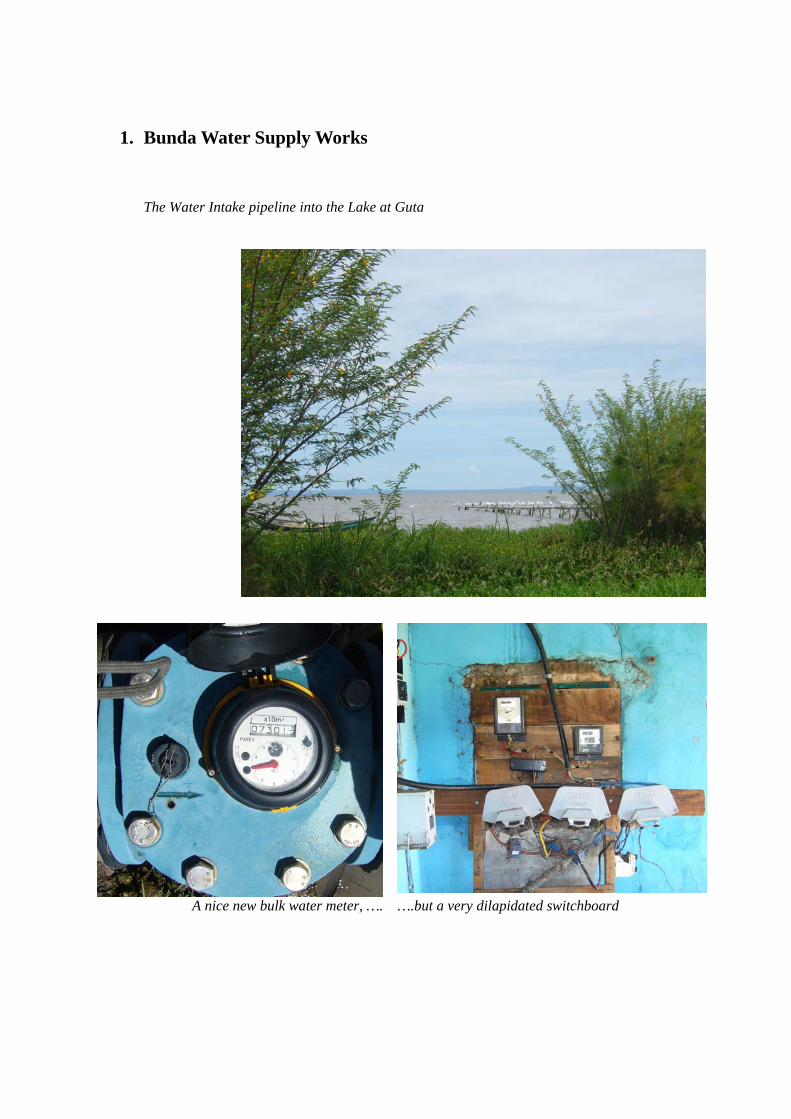
1. Bunda Water Supply Works
The Water Intake pipeline into the Lake at Guta
A nice new bulk water meter, …. ….but a very dilapidated switchboard
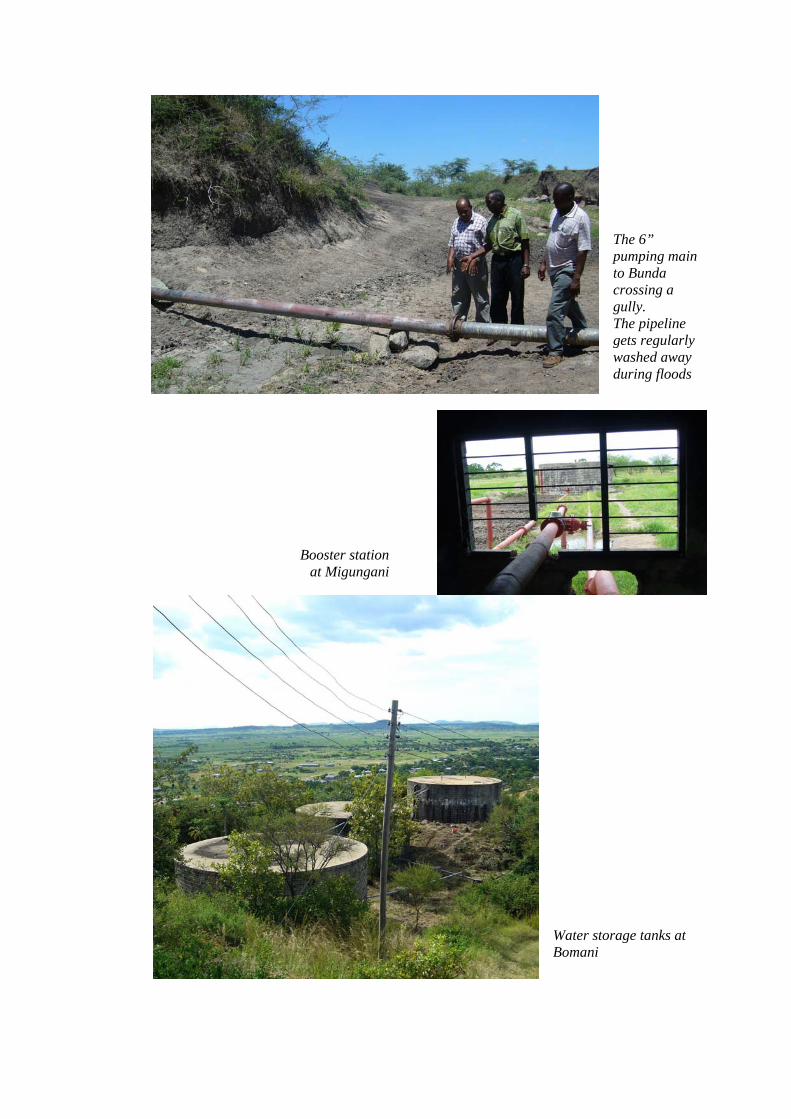
The 6” pumping main to Bunda crossing a gully. The pipeline gets regularly washed away during floods
Water storage tanks at Bomani
Booster stationat Migungani
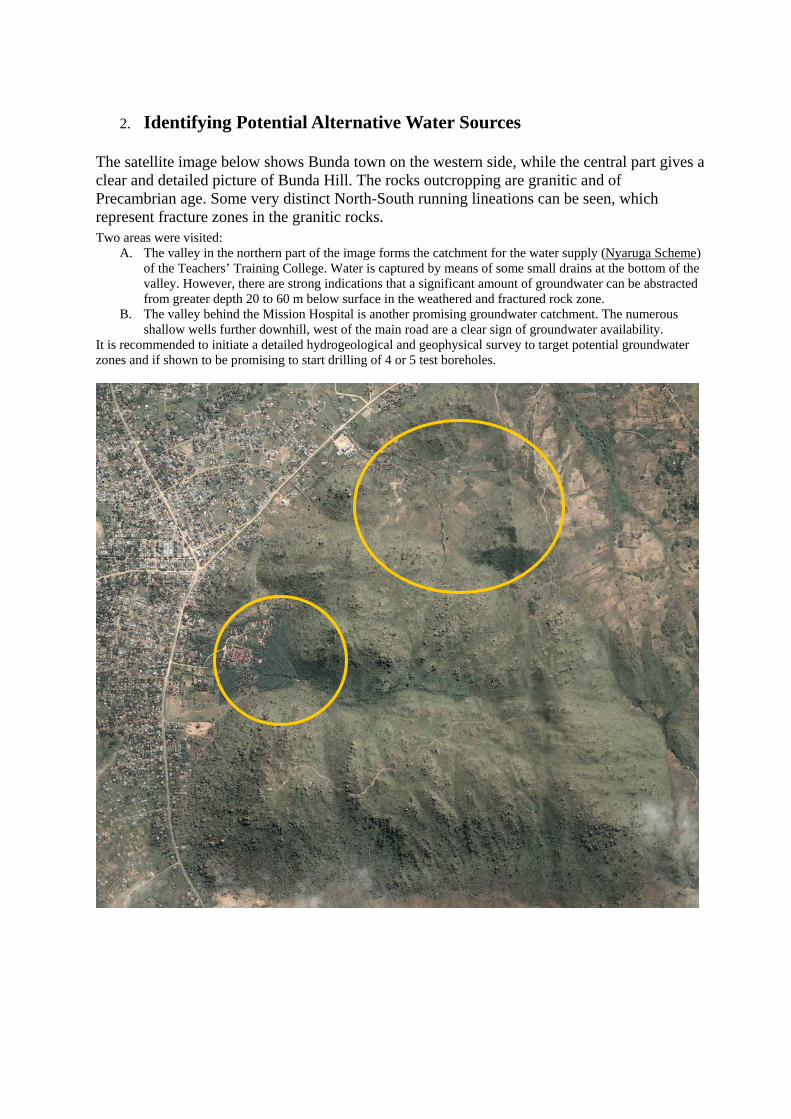
2. Identifying Potential Alternative Water Sources
The satellite image below shows Bunda town on the western side, while the central part gives a clear and detailed picture of Bunda Hill. The rocks outcropping are granitic and of Precambrian age. Some very distinct North-South running lineations can be seen, which represent fracture zones in the granitic rocks. Two areas were visited:
A. The valley in the northern part of the image forms the catchment for the water supply (Nyaruga Scheme) of the Teachers’ Training College. Water is captured by means of some small drains at the bottom of the valley. However, there are strong indications that a significant amount of groundwater can be abstracted from greater depth 20 to 60 m below surface in the weathered and fractured rock zone.
B. The valley behind the Mission Hospital is another promising groundwater catchment. The numerous shallow wells further downhill, west of the main road are a clear sign of groundwater availability.
It is recommended to initiate a detailed hydrogeological and geophysical survey to target potential groundwater zones and if shown to be promising to start drilling of 4 or 5 test boreholes.
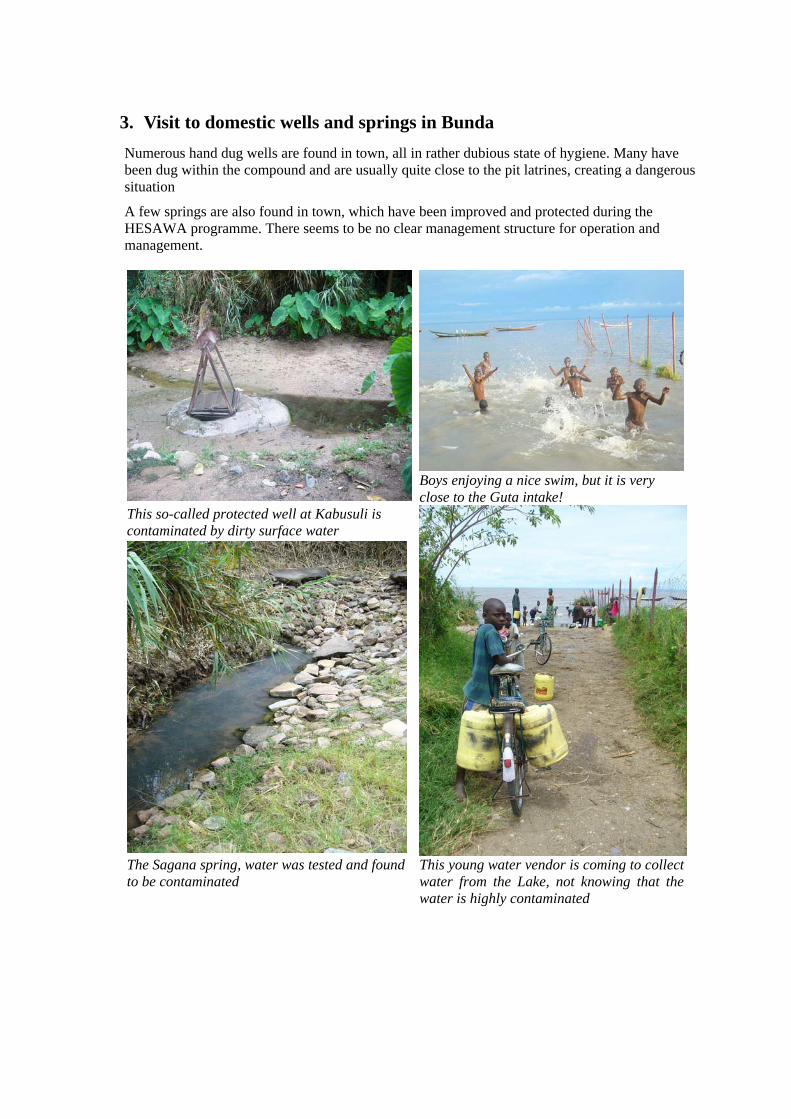
3. Visit to domestic wells and springs in Bunda Numerous hand dug wells are found in town, all in rather dubious state of hygiene. Many have been dug within the compound and are usually quite close to the pit latrines, creating a dangerous situation
A few springs are also found in town, which have been improved and protected during the HESAWA programme. There seems to be no clear management structure for operation and management.
Boys enjoying a nice swim, but it is very close to the Guta intake!
This so-called protected well at Kabusuli is contaminated by dirty surface water
The Sagana spring, water was tested and found to be contaminated
This young water vendor is coming to collect water from the Lake, not knowing that the water is highly contaminated
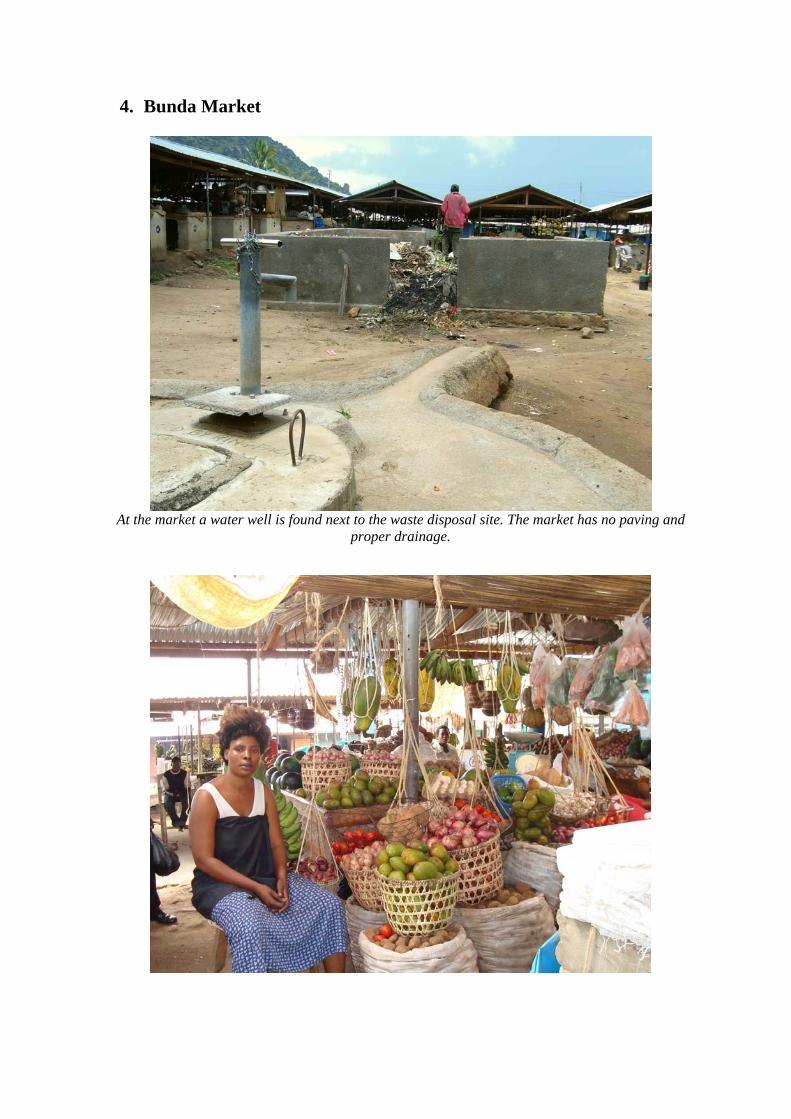
4. Bunda Market
At the market a water well is found next to the waste disposal site. The market has no paving and
proper drainage.
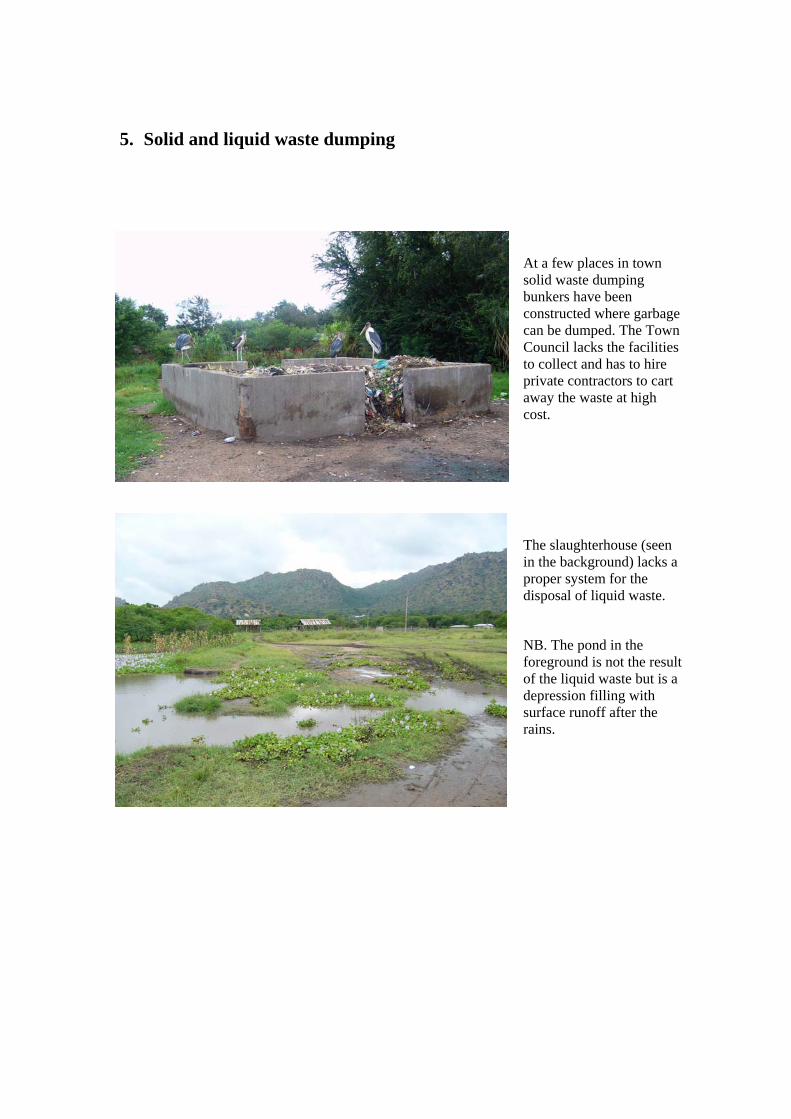
5. Solid and liquid waste dumping
At a few places in town solid waste dumping bunkers have been constructed where garbage can be dumped. The Town Council lacks the facilities to collect and has to hire private contractors to cart away the waste at high cost.
The slaughterhouse (seen in the background) lacks a proper system for the disposal of liquid waste.
NB. The pond in the foreground is not the result of the liquid waste but is a depression filling with surface runoff after the rains.

6. Roads and Drainage in Bunda Town Only the main road through Bunda, being the highway from Mwanza to Musoma is tarmacked, however, most of the main secondary roads in Bunda are in reasonable shape. This is in particular where drainage has been improved. However, other roads are in poor shape, due to inadequate or non-existent drainage. During the rains most of these roads become the drain channels along which the storm water runs off towards the low-lying areas.
Bad drainage Good drainage
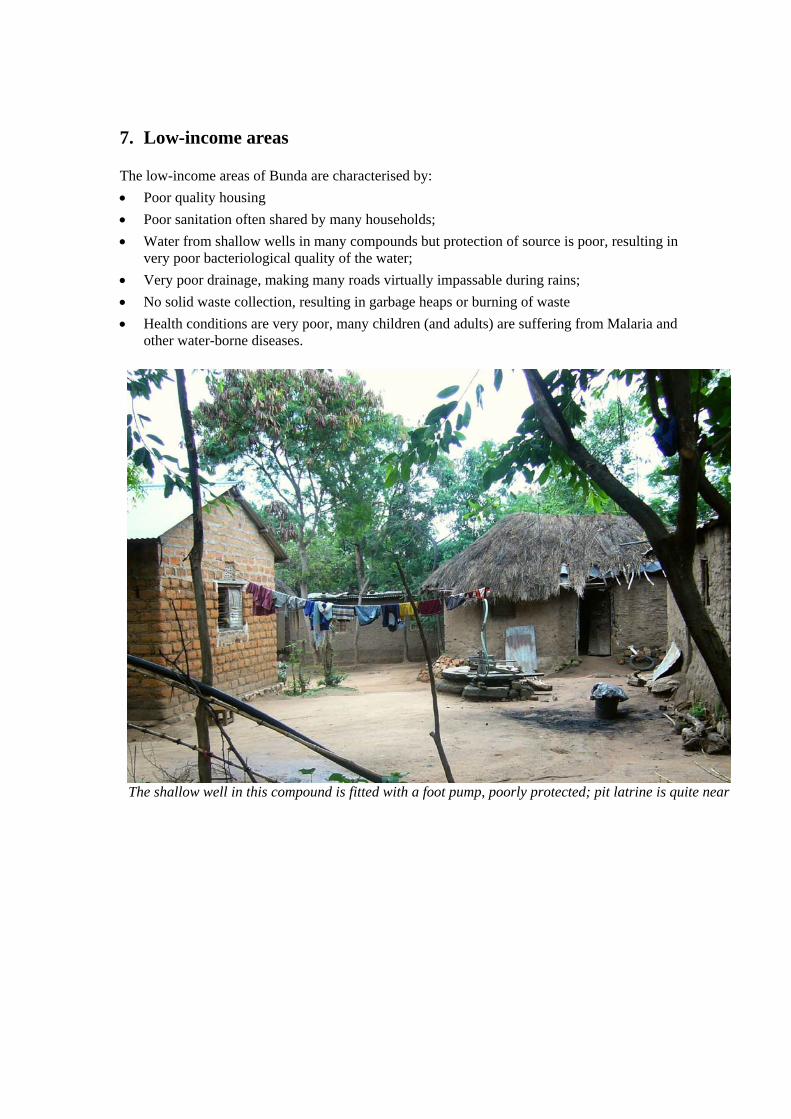
7. Low-income areas The low-income areas of Bunda are characterised by: • Poor quality housing • Poor sanitation often shared by many households; • Water from shallow wells in many compounds but protection of source is poor, resulting in
very poor bacteriological quality of the water; • Very poor drainage, making many roads virtually impassable during rains; • No solid waste collection, resulting in garbage heaps or burning of waste • Health conditions are very poor, many children (and adults) are suffering from Malaria and
other water-borne diseases.
The shallow well in this compound is fitted with a foot pump, poorly protected; pit latrine is quite near

ANNEX 2
Programme of the MultiStakeholder Workshop
held in Bunda on 29th October, 2008
MultiStakeholder Forum Workshop in Bunda on 29th October, 2008
Lake Victoria Region Water and Sanitation Initiative Multi - Stakeholder Workshop
BUNDA 29 October 2008
Objectives of Stakeholder Workshop in Bunda Specific objectives of this workshop are to:
Build consensus among stakeholders on the preliminary findings and recommendations of the Assessment Mission
Define roles and responsibilities of various stakeholders in project preparation and implementation,
Constitute and develop terms of reference for a town-level Multi-Stakeholder Forum to oversee LVWATSAN project implementation and resolve potential or foreseen intra-urban conflicts generated by the proposed interventions.
Discuss modalities for stakeholder involvement in project monitoring and evaluation.
Programme MSF Workshop
Opening Session
09.00 – 09.10 Welcoming Remarks by Chairman of Bunda Town Council
09.10 – 09.20 Remarks by Town Clerk on development agenda for Bunda town,
09.20 – 09.40 General Introduction to LVWATSAN, the Lake Victoria Region Water and Sanitation Initiative, by Philbert Ishengoma, UN-Habitat Programme Chief Technical Adviser, Tanzania.
09.40 – 10.00 Introduction of Workshop Objectives and Programme by Town Clerk Bunda
10.00 – 10.20 Introduction to the special programme components of LVWATSAN, Gender and Vulnerable Groups, by Ms. Anne Malebo
10.20 - 10.45 TEA & COFFEE BREAK
Plenary Session I – Chair of Session Eng. Idd Swai
10.45 - 11.15 Presentation on the preliminary findings and recommendations of the Appraisal Mission by Pieter Van Dongen, UN-HABITAT
11.15 – 11.30 Questions and Answers
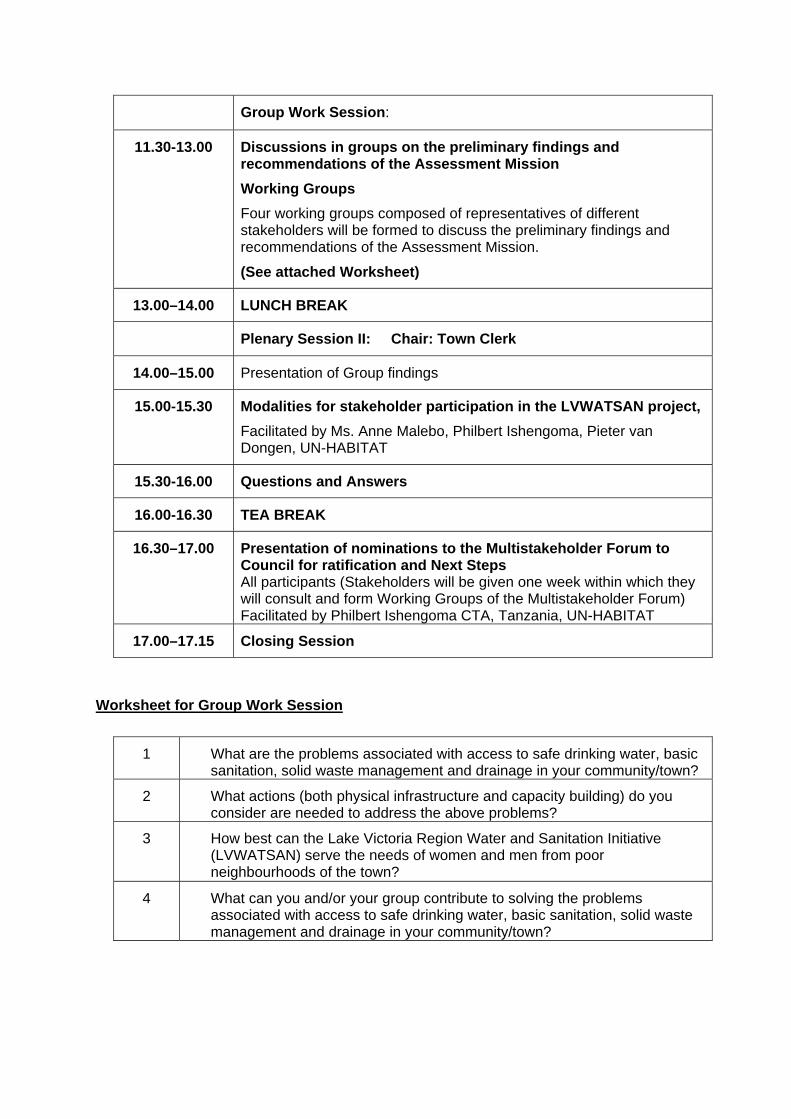
Group Work Session:
11.30-13.00 Discussions in groups on the preliminary findings and recommendations of the Assessment Mission Working Groups Four working groups composed of representatives of different stakeholders will be formed to discuss the preliminary findings and recommendations of the Assessment Mission.
(See attached Worksheet)
13.00–14.00 LUNCH BREAK
Plenary Session II: Chair: Town Clerk
14.00–15.00 Presentation of Group findings
15.00-15.30 Modalities for stakeholder participation in the LVWATSAN project, Facilitated by Ms. Anne Malebo, Philbert Ishengoma, Pieter van Dongen, UN-HABITAT
15.30-16.00 Questions and Answers
16.00-16.30 TEA BREAK
16.30–17.00
Presentation of nominations to the Multistakeholder Forum to Council for ratification and Next Steps All participants (Stakeholders will be given one week within which they will consult and form Working Groups of the Multistakeholder Forum) Facilitated by Philbert Ishengoma CTA, Tanzania, UN-HABITAT
17.00–17.15 Closing Session
Worksheet for Group Work Session
1 What are the problems associated with access to safe drinking water, basic sanitation, solid waste management and drainage in your community/town?
2 What actions (both physical infrastructure and capacity building) do you consider are needed to address the above problems?
3 How best can the Lake Victoria Region Water and Sanitation Initiative (LVWATSAN) serve the needs of women and men from poor neighbourhoods of the town?
4
What can you and/or your group contribute to solving the problems associated with access to safe drinking water, basic sanitation, solid waste management and drainage in your community/town?

ANNEX 3
RESULTS UIS, BUNDA, 2007
Bunda Stoo 19.5
Bunda Mjini 17.1
Manyamanyama 0
Mbulumatare 0
Migungani 7.3
Nyamakokoto 5.6
Nyasura 1.8
Nyerere 0
Saranga 15.3
Balili 0.9
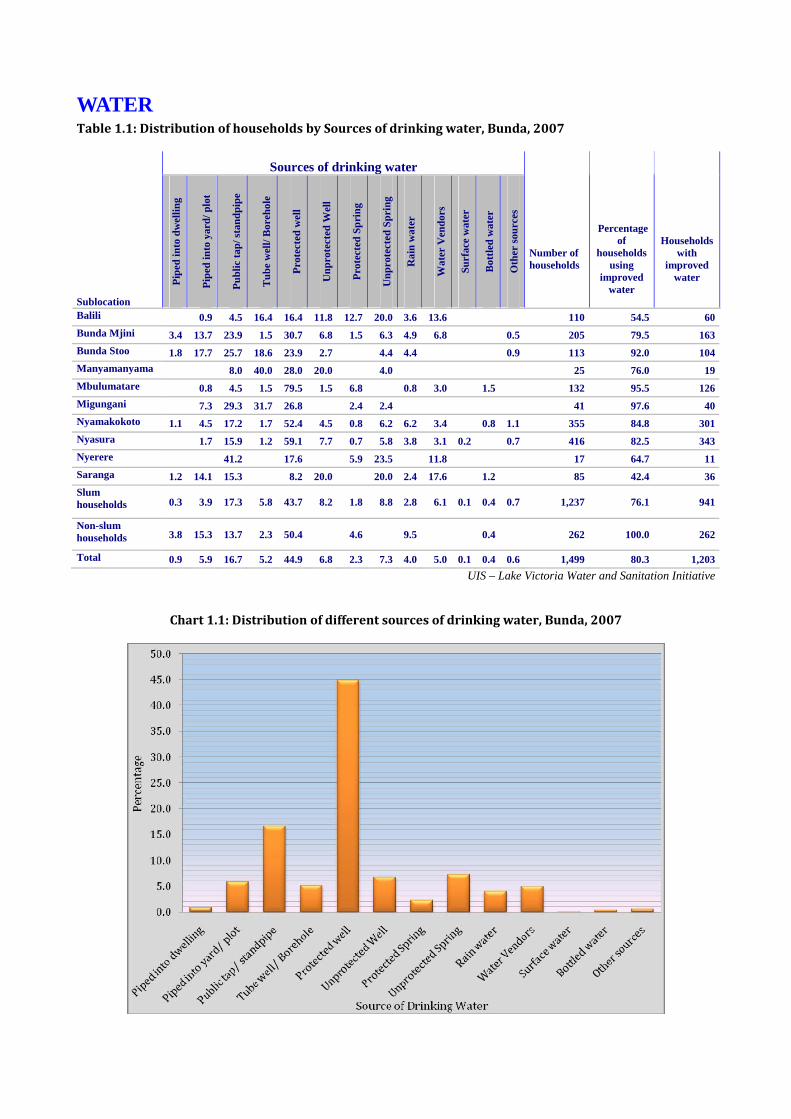
WATER Table 1.1: Distribution of households by Sources of drinking water, Bunda, 2007
Sources of drinking water
Sublocation
Pipe
d in
to d
wel
ling
Pipe
d in
to y
ard/
plo
t
Publ
ic ta
p/ st
andp
ipe
Tub
e w
ell/
Bor
ehol
e
Prot
ecte
d w
ell
Unp
rote
cted
Wel
l
Prot
ecte
d Sp
ring
Unp
rote
cted
Spr
ing
Rai
n w
ater
Wat
er V
endo
rs
Surf
ace
wat
er
Bot
tled
wat
er
Oth
er so
urce
s
Number of households
Percentage of
households using
improved water
Households with
improved water
Balili 0.9 4.5 16.4 16.4 11.8 12.7 20.0 3.6 13.6 110 54.5 60Bunda Mjini 3.4 13.7 23.9 1.5 30.7 6.8 1.5 6.3 4.9 6.8 0.5 205 79.5 163Bunda Stoo 1.8 17.7 25.7 18.6 23.9 2.7 4.4 4.4 0.9 113 92.0 104Manyamanyama 8.0 40.0 28.0 20.0 4.0 25 76.0 19Mbulumatare 0.8 4.5 1.5 79.5 1.5 6.8 0.8 3.0 1.5 132 95.5 126Migungani 7.3 29.3 31.7 26.8 2.4 2.4 41 97.6 40Nyamakokoto 1.1 4.5 17.2 1.7 52.4 4.5 0.8 6.2 6.2 3.4 0.8 1.1 355 84.8 301Nyasura 1.7 15.9 1.2 59.1 7.7 0.7 5.8 3.8 3.1 0.2 0.7 416 82.5 343Nyerere 41.2 17.6 5.9 23.5 11.8 17 64.7 11Saranga 1.2 14.1 15.3 8.2 20.0 20.0 2.4 17.6 1.2 85 42.4 36Slum households 0.3 3.9 17.3 5.8 43.7 8.2 1.8 8.8 2.8 6.1 0.1 0.4 0.7 1,237 76.1 941
Non-slum households 3.8 15.3 13.7 2.3 50.4 4.6 9.5 0.4 262 100.0 262
Total 0.9 5.9 16.7 5.2 44.9 6.8 2.3 7.3 4.0 5.0 0.1 0.4 0.6 1,499 80.3 1,203UIS – Lake Victoria Water and Sanitation Initiative
Chart 1.1: Distribution of different sources of drinking water, Bunda, 2007
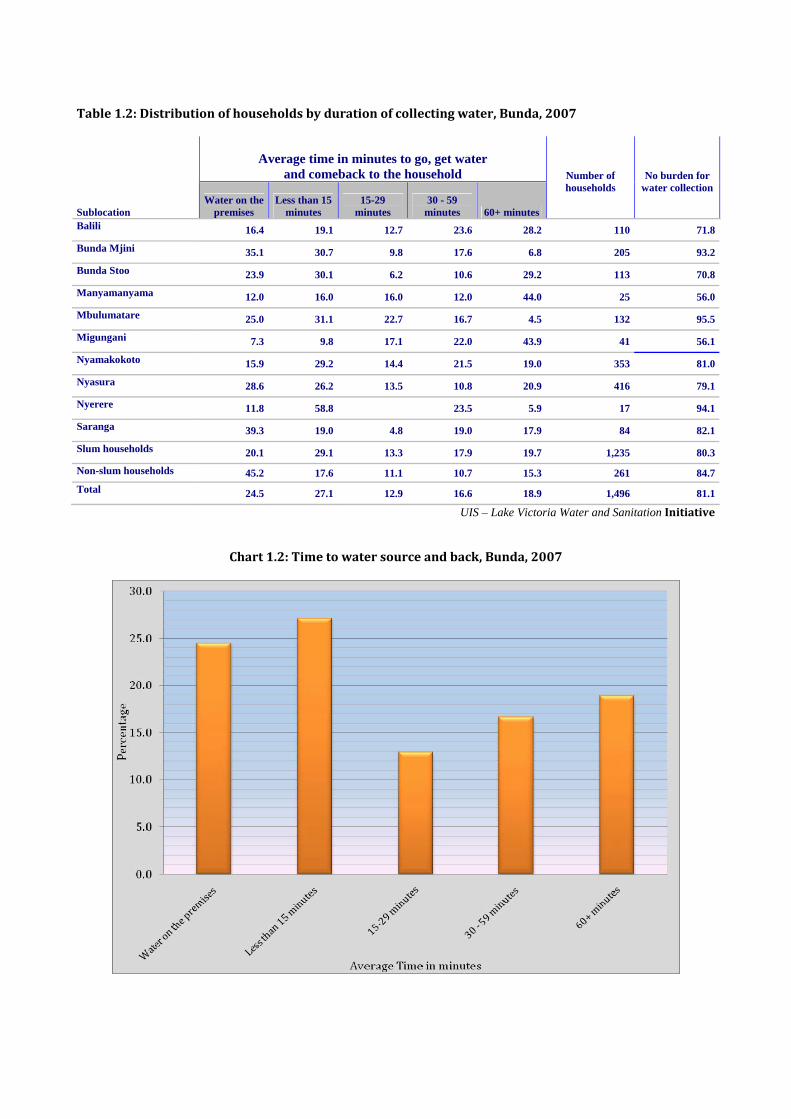
Table 1.2: Distribution of households by duration of collecting water, Bunda, 2007
Average time in minutes to go, get water and comeback to the household
Sublocation Water on the
premises Less than 15
minutes 15-29
minutes 30 - 59
minutes 60+ minutes
Number of households
No burden for water collection
Balili 16.4 19.1 12.7 23.6 28.2 110 71.8
Bunda Mjini 35.1 30.7 9.8 17.6 6.8 205 93.2
Bunda Stoo 23.9 30.1 6.2 10.6 29.2 113 70.8
Manyamanyama 12.0 16.0 16.0 12.0 44.0 25 56.0
Mbulumatare 25.0 31.1 22.7 16.7 4.5 132 95.5
Migungani 7.3 9.8 17.1 22.0 43.9 41 56.1
Nyamakokoto 15.9 29.2 14.4 21.5 19.0 353 81.0
Nyasura 28.6 26.2 13.5 10.8 20.9 416 79.1
Nyerere 11.8 58.8 23.5 5.9 17 94.1
Saranga 39.3 19.0 4.8 19.0 17.9 84 82.1
Slum households 20.1 29.1 13.3 17.9 19.7 1,235 80.3
Non-slum households 45.2 17.6 11.1 10.7 15.3 261 84.7Total 24.5 27.1 12.9 16.6 18.9 1,496 81.1
UIS – Lake Victoria Water and Sanitation Initiative
Chart 1.2: Time to water source and back, Bunda, 2007
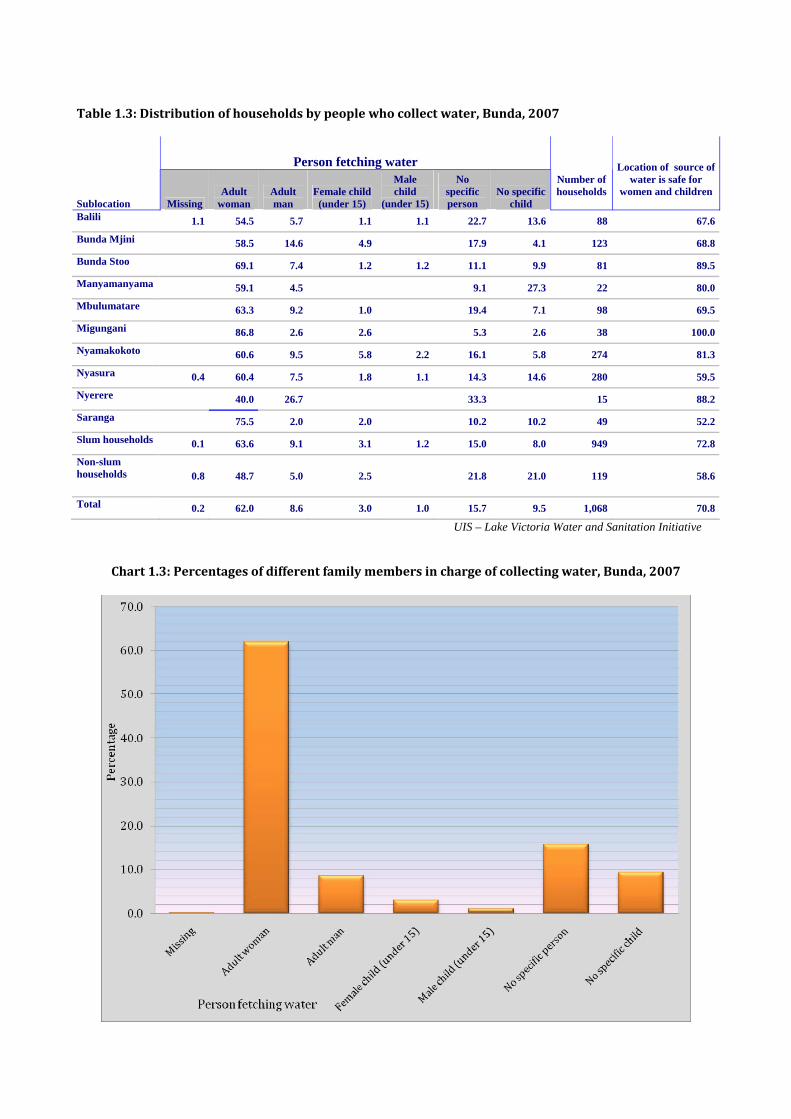
Table 1.3: Distribution of households by people who collect water, Bunda, 2007
Person fetching water
Sublocation Missing Adult
woman Adult man
Female child (under 15)
Male child
(under 15)
No specific person
No specific child
Number of households
Location of source of water is safe for
women and children
Balili 1.1 54.5 5.7 1.1 1.1 22.7 13.6 88 67.6
Bunda Mjini 58.5 14.6 4.9 17.9 4.1 123 68.8
Bunda Stoo 69.1 7.4 1.2 1.2 11.1 9.9 81 89.5
Manyamanyama 59.1 4.5 9.1 27.3 22 80.0
Mbulumatare 63.3 9.2 1.0 19.4 7.1 98 69.5
Migungani 86.8 2.6 2.6 5.3 2.6 38 100.0
Nyamakokoto 60.6 9.5 5.8 2.2 16.1 5.8 274 81.3
Nyasura 0.4 60.4 7.5 1.8 1.1 14.3 14.6 280 59.5
Nyerere 40.0 26.7 33.3 15 88.2
Saranga 75.5 2.0 2.0 10.2 10.2 49 52.2
Slum households 0.1 63.6 9.1 3.1 1.2 15.0 8.0 949 72.8
Non-slum households 0.8 48.7 5.0 2.5 21.8 21.0 119 58.6
Total 0.2 62.0 8.6 3.0 1.0 15.7 9.5 1,068 70.8
UIS – Lake Victoria Water and Sanitation Initiative
Chart 1.3: Percentages of different family members in charge of collecting water, Bunda, 2007
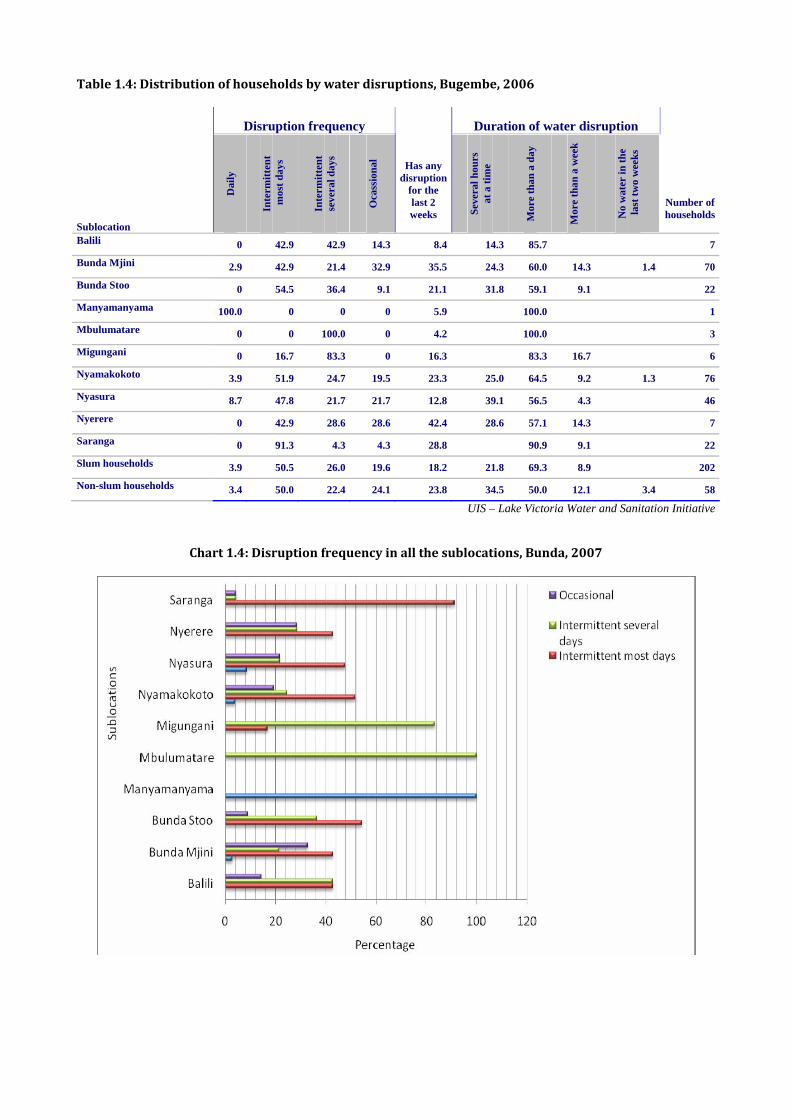
Table 1.4: Distribution of households by water disruptions, Bugembe, 2006
Disruption frequency Duration of water disruption
Sublocation D
aily
Inte
rmitt
ent
mos
t day
s
Inte
rmitt
ent
seve
ral d
ays
Oca
ssio
nal
Has any disruption
for the last 2 weeks
Seve
ral h
ours
at
a ti
me
Mor
e th
an a
day
Mor
e th
an a
wee
k
No
wat
er in
the
last
two
wee
ks
Number of households
Balili 0 42.9 42.9 14.3 8.4 14.3 85.7 7
Bunda Mjini 2.9 42.9 21.4 32.9 35.5 24.3 60.0 14.3 1.4 70
Bunda Stoo 0 54.5 36.4 9.1 21.1 31.8 59.1 9.1 22
Manyamanyama 100.0 0 0 0 5.9 100.0 1
Mbulumatare 0 0 100.0 0 4.2 100.0 3
Migungani 0 16.7 83.3 0 16.3 83.3 16.7 6
Nyamakokoto 3.9 51.9 24.7 19.5 23.3 25.0 64.5 9.2 1.3 76
Nyasura 8.7 47.8 21.7 21.7 12.8 39.1 56.5 4.3 46
Nyerere 0 42.9 28.6 28.6 42.4 28.6 57.1 14.3 7
Saranga 0 91.3 4.3 4.3 28.8 90.9 9.1 22
Slum households 3.9 50.5 26.0 19.6 18.2 21.8 69.3 8.9 202
Non-slum households 3.4 50.0 22.4 24.1 23.8 34.5 50.0 12.1 3.4 58
UIS – Lake Victoria Water and Sanitation Initiative
Chart 1.4: Disruption frequency in all the sublocations, Bunda, 2007

Table 1.5: Distribution of households by primary methods of treating water, Bunda, 2007
Primary method of treating water
Sublocation Boil
Add bleach or
chlorine Sieve it
through cloth Use water
filter Solar
disinfection Let stand and settle
Others
Treat water to make it safe to
drink Balili 77.9 3.2 18.9 86.4
Bunda Mjini 91.3 1.6 2.2 2.2 2.7 89.3
Bunda Stoo 79.3 4.3 5.4 2.2 5.4 3.3 81.4
Manyamanyama 69.2 30.8 52.0
Mbulumatare 68.6 7.6 18.1 3.8 1.9 79.5
Migungani 76.0 4.0 8.0 12.0 61.0
Nyamakokoto 75.5 6.1 13.3 3.2 1.8 78.3
Nyasura 80.7 5.1 9.3 0.6 0.6 2.6 1.0 74.8
Nyerere 69.2 23.1 7.7 76.5
Saranga 86.1 2.8 1.4 9.7 84.7
Slum households 77.8 4.9 11.4 1.2 0.2 3.5 1.1 76.8
Non-slum households 87.3 4.2 5.1 2.1 1.3 90.5
UIS – Lake Victoria Water and Sanitation Initiative Table 1.6: Water cost for households connected with piped water, Bunda, 2007
Type of payment of water for household connected with piped water
Sublocation
Percentage of households that pay for water Don't pay
Monthly
According to monthly
consumption Number of households
Balili 100.0 100.0 1Bunda Mjini 96.9 3.1 78.1 18.8 32Bunda Stoo 81.0 20.0 25.0 55.0 20Mbulumatare 100.0 100.0 1Migungani 100.0 33.3 66.7 3Nyamakokoto 95.5 95.2 4.8 21Nyasura 85.7 14.3 71.4 14.3 7Saranga 100.0 58.3 41.7 12Slum households 88.7 10.0 74.0 16.0 50Non-slumhouseholds 97.9 2.1 59.6 38.3 47 Percentage of households using improved water
93.1 6.2 67.0 26.8 97
Piped into dwelling 92.3 7.7 84.6 7.7 13Piped into yard/plot 94.0 6.2 63.0 30.9 81
Protected well 0.0
Sources of drinking water
Bottled water 100.0 100.0 3Total 93.1 6.2 67.0 26.8 97
UIS – Lake Victoria Water and Sanitation Initiative
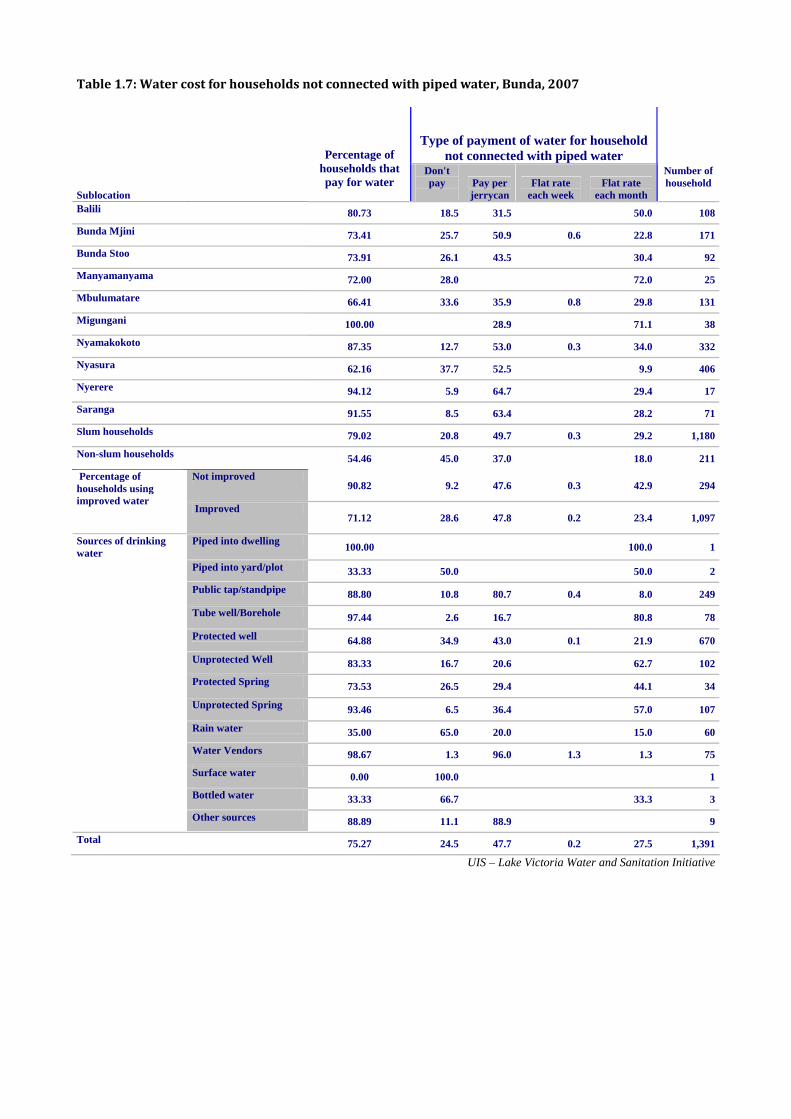
Table 1.7: Water cost for households not connected with piped water, Bunda, 2007
Type of payment of water for household
not connected with piped water
Sublocation
Percentage of households that pay for water
Don't pay
Pay per jerrycan
Flat rate each week
Flat rate each month
Number of household
Balili 80.73 18.5 31.5 50.0 108
Bunda Mjini 73.41 25.7 50.9 0.6 22.8 171
Bunda Stoo 73.91 26.1 43.5 30.4 92
Manyamanyama 72.00 28.0 72.0 25
Mbulumatare 66.41 33.6 35.9 0.8 29.8 131
Migungani 100.00 28.9 71.1 38
Nyamakokoto 87.35 12.7 53.0 0.3 34.0 332
Nyasura 62.16 37.7 52.5 9.9 406
Nyerere 94.12 5.9 64.7 29.4 17
Saranga 91.55 8.5 63.4 28.2 71
Slum households 79.02 20.8 49.7 0.3 29.2 1,180
Non-slum households 54.46 45.0 37.0 18.0 211
Not improved 90.82 9.2 47.6 0.3 42.9 294
Percentage of households using improved water
Improved 71.12 28.6 47.8 0.2 23.4 1,097
Piped into dwelling 100.00 100.0 1
Piped into yard/plot 33.33 50.0 50.0 2
Public tap/standpipe 88.80 10.8 80.7 0.4 8.0 249
Tube well/Borehole 97.44 2.6 16.7 80.8 78
Protected well 64.88 34.9 43.0 0.1 21.9 670
Unprotected Well 83.33 16.7 20.6 62.7 102
Protected Spring 73.53 26.5 29.4 44.1 34
Unprotected Spring 93.46 6.5 36.4 57.0 107
Rain water 35.00 65.0 20.0 15.0 60
Water Vendors 98.67 1.3 96.0 1.3 1.3 75
Surface water 0.00 100.0 1
Bottled water 33.33 66.7 33.3 3
Sources of drinking water
Other sources 88.89 11.1 88.9 9
Total 75.27 24.5 47.7 0.2 27.5 1,391
UIS – Lake Victoria Water and Sanitation Initiative
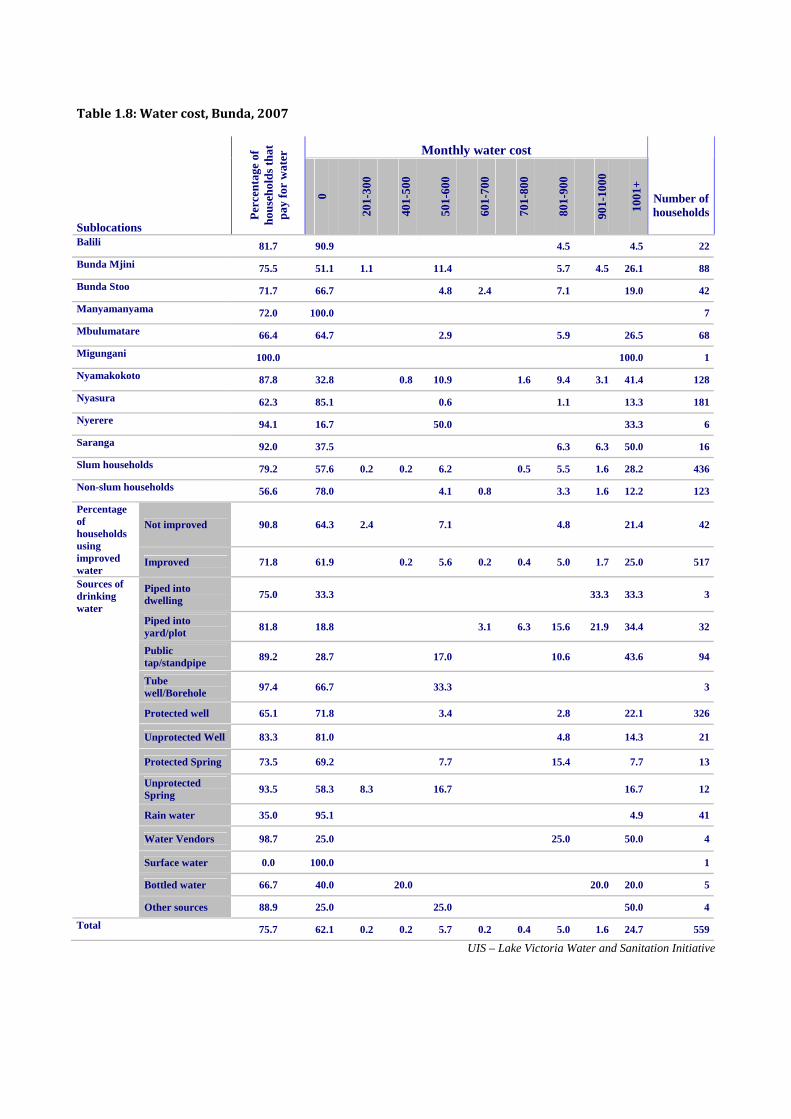
Table 1.8: Water cost, Bunda, 2007
Monthly water cost
Sublocations
Perc
enta
ge o
f ho
useh
olds
that
pa
y fo
r w
ater
0
201-
300
401-
500
501-
600
601-
700
701-
800
801-
900
901-
1000
1001
+
Number of households
Balili 81.7 90.9 4.5 4.5 22
Bunda Mjini 75.5 51.1 1.1 11.4 5.7 4.5 26.1 88
Bunda Stoo 71.7 66.7 4.8 2.4 7.1 19.0 42
Manyamanyama 72.0 100.0 7
Mbulumatare 66.4 64.7 2.9 5.9 26.5 68
Migungani 100.0 100.0 1
Nyamakokoto 87.8 32.8 0.8 10.9 1.6 9.4 3.1 41.4 128
Nyasura 62.3 85.1 0.6 1.1 13.3 181
Nyerere 94.1 16.7 50.0 33.3 6
Saranga 92.0 37.5 6.3 6.3 50.0 16
Slum households 79.2 57.6 0.2 0.2 6.2 0.5 5.5 1.6 28.2 436
Non-slum households 56.6 78.0 4.1 0.8 3.3 1.6 12.2 123
Not improved 90.8 64.3 2.4 7.1 4.8 21.4 42Percentage of households using improved water
Improved 71.8 61.9 0.2 5.6 0.2 0.4 5.0 1.7 25.0 517
Piped into dwelling 75.0 33.3 33.3 33.3 3
Piped into yard/plot 81.8 18.8 3.1 6.3 15.6 21.9 34.4 32
Public tap/standpipe 89.2 28.7 17.0 10.6 43.6 94
Tube well/Borehole 97.4 66.7 33.3 3
Protected well 65.1 71.8 3.4 2.8 22.1 326
Unprotected Well 83.3 81.0 4.8 14.3 21
Protected Spring 73.5 69.2 7.7 15.4 7.7 13
Unprotected Spring 93.5 58.3 8.3 16.7 16.7 12
Rain water 35.0 95.1 4.9 41
Water Vendors 98.7 25.0 25.0 50.0 4
Surface water 0.0 100.0 1
Bottled water 66.7 40.0 20.0 20.0 20.0 5
Sources of drinking water
Other sources 88.9 25.0 25.0 50.0 4
Total 75.7 62.1 0.2 0.2 5.7 0.2 0.4 5.0 1.6 24.7 559
UIS – Lake Victoria Water and Sanitation Initiative
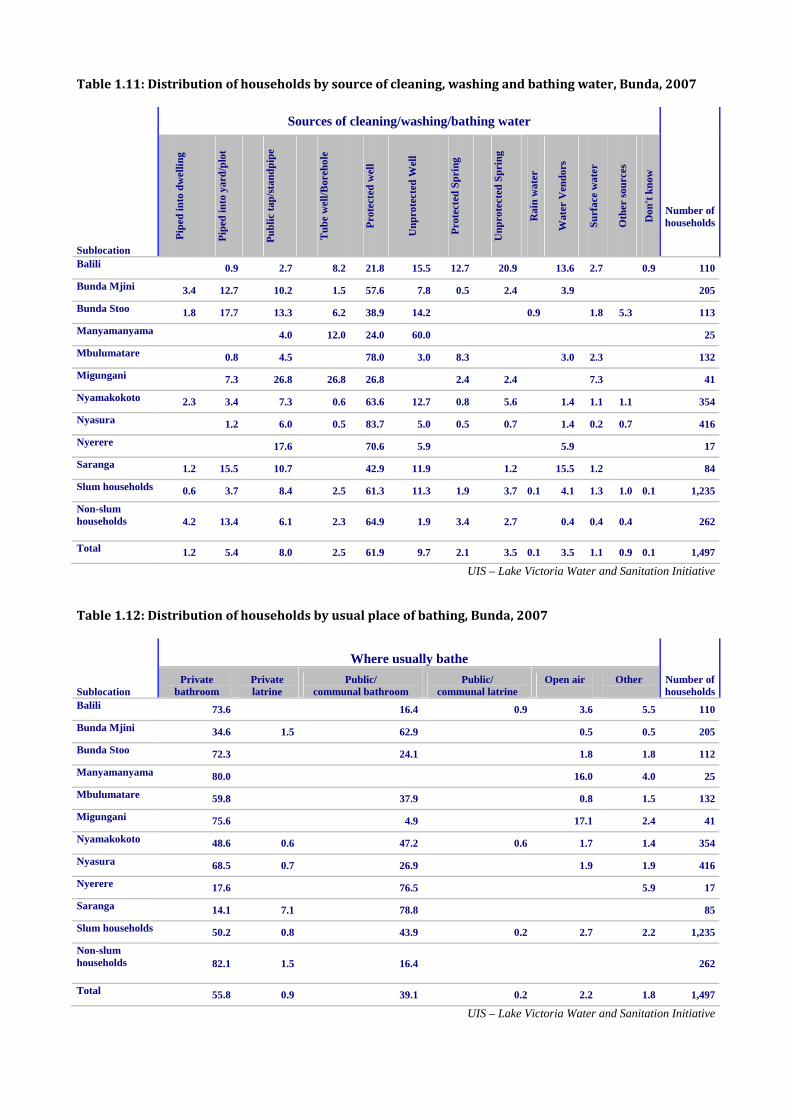
Table 1.11: Distribution of households by source of cleaning, washing and bathing water, Bunda, 2007
Sources of cleaning/washing/bathing water
Sublocation
Pipe
d in
to d
wel
ling
Pipe
d in
to y
ard/
plot
Publ
ic ta
p/st
andp
ipe
Tub
e w
ell/B
oreh
ole
Prot
ecte
d w
ell
Unp
rote
cted
Wel
l
Prot
ecte
d Sp
ring
Unp
rote
cted
Spr
ing
Rai
n w
ater
Wat
er V
endo
rs
Surf
ace
wat
er
Oth
er so
urce
s
Don
't kn
ow
Number of households
Balili 0.9 2.7 8.2 21.8 15.5 12.7 20.9 13.6 2.7 0.9 110
Bunda Mjini 3.4 12.7 10.2 1.5 57.6 7.8 0.5 2.4 3.9 205
Bunda Stoo 1.8 17.7 13.3 6.2 38.9 14.2 0.9 1.8 5.3 113
Manyamanyama 4.0 12.0 24.0 60.0 25
Mbulumatare 0.8 4.5 78.0 3.0 8.3 3.0 2.3 132
Migungani 7.3 26.8 26.8 26.8 2.4 2.4 7.3 41
Nyamakokoto 2.3 3.4 7.3 0.6 63.6 12.7 0.8 5.6 1.4 1.1 1.1 354
Nyasura 1.2 6.0 0.5 83.7 5.0 0.5 0.7 1.4 0.2 0.7 416
Nyerere 17.6 70.6 5.9 5.9 17
Saranga 1.2 15.5 10.7 42.9 11.9 1.2 15.5 1.2 84
Slum households 0.6 3.7 8.4 2.5 61.3 11.3 1.9 3.7 0.1 4.1 1.3 1.0 0.1 1,235
Non-slum households 4.2 13.4 6.1 2.3 64.9 1.9 3.4 2.7 0.4 0.4 0.4 262
Total 1.2 5.4 8.0 2.5 61.9 9.7 2.1 3.5 0.1 3.5 1.1 0.9 0.1 1,497
UIS – Lake Victoria Water and Sanitation Initiative
Table 1.12: Distribution of households by usual place of bathing, Bunda, 2007
Where usually bathe
Sublocation Private
bathroom Private latrine
Public/ communal bathroom
Public/ communal latrine
Open air
Other
Number of households
Balili 73.6 16.4 0.9 3.6 5.5 110
Bunda Mjini 34.6 1.5 62.9 0.5 0.5 205
Bunda Stoo 72.3 24.1 1.8 1.8 112
Manyamanyama 80.0 16.0 4.0 25
Mbulumatare 59.8 37.9 0.8 1.5 132
Migungani 75.6 4.9 17.1 2.4 41
Nyamakokoto 48.6 0.6 47.2 0.6 1.7 1.4 354
Nyasura 68.5 0.7 26.9 1.9 1.9 416
Nyerere 17.6 76.5 5.9 17
Saranga 14.1 7.1 78.8 85
Slum households 50.2 0.8 43.9 0.2 2.7 2.2 1,235
Non-slum households 82.1 1.5 16.4 262
Total 55.8 0.9 39.1 0.2 2.2 1.8 1,497
UIS – Lake Victoria Water and Sanitation Initiative
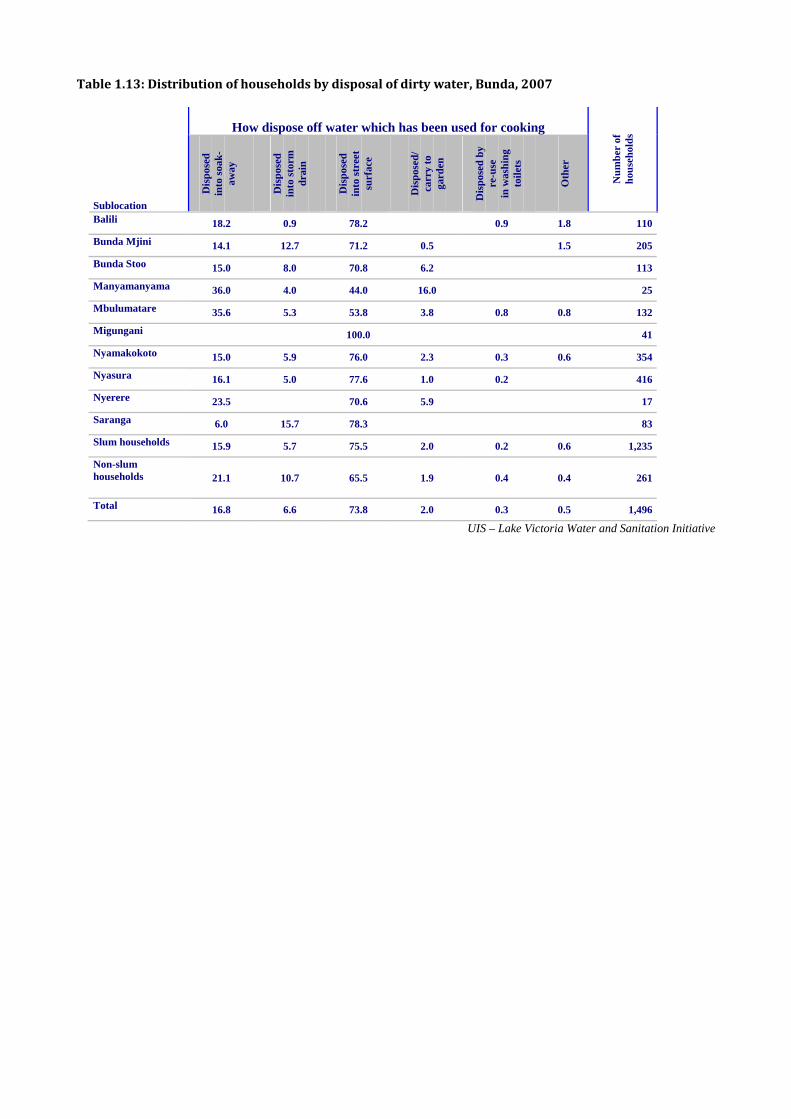
Table 1.13: Distribution of households by disposal of dirty water, Bunda, 2007
How dispose off water which has been used for cooking
Sublocation D
ispo
sed
into
soak
-aw
ay
Dis
pose
d in
to st
orm
dr
ain
Dis
pose
d in
to st
reet
su
rfac
e
Dis
pose
d/
carr
y to
ga
rden
Dis
pose
d by
re
-use
in
was
hing
to
ilets
Oth
er
Num
ber
of
hous
ehol
ds
Balili 18.2 0.9 78.2 0.9 1.8 110
Bunda Mjini 14.1 12.7 71.2 0.5 1.5 205
Bunda Stoo 15.0 8.0 70.8 6.2 113
Manyamanyama 36.0 4.0 44.0 16.0 25
Mbulumatare 35.6 5.3 53.8 3.8 0.8 0.8 132
Migungani 100.0 41
Nyamakokoto 15.0 5.9 76.0 2.3 0.3 0.6 354
Nyasura 16.1 5.0 77.6 1.0 0.2 416
Nyerere 23.5 70.6 5.9 17
Saranga 6.0 15.7 78.3 83
Slum households 15.9 5.7 75.5 2.0 0.2 0.6 1,235
Non-slum households 21.1 10.7 65.5 1.9 0.4 0.4 261
Total 16.8 6.6 73.8 2.0 0.3 0.5 1,496
UIS – Lake Victoria Water and Sanitation Initiative
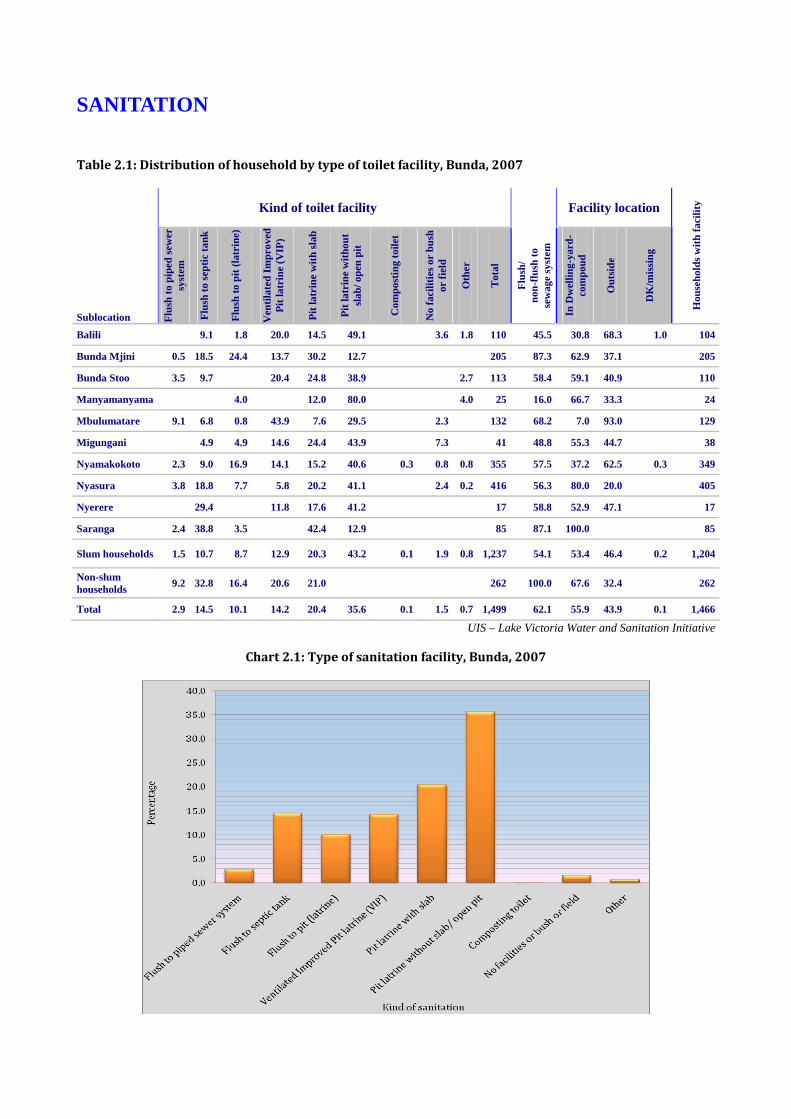
SANITATION
Table 2.1: Distribution of household by type of toilet facility, Bunda, 2007
Kind of toilet facility
Facility location
Sublocation Flus
h to
pip
ed se
wer
sy
stem
Flus
h to
sept
ic ta
nk
Flus
h to
pit
(latr
ine)
Ven
tilat
ed Im
prov
ed
Pit l
atri
ne (V
IP)
Pit l
atri
ne w
ith sl
ab
Pit l
atri
ne w
ithou
t sl
ab/ o
pen
pit
Com
post
ing
toile
t
No
faci
litie
s or
bush
or
fiel
d
Oth
er
Tot
al
Flus
h/
non-
flush
to
sew
age
syst
em
In D
wel
ling-
yard
-co
mpo
ud
Out
side
DK
/mis
sing
Hou
seho
lds w
ith fa
cilit
y
Balili 9.1 1.8 20.0 14.5 49.1 3.6 1.8 110 45.5 30.8 68.3 1.0 104
Bunda Mjini 0.5 18.5 24.4 13.7 30.2 12.7 205 87.3 62.9 37.1 205
Bunda Stoo 3.5 9.7 20.4 24.8 38.9 2.7 113 58.4 59.1 40.9 110
Manyamanyama 4.0 12.0 80.0 4.0 25 16.0 66.7 33.3 24
Mbulumatare 9.1 6.8 0.8 43.9 7.6 29.5 2.3 132 68.2 7.0 93.0 129
Migungani 4.9 4.9 14.6 24.4 43.9 7.3 41 48.8 55.3 44.7 38
Nyamakokoto 2.3 9.0 16.9 14.1 15.2 40.6 0.3 0.8 0.8 355 57.5 37.2 62.5 0.3 349
Nyasura 3.8 18.8 7.7 5.8 20.2 41.1 2.4 0.2 416 56.3 80.0 20.0 405
Nyerere 29.4 11.8 17.6 41.2 17 58.8 52.9 47.1 17
Saranga 2.4 38.8 3.5 42.4 12.9 85 87.1 100.0 85
Slum households 1.5 10.7 8.7 12.9 20.3 43.2 0.1 1.9 0.8 1,237 54.1 53.4 46.4 0.2 1,204
Non-slum households 9.2 32.8 16.4 20.6 21.0 262 100.0 67.6 32.4 262
Total 2.9 14.5 10.1 14.2 20.4 35.6 0.1 1.5 0.7 1,499 62.1 55.9 43.9 0.1 1,466
UIS – Lake Victoria Water and Sanitation Initiative
Chart 2.1: Type of sanitation facility, Bunda, 2007

Table 2.2: Distribution of households by facility status, shared or not, Bunda, 2007
Households sharing facility Facility public or not
Sublocation
Facility shared
Not shared
2
3-5
6-9
10+
Not shared
Private
Semi-private
Public
DK
Total Balili 30.8 68.9 19.4 6.8 4.9 71 32 106
Bunda Mjini 71.7 28.6 9.9 29.6 23.6 8.4 58 116 27 4 205
Bunda Stoo 40.0 60.0 13.6 21.8 2.7 1.8 66 42 2 113
Manyamanyama 4.2 95.8 4.2 23 1 25
Mbulumatare 59.7 41.3 15.9 33.3 5.6 4.0 52 51 25 129
Migungani 10.5 89.5 10.5 34 4 38
Nyamakokoto 58.2 41.8 9.5 23.3 9.8 15.6 145 169 34 351
Nyasura 35.6 64.4 10.6 21.2 2.7 1.0 261 124 18 1 1 406
Nyerere 76.5 25.0 25.0 25.0 25.0 4 13 17
Saranga 80.0 20.0 9.4 34.1 25.9 10.6 17 54 14 85
Slum households 56.1 43.9 9.5 27.8 11.2 7.6 526 557 112 5 1 1,213
Non-slum households 21.8 79.2 20.8 205 49 8 262
Total 50.0 50.2 11.5 22.9 9.2 6.2 731 606 120 5 1 1,475
UIS – Lake Victoria Water and Sanitation Initiative
Table 2.3: Distribution of households by facility status, shared or not, Bunda, 2007
Stools of young children
Sublocations
Mixed facility
Households with
women and shared toilet
Children <5 using
same facility
Households with
facility and
kid <5
Chi
ld u
se to
ilet
Thr
own
into
toile
t
Thr
own
outs
ide
the
yard
Thr
own
into
gar
bage
Bur
ried
out
side
the
yard
Not
dis
pose
d
Oth
er
Number of households with Kids
<3 Balili 93.8 32 21.3 61 98.0 2.0 49
Bunda Mjini 91.8 147 14.0 100 3.5 95.3 1.2 85
Bunda Stoo 97.7 44 18.6 70 3.4 94.8 1.7 58
Manyamanyama 100.0 1 14.3 14 15.4 76.9 7.7 13
Mbulumatare 94.8 77 27.0 63 2.2 91.3 2.2 4.3 46Migungani 100.0 4 14.3 28 95.8 4.2 24
Nyamakokoto 95.6 203 25.3 174 1.5 92.5 1.5 4.5 133Nyasura 97.2 144 21.4 238 0.5 98.4 0.5 0.5 187Nyerere 100.0 13 20.0 5 100.0 4
Saranga 95.6 68 19.0 42 100.0 34
Slum households 95.4 676 19.0 674 1.1 96.0 0.2 0.5 1.5 0.2 0.5 550
Non-slum households 93.0 57 32.2 121 6.0 91.6 1.2 1.2 83
Total 95.2 733 21.0 795 1.7 95.4 0.3 0.5 1.3 0.3 0.5 633
UIS – Lake Victoria Water and Sanitation Initiative
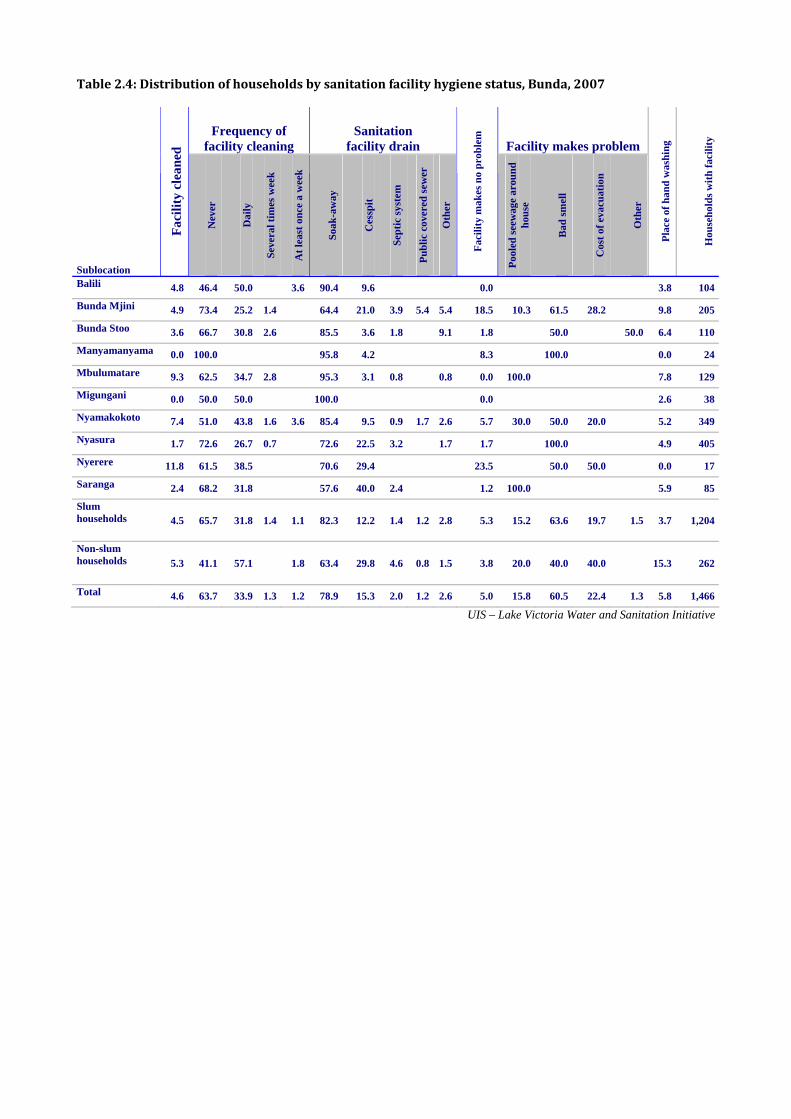
Table 2.4: Distribution of households by sanitation facility hygiene status, Bunda, 2007
Frequency of facility cleaning
Sanitation facility drain Facility makes problem
Sublocation
Faci
lity
clea
ned
Nev
er
Dai
ly
Seve
ral t
imes
wee
k
At l
east
onc
e a
wee
k
Soak
-aw
ay
Ces
spit
Sept
ic sy
stem
Publ
ic c
over
ed se
wer
Oth
er
Faci
lity
mak
es n
o pr
oble
m
Pool
ed se
ewag
e ar
ound
ho
use
Bad
smel
l
Cos
t of e
vacu
atio
n
Oth
er
Plac
e of
han
d w
ashi
ng
Hou
seho
lds w
ith fa
cilit
y
Balili 4.8 46.4 50.0 3.6 90.4 9.6 0.0 3.8 104
Bunda Mjini 4.9 73.4 25.2 1.4 64.4 21.0 3.9 5.4 5.4 18.5 10.3 61.5 28.2 9.8 205
Bunda Stoo 3.6 66.7 30.8 2.6 85.5 3.6 1.8 9.1 1.8 50.0 50.0 6.4 110
Manyamanyama 0.0 100.0 95.8 4.2 8.3 100.0 0.0 24
Mbulumatare 9.3 62.5 34.7 2.8 95.3 3.1 0.8 0.8 0.0 100.0 7.8 129
Migungani 0.0 50.0 50.0 100.0 0.0 2.6 38
Nyamakokoto 7.4 51.0 43.8 1.6 3.6 85.4 9.5 0.9 1.7 2.6 5.7 30.0 50.0 20.0 5.2 349
Nyasura 1.7 72.6 26.7 0.7 72.6 22.5 3.2 1.7 1.7 100.0 4.9 405
Nyerere 11.8 61.5 38.5 70.6 29.4 23.5 50.0 50.0 0.0 17
Saranga 2.4 68.2 31.8 57.6 40.0 2.4 1.2 100.0 5.9 85
Slum households 4.5 65.7 31.8 1.4 1.1 82.3 12.2 1.4 1.2 2.8 5.3 15.2 63.6 19.7 1.5 3.7 1,204
Non-slum households 5.3 41.1 57.1 1.8 63.4 29.8 4.6 0.8 1.5 3.8 20.0 40.0 40.0 15.3 262
Total 4.6 63.7 33.9 1.3 1.2 78.9 15.3 2.0 1.2 2.6 5.0 15.8 60.5 22.4 1.3 5.8 1,466
UIS – Lake Victoria Water and Sanitation Initiative

Table 2.5: Distribution of households by waste disposal, Bunda, 2007
How dispose of waste that is not composted
Sublocation
Collected by local
government
Collected by community association
Collected by private company
Dumped in the yard
Dumped in the street
Burnt in the open
Buried
Other
Neiborhood smoke, bad
smell Total
Number Balili 7.3 6.4 34.5 48.2 3.6 2.7 110
Bunda Mjini 0.5 1.0 0.5 14.1 4.9 39.5 22.9 16.6 9.8 205
Bunda Stoo 0.9 17.7 34.5 26.5 20.4 0.0 113
Manyamanyama 16.0 4.0 28.0 52.0 4.0 25
Mbulumatare 2.3 0.8 70.5 11.4 15.2 6.8 132
Migungani 12.2 36.6 26.8 2.4 22.0 17.1 41
Nyamakokoto 9.9 2.8 39.7 23.9 23.7 8.7 355
Nyasura 0.2 10.4 6.0 38.6 27.0 17.8 4.3 416
Nyerere 5.9 35.3 5.9 52.9 0.0 17
Saranga 29.4 15.3 7.1 18.8 21.2 8.2 9.4 85
Slum households 1.9 1.0 9.2 6.1 38.1 27.0 16.6 6.0 1,237
Non-slum households 0.8 1.5 0.4 8.0 5.0 46.2 15.6 22.5 8.8 262
Total 1.7 1.1 0.1 9.0 5.9 39.5 25.0 17.6 6.5 1,499
UIS – Lake Victoria Water and Sanitation Initiative
Chart 2.5: Type of waste disposal (excluding compost production), Bunda, 2007
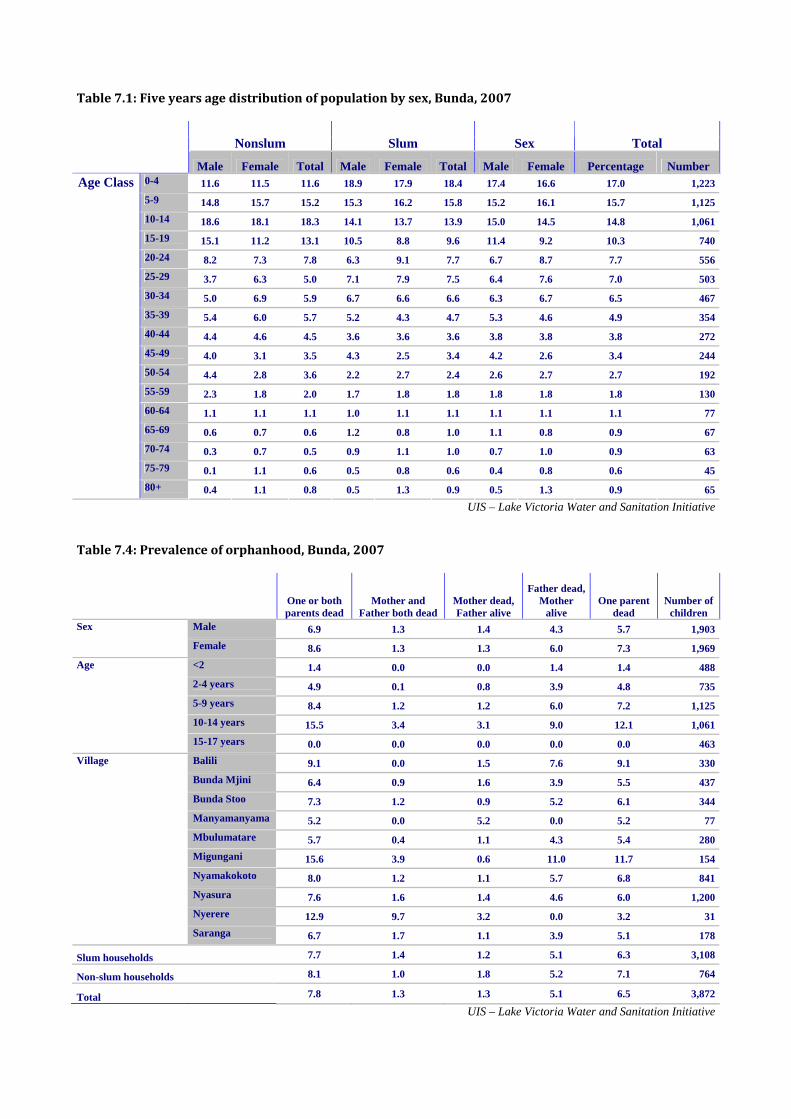
Table 7.1: Five years age distribution of population by sex, Bunda, 2007
Nonslum Slum Sex Total
Male Female Total Male Female Total Male Female Percentage Number 0-4 11.6 11.5 11.6 18.9 17.9 18.4 17.4 16.6 17.0 1,2235-9 14.8 15.7 15.2 15.3 16.2 15.8 15.2 16.1 15.7 1,12510-14 18.6 18.1 18.3 14.1 13.7 13.9 15.0 14.5 14.8 1,06115-19 15.1 11.2 13.1 10.5 8.8 9.6 11.4 9.2 10.3 74020-24 8.2 7.3 7.8 6.3 9.1 7.7 6.7 8.7 7.7 55625-29 3.7 6.3 5.0 7.1 7.9 7.5 6.4 7.6 7.0 50330-34 5.0 6.9 5.9 6.7 6.6 6.6 6.3 6.7 6.5 46735-39 5.4 6.0 5.7 5.2 4.3 4.7 5.3 4.6 4.9 35440-44 4.4 4.6 4.5 3.6 3.6 3.6 3.8 3.8 3.8 27245-49 4.0 3.1 3.5 4.3 2.5 3.4 4.2 2.6 3.4 24450-54 4.4 2.8 3.6 2.2 2.7 2.4 2.6 2.7 2.7 19255-59 2.3 1.8 2.0 1.7 1.8 1.8 1.8 1.8 1.8 13060-64 1.1 1.1 1.1 1.0 1.1 1.1 1.1 1.1 1.1 7765-69 0.6 0.7 0.6 1.2 0.8 1.0 1.1 0.8 0.9 6770-74 0.3 0.7 0.5 0.9 1.1 1.0 0.7 1.0 0.9 6375-79 0.1 1.1 0.6 0.5 0.8 0.6 0.4 0.8 0.6 45
Age Class
80+ 0.4 1.1 0.8 0.5 1.3 0.9 0.5 1.3 0.9 65UIS – Lake Victoria Water and Sanitation Initiative
Table 7.4: Prevalence of orphanhood, Bunda, 2007
One or both parents dead
Mother and Father both dead
Mother dead, Father alive
Father dead, Mother
alive One parent
dead Number of
children Male 6.9 1.3 1.4 4.3 5.7 1,903Sex
Female 8.6 1.3 1.3 6.0 7.3 1,969<2 1.4 0.0 0.0 1.4 1.4 4882-4 years 4.9 0.1 0.8 3.9 4.8 7355-9 years 8.4 1.2 1.2 6.0 7.2 1,12510-14 years 15.5 3.4 3.1 9.0 12.1 1,061
Age
15-17 years 0.0 0.0 0.0 0.0 0.0 463Balili 9.1 0.0 1.5 7.6 9.1 330Bunda Mjini 6.4 0.9 1.6 3.9 5.5 437Bunda Stoo 7.3 1.2 0.9 5.2 6.1 344Manyamanyama 5.2 0.0 5.2 0.0 5.2 77Mbulumatare 5.7 0.4 1.1 4.3 5.4 280Migungani 15.6 3.9 0.6 11.0 11.7 154Nyamakokoto 8.0 1.2 1.1 5.7 6.8 841Nyasura 7.6 1.6 1.4 4.6 6.0 1,200Nyerere 12.9 9.7 3.2 0.0 3.2 31
Village
Saranga 6.7 1.7 1.1 3.9 5.1 178
Slum households 7.7 1.4 1.2 5.1 6.3 3,108
Non-slum households 8.1 1.0 1.8 5.2 7.1 764
Total 7.8 1.3 1.3 5.1 6.5 3,872
UIS – Lake Victoria Water and Sanitation Initiative
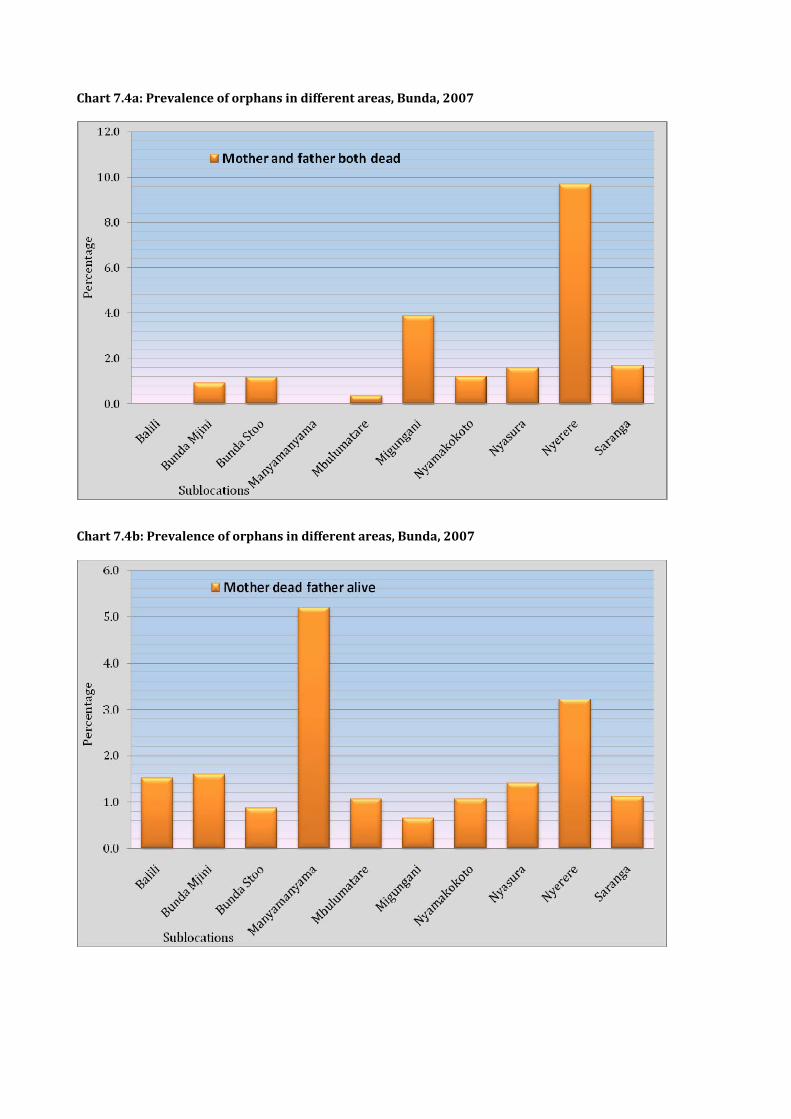
Chart 7.4a: Prevalence of orphans in different areas, Bunda, 2007
Chart 7.4b: Prevalence of orphans in different areas, Bunda, 2007

2
ANNEX 4
L PROGRESS REANNUA PORT
BUWSA for the period 2006/2007
ANNUAL PROGRESS REPORT
FOR
THE PERIOD OF 2006/2007
Bunda Urban Water Authority P. O. Box 126, BUNDA JULY 2007
3

4
LIST OF CONTENTS 1 INTRODUCTION………………………………………………………………… 2 1. DEPARTMENT ACTIVITIES…………………………………………………… 2
(i) Personnel and Administration……………………………………………. 3 (ii) Planning and Construction……………………………………………….. 5 (iii) Operation and Maintenance……………………………………………… 6
(iv) Commerce………………………………………………………………… 7 (v) Finance…………………………………………………………………… 7
(vi) Problems/Constraints………………………………………………….…. 7
(vii) Recommendations/Solution on…………………………………….…….. 8
2. PERFORMANCE INDICATORS………………………………………………… 8 A. General Indicators………………………………………………………….. 8 B. Service Indicators………………………………………………………………… 10 C. Efficiency Indicators……………………………………………………………… 11 D. Other Indicator……………………………………………………………………. 12 3. APPENDICES……………………………………………………………………13-14
5
1.0 INTRODUCTION:- Bunda Water Supply Authority was established on 21 June 2002 under the Water Works Ordinance Cap 281-Supp 62 of 4th November 1949. Apart from Bunda township, the Water Authority supplies water to Guta, Tairo and Migungani villages located at the intake and along the transmission pipeline respectively. The present Water Board is the second since the establishment of the Bunda Water Authority. The first Board started its functions on 1st June 2003 and completed its period on 30th May 2006. The Second Board was appointed on 15th Nov 2006 and is expected to be in power up to 14th Nov 2009. The Urban Water Supply Authority manages most of the water supply operations. Physical implementation includes preventive maintenance of Submersible Pumps installed into Lake Victoria, Surface pumps at Guta pump house and Booster pumps at Migungani and Ushashi pump stations. The Authority Deals with the Management of Day to Day management Water Pumps operations and maintenance. Other Areas that are taken care of are the Transmission line from Guta to Migungani booster station, Transmission line from Migungani booster station to Bunda hill water storage tanks and the distribution network (Service pipelines) to water consumers at Guta, Tairo and Bunda township. Financial operations are implemented using available revenues collected from water Tariffs. Funds from the District Council, Ministry of water and funds from any available donors. The Water Authority in turn pays monthly salary to daily employees who are engaged into special assignments. Water treatment chemicals, Fuel, Vehicle and pumps Spares and lubricants. Normally the District Council pays for water pumping electric bills and salaries for the permanent employed staff as shown in paragraph 2 table 1 below. However the manpower is supplemented by daily payees who are engaged as pumps attendants and special assignments such as trench digging and pipes laying for extension of service lines 2.0 DEPARTMENT ACTIVITIES (i) PERSONEL AND ADMINISTRATION The permanent and temporary employed staff undertakes daily, routine and all other ad-hog activities that take place. Most of the activities include repair works to the pumps and pipelines, distribution of monthly bills and collection of revenues from the above mentioned villages along the transmission lines Table-1 below shows the list of permanent and temporary employed staff. The table below shows as well the designation, academic qualification and the profession of each employee.
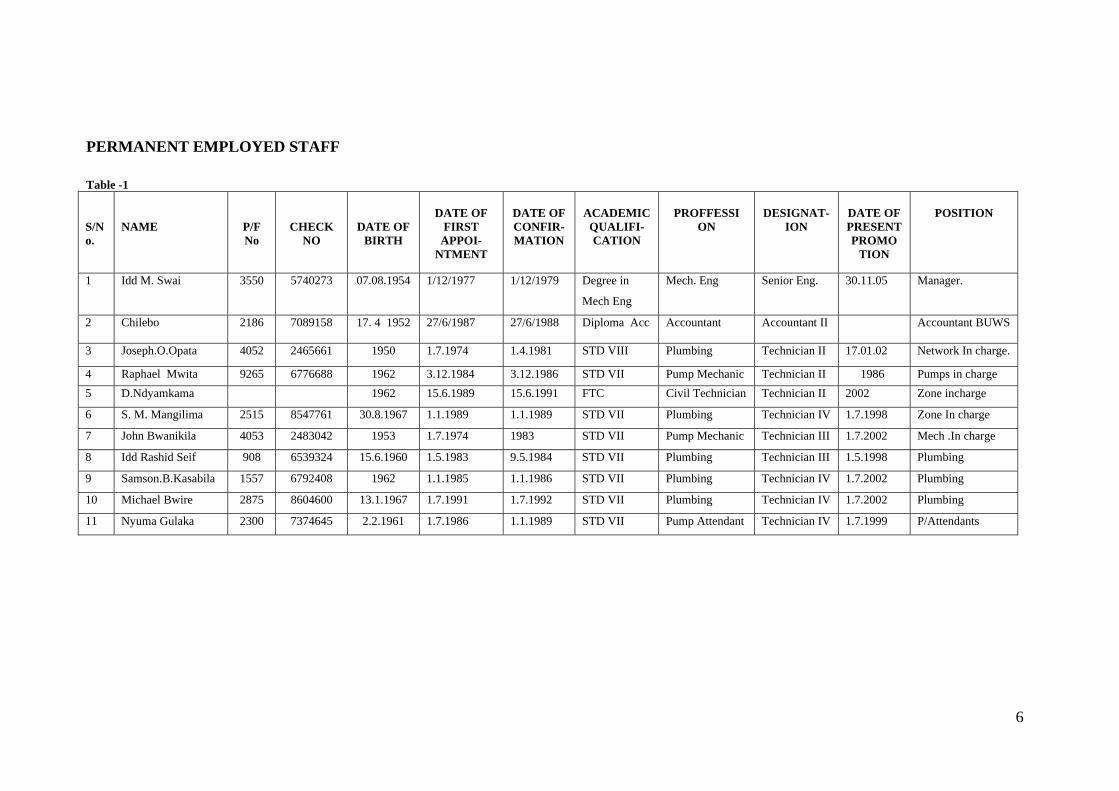
PERMANENT EMPLOYED STAFF Table -1 S/No.
NAME
P/F No
CHECK NO
DATE OF BIRTH
DATE OF
FIRST APPOI-
NTMENT
DATE OF CONFIR-MATION
ACADEMIC QUALIFI- CATION
PROFFESSI
ON
DESIGNAT-
ION
DATE OF PRESENT PROMO
TION
POSITION
1 Idd M. Swai 3550 5740273 07.08.1954 1/12/1977 1/12/1979 Degree in
Mech Eng
Mech. Eng Senior Eng. 30.11.05 Manager.
2 Chilebo 2186 7089158 17. 4 1952 27/6/1987 27/6/1988 Diploma Acc Accountant Accountant II Accountant BUWS
3 Joseph.O.Opata 4052 2465661 1950 1.7.1974 1.4.1981 STD VIII Plumbing Technician II 17.01.02 Network In charge.
4 Raphael Mwita 9265 6776688 1962 3.12.1984 3.12.1986 STD VII Pump Mechanic Technician II 1986 Pumps in charge 5 D.Ndyamkama 1962 15.6.1989 15.6.1991 FTC Civil Technician Technician II 2002 Zone incharge
6 S. M. Mangilima 2515 8547761 30.8.1967 1.1.1989 1.1.1989 STD VII Plumbing Technician IV 1.7.1998 Zone In charge
7 John Bwanikila 4053 2483042 1953 1.7.1974 1983 STD VII Pump Mechanic Technician III 1.7.2002 Mech .In charge
8 Idd Rashid Seif 908 6539324 15.6.1960 1.5.1983 9.5.1984 STD VII Plumbing Technician III 1.5.1998 Plumbing
9 Samson.B.Kasabila 1557 6792408 1962 1.1.1985 1.1.1986 STD VII Plumbing Technician IV 1.7.2002 Plumbing
10 Michael Bwire 2875 8604600 13.1.1967 1.7.1991 1.7.1992 STD VII Plumbing Technician IV 1.7.2002 Plumbing
11 Nyuma Gulaka 2300 7374645 2.2.1961 1.7.1986 1.1.1989 STD VII Pump Attendant Technician IV 1.7.1999 P/Attendants
6
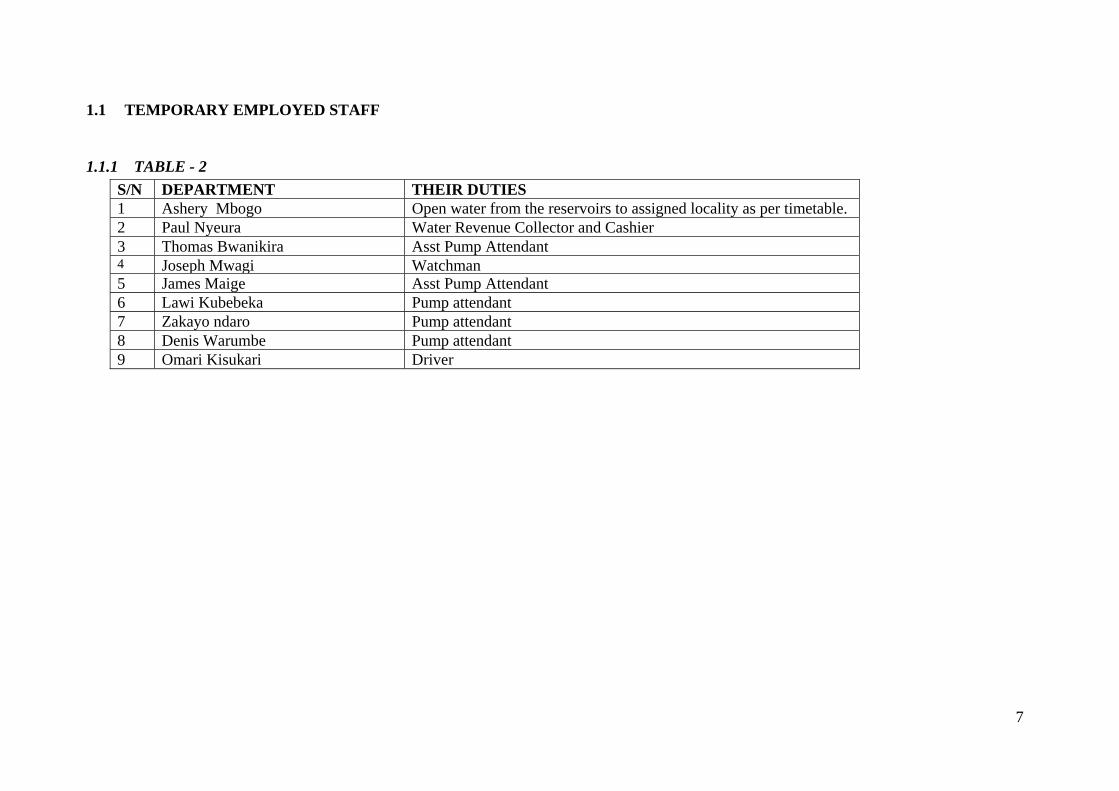
1.1 TEMPORARY EMPLOYED STAFF
1.1.1 TABLE - 2 S/N DEPARTMENT THEIR DUTIES1 Ashery Mbogo Open water from the reservoirs to assigned locality as per timetable. 2 Paul Nyeura Water Revenue Collector and Cashier 3 Thomas Bwanikira Asst Pump Attendant 4 Joseph Mwagi Watchman5 James Maige Asst Pump Attendant 6 Lawi Kubebeka Pump attendant 7 Zakayo ndaro Pump attendant 8 Denis Warumbe Pump attendant 9 Omari Kisukari Driver
7
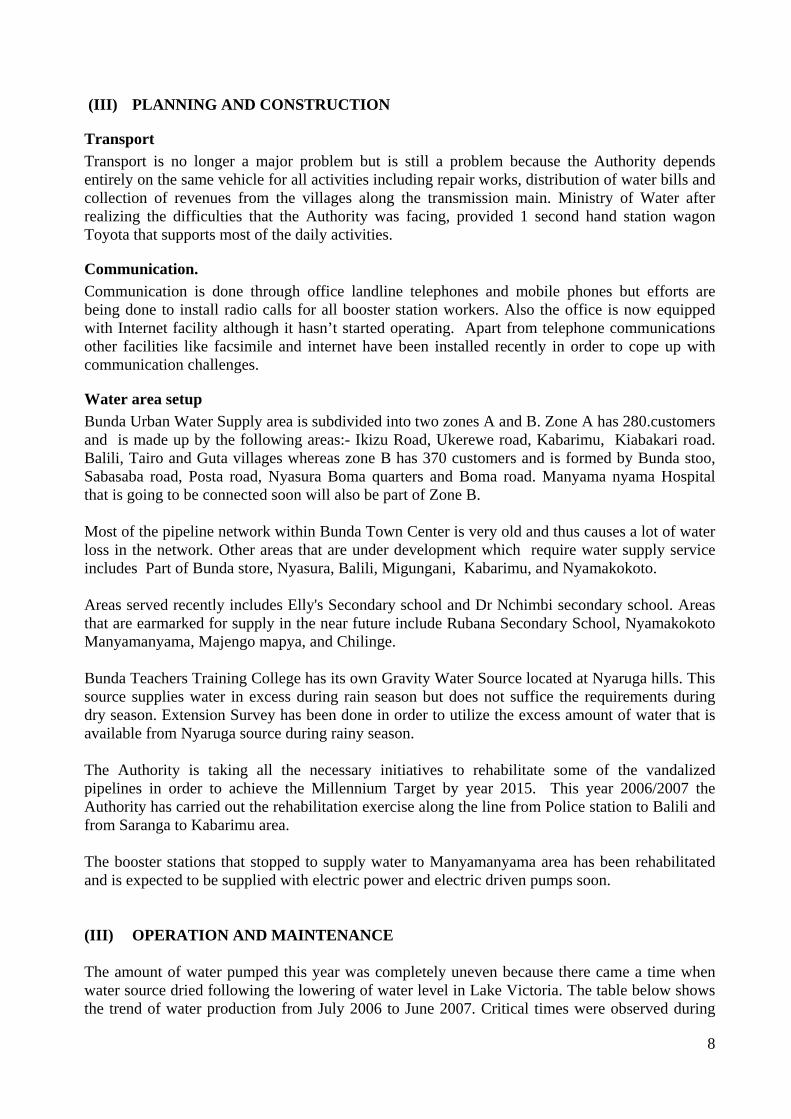
8
(III) PLANNING AND CONSTRUCTION
Transport Transport is no longer a major problem but is still a problem because the Authority depends entirely on the same vehicle for all activities including repair works, distribution of water bills and collection of revenues from the villages along the transmission main. Ministry of Water after realizing the difficulties that the Authority was facing, provided 1 second hand station wagon Toyota that supports most of the daily activities.
Communication. Communication is done through office landline telephones and mobile phones but efforts are being done to install radio calls for all booster station workers. Also the office is now equipped with Internet facility although it hasn’t started operating. Apart from telephone communications other facilities like facsimile and internet have been installed recently in order to cope up with communication challenges.
Water area setup Bunda Urban Water Supply area is subdivided into two zones A and B. Zone A has 280.customers and is made up by the following areas:- Ikizu Road, Ukerewe road, Kabarimu, Kiabakari road. Balili, Tairo and Guta villages whereas zone B has 370 customers and is formed by Bunda stoo, Sabasaba road, Posta road, Nyasura Boma quarters and Boma road. Manyama nyama Hospital that is going to be connected soon will also be part of Zone B. Most of the pipeline network within Bunda Town Center is very old and thus causes a lot of water loss in the network. Other areas that are under development which require water supply service includes Part of Bunda store, Nyasura, Balili, Migungani, Kabarimu, and Nyamakokoto. Areas served recently includes Elly's Secondary school and Dr Nchimbi secondary school. Areas that are earmarked for supply in the near future include Rubana Secondary School, Nyamakokoto Manyamanyama, Majengo mapya, and Chilinge. Bunda Teachers Training College has its own Gravity Water Source located at Nyaruga hills. This source supplies water in excess during rain season but does not suffice the requirements during dry season. Extension Survey has been done in order to utilize the excess amount of water that is available from Nyaruga source during rainy season. The Authority is taking all the necessary initiatives to rehabilitate some of the vandalized pipelines in order to achieve the Millennium Target by year 2015. This year 2006/2007 the Authority has carried out the rehabilitation exercise along the line from Police station to Balili and from Saranga to Kabarimu area. The booster stations that stopped to supply water to Manyamanyama area has been rehabilitated and is expected to be supplied with electric power and electric driven pumps soon. (III) OPERATION AND MAINTENANCE The amount of water pumped this year was completely uneven because there came a time when water source dried following the lowering of water level in Lake Victoria. The table below shows the trend of water production from July 2006 to June 2007. Critical times were observed during
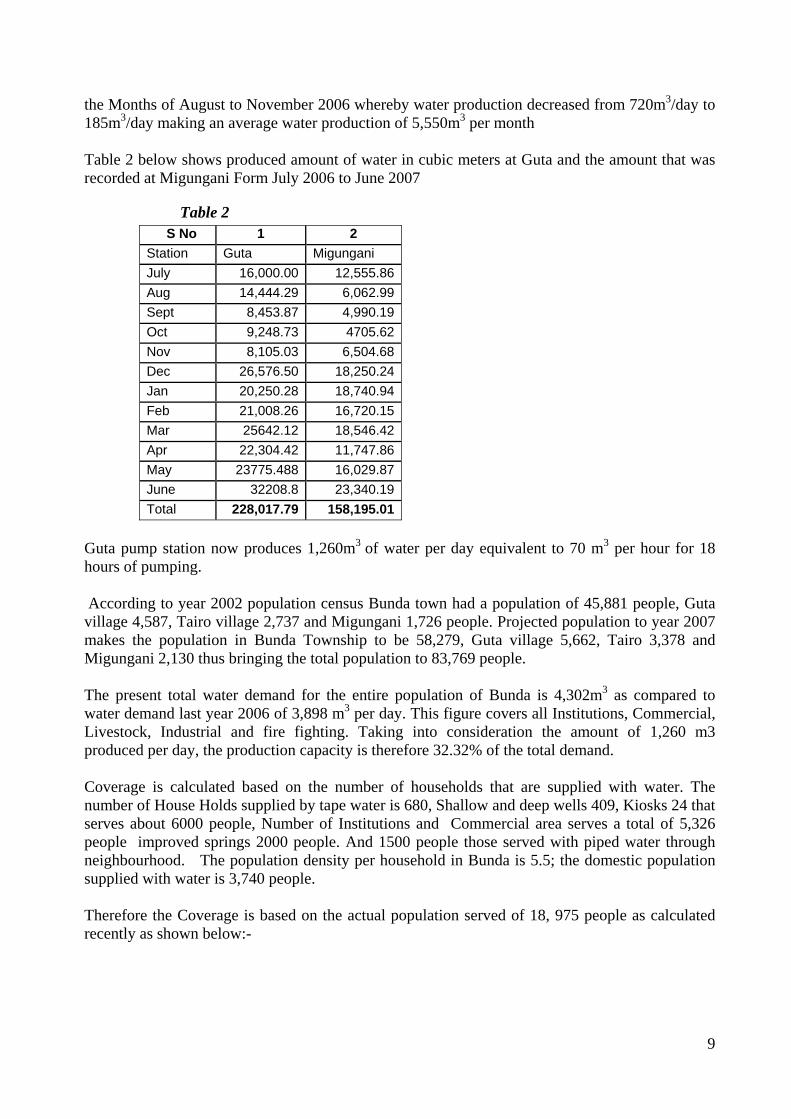
9
the Months of August to November 2006 whereby water production decreased from 720m3/day to 185m3/day making an average water production of 5,550m3 per month Table 2 below shows produced amount of water in cubic meters at Guta and the amount that was recorded at Migungani Form July 2006 to June 2007
Table 2 S No 1 2
Station Guta Migungani July 16,000.00 12,555.86Aug 14,444.29 6,062.99Sept 8,453.87 4,990.19Oct 9,248.73 4705.62Nov 8,105.03 6,504.68Dec 26,576.50 18,250.24Jan 20,250.28 18,740.94Feb 21,008.26 16,720.15Mar 25642.12 18,546.42Apr 22,304.42 11,747.86May 23775.488 16,029.87June 32208.8 23,340.19Total 228,017.79 158,195.01
Guta pump station now produces 1,260m3 of water per day equivalent to 70 m3 per hour for 18 hours of pumping. According to year 2002 population census Bunda town had a population of 45,881 people, Guta village 4,587, Tairo village 2,737 and Migungani 1,726 people. Projected population to year 2007 makes the population in Bunda Township to be 58,279, Guta village 5,662, Tairo 3,378 and Migungani 2,130 thus bringing the total population to 83,769 people. The present total water demand for the entire population of Bunda is 4,302m3 as compared to water demand last year 2006 of 3,898 m3 per day. This figure covers all Institutions, Commercial, Livestock, Industrial and fire fighting. Taking into consideration the amount of 1,260 m3 produced per day, the production capacity is therefore 32.32% of the total demand. Coverage is calculated based on the number of households that are supplied with water. The number of House Holds supplied by tape water is 680, Shallow and deep wells 409, Kiosks 24 that serves about 6000 people, Number of Institutions and Commercial area serves a total of 5,326 people improved springs 2000 people. And 1500 people those served with piped water through neighbourhood. The population density per household in Bunda is 5.5; the domestic population supplied with water is 3,740 people. Therefore the Coverage is based on the actual population served of 18, 975 people as calculated recently as shown below:-
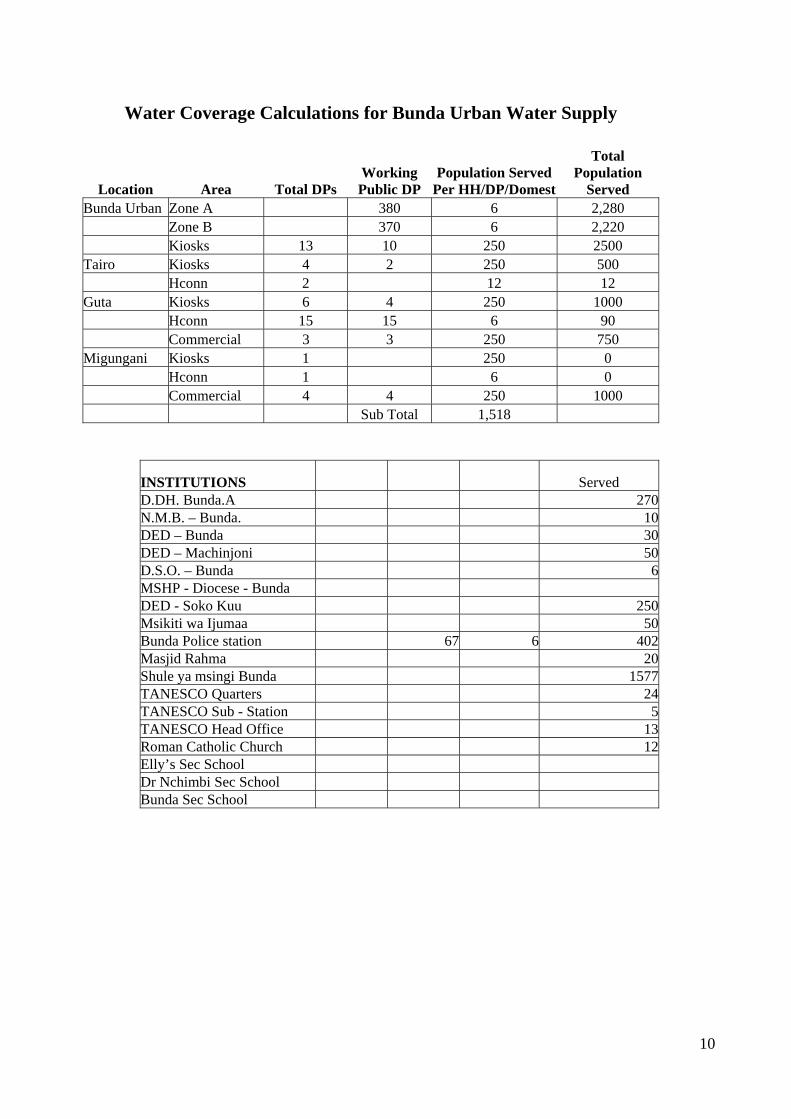
10
Water Coverage Calculations for Bunda Urban Water Supply
Location Area Total DPs Working Public DP
Population Served Per HH/DP/Domest
Total Population
Served Bunda Urban Zone A 380 6 2,280 Zone B 370 6 2,220 Kiosks 13 10 250 2500 Tairo Kiosks 4 2 250 500 Hconn 2 12 12 Guta Kiosks 6 4 250 1000 Hconn 15 15 6 90 Commercial 3 3 250 750 Migungani Kiosks 1 250 0 Hconn 1 6 0 Commercial 4 4 250 1000 Sub Total 1,518
INSTITUTIONS Served D.DH. Bunda.A 270N.M.B. – Bunda. 10DED – Bunda 30DED – Machinjoni 50D.S.O. – Bunda 6MSHP - Diocese - Bunda DED - Soko Kuu 250Msikiti wa Ijumaa 50Bunda Police station 67 6 402Masjid Rahma 20Shule ya msingi Bunda 1577TANESCO Quarters 24TANESCO Sub - Station 5TANESCO Head Office 13Roman Catholic Church 12Elly’s Sec School Dr Nchimbi Sec School Bunda Sec School

11
Location
Area Total DPs
Working Public DP
Population Served Per
HH/DP/ Domestic
Total Population
Served A.I.C Hospital 20 Boma Dispensary 10 Bunda T.T.C 720 Afisa Ardhi Bunda. 10 Ujenzi 10 DAS - Bunda. 10 Shule ya Msingi Kabalimu 1500 Mahakama ya Wilaya 0
Ofisi ya Mamlaka ya Mapato (TRA) 8
Guta secondary School 277 Musese Rubairo 6 Kituo cha Walimu Balili 6 Ofisi ya CCM wilaya 0 IMPROVED SPRINGS Mugayangubo Well 500 Nyamakokoto Spring Source 500 Saranga Spring Source 500 Balili I, Balili II, Balili III 1500 COMMERCIAL UKEREWE Kimaro Guest House 15 Serengeti Resort GH 15 Diamond Pub 15 Hongera GH 15 Yankees Hotel 15 MWANZA ROAD High way 15 Covement GH 15 Reza 15 Mkulima 15 CN 15 BY Night 15 Lion Toga 15 Kibo 15 Mount Evarist 15 Pension 15 Cool Abecic Gh 15 Good Hope Gh 15 Roggers Gh 15 96 Gh 15 Y2K 15 Inchage GH 15 Boma Rd Royal 15 Sabasaba Miami 15 Sabasaba Butimbaru Gh 15 Sabasaba Butimbaru 2 Gh 15 Sabasaba Ngombe Gh 15 Sabasaba Mfugaji GH 15

12
Location
Area Total DPs
Working Public DP
Population Served Per
HH/DP/ Domestic
Total Population
Served Sabasaba Mchungaji GH 15 Sabasaba Hagai GH 15 Boma Rd Boma Gh 15 Boma Rd Mtabi Gh 15 Bunda store Village 15 Posta Kamani 15 Posta Kachami 15 Posta Bukenye 15 Posta Nyaitara 15 GRAND TOTAL 18,975 Population to be served 2007 75,899 83,770 Total Coverage =18975/83770 = 17.40 % Water is normally provided by rationing to the consumers and this is exercised four times per week. In case of power interruption then the whole timetable has to be re-scheduled. Average of water produced per month is equivalent to 19,002 m3, which equals to 633.4m 3 per day at Guta intake. Average of water produced per month is equivalent to 13,182.92m3 which equals to 439.4m3 per day at Migungani booster station.
The rest of Bunda population is supplied with water from the existing private non-reliable shallow wells. Nyaruga gravity water source belongs and supplies water to Bunda Teachers Training College only. Water supply at Bunda Town is normally provided by rationing to the consumers and this is exercised four times per week. In case of power interruption then the whole timetable has to be re- scheduled. Work done in this period Two bulk water meters has been installed at Guta pumping station and Migungani Booster station from April 2006 and water pumped daily can now be measured in cubic meter either per day or per month Extension of survey work has been carried out along the existing Nyaruga gravity water supply system in order to establish the possibility of utilizing the excess amount of water that is normally available during rainy season. This can only be achieved after directing the whole amount of water from the source through the existing water storage tank that at present is not utilized.
Other activities carried out are as shown in the bullets below:-
• Extension of pipeline of 3” dia from Police Station to Balili has been rehabilitated. • Installation of submersible pump at Guta intake • Rehabilitation of suction line from the lake to the pump house including rehabilitation of
electrical wiring
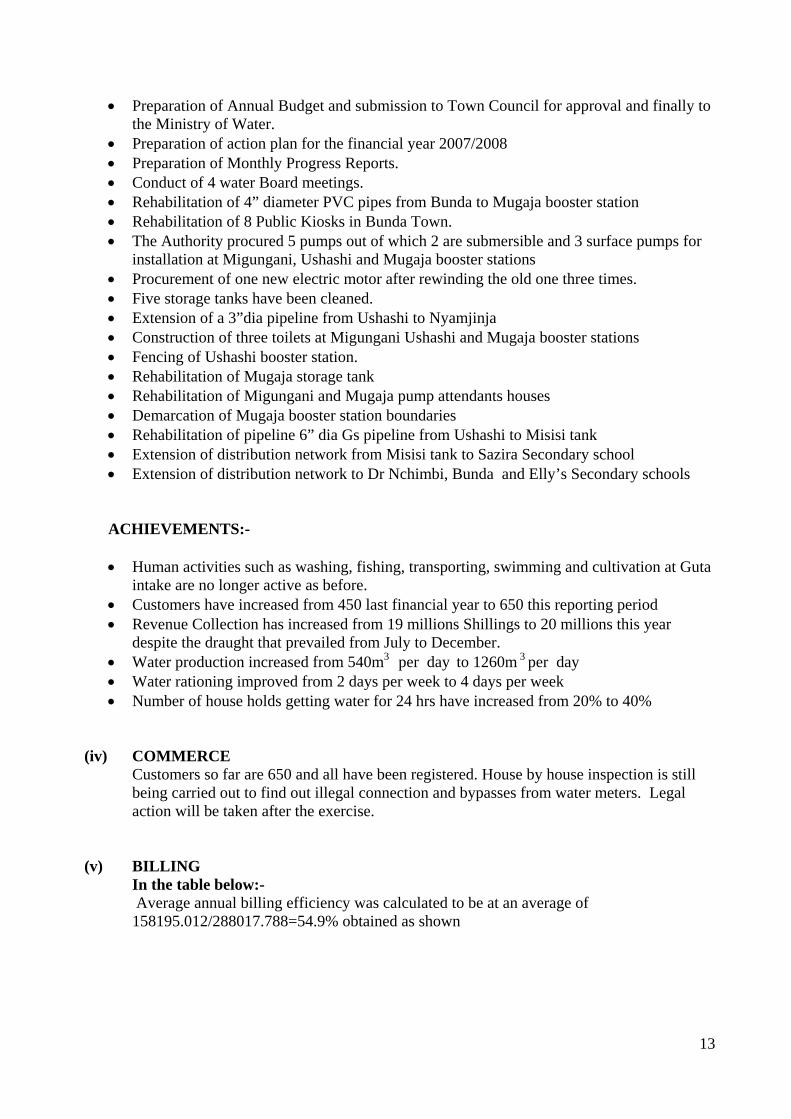
13
• Preparation of Annual Budget and submission to Town Council for approval and finally to the Ministry of Water.
• Preparation of action plan for the financial year 2007/2008 • Preparation of Monthly Progress Reports. • Conduct of 4 water Board meetings. • Rehabilitation of 4” diameter PVC pipes from Bunda to Mugaja booster station • Rehabilitation of 8 Public Kiosks in Bunda Town. • The Authority procured 5 pumps out of which 2 are submersible and 3 surface pumps for
installation at Migungani, Ushashi and Mugaja booster stations • Procurement of one new electric motor after rewinding the old one three times. • Five storage tanks have been cleaned. • Extension of a 3”dia pipeline from Ushashi to Nyamjinja • Construction of three toilets at Migungani Ushashi and Mugaja booster stations • Fencing of Ushashi booster station. • Rehabilitation of Mugaja storage tank • Rehabilitation of Migungani and Mugaja pump attendants houses • Demarcation of Mugaja booster station boundaries • Rehabilitation of pipeline 6” dia Gs pipeline from Ushashi to Misisi tank • Extension of distribution network from Misisi tank to Sazira Secondary school • Extension of distribution network to Dr Nchimbi, Bunda and Elly’s Secondary schools
ACHIEVEMENTS:- • Human activities such as washing, fishing, transporting, swimming and cultivation at Guta
intake are no longer active as before. • Customers have increased from 450 last financial year to 650 this reporting period • Revenue Collection has increased from 19 millions Shillings to 20 millions this year
despite the draught that prevailed from July to December. • Water production increased from 540m3 per day to 1260m 3 per day • Water rationing improved from 2 days per week to 4 days per week • Number of house holds getting water for 24 hrs have increased from 20% to 40%
(iv) COMMERCE Customers so far are 650 and all have been registered. House by house inspection is still being carried out to find out illegal connection and bypasses from water meters. Legal action will be taken after the exercise.
(v) BILLING
In the table below:- Average annual billing efficiency was calculated to be at an average of 158195.012/288017.788=54.9% obtained as shown
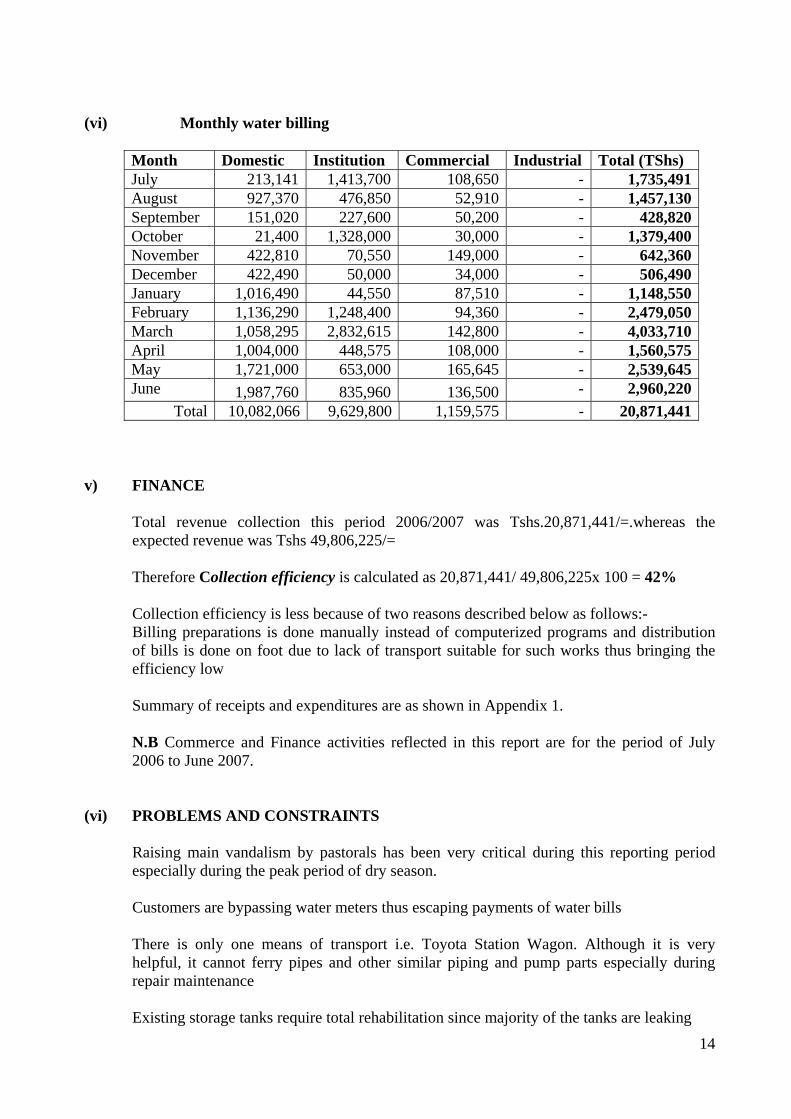
14
(vi) Monthly water billing
Month Domestic Institution Commercial Industrial Total (TShs) July 213,141 1,413,700 108,650 - 1,735,491August 927,370 476,850 52,910 - 1,457,130September 151,020 227,600 50,200 - 428,820October 21,400 1,328,000 30,000 - 1,379,400November 422,810 70,550 149,000 - 642,360December 422,490 50,000 34,000 - 506,490January 1,016,490 44,550 87,510 - 1,148,550February 1,136,290 1,248,400 94,360 - 2,479,050March 1,058,295 2,832,615 142,800 - 4,033,710April 1,004,000 448,575 108,000 - 1,560,575May 1,721,000 653,000 165,645 - 2,539,645June 1,987,760 835,960 136,500 - 2,960,220
Total 10,082,066 9,629,800 1,159,575 - 20,871,441 v) FINANCE
Total revenue collection this period 2006/2007 was Tshs.20,871,441/=.whereas the expected revenue was Tshs 49,806,225/= Therefore Collection efficiency is calculated as 20,871,441/ 49,806,225x 100 = 42% Collection efficiency is less because of two reasons described below as follows:- Billing preparations is done manually instead of computerized programs and distribution of bills is done on foot due to lack of transport suitable for such works thus bringing the efficiency low Summary of receipts and expenditures are as shown in Appendix 1. N.B Commerce and Finance activities reflected in this report are for the period of July 2006 to June 2007.
(vi) PROBLEMS AND CONSTRAINTS
Raising main vandalism by pastorals has been very critical during this reporting period especially during the peak period of dry season. Customers are bypassing water meters thus escaping payments of water bills
There is only one means of transport i.e. Toyota Station Wagon. Although it is very helpful, it cannot ferry pipes and other similar piping and pump parts especially during repair maintenance Existing storage tanks require total rehabilitation since majority of the tanks are leaking

15
i) Water storage tanks surroundings are not secured as some of the pathways
pass very close to the reservoirs thus rendering a big risk of water pollution and vandalism.
ii) Authority owes from different suppliers a debt amounting to 4,000,000/=
Shillings originating from repair and maintenance.
iii) The office lacks adequate working tools for execution of day to day activities such as pipe wrenches, pipe cutters etc.
(vii) RECOMMENDATIONS/PROPOSED SOLUTIONS
• The authority propose to improve the production by adding to existing system the surplus amount of water that originates from Bunda Teachers Training College water system (Nyaruga gravity water supply. Survey drawings are complete the authority is requesting fund’s support from the Ministry of Water to effect the implementation once the design proves positive.
• Repair of starter switch at Guta pump house and installation of the second pump unit at
Migungani booster station. This will enable the second standby pump at Guta to operate and thus allowing 24 hours pumping instead of the 18 hours exercised in the past.
• Lack of reliable transport has decreased to a great extent distribution of bills and collection
of revenues. The authority intends to procure a motorcycle if funds are available that will ease the above duties and improve collection efficiency.
• Most of the leakages that had been caused by trench digging have been attended and a total
of 160 customers who had been disconnected are now been reconnected after replacement assurance from DED.
• About 50% of the customers who are not equipped with water meters should be provided
with water meters once funds are available, in order to minimize the unaccounted for water and misuse.
• TANESCO Bills that are not cleared up to June 2006 should be cleared up. Funds to foot
these bills from DED should be processed early at the beginning of this financial year.

16
2.0 PERFORMANCE INDICATORS (A) GENERAL INDICATORS (i) Supply and Demand
a) Actual water demand per month is equal to 3898m3/day x 30 x 12= 1,403,280 m3/year
b) Calculated Quantity of Water produced 1260 m3/day x 30 x 12=453,600m3/year Actual Quantity of water produced 228,017.788 m3/year.
Water losses according to available data is 168,385.098 m3/year per year which is equal to
73.8%. Actual quantity of water utilized = 59,632.69 m3/year Supply-demand ratio is 32.3% (ii) Production from various sources (in m3 ). (iii) Billed Water Quantity of actual billable water could not be ascertained exactly because not all customers are provided with water meters for water measurement. But the estimated figures indicate that billed water amounts to 158,195m 3 (iv) Quality of water produced Efforts are being made to ensure that the quality of water is improved. Currently the water color is greenish and smelly caused by Algae at Guta intake. This is so experienced because Rubana River discharges its water into Lake Victoria close to the water intake and this river, collects all of its water from the Serengeti National Park. The determined quality of water is as shown in Appendix IV. (v) Quantity of chemicals consumed
Table 4 Chemicals Coagulants Coagulants Chlorine
Gas Hypochlorites Total in Kg
Quantity (Kg/lt)
0 0 0 0.0023g/lt 360
Total Cost (T. Shs)
0 0 0 2500/kg 900,000/=
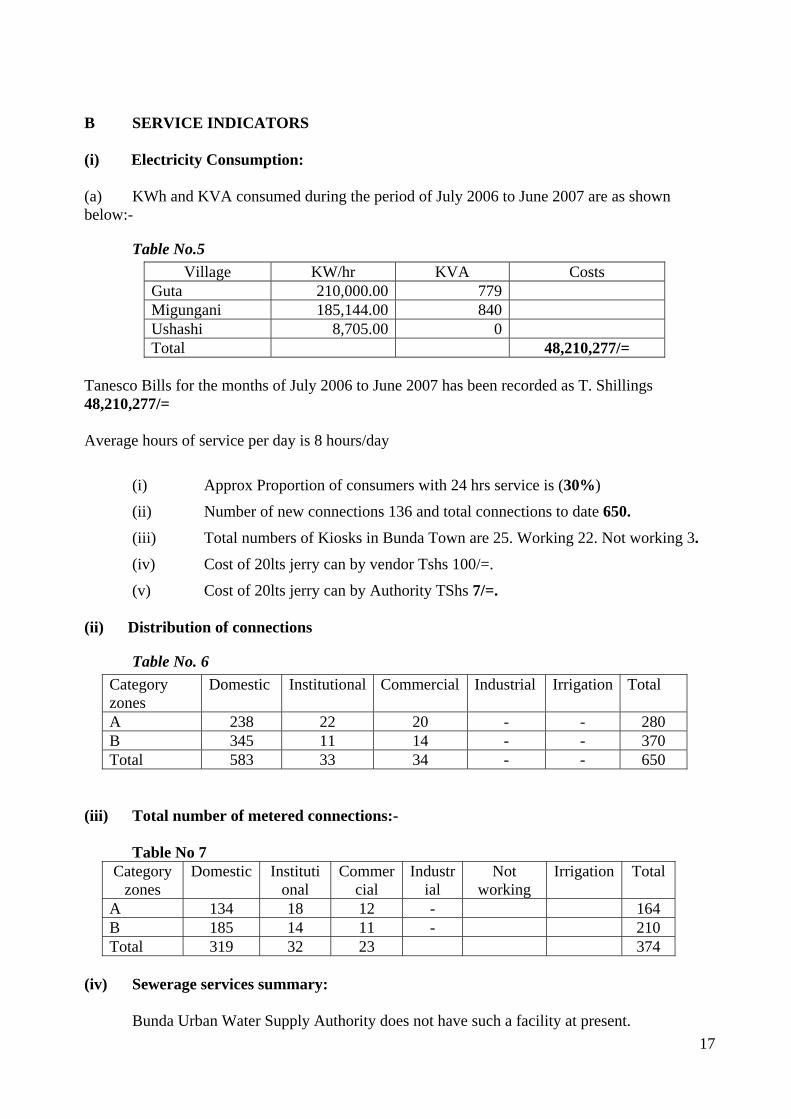
17
B SERVICE INDICATORS (i) Electricity Consumption: (a) KWh and KVA consumed during the period of July 2006 to June 2007 are as shown below:-
Table No.5 Village KW/hr KVA Costs
Guta 210,000.00 779Migungani 185,144.00 840Ushashi 8,705.00 0Total 48,210,277/=
Tanesco Bills for the months of July 2006 to June 2007 has been recorded as T. Shillings 48,210,277/=
Average hours of service per day is 8 hours/day
(i) Approx Proportion of consumers with 24 hrs service is (30%)
(ii) Number of new connections 136 and total connections to date 650.
(iii) Total numbers of Kiosks in Bunda Town are 25. Working 22. Not working 3.
(iv) Cost of 20lts jerry can by vendor Tshs 100/=.
(v) Cost of 20lts jerry can by Authority TShs 7/=. (ii) Distribution of connections
Table No. 6 Category zones
Domestic Institutional Commercial Industrial Irrigation Total
A 238 22 20 - - 280 B 345 11 14 - - 370 Total 583 33 34 - - 650
(iii) Total number of metered connections:-
Table No 7 Category
zones Domestic Instituti
onal Commer
cial Industr
ial Not
working Irrigation Total
A 134 18 12 - 164 B 185 14 11 - 210 Total 319 32 23 374
(iv) Sewerage services summary:
Bunda Urban Water Supply Authority does not have such a facility at present.
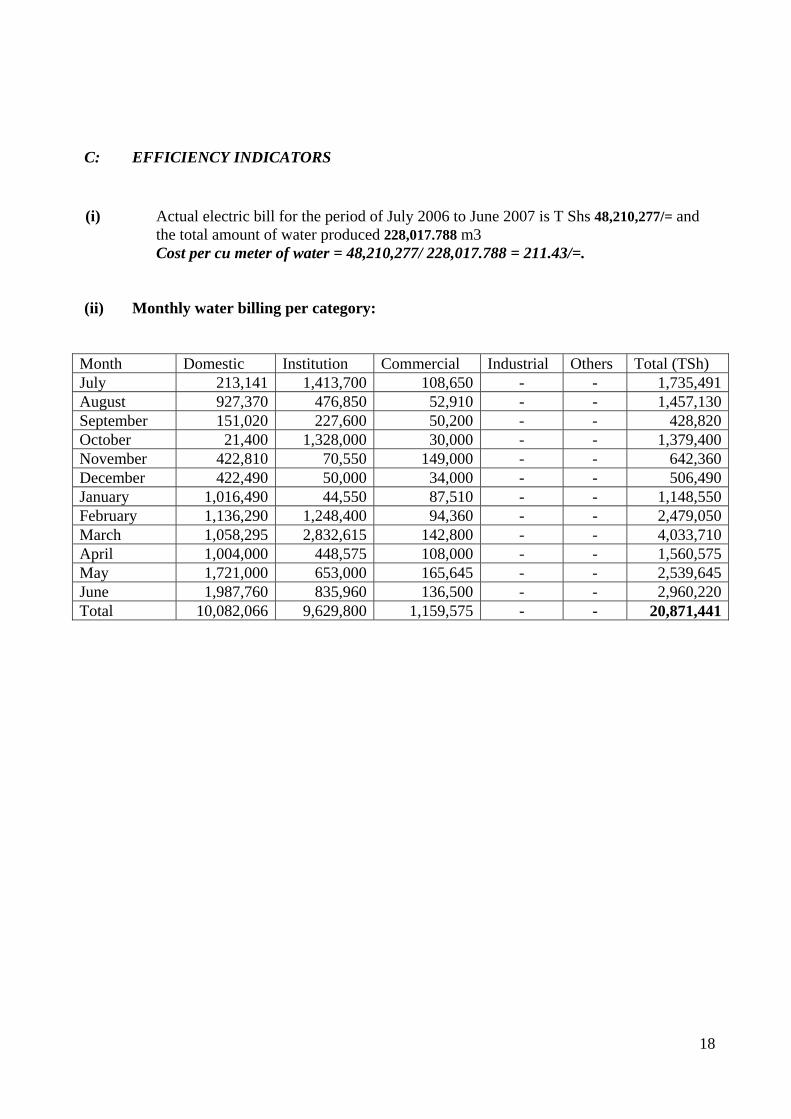
18
C: EFFICIENCY INDICATORS
(i) Actual electric bill for the period of July 2006 to June 2007 is T Shs 48,210,277/= and the total amount of water produced 228,017.788 m3 Cost per cu meter of water = 48,210,277/ 228,017.788 = 211.43/=.
(ii) Monthly water billing per category:
Month Domestic Institution Commercial Industrial Others Total (TSh) July 213,141 1,413,700 108,650 - - 1,735,491August 927,370 476,850 52,910 - - 1,457,130September 151,020 227,600 50,200 - - 428,820October 21,400 1,328,000 30,000 - - 1,379,400November 422,810 70,550 149,000 - - 642,360December 422,490 50,000 34,000 - - 506,490January 1,016,490 44,550 87,510 - - 1,148,550February 1,136,290 1,248,400 94,360 - - 2,479,050March 1,058,295 2,832,615 142,800 - - 4,033,710April 1,004,000 448,575 108,000 - - 1,560,575May 1,721,000 653,000 165,645 - - 2,539,645June 1,987,760 835,960 136,500 - - 2,960,220Total 10,082,066 9,629,800 1,159,575 - - 20,871,441
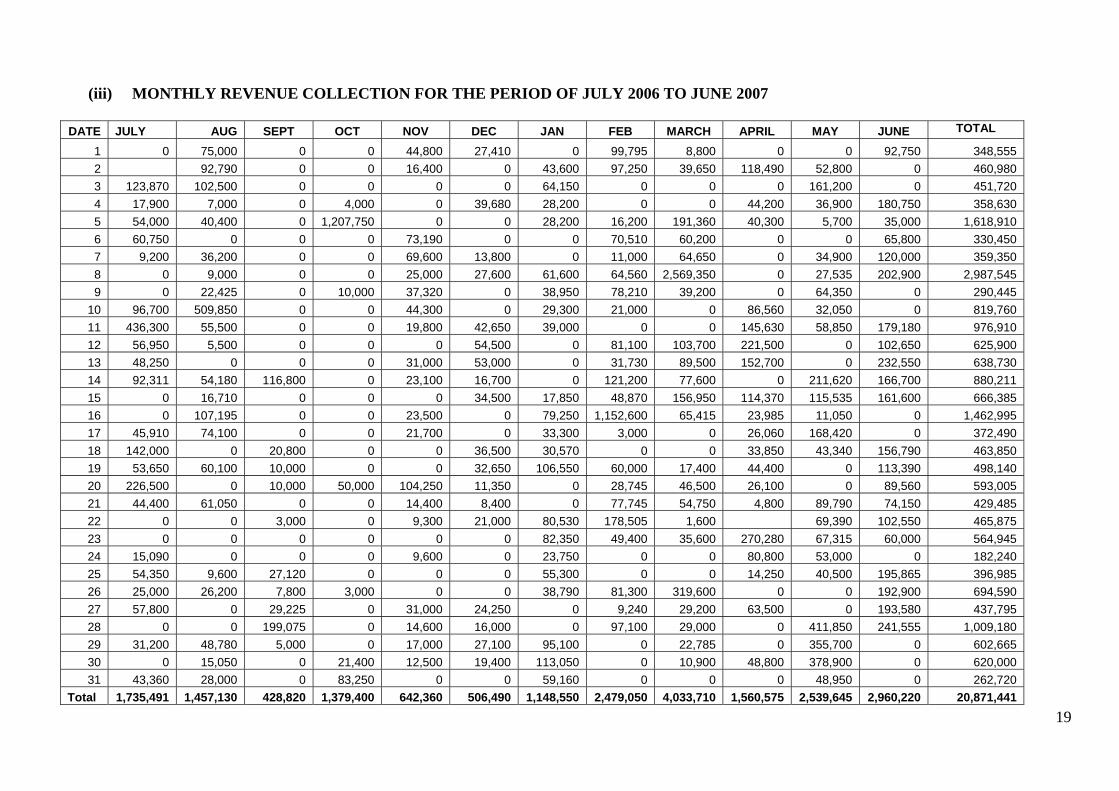
19
(iii) MONTHLY REVENUE COLLECTION FOR THE PERIOD OF JULY 2006 TO JUNE 2007
DATE JULY AUG SEPT OCT NOV DEC JAN FEB MARCH APRIL MAY JUNE TOTAL
1 0 75,000 0 0 44,800 27,410 0 99,795 8,800 0 0 92,750 348,5552 92,790 0 0 16,400 0 43,600 97,250 39,650 118,490 52,800 0 460,9803 123,870 102,500 0 0 0 0 64,150 0 0 0 161,200 0 451,7204 17,900 7,000 0 4,000 0 39,680 28,200 0 0 44,200 36,900 180,750 358,6305 54,000 40,400 0 1,207,750 0 0 28,200 16,200 191,360 40,300 5,700 35,000 1,618,9106 60,750 0 0 0 73,190 0 0 70,510 60,200 0 0 65,800 330,4507 9,200 36,200 0 0 69,600 13,800 0 11,000 64,650 0 34,900 120,000 359,3508 0 9,000 0 0 25,000 27,600 61,600 64,560 2,569,350 0 27,535 202,900 2,987,5459 0 22,425 0 10,000 37,320 0 38,950 78,210 39,200 0 64,350 0 290,445
10 96,700 509,850 0 0 44,300 0 29,300 21,000 0 86,560 32,050 0 819,76011 436,300 55,500 0 0 19,800 42,650 39,000 0 0 145,630 58,850 179,180 976,91012 56,950 5,500 0 0 0 54,500 0 81,100 103,700 221,500 0 102,650 625,90013 48,250 0 0 0 31,000 53,000 0 31,730 89,500 152,700 0 232,550 638,73014 92,311 54,180 116,800 0 23,100 16,700 0 121,200 77,600 0 211,620 166,700 880,21115 0 16,710 0 0 0 34,500 17,850 48,870 156,950 114,370 115,535 161,600 666,38516 0 107,195 0 0 23,500 0 79,250 1,152,600 65,415 23,985 11,050 0 1,462,99517 45,910 74,100 0 0 21,700 0 33,300 3,000 0 26,060 168,420 0 372,49018 142,000 0 20,800 0 0 36,500 30,570 0 0 33,850 43,340 156,790 463,85019 53,650 60,100 10,000 0 0 32,650 106,550 60,000 17,400 44,400 0 113,390 498,14020 226,500 0 10,000 50,000 104,250 11,350 0 28,745 46,500 26,100 0 89,560 593,00521 44,400 61,050 0 0 14,400 8,400 0 77,745 54,750 4,800 89,790 74,150 429,48522 0 0 3,000 0 9,300 21,000 80,530 178,505 1,600 69,390 102,550 465,87523 0 0 0 0 0 0 82,350 49,400 35,600 270,280 67,315 60,000 564,94524 15,090 0 0 0 9,600 0 23,750 0 0 80,800 53,000 0 182,24025 54,350 9,600 27,120 0 0 0 55,300 0 0 14,250 40,500 195,865 396,98526 25,000 26,200 7,800 3,000 0 0 38,790 81,300 319,600 0 0 192,900 694,59027 57,800 0 29,225 0 31,000 24,250 0 9,240 29,200 63,500 0 193,580 437,79528 0 0 199,075 0 14,600 16,000 0 97,100 29,000 0 411,850 241,555 1,009,18029 31,200 48,780 5,000 0 17,000 27,100 95,100 0 22,785 0 355,700 0 602,66530 0 15,050 0 21,400 12,500 19,400 113,050 0 10,900 48,800 378,900 0 620,00031 43,360 28,000 0 83,250 0 0 59,160 0 0 0 48,950 0 262,720
Total 1,735,491 1,457,130 428,820 1,379,400 642,360 506,490 1,148,550 2,479,050 4,033,710 1,560,575 2,539,645 2,960,220 20,871,441
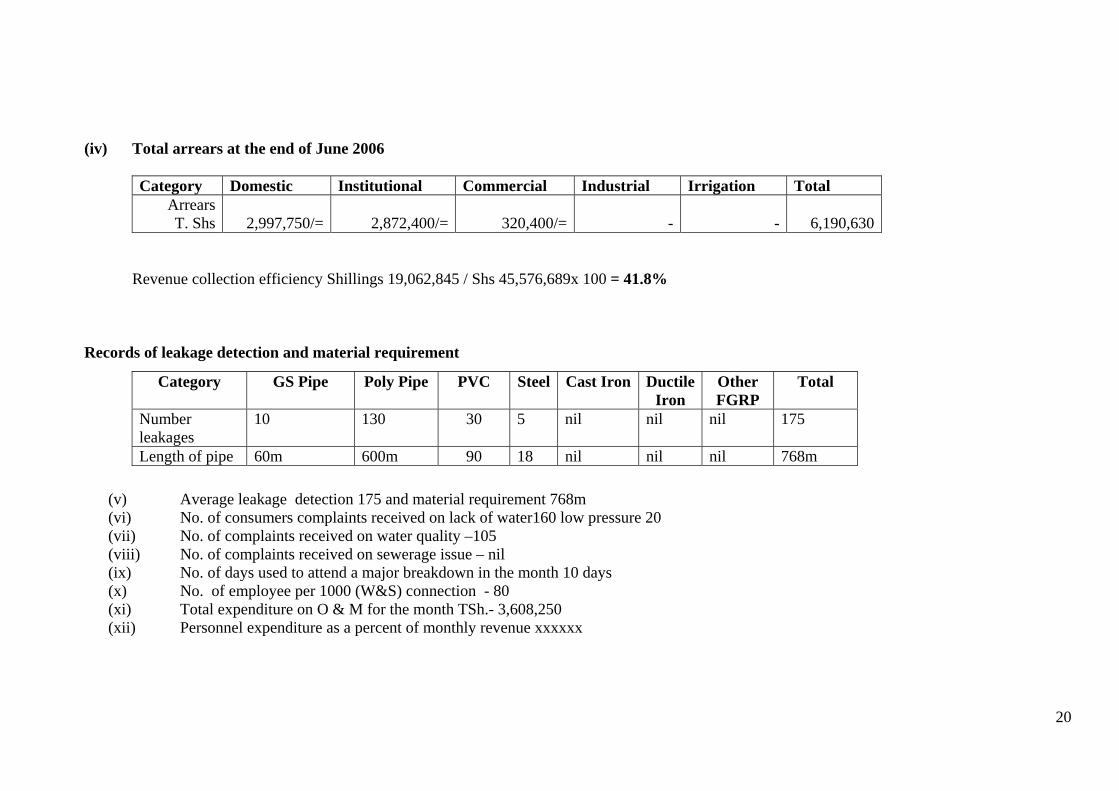
(iv) Total arrears at the end of June 2006
20
Category Domestic Institutional Commercial Industrial Irrigation TotalArrears T. Shs
2,997,750/=
2,872,400/=
320,400/= - - 6,190,630
Revenue collection efficiency Shillings 19,062,845 / Shs 45,576,689x 100 = 41.8% Records of leakage detection and material requirement
Category GS Pipe Poly Pipe PVC Steel Cast Iron Ductile Iron
Other FGRP
Total
Number leakages
10 130 30 5 nil nil nil 175
Length of pipe 60m 600m 90 18 nil nil nil 768m
(v) Average leakage detection 175 and material requirement 768m (vi) No. of consumers complaints received on lack of water160 low pressure 20 (vii) No. of complaints received on water quality –105 (viii) No. of complaints received on sewerage issue – nil (ix) No. of days used to attend a major breakdown in the month 10 days (x) No. of employee per 1000 (W&S) connection - 80 (xi) Total expenditure on O & M for the month TSh.- 3,608,250 (xii) Personnel expenditure as a percent of monthly revenue xxxxxx
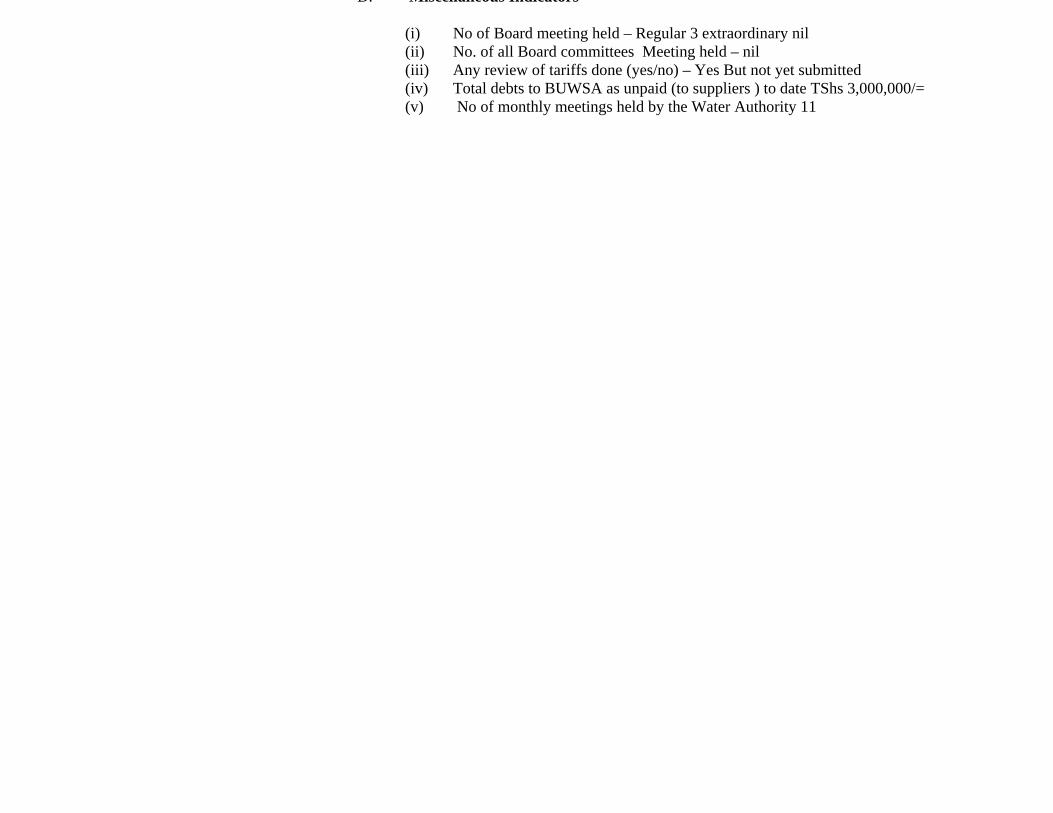
D. Miscellaneous Indicators
(i) No of Board meeting held – Regular 3 extraordinary nil (ii) No. of all Board committees Meeting held – nil (iii) Any review of tariffs done (yes/no) – Yes But not yet submitted (iv) Total debts to BUWSA as unpaid (to suppliers ) to date TShs 3,000,000/= (v) No of monthly meetings held by the Water Authority 11
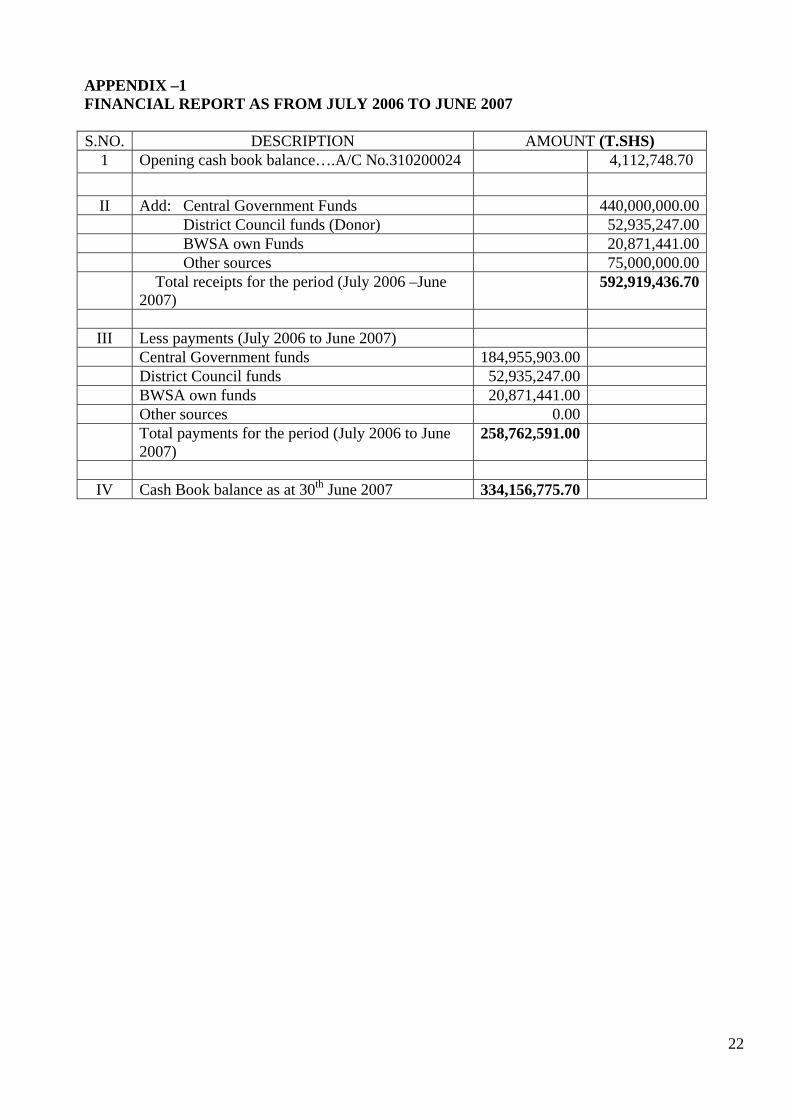
22
APPENDIX –1 FINANCIAL REPORT AS FROM JULY 2006 TO JUNE 2007 S.NO. DESCRIPTION AMOUNT (T.SHS)
1 Opening cash book balance….A/C No.310200024 4,112,748.70
II Add: Central Government Funds 440,000,000.00 District Council funds (Donor) 52,935,247.00 BWSA own Funds 20,871,441.00 Other sources 75,000,000.00 Total receipts for the period (July 2006 –June
2007) 592,919,436.70
III Less payments (July 2006 to June 2007)
Central Government funds 184,955,903.00 District Council funds 52,935,247.00 BWSA own funds 20,871,441.00 Other sources 0.00 Total payments for the period (July 2006 to June
2007) 258,762,591.00
IV Cash Book balance as at 30th June 2007 334,156,775.70
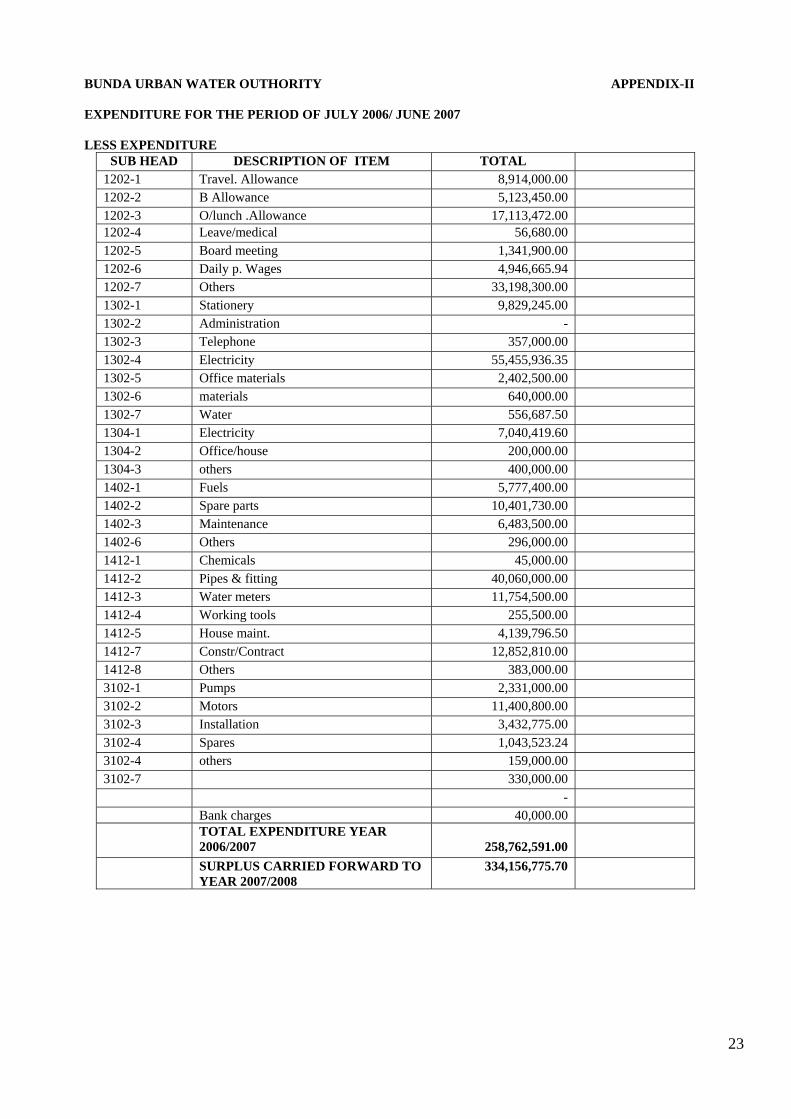
23
BUNDA URBAN WATER OUTHORITY APPENDIX-II
EXPENDITURE FOR THE PERIOD OF JULY 2006/ JUNE 2007 LESS EXPENDITURE
SUB HEAD DESCRIPTION OF ITEM TOTAL 1202-1 Travel. Allowance 8,914,000.00 1202-2 B Allowance 5,123,450.00 1202-3 O/lunch .Allowance 17,113,472.00 1202-4 Leave/medical 56,680.00 1202-5 Board meeting 1,341,900.00 1202-6 Daily p. Wages 4,946,665.94 1202-7 Others 33,198,300.00 1302-1 Stationery 9,829,245.00 1302-2 Administration - 1302-3 Telephone 357,000.00 1302-4 Electricity 55,455,936.35 1302-5 Office materials 2,402,500.00 1302-6 materials 640,000.00 1302-7 Water 556,687.50 1304-1 Electricity 7,040,419.60 1304-2 Office/house 200,000.00 1304-3 others 400,000.00 1402-1 Fuels 5,777,400.00 1402-2 Spare parts 10,401,730.00 1402-3 Maintenance 6,483,500.00 1402-6 Others 296,000.00 1412-1 Chemicals 45,000.00 1412-2 Pipes & fitting 40,060,000.00 1412-3 Water meters 11,754,500.00 1412-4 Working tools 255,500.00 1412-5 House maint. 4,139,796.50 1412-7 Constr/Contract 12,852,810.00 1412-8 Others 383,000.00 3102-1 Pumps 2,331,000.00 3102-2 Motors 11,400,800.00 3102-3 Installation 3,432,775.00 3102-4 Spares 1,043,523.24 3102-4 others 159,000.00 3102-7 330,000.00
- Bank charges 40,000.00
TOTAL EXPENDITURE YEAR 2006/2007
258,762,591.00
SURPLUS CARRIED FORWARD TO YEAR 2007/2008
334,156,775.70

YEAR 2006-2007
35,000.00
Apr May June 0.00
5,000.00
10,000.00
15,000.00
20,000.00
25,000.00
30,000.00
July Aug Sept Oct Nov Dec Jan Feb Mar
MONTHLY WATER PRODUCTION
QU
AN
TITY
OF
WA
TER
IN
CU
BIC
MET
ERS
Guta Migungani
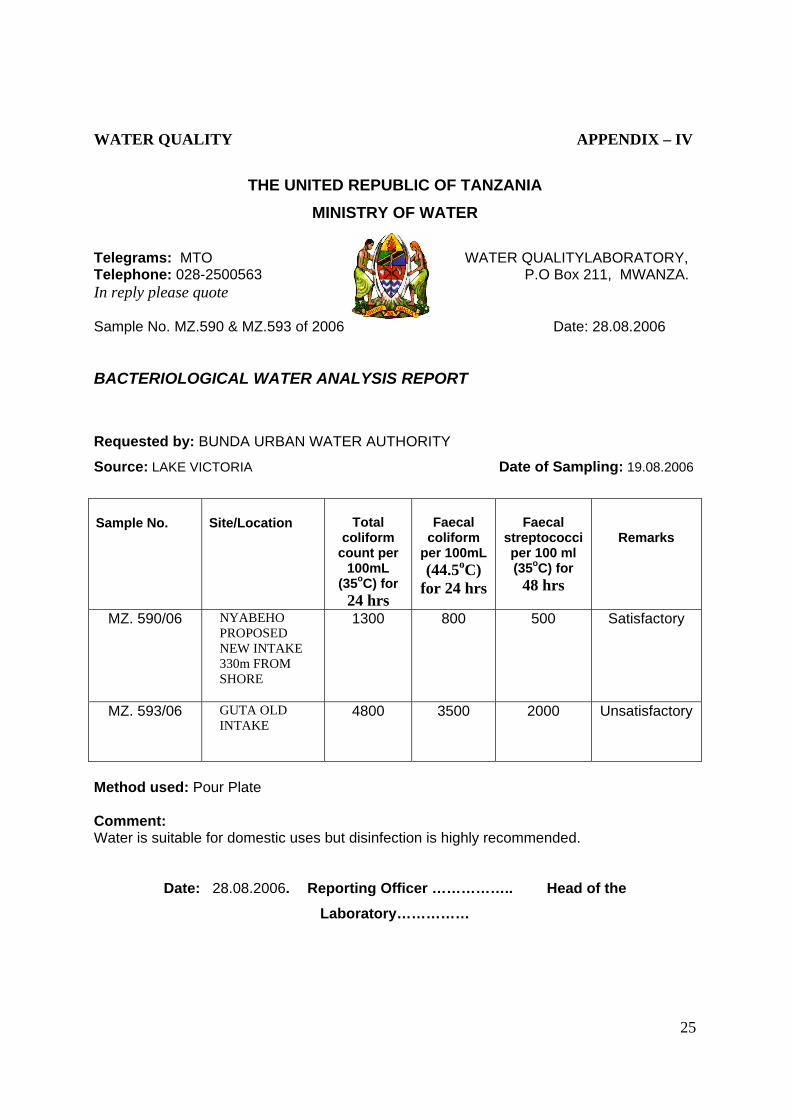
WATER QUALITY APPENDIX – IV
THE UNITED REPUBLIC OF TANZANIA
MINISTRY OF WATER
Telegrams: MTO WATER QUALITYLABORATORY, Telephone: 028-2500563 P.O Box 211, MWANZA. In reply please quote Sample No. MZ.590 & MZ.593 of 2006 Date: 28.08.2006
BACTERIOLOGICAL WATER ANALYSIS REPORT
Requested by: BUNDA URBAN WATER AUTHORITY
Source: LAKE VICTORIA Date of Sampling: 19.08.2006
Sample No. Site/Location
Total
coliform count per
100mL (35oC) for
24 hrs
Faecal
coliform per 100mL (44.5oC)
for 24 hrs
Faecal
streptococci per 100 ml (35oC) for
48 hrs
Remarks
MZ. 590/06 NYABEHO PROPOSED NEW INTAKE 330m FROM SHORE
1300 800 500 Satisfactory
MZ. 593/06 GUTA OLD INTAKE
4800 3500 2000 Unsatisfactory
Method used: Pour Plate Comment: Water is suitable for domestic uses but disinfection is highly recommended.
Date: 28.08.2006. Reporting Officer …………….. Head of the
Laboratory……………
25
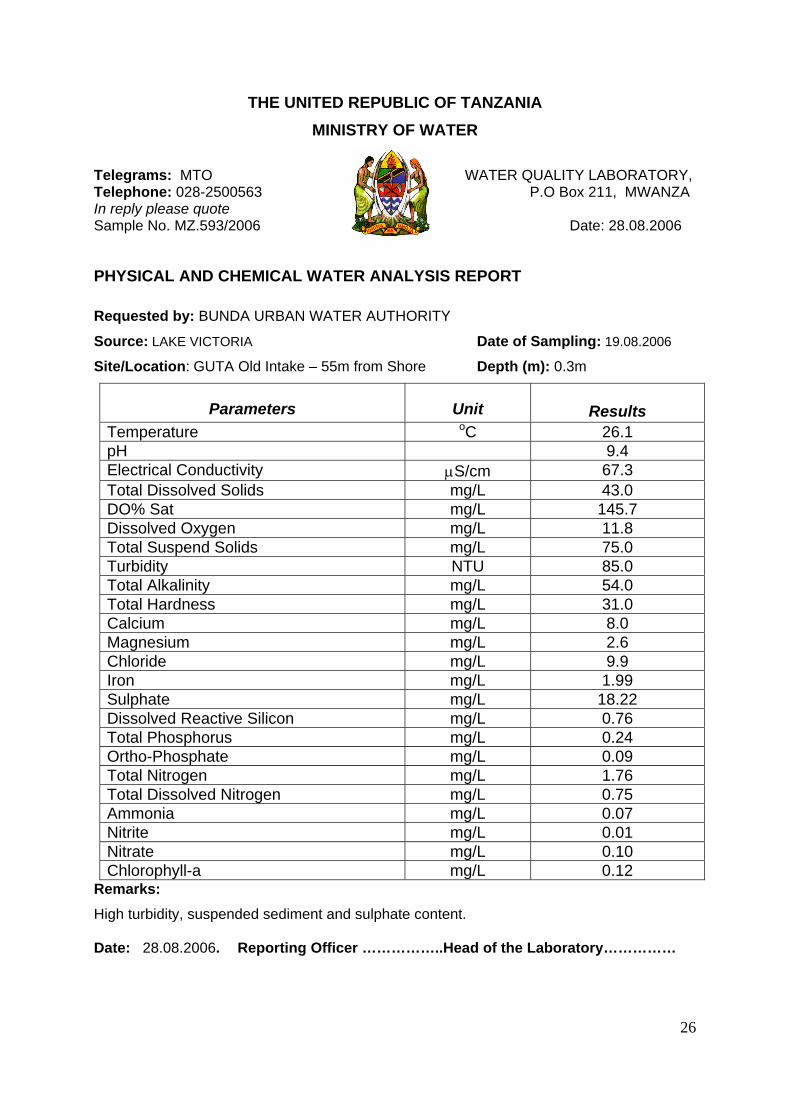
THE UNITED REPUBLIC OF TANZANIA MINISTRY OF WATER
Telegrams: MTO WATER QUALITY LABORATORY, Telephone: 028-2500563 P.O Box 211, MWANZA In reply please quote Sample No. MZ.593/2006 Date: 28.08.2006
PHYSICAL AND CHEMICAL WATER ANALYSIS REPORT Requested by: BUNDA URBAN WATER AUTHORITY
Source: LAKE VICTORIA Date of Sampling: 19.08.2006
Site/Location: GUTA Old Intake – 55m from Shore Depth (m): 0.3m
Parameters Unit
Results Temperature oC 26.1 pH 9.4 Electrical Conductivity µS/cm 67.3 Total Dissolved Solids mg/L 43.0 DO% Sat mg/L 145.7 Dissolved Oxygen mg/L 11.8 Total Suspend Solids mg/L 75.0 Turbidity NTU 85.0 Total Alkalinity mg/L 54.0 Total Hardness mg/L 31.0 Calcium mg/L 8.0 Magnesium mg/L 2.6 Chloride mg/L 9.9 Iron mg/L 1.99 Sulphate mg/L 18.22 Dissolved Reactive Silicon mg/L 0.76 Total Phosphorus mg/L 0.24 Ortho-Phosphate mg/L 0.09 Total Nitrogen mg/L 1.76 Total Dissolved Nitrogen mg/L 0.75 Ammonia mg/L 0.07 Nitrite mg/L 0.01 Nitrate mg/L 0.10 Chlorophyll-a mg/L 0.12
Remarks: High turbidity, suspended sediment and sulphate content. Date: 28.08.2006. Reporting Officer ……………..Head of the Laboratory……………
26
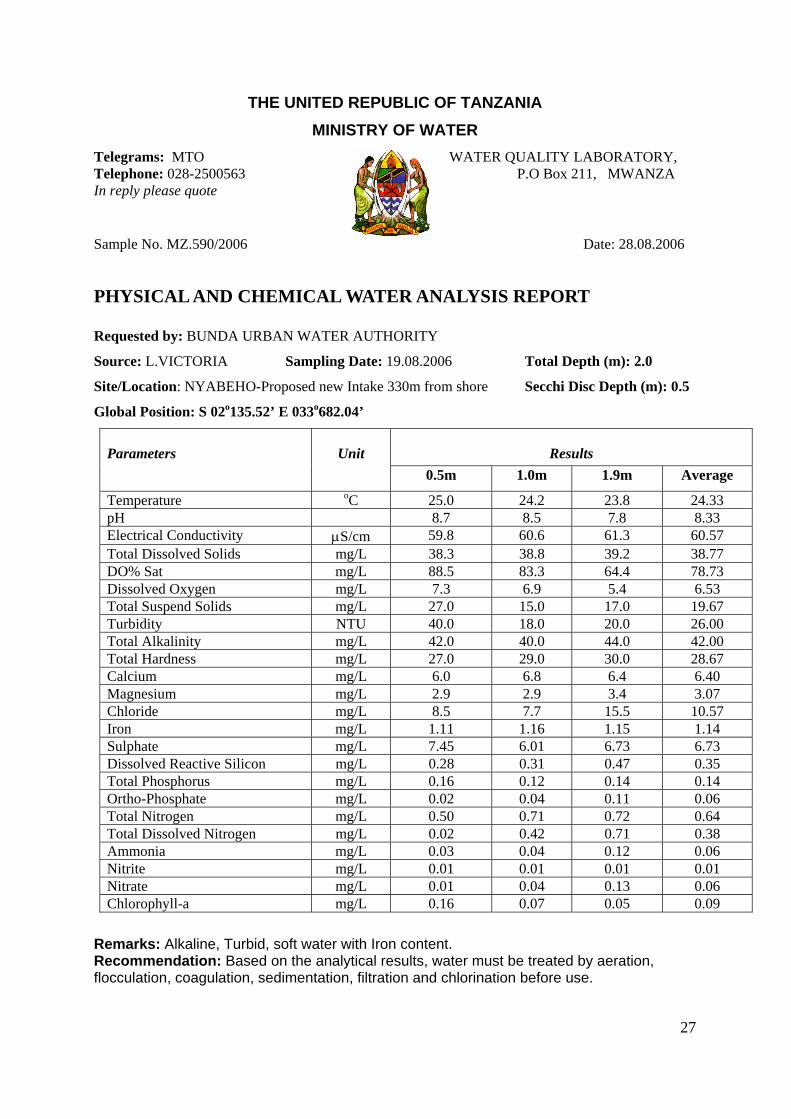
THE UNITED REPUBLIC OF TANZANIA MINISTRY OF WATER
Telegrams: MTO WATER QUALITY LABORATORY, Telephone: 028-2500563 P.O Box 211, MWANZA In reply please quote
Sample No. MZ.590/2006 Date: 28.08.2006
PHYSICAL AND CHEMICAL WATER ANALYSIS REPORT Requested by: BUNDA URBAN WATER AUTHORITY
Source: L.VICTORIA Sampling Date: 19.08.2006 Total Depth (m): 2.0
Site/Location: NYABEHO-Proposed new Intake 330m from shore Secchi Disc Depth (m): 0.5
Global Position: S 02o135.52’ E 033o682.04’
Results Parameters Unit 0.5m 1.0m 1.9m Average
Temperature oC 25.0 24.2 23.8 24.33 pH 8.7 8.5 7.8 8.33 Electrical Conductivity µS/cm 59.8 60.6 61.3 60.57 Total Dissolved Solids mg/L 38.3 38.8 39.2 38.77 DO% Sat mg/L 88.5 83.3 64.4 78.73 Dissolved Oxygen mg/L 7.3 6.9 5.4 6.53 Total Suspend Solids mg/L 27.0 15.0 17.0 19.67 Turbidity NTU 40.0 18.0 20.0 26.00 Total Alkalinity mg/L 42.0 40.0 44.0 42.00 Total Hardness mg/L 27.0 29.0 30.0 28.67 Calcium mg/L 6.0 6.8 6.4 6.40 Magnesium mg/L 2.9 2.9 3.4 3.07 Chloride mg/L 8.5 7.7 15.5 10.57 Iron mg/L 1.11 1.16 1.15 1.14 Sulphate mg/L 7.45 6.01 6.73 6.73 Dissolved Reactive Silicon mg/L 0.28 0.31 0.47 0.35 Total Phosphorus mg/L 0.16 0.12 0.14 0.14 Ortho-Phosphate mg/L 0.02 0.04 0.11 0.06 Total Nitrogen mg/L 0.50 0.71 0.72 0.64 Total Dissolved Nitrogen mg/L 0.02 0.42 0.71 0.38 Ammonia mg/L 0.03 0.04 0.12 0.06 Nitrite mg/L 0.01 0.01 0.01 0.01 Nitrate mg/L 0.01 0.04 0.13 0.06 Chlorophyll-a mg/L 0.16 0.07 0.05 0.09
Remarks: Alkaline, Turbid, soft water with Iron content. Recommendation: Based on the analytical results, water must be treated by aeration, flocculation, coagulation, sedimentation, filtration and chlorination before use.
27
ANNEX 5
Testing Microbiological Quality
of some Water Sources in Bunda

Testing the Microbiological Quality of the Water
On 28th October samples were collected from a number of shallow wells and springs. The results were as follows:
Location Results Colilert
a) Kabusuli s/w High coliform, some E-coli
b) Mukerewe s/w Moderate Coliform, some E-coli
c) Saranga spring Lot of coliform, No E-coli
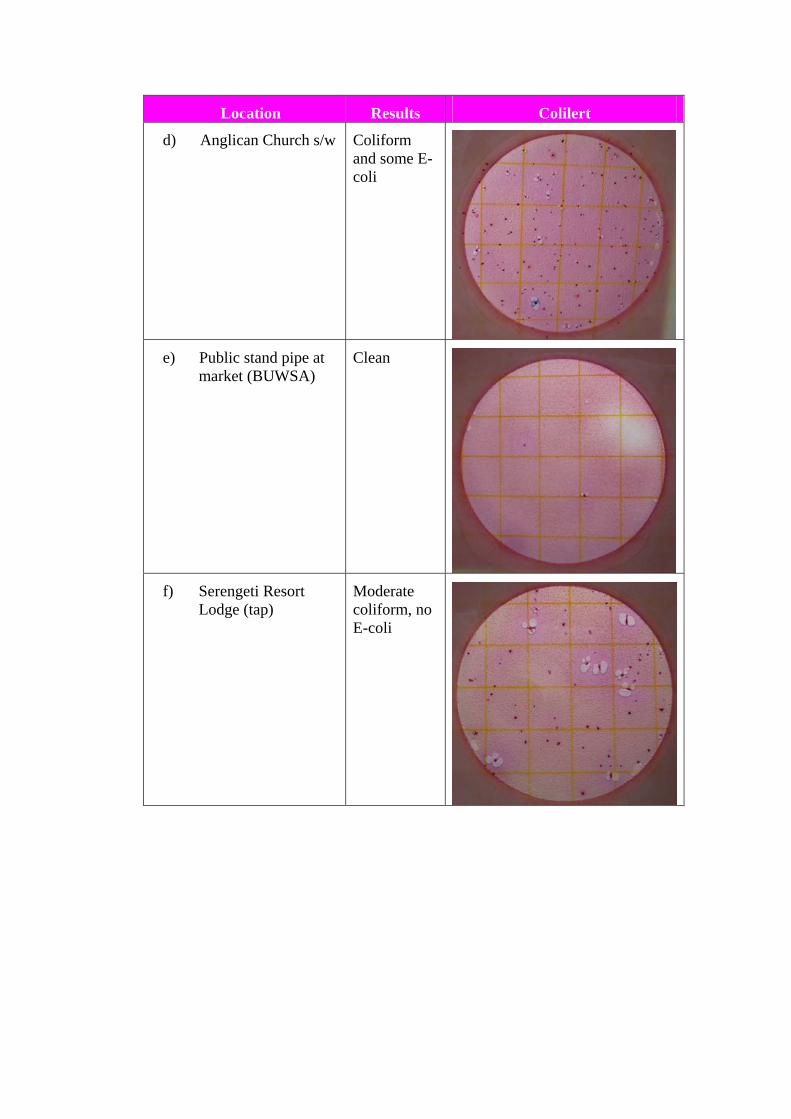
Location Results Colilert
d) Anglican Church s/w Coliform and some E-coli
e) Public stand pipe at market (BUWSA)
Clean
f) Serengeti Resort Lodge (tap)
Moderate coliform, no E-coli